
* Corresponding author. International Fire Safety Consultant, 9 Lakis Close, Flast Walk, Hampstead,
London NW3 1JX, UK. Tel.: #44-20-7431-5372; fax: #44-20-7431-5374.
E-mail address: gcooke@joinnet.uk.com (G.M.E. Cooke).
Fire Safety Journal 36 (2001) 459}475
Behaviour of precast concrete #oor slabs exposed
to standardised "res
Gordon M.E. Cooke*
Visiting Professor, Department of Civil Engineering, City University, London, UK
Received 2 February 2000; received in revised form 24 October 2000; accepted 10 January 2001
Abstract
This paper quanti"es the thermal movements of 14 simply supported precast reinforced
concrete #oor slabs of 4.5 m span and 900 mm width exposed to two standardised heating
regimes used in "re resistance furnace tests. The tests were designed to show the e!ect of varying
the slab thickness, type of concrete, imposed load, so$t protection and nature of "re exposure
on the mid-span #exural de#ection and axial movements of the slab ends. Measured de#ections
showed that during the 90 min design period of "re resistance thermal bowing was dominant
and the e!ect of the 1.5 kN/m
design imposed load was small. The NPD hydrocarbon
"re
exposure caused a doubling of the #exural de#ections achieved using the standard BS 476: Part
8 (now Part 20) "re exposure in the "rst 20 min of exposure.
2001 Elsevier Science Ltd. All
rights reserved.
Keywords: Floor slabs; Concrete; Standard "re tests; Thermal response; Structural response
1. Introduction
As part of the Building Research Establishment (BRE) Large Panel Structures
research programme, the Fire Research Station (FRS) undertook a full scale natural
"re test in the Ronan Point high rise block of #ats in 1984. The test was terminated
because the "re exposed 4 m long #oor slab spanning onto the external wall exhibited
an unexpected high rate of increase in the mid-span de#ection after only 12 min from
ignition. There was concern that, with further heating, the associated axial expansion
0379-7112/01/$ - see front matter
2001 Elsevier Science Ltd. All rights reserved.
PII: S 0 3 7 9 - 7 1 1 2 ( 0 1 ) 0 0 0 0 5 - 4

of the precast slab could push out the load bearing external wall panels at the
wall/#oor junction causing an eccentric loading condition for the load-bearing ex-
ternal wall panels which might precipitate a &pack of cards' type of progressive
collapse. A search of the literature revealed a paucity of experimental data on axial
de#ections of concrete slabs exposed to "re: while many hundreds of standard "re
resistance tests have been made on #oors there has never been a requirement to
measure axial de#ections and such information was therefore very rare and unpub-
lished.
The interdependence of thermal bowing, axial de#ection and axial restraint was
unclear. It was therefore decided to proceed with a two-part programme of "re tests.
The "rst part, reported herein, would examine the "re behaviour of axially unre-
strained, simply supported, precast concrete #oor slabs. The second part would
examine the e!ect of partial axial restraint on narrow strips of #oor construction. For
the "rst part of the programme, the author, then working at FRS, proposed, designed
and supervised seven "re tests on pairs of precast concrete slabs each nominally 4.7 m
long
;900 mm wide. Six pairs were prepared by the BRE Civil Engineering Laborat-
ory, Cardington. One pair was cut from a large #oor panel taken from the Ronan
point #ats during demolition. The tests were made in a standard "re resistance #oor
test furnace and were designed to determine the unrestrained mid-span de#ection and
axial de#ections of the slab ends at mid depth. The nature of the axial de#ections
measured as time progressed is shown in Figs. 1(b) and (c).
It was assumed that the bowing behaviour of a large #oor panel which spans in one
direction will be similar to the behaviour of a narrower specimen if edge e!ects are
guarded against so that unidirectional heat #ow was achieved in the narrower
specimen. This assumption allowed two specimens to be tested side by side in the #oor
furnace, unrestrained by each other, in the simply supported condition with a span of
4.5 m. This also meant that the specimens could be easily manufactured, handled and
transported, and the cost of "re testing was reduced by more than 50%.
Precast #oor slabs of the kind tested are not used in modern #oor construction in
multi-storey buildings in UK which typically comprise hollow core prestressed
concrete planks with in situ topping or composite pro"led sheet steel/concrete #oor
decks. In addition, the tested #oor slabs were simply supported which results in
maximum #exural defection representing the worst case scenario in which bene"cial
rotational restraint generated by slab continuity over beams in multi-span #oors is
ignored. Nonetheless, the results have practical application to existing large panel
precast #oor construction which has little continuity at the supports and to new
single-span conventional in situ reinforced concrete construction. The data can also
be used to predict #exural de#ections of reinforced concrete #oor slabs having
rotational restraint but this requires an assessment of the positions of contra-#exure in
the #oor slab and any mitigating e!ect of membrane action arising from two-way
spanning, but this is beyond the scope of this paper. The test results are perhaps most
useful for enabling both qualitative and quantitative comparisons to be made while
changing important parameters such as the type of concrete and "re test severity.
Some of these test results have been presented by Cooke and Morgan in a BRE
Information Paper [1].
460
G.M.E. Cooke / Fire Safety Journal 36 (2001) 459}475
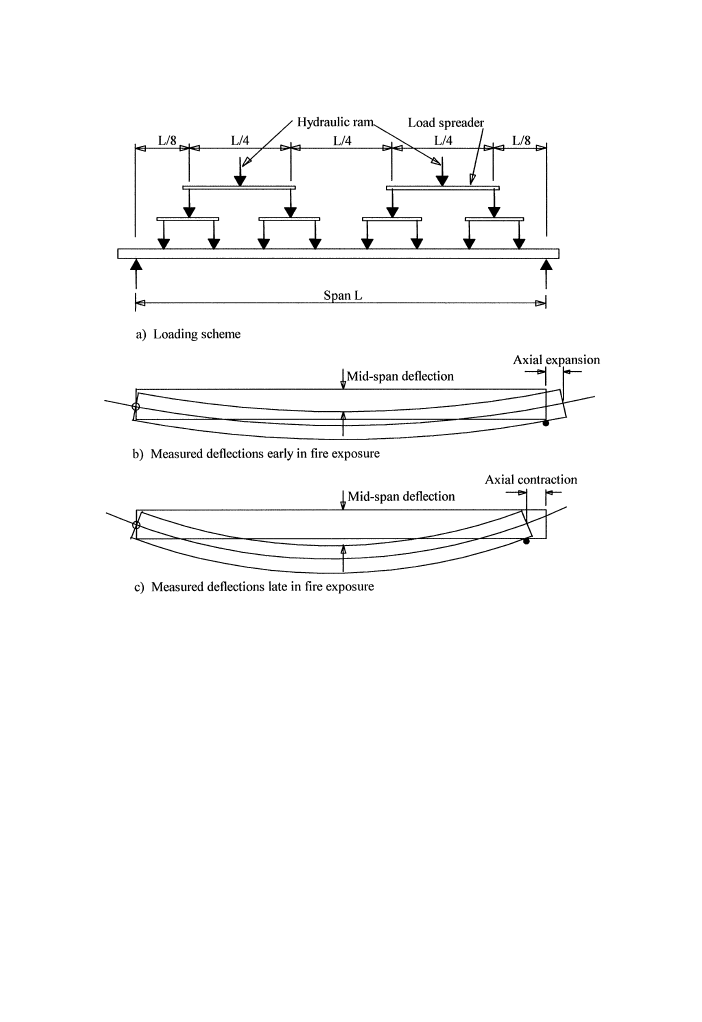
Fig. 1. Loading scheme and measured de#ections.
Numerical modelling of the thermal and structural response of "re-exposed com-
posite steel and concrete structures has reached an advanced stage in the UK, much of
the impetus coming from the recent full scale test work conducted on an eight-storey
building erected in the BRE large laboratory at Cardington. Universities involved in
modelling include Edinburgh, She$eld and City.
1.1. Fire test parameters
For the BRE slabs the following parameters were varied: slab thickness (150 and
250 mm), type of concrete (normal weight and light weight), live load (zero and
1.5 kN/m
of
#oor slab area), so$t protection (zero and two di!erent gypsum board
systems) and severity of standard "re exposure (ISO 834 and the Norwegian Petro-
leum Directorate (NPD) temperature-time curves). Table 1 lists the chosen combina-
tions.
G.M.E. Cooke / Fire Safety Journal 36 (2001) 459}475
461
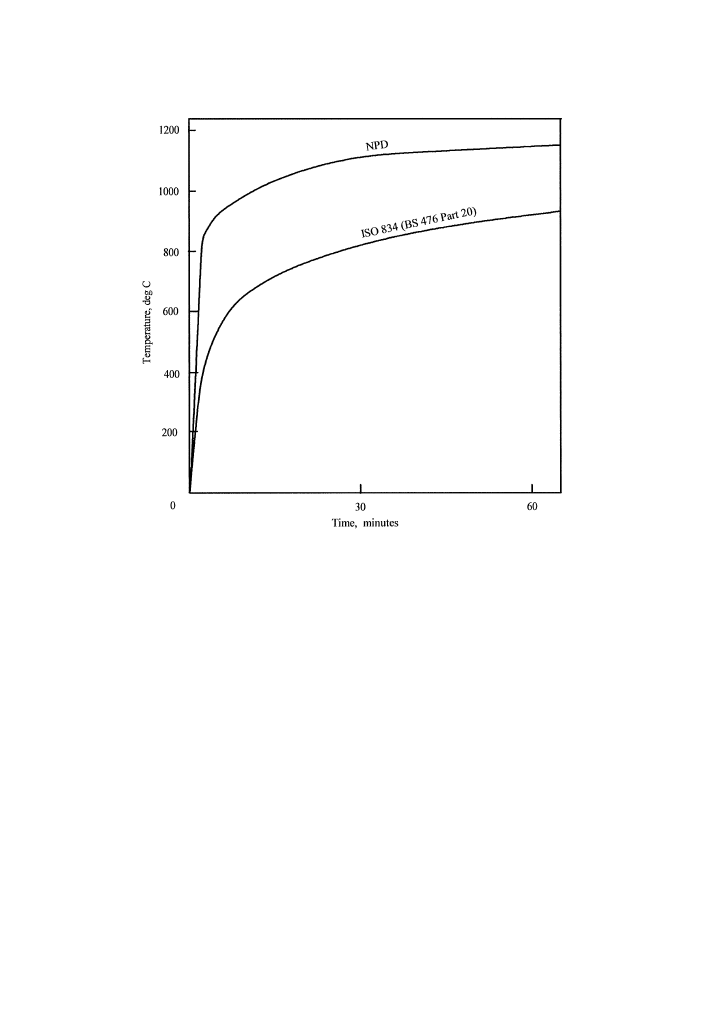
Fig. 2. Comparison of temperature}time curves used in tests.
The BRE slabs were designed to have a 90 min "re resistance assuming a live load of
1.5 kN/m
when exposed to the heating conditions speci
"ed in BS 476 Part 8: 1972
(ISO 834), which is appropriate for structural elements in high rise blocks of residen-
tial #ats in the UK. The time}temperature curve in Part 8 is the same as in the current
standards i.e. BS 476 Part 20, ISO 834 and the corresponding CEN standard. A com-
parison of the NPD and ISO/BS temperature-time curves is given in Fig. 2. The
structural design was based on BS 8110: Part 1: 1985 [2].
1.2. Fire test specimens
All the test specimens were 4.7 m long by 925 mm wide and were simply supported
at 4.5 m centres. The "re exposed length was 4.0 m.
The BRE slabs used concrete mixes designed to have a characteristic cube strength
of 30 N/mm
. The normal weight concrete (NWC) used a siliceous (20 mm
#int gravel)
aggregate with natural sand and had a nominal density of 2400 kg/m
; the light weight
concrete (LWC) contained Lytag ( pulverised fuel ash) coarse aggregate and had
a nominal density of 1800 kg/m
. All the reinforcing steel bars were of high yield
ribbed bar (Deformed Type 2 to BS 4449) having a nominal yield strength of
462
G.M.E. Cooke / Fire Safety Journal 36 (2001) 459}475

Table 1
Fire test parameters
Test
Specimen
Thickness
(mm)
No. of
rebars
Concrete Live
load
Heating
Comments
1
1
150
10
NWC
No
BS 476
BRE slab
1
2
150
10
NWC
Yes
BS 476
BRE slab
2
3
150
10
NWC
No
NPD
BRE slab
2
4
150
10
NWC
Yes
NPD
BRE slab
3
5
250
6
NWC
No
BS 476
BRE slab
3
6
250
6
NWC
Yes
BS 476
BRE slab
4
7
150
10
LWC
No
BS 476
BRE slab
4
8
250
6
LWC
No
BS 476
BRE slab
5
9
150
10
NWC
No
NPD
BRE slab
5
10
250
6
NWC
No
NPD
BRE slab
6
11
150
10
NWC
No
BS 476
BRE slab#so$t (1)
6
12
150
10
NWC
No
BS 476
BRE slab#so$t (2)
7
13
185
NWC
No
BS 476
Ronan Point slab
7
14
185
NWC
Yes
BS 476
Ronan Point slab
Notes: Live load " 1.5 kN/m
, So
$t (1)"10 mm thick glass reinforced gypsum board with 37 mm air
gap, So$t (2)"12.5 mm gypsum Fireline board with 37 mm air gap, NWC"Normal weight concrete,
LWC"Light weight concrete, BS 476"BS 476: Part 8:1972 (ISO 834), NPD"Norwegian Petroleum
Directorate (hydrocarbon "re simulation).
460 N/mm
. The primary (longitudinal ) steel was 8 mm diameter. The concrete cover
to the primary steel was 25 and 20 mm for the NWC and LWC slabs, respectively,
being appropriate for 90 min "re resistance according to UK regulatory guidance [3].
The concrete side cover was 25 mm. The moisture content of the slabs varied between
3.5 and 4.5% by weight.
The Ronan point slabs comprised a structural reinforced concrete slab of normal
weight concrete nominally 180 mm thick incorporating circular voids of 110 mm
diameter running longitudinally at 150 mm centres. This slab was overlaid with
a non-composite 12.5 mm thick layer of expanded polystyrene foam and a 65 mm
thick granolithic concrete screed. The screed and foam was present during the "re
tests.
Two kinds of proprietary boarded so$t protection were fabricated and installed at
the "re test laboratory by British Gypsum Ltd. One slab was protected with a 10 mm
thick glass reinforced gypsum (GRG) board. Another slab was protected with a
12.5 mm thick Fireline gypsum-based board. Both board protections were "xed to the
concrete so$t using cold formed steel members which resulted in an air gap of 37 mm.
These protection systems were included in the test programme as they had been used
in remedial work contracts on high rise #ats. Details of the tests are given in Table 1.
For the BRE slabs thermocouples were attached to 50 mm diameter cylindrical
cores of the appropriate concrete mix at a range of heights. The sensing ends were
aligned horizontally so that they would lie on an isotherm and were adhered to the
core with an epoxy resin. The ends of the cores were lightly bonded to the plywood
G.M.E. Cooke / Fire Safety Journal 36 (2001) 459}475
463
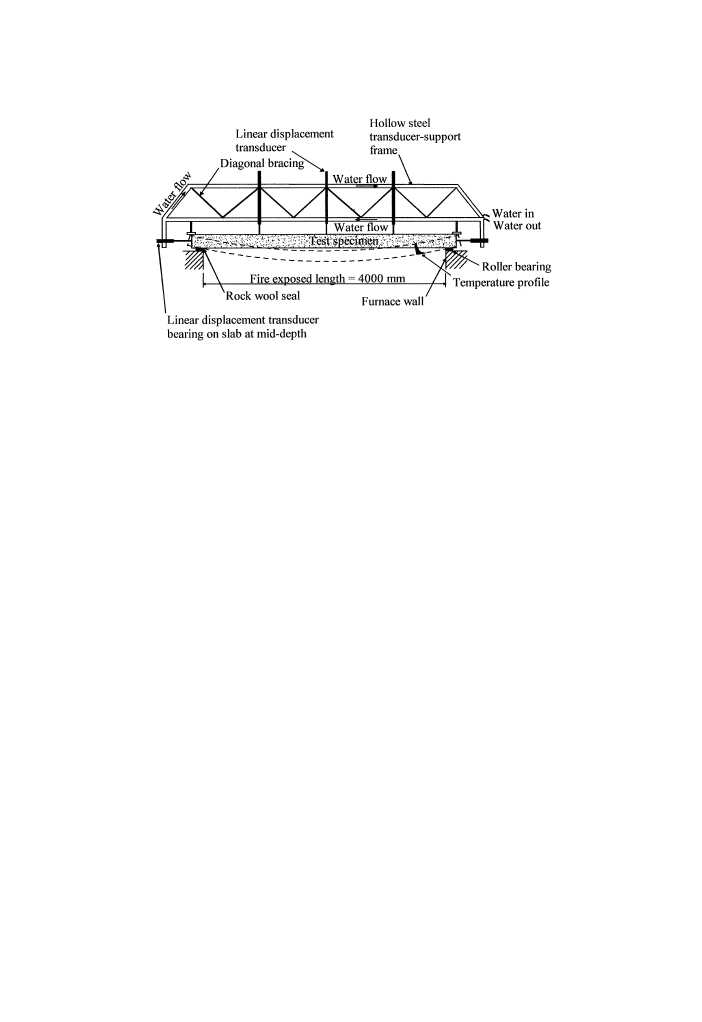
Fig. 3. Longitudinal section through furnace showing transducer-support frame.
formwork before casting the slabs so that the position of all cores and hence
thermocouples from the "re-exposed face were accurately known. The cores were
placed at mid-span and quarter-span positions along the centreline of the slab.
1.3. Test apparatus
The tests were made in the "re resistance #oor furnace at the Warrington Fire
Research Centre. The ends of each slab were simply supported. All de#ection
measurements were made relative to the ends of a slab using two purpose-made
hollow steel frames which rested on the ends of the slab. Each frame was kept cool
during a test using a continuous #ow of water so it would not itself de#ect due to
a change in ambient conditions. Linear displacement transducers (LDT's) were used
to measure vertical de#ections at mid-span and quarter-span positions. An LDT was
also aligned horizontally at either end of the slab at mid depth so as to measure axial
de#ection. The apparatus is shown in Fig. 3. Loads were applied using A-frames, two
hydraulic jacks and a system of load spreaders to approximate uniformly distributed
loading indicated in Fig. 1(a).
In each test, two slabs were laid side by side separated from each other and from the
furnace cover slabs with a #exible ceramic "bre seal so that the edges of the slabs were
protected from "re and were free to de#ect during a test. Fig. 4 shows the arrangement
in which a pair of slabs of di!erent thickness are being tested.
2. Test results
2.1. Temperature proxles in slabs
Averaged temperature pro"les within BRE slabs without so$t protection at 30 min
increments are given in Figs. 5}7. The "gures show the e!ect of varying the "re
464
G.M.E. Cooke / Fire Safety Journal 36 (2001) 459}475
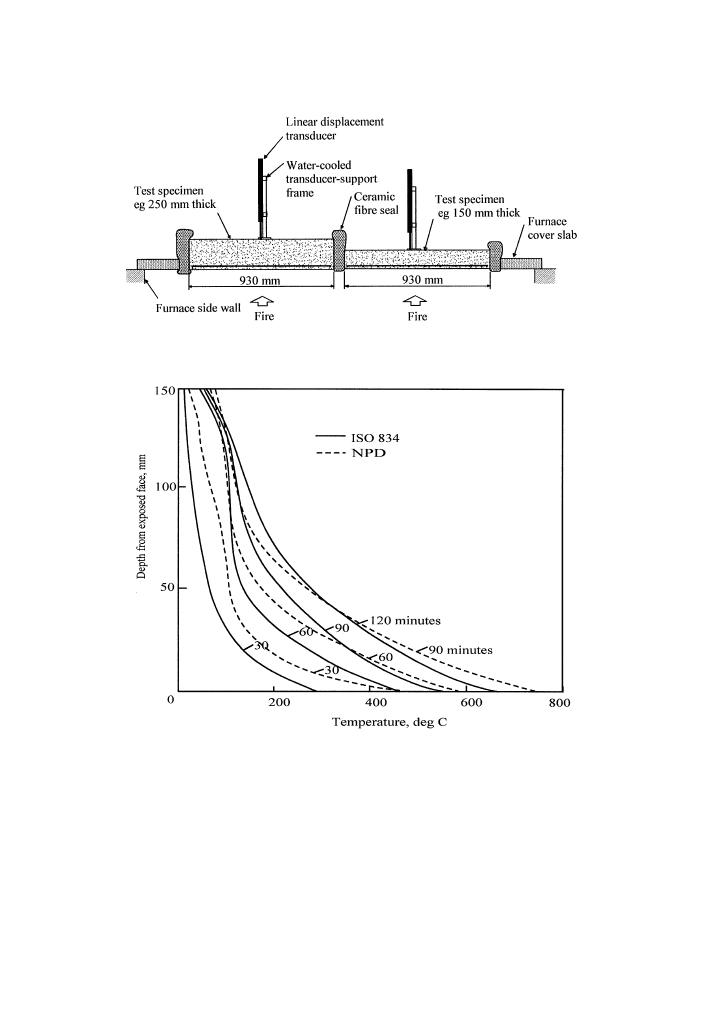
Fig. 4. Cross section of #oor slab specimen assembly.
Fig. 5. Temperature pro"les (150 mm, NWC).
exposure and type of concrete. The pro"les in the 250 mm slabs show a clearly
pronounced moisture plateau at 1003C when steam is driven o! and also exhibit
steeper temperature gradients and higher temperatures near the exposed surface when
compared with the data for the 150 mm slabs. Fig. 7 shows that the e!ect of the higher
thermal insulation of Lytag LWC made little di!erence to the maximum temperatures
attained in the concrete, but the bene"t of LWC is considerable at the depth where the
reinforcing steel is normally located: the temperature at 20 mm after the 90 min design
G.M.E. Cooke / Fire Safety Journal 36 (2001) 459}475
465
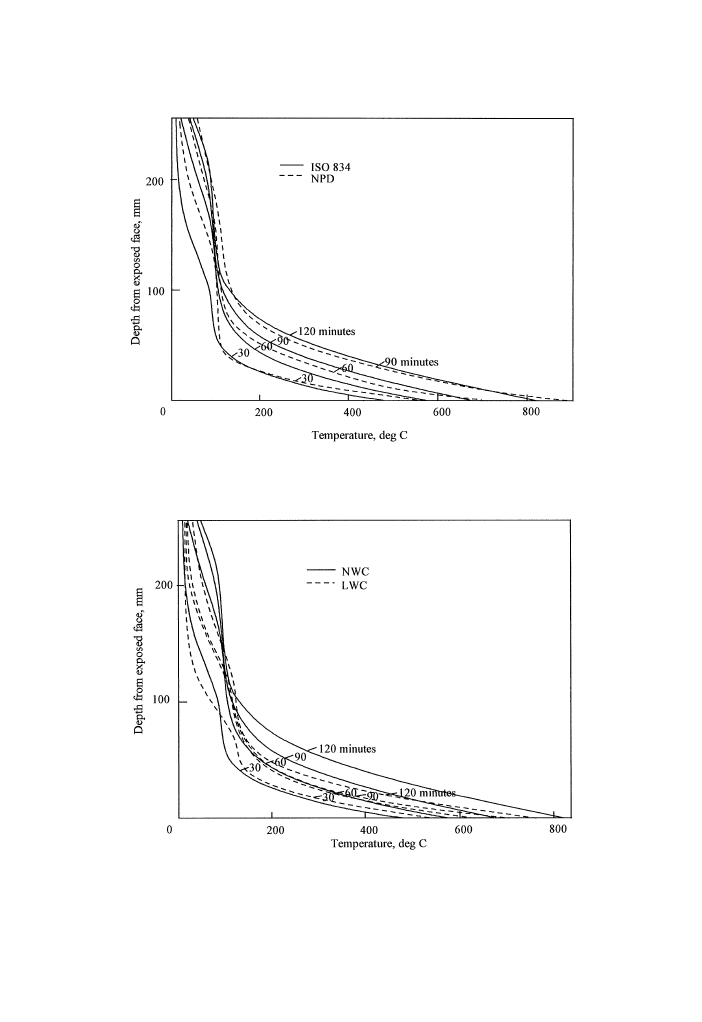
Fig. 6. Temperature pro"les (250 mm, NWC).
Fig. 7. Temperature pro"les (250 mm, ISO 834).
466
G.M.E. Cooke / Fire Safety Journal 36 (2001) 459}475
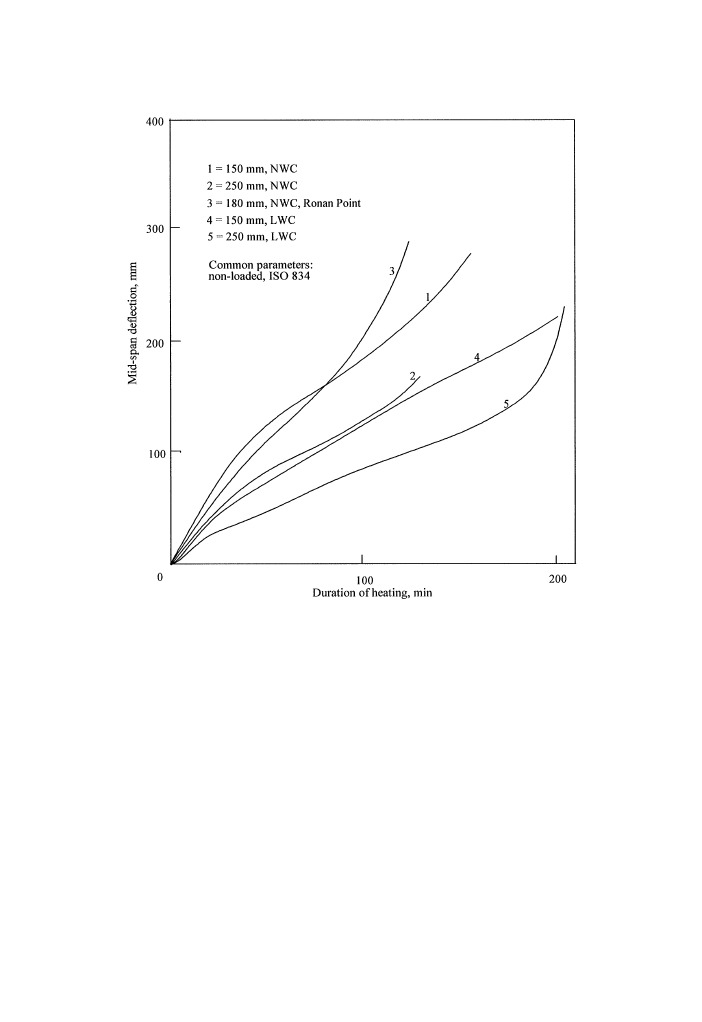
Fig. 8. E!ect of slab thickness and concrete type.
exposure to ISO 834 is approximately 3003C for the 250 mm thick slab, and at
this temperature the reinforcing steel would have lost none of its room temperature
ultimate tensile strength [4,5]. The e!ect of the hydrocarbon exposure when
compared to the ISO 834 exposure is, as expected, markedly to increase the temper-
atures near the exposed face as shown in Figs. 5 and 6. It has to be recognised that it is
di$cult accurately to measure the temperature of concrete at the concrete/combus-
tion gas interface because of the large temperature gradient.
All of the slabs tested resisted spalling throughout the full period of "re exposure
and it can therefore be said that any aberrations in the temperature data are not due
to spalling; such aberrations can occur due to moisture removal during the heating
process and this e!ect, as previously mentioned, can and did have an e!ect. It should
not be concluded from this work that spalling is not a problem: it is generally accepted
that spalling can occur where a large hogging moment is present (it was absent in the
present tests because of the simple supports), and there is increasing evidence that high
strength concrete used in prestressed planks is prone to spalling in "re.
G.M.E. Cooke / Fire Safety Journal 36 (2001) 459}475
467
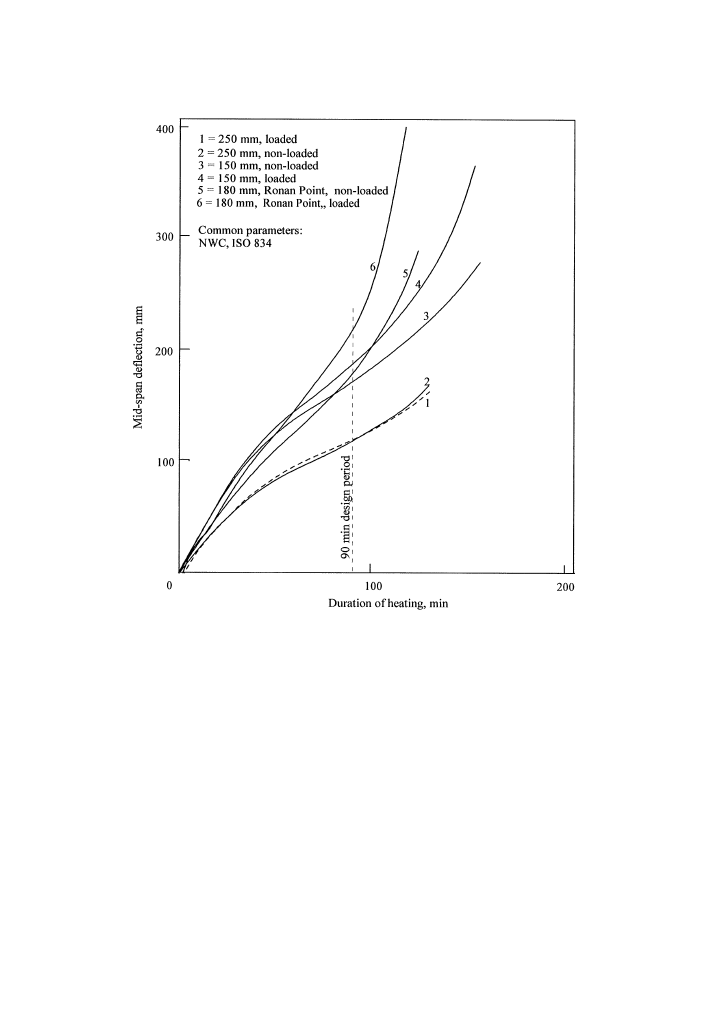
Fig. 9. E!ect of imposed load.
2.2. Mid-span deyections
Here some of the more important comparisons are made of measured mid-span
de#ections. It is assumed that the #exural de#ection of a non-loaded slab is dominated
by thermal bowing, i.e. the self weight of the slab has negligible e!ect upon de#ections
except near ultimate failure. With the exception of a 250 mm NWC slab exposed to the
hydrocarbon "re which su!ered runaway de#ection at 110 min, none of the slabs
collapsed during the exposure period of nominally 2 h so the assumption that thermal
bowing is dominant within the 90 min design period of "re exposure seems reasonable.
2.2.1. Ewect of slab thickness
Fig. 8 shows the e!ect of slab thickness for three NWC and two LWC slabs,
respectively, when exposed to ISO 834. The thicker slab de#ects less which is what one
might expect intuitively and agrees with the theory of thermal bowing [1] which
shows that thermal bowing is inversely proportional to the slab thickness. The
468
G.M.E. Cooke / Fire Safety Journal 36 (2001) 459}475
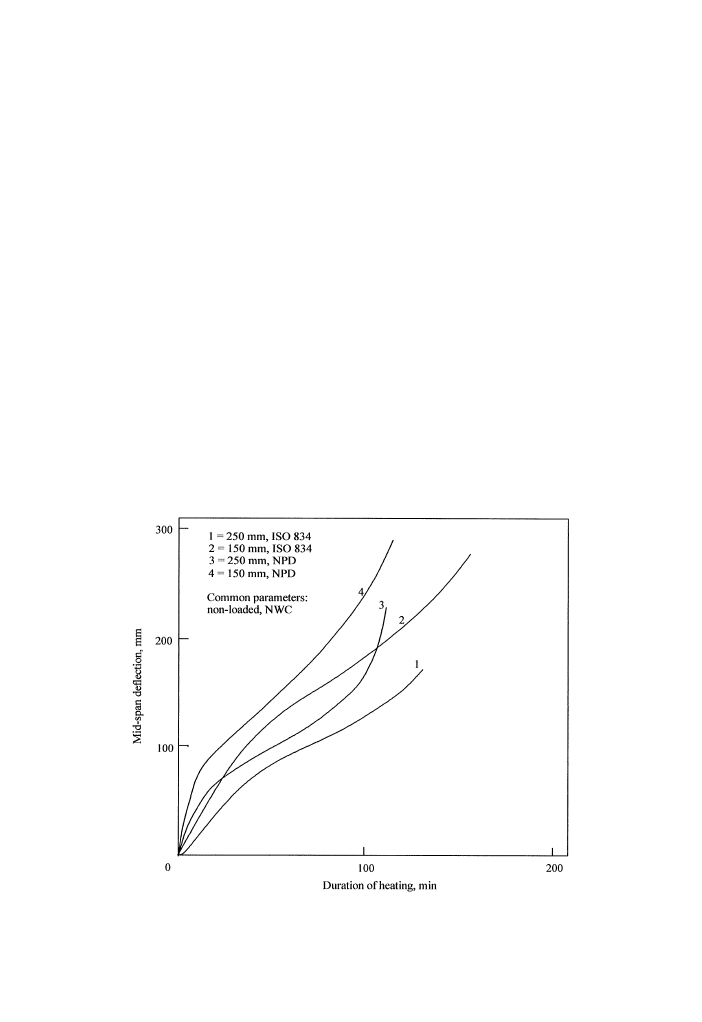
Fig. 10. E!ect of heating rate.
de#ection curve for the non-loaded 180 mm thick Ronan point slab suggests that the
relative magnitudes of de#ection agree with the theory of thermal bowing up to
80 min*the curve for 180 mm thickness lies between those for 150 and 250 mm.
2.2.2. Ewect of concrete type
Fig. 8 also shows the e!ect of concrete mix on de#ections of non-loaded slabs of
150 and 250 mm thickness, respectively, when exposed to ISO 834. The lightweight
concrete slabs (incorporating Lytag aggregate made from pulverised fuel ash) de#ect
markedly less than the NWC slabs. This may be attributed to (a) the lower thermal
conductivity of the LWC which may result in lower temperatures and lower thermal
expansion in the "re-exposed structural layer, and (b) the lower coe$cient of linear
thermal expansion of Lytag compared with dense aggregate, but further analysis
would be needed before the relative importance of thermal conductivity and thermal
expansion could be assessed. Certainly the di!erence in de#ections is large*at the
90 min design period of "re resistance the mid-span de#ections of the LWC slabs are
roughly two}thirds those of the NWC slabs, and it should be remembered that these
are di!erences in thermal bowing since the slabs were not loaded.
2.2.3. Ewect of imposed load
Fig. 9 shows the e!ect of imposed load on mid-span de#ections for NWC slabs 150
and 250 mm thick, respectively, when exposed to ISO 834. Within the design period of
G.M.E. Cooke / Fire Safety Journal 36 (2001) 459}475
469
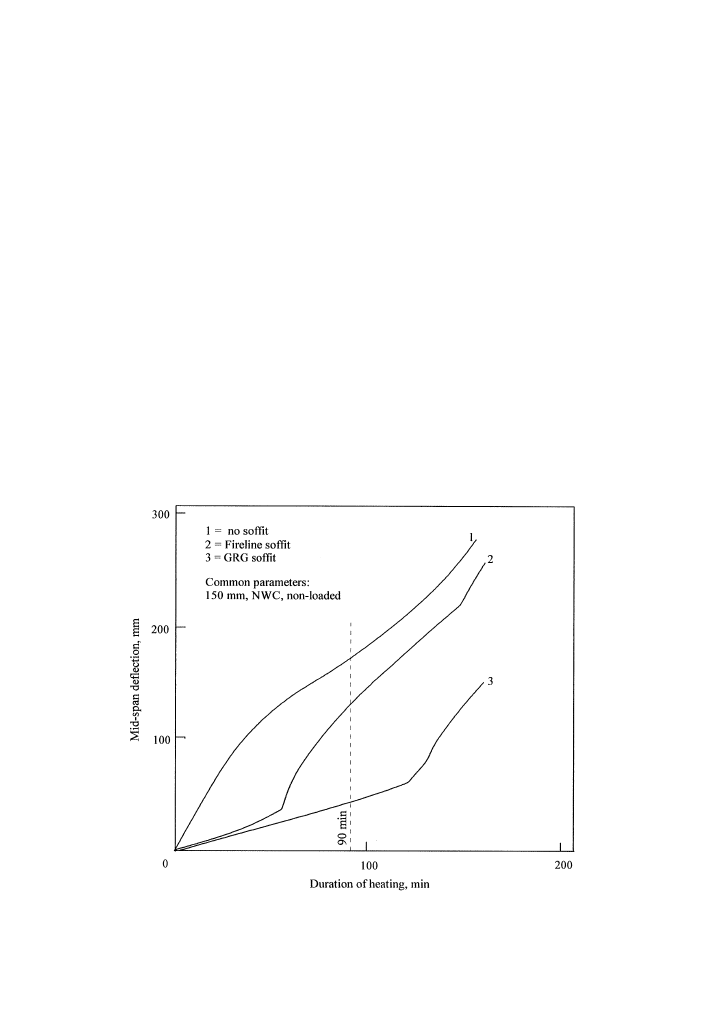
Fig. 11. E!ect of so$t protection.
90 min "re resistance it is clear that the mid-span de#ections are a!ected to a negli-
gible e!ect by the imposed load. The mid-span de#ection of the 180 mm thick Ronan
point slabs exposed to ISO 834 also demonstrated the negligible e!ect of the
1.5 kN/m
imposed load although it should be noted that the design imposed load is
not known for the Ronan point building. Hence the de#ections are dominated by
thermal bowing. This is an important "nding as it shows that a calculation of thermal
bowing would su$ce in estimating the likely total de#ections before the onset of
collapse.
2.2.4. Ewect of heating rate
Fig. 10 shows the e!ect of exposing non-loaded NWC slabs of 150 and 250 mm
thickness, respectively, to the NPD (hydrocarbon) temperature}time curve which has
a higher heating rate than ISO 834. The NPD exposure results in much larger
de#ections, especially in the early stage of exposure: at 20 min the de#ections were
almost doubled in the 250 mm thick slab. Although both slabs were designed to have
a 90 min "re resistance for ISO 834 exposure, the slabs were able to resist collapse
under the more severe NPD exposure for the 90 min period and this suggests that
there is a large measure of safety associated with present UK "re safety design practice
for reinforced concrete slabs.
470
G.M.E. Cooke / Fire Safety Journal 36 (2001) 459}475
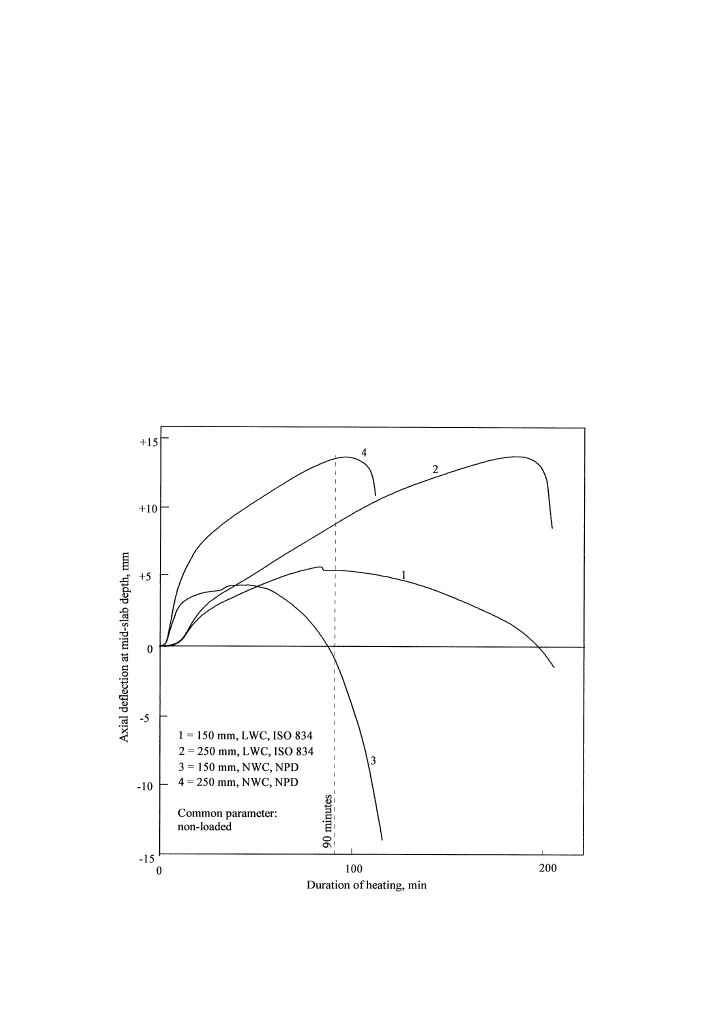
Fig. 12. E!ect of slab thickness.
2.2.5. Ewect of sozt protection
Fig. 11 shows de#ections of 150 mm thick non-loaded slabs of NWC exposed to
ISO 834 with and without the two di!erent "re protecting boards. Details of the
protection are given earlier. The curves show that the addition of a plaster-based so$t
gives much smaller de#ections provided the protection remains in place (part of the
Fireline fell down at approximately 55 min). At the 90 min design period of "re
resistance the de#ection of the slab with GRG protection was roughly a quarter of
that of the unprotected slab.
2.3. Axial deyections
Axial de#ection is here de"ned as the horizontal de#ection of one end of a slab
relative to the other end. All the measured de#ections were made at the mid depth of
the slab, Fig. 1. A positive axial de#ection corresponds to an increase in the chord
length as occurs in the early stage of "re exposure due to thermal expansion. Later in
G.M.E. Cooke / Fire Safety Journal 36 (2001) 459}475
471
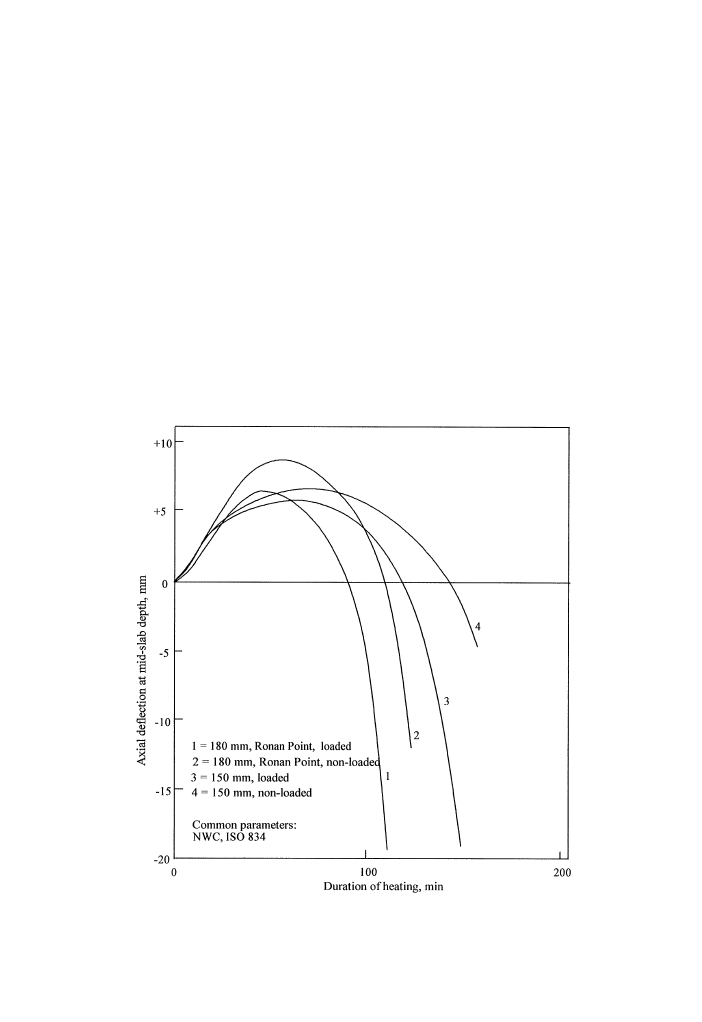
Fig. 13. E!ect of imposed load.
the "re exposure excessive bowing leads to a shortening of the chord length and
a negative axial de#ection is obtained. Since the axial de#ection depends on the
mid-span de#ection in the later stages of "re exposure, an understanding of the axial
de#ection curves requires reference to the corresponding mid-span de#ection curves.
Measured axial de#ections are given in Figs. 12}15. Some general comments on the
results are as follows:
Fig. 12 shows axial de#ections for 150 and 250 mm thick, non-loaded slabs of LWC
exposed to ISO 834. The axial de#ection is larger for the thicker slab, and the time of
maximum de#ection is di!erent, being delayed for the thicker slab. At 90 min the
de#ection was 5.5 and 9 mm for the 150 and 250 mm slabs, respectively. Maximum
de#ections for 150 and 250 mm thick, non-loaded slabs of NWC exposed to NPD
were 5.5 and 14 mm, respectively.
Fig. 13 shows axial de#ections of the non-loaded and loaded 180 mm thick Ronan
point slabs and 150 mm slabs of NWC exposed to ISO 834. The runaway axial
de#ections of the Ronan point slabs are attributed to the runaway mid-span de#ec-
tions. Fig. 14 shows, more than in any other test, the negligible e!ect of imposed load
472
G.M.E. Cooke / Fire Safety Journal 36 (2001) 459}475
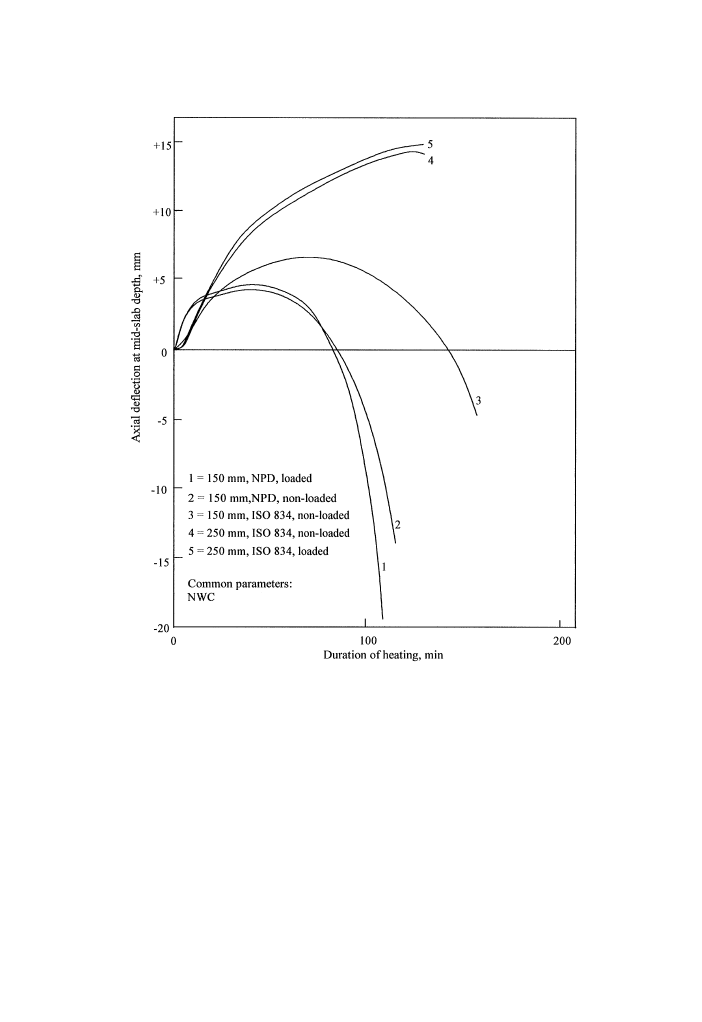
Fig. 14. E!ect of imposed load.
on axial de#ection, and this can be attributed to the almost identical mid-span
de#ection curves.
Fig. 14 shows that the largest axial de#ection of all the tests occurred with the
250 mm NWC slab exposed to ISO 834*the maximum positive de#ection was
14 mm. In contrast, the 150 mm NWC slab exposed to NPD exhibited an early
maximum positive axial de#ection of only 4 mm followed by a reversal and large
negative de#ections. The "gure also shows the large e!ect of the rapid heating
achieved in the NPD exposure for 150 mm thick NWC slabs.
Fig. 15 shows that the axial de#ection of the so$t-protected 150 m NWC slab is
approximately three-quarters that of the unprotected slab at the 90 min design period
of ISO 834 "re exposure.
G.M.E. Cooke / Fire Safety Journal 36 (2001) 459}475
473
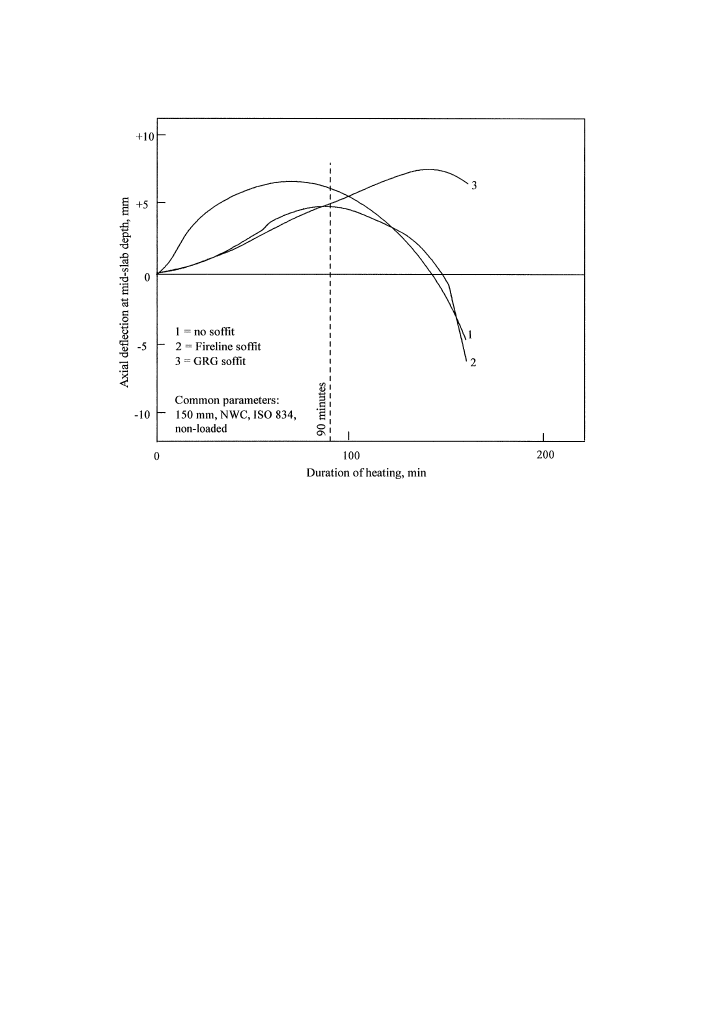
Fig. 15. E!ect of so$t protection.
3. Conclusions
(1) A series of seven furnace tests has been successfully carried out giving accurate
data on mid-span de#ection and axial de#ection for 14 unrestrained reinforced
concrete #oor slabs having a "re exposed length of 4000 mm. The e!ect of
varying the slab thickness, imposed load, heating rate, concrete type and so$t
protection has been established. These data enable numerical models to be
validated.
(2) The method of test whereby two slabs nominally 900 mm metre wide structurally
independent of each other are exposed to the same heat #ux means that accurate
comparisons can be made. The method also means that specimens can easily be
manufactured, handled and transported, and the cost of testing is halved which is
an important consideration for parametric research studies of the kind reported
in this paper.
(3) Mid-span de#ections were dominated by thermal bowing during the 90 min
design period of "re exposure; the e!ect on de#ections of imposing the design live
load of 1.5 kN/m
, Fig. 9, was very small and this suggests that BS 8110 is
conservative.
(4) The higher rate of heating associated with the NPD hydrocarbon "re exposure
caused almost a doubling of mid-span de#ection obtained using the ISO 834 "re
exposure in the "rst 20 min, Fig. 10.
474
G.M.E. Cooke / Fire Safety Journal 36 (2001) 459}475

(5) The e!ect of using lightweight concrete employing Lytag coarse aggregate is to
reduce the mid-span de#ection associated with normal weight concrete by rough-
ly 30% at the 90 min design period of "re resistance, Fig. 8. The reduced
de#ections are probably due to the lower coe$cient of thermal expansion and
lower thermal conductivity of light weight concrete.
(6) The e!ect of so$t protection is, as one might expect, to reduce the mid-span
de#ection. Fig. 11 shows that the mid-span de#ection of the 150 mm NWC slab
with so$t protection was roughly a quarter that of the unprotected slab. Fig. 15,
however, shows that the slab having a so$t protection which remained in place
su!ers almost the same magnitude of axial de#ection at mid-slab depth as the
same slab with no so$t protection, although the peak de#ection occurred much
later for the so$t-protected slab.
Acknowledgements
The author wishes to thank Professor G. Cox, Fire Research Station, Building
Research Establishment, for permission to publish the test results and Mr. R.L.
Sawford and his team in the Civil Engineering Laboratory, BRE, Cardington for
making the precast concrete test specimens. Thanks are also due to British Gypsum
Ltd for supplying and installing, free of charge, two so$t board protection systems.
Again thanks are due to laboratory sta! of Warrington Fire Research Centre who
worked closely with the author in the preparation for and conduct of the tests. The
provision of funds from the Construction Directorate of the Department of the
Environment is gratefully acknowledged.
References
[1] Cooke GME, Morgan PBE. Thermal bowing in "re and how it a!ects building design. BRE
Information Paper IP 21/88, Building Research Establishment, December 1988.
[2] BS 8110 Structural use of concrete, Part 1 Code of practice for design and construction. British
Standards Institution, 1985.
[3] Morris WA, Read REH, Cooke GME. Guidelines for the construction of "re resisting structural
elements. Building Research Establishment Report BR 128, BRE, Garston, 1988.
[4] Holmes M, Anchor RD, Cooke GME, Crook RN. The e!ects of elevated temperatures on the strength
of reinforcing and prestressing steels. The Structural Engineer 1982;60(1):7}13.
[5] British Standards Institution, ENV 1993: Design of steel structures: DD ENV 1993-1-2: Structural "re
design (including UK NAD). Expected 2001.
G.M.E. Cooke / Fire Safety Journal 36 (2001) 459}475
475
Wyszukiwarka
Podobne podstrony:
Behaviour of precast reinforced concrete pile caps
08 Polak M A Preventing punching shear failures of reinforced concrete slabs, results of static and
Principles of Sigma Delta Conversion for Analog to Digital Converters
FreeNRG Notes from the edge of the dance floor
16 197 208 Material Behaviour of Powder Metall Tool Steels in Tensile
[2006] Application of Magnetic Energy Recovery Switch (MERS) to Improve Output Power of Wind Turbine
Analysis of Gangs Why are Youth drawn to them
36 495 507 Unit Cell Models for Thermomechanical Behaviour of Tool Steels
43 597 609 Comparison of Thermal Fatique Behaviour of Plasma Nitriding
50 707 719 Thermal Fatique and Softening Behaviour of Hot Work Steels
44 611 624 Behaviour of Two New Steels Regarding Dimensional Changes
Electrochemical behavior of exfoliated NiCl2–graphite intercalation compound
Analysis of Reinforced Concrete Structures Using ANSYS Nonlinear Concrete Model
DYNAMIC BEHAVIOUR OF THE SOUTH Nieznany
Management of Adult Patients With Ascites Due to ascites
49 687 706 Tempering Effect on Cyclic Behaviour of a Martensitic Tool Steel
Design Guide 11 Floor Vibrations Due To Human Activity
Ecology and behaviour of the tarantulas
Fatigue Behavior of Polymers
więcej podobnych podstron