
EN
EN
EN

EN
EN
COMMISSION OF THE EUROPEAN COMMUNITIES
Brussels, 7.10.2009
SEC(2009) 1296
COMMISSION STAFF WORKING DOCUMENT
Accompanying document to the
COMMUNICATION FROM THE COMMISSION TO THE EUROPEAN
PARLIAMENT, THE COUNCIL, THE EUROPEAN ECONOMIC AND SOCIAL
COMMITTEE AND THE COMMITTEE OF THE REGIONS
on Investing in the Development of Low Carbon Technologies
(SET-Plan)
R&D INVESTMENT IN THE PRIORITY TECHNOLOGIES OF THE
EUROPEAN STRATEGIC ENERGY TECHNOLOGY PLAN
{COM(2009) 519 final}
{SEC(2009) 1295}
{SEC(2009) 1297}
{SEC(2009) 1298}

EN
ii
EN
COMMISSION STAFF WORKING DOCUMENT
R&D INVESTMENT IN THE PRIORITY TECHNOLOGIES OF THE EUROPEAN
STRATEGIC ENERGY TECHNOLOGY PLAN
Table of contents
SUMMARY......................................................................................... iii

EN
iii
EN
1.
EXECUTIVE
SUMMARY
The present report aims at estimating the current research and development (R&D)
investments in selected low-carbon energy technologies in the EU-27 funded by the Member
States, through the 6
th
EU Research and Euratom Framework Programmes and by companies
with headquarters registered in the EU. Its ultimate objective is to offer a benchmark of the
current R&D spending on those technologies to serve as a basis for the comparison with their
future research investment needs. The present assessment forms a starting point for further
work on this issue given the current lack of a comprehensive overview on corporate and
public R&D investments in selected low-carbon technologies. It has been prepared by the
Institute for Prospective Technological Studies (IPTS) of the European Commission's Joint
Research Centre (JRC) as a central reference input to the forthcoming Communication on
Investing in the Development of Low Carbon Technologies. The Communication is part of
the implementation of the Strategic Energy Technology Plan (SET-Plan) for Europe and will
address the financing needs of selected low-carbon technologies in Europe.
This report forms part of the regular mapping of energy research capacities that is being
undertaken within SETIS (SET-Plan Information System). It benefited substantially from the
review organised within the European Commission's Joint Research Centre in the context of
SETIS and from comments provided by experts from the European Commission's Directorate
Generals for Energy and Transport (TREN) and for Research (RTD), who initiated this work.
Furthermore, numerous external experts provided valuable inputs at various stages of this
report. A consultation process with Member States in the frame of the SET-Plan Steering
Group Sherpa meetings largely contributed to the analysis of public R&D investments, while
information supplied by companies and industry associations was important for assessing
corporate R&D efforts.
The technologies considered in the present analysis include those for which the SET-Plan
proposed to launch European Industrial Initiatives and those for which a dedicated European
programme already existed: wind energy, photovoltaics (PV) and concentrating solar power
(CSP), carbon dioxide capture and storage (CCS), biofuels, hydrogen and fuel cells, smart
grids, nuclear fission (with a focus on generation IV reactors), and nuclear fusion. For
simplification, this group of technologies will be called 'SET-Plan priority technologies' in the
following, often grouped into nuclear and non-nuclear technologies.
For corporate and Member States' national public R&D spending the focus of the analysis lies
on the 2007 figures while the relevant EU R&D investments are annualised figures under FP6
(2002-2006). In order to avoid putting too much weight to one-off events or data mavericks,
annual averages of the public national R&D spending between 2002 and 2007 are also
included for comparison.
As data on corporate R&D investment are sketchy, especially at the level of technological
detail required, a novel approach for estimating them has been developed for the present
assessment. For each SET-Plan priority technology, the number of key R&D investors has
been identified. A company's overall R&D investment has then been allocated to individual
technologies based on the combination of publicly available information with expert
judgment. Hence, the results only provide a rough estimation of research efforts and should
not be used without taking into account the methodological limitations of this approach.

EN
iv
EN
With regard to public national R&D funding, the most recent publicly available data (2007)
were used from the Eurostat database on Government Budget Appropriations or Outlays on
R&D (GBAORD) and in particular the International Energy Agency's (IEA) statistics on
Research, Development and Demonstration (RD&D), complemented by national information
that was directly provided by a number of Member States. Unfortunately, both the GBAORD
and the IEA databases miss some entries at the technological level of detail needed, and only
19 of the EU Member States are covered in the IEA RD&D statistics as the remaining
Member States are not IEA members. Data missing for 2007 were gap filled with data from
previous years if available or data taken from official national sources.
Relevant EU R&D funding under the 6
th
Research Framework Programme and the
EURATOM Framework Programme has been taken into account. Funds under these
programs have been assessed on the basis of individual projects, going beyond projects
financed under the 'core' energy budget line 'sustainable energy systems', and also including
relevant projects funded under budget lines such as 'sustainable surface transport' or
'horizontal research activities involving small and medium sized enterprises (SMEs)' etc. An
annual average of the commitments has been used for these multiannual programmes (2002-
2006).
Both the basic data as well as the approach applied in the present study are associated with
uncertainties, which have been identified and quantified to the extent possible
1
. The largest
source of error derives from the assumption-based allocation process used for breaking down
a company's R&D investment into individual technologies. With regard to public R&D
investments, the differences in the extent to which individual Member States include regional
funding, institutional budgets and support to demonstration activities in their submission to
the International Energy Agency adds some uncertainty. Overall, it is estimated that the
cumulative error margin of total R&D investments in SET-Plan priority technologies does not
exceed ± 24% even though higher uncertainties may apply to the results related to one
individual technology. The order of magnitude of the results obtained in the present report is
also supported by a comparison with other sources both at the aggregated level and at the
level of individual technologies and funders. It can thus be considered as a reasonable
approximation of the present R&D investments. Hence, despite the limitations of the present
analysis, some policy-relevant conclusions can be drawn from the present assessment:
Investments dedicated to R&D in non-nuclear SET-Plan priority technologies amounted
to €2.38 billion in 2007
2
with a division that is roughly balanced across individual
technologies
Investments in non-nuclear energy R&D in SET-Plan priority technologies are estimated at
€2.38 billion. The R&D investments dedicated to CCS, smart grids, biofuels, wind energy and
photovoltaics are in-between €270 million and €380 million each. The substantially larger
investments for hydrogen and fuel cells research (€616 million) may be explained by the
diversity of technologies that are subsumed under this heading, thus attracting R&D
investments from many large and small companies from a broad variety of sectors (e.g. car
1
The estimates of industrial R&D investments of the present report most likely constitute a lower
estimate of industrial research efforts due to the lack of data and the limitation in the number of
companies included in the assessment. The extent of the related uncertainties could, however, not be
quantified.
2
2007 figures are provided for corporate and Member States' national public R&D spending while the
relevant EU R&D investments are annualised figures under FP6 (2002-2006).

EN
v
EN
manufacturers, electric utilities, chemical companies and component suppliers). At the same
time, few countries and companies are active in research on concentrating solar power
technologies (CSP), explaining the comparatively low R&D investments in this field (€86
million).
Industry finances large parts of the R&D of non-nuclear SET-Plan priority technologies
Corporate R&D investments in non-nuclear SET-Plan priority technologies reached €1.66
billion in 2007, thus accounting for 69% of the total investments.
3
This highlights the active
role of EU-based companies in those technologies and the acknowledgment of the need for
further research in order to strengthen the position of the EU in these promising technologies.
However, the R&D intensities found for some of the sectors relevant for the SET-Plan (in-
between 2.2% and 4.5%) remain well below the intensities in other industrial sectors that
experienced a boom in recent years; for example, the IT-related sectors 'software', 'computer
hardware' or 'semi-conductors' experienced R&D intensities in the order of 8% to 18% over
the past five years
4,
5.
The share of corporate R&D investments is elevated for the more mature technologies wind
energy and biofuels
6
. In comparison, the share of corporate R&D investments is lower for PV,
hydrogen and fuel cells and CSP, as well as for generation IV nuclear reactors and nuclear
fusion. These may be considered as less mature, in particular if we assume that research in PV
concentrates on new technologies instead on the more mature crystalline silicon cells. Note,
however, that the results describing the distribution of R&D spending by investor must be
interpreted with care due to the differences in the nature between corporate and public R&D
spending.
The assessment indicates that innovation in the energy sector may not predominantly being
carried out by classical energy companies such as electric utilities or oil/gas suppliers, which
invest only a very small percentage of their revenues in R&D. Industries with elevated
research activities in low-carbon energy technologies include companies active in industrial
machinery, chemicals, energy components or those that are exclusively active in one area
(such as a specialised wind energy company).
Public R&D spending on non-nuclear SET-Plan priority technologies is increasing despite a
decline in the overall energy research budgets, but synergies across Member States have not yet
been fully exploited
Despite an overall decrease in energy research budgets over the past two decades (largely due
to shrinking nuclear R&D budgets) with a slight upward trend in more recent years,
investments in non-nuclear SET-Plan priority technologies have been more or less stable
throughout the 1990s with an important increase since the beginning of the new century. In
3
The share of corporate R&D investments drops to 56% of the total if nuclear SET-Plan priority
technologies are also included, see Figure 1.
4
Note, however, that R&D intensities cannot directly be compared between different sectors due to the
considerable differences in their innovation systems (see e.g. Malerba, 2004; Kaloudis and Pedersen,
2008, on the energy sector).
5
Figures relate to EU-based companies and are taken from various versions of the EU Industrial R&D
Investment Scoreboards (Hernandez Guevara et al., 2008).
6
It is also elevated for CCS. This may, however, be due to an under-estimation of the public R&D
efforts.

EN
vi
EN
2007, Member States invested €571 million in R&D related to the non-nuclear SET-Plan
priority technologies, which is equivalent to 34.5% of their total public non-nuclear energy
R&D budgets, and indicates the importance given to these technologies. On top of the
national funding, EU investments under FP6 added another €157 million for the public
research on those technologies.
One may be led to compare these R&D investments of €728 million with a similar selection
of public funds in other world regions. This would put the EU ahead of the US American and
Japanese 'non-nuclear SET-Plan R&D spending', in spite of both regions having slightly
higher overall energy R&D budgets.
Such comparison, however, may be misleading as it hides important differences in the way
energy R&D is being financed and carried out across the different regions. Unlike the strong
focus and coordination provided for energy (research) in the US by the Department of Energy
(DoE) and in Japan through the Ministry for Economy, Trade and Industry (METI), no
unified European programme currently exists for fostering low-carbon technologies with the
exception of fusion related research. Instead, pan-European cooperation is limited and
synergies between Member States in the development of new energy technologies have so far
not been fully exploited, although recent initiatives such as the SET-Plan or the ERA-NET
scheme have started to address this problem. Furthermore, R&D activities within Member
States are often also fragmented, often due to the complexity created by the involvement of
several ministries and agencies in the management of different parts of national programmes.
This fragmentation would tend to distort any benchmarking of the US and Japanese funds
with the aggregated R&D investment of EU Member States and the EU.
On top of the €2.38 billion invested in non-nuclear SET-Plan priority technologies, €0.94 billion
are dedicated to nuclear SET-Plan priority technologies, with fusion research receiving high
public support due to the capital investment needs of the ITER construction
Investments dedicated to R&D in nuclear SET-Plan priority technologies (excluding
treatment of nuclear waste, radioprotection etc.) are estimated at €939 million, with an almost
equal split between reactor-related fission research and fusion research. Nuclear-fission
related research in the context of the SET-Plan focuses on R&D investments for Generation
IV reactors. As data on nuclear R&D budgets are not available in the necessary detail, they
were approximated by all nuclear reactor related R&D investments, which implies the risk of
overestimating the Generation IV reactor R&D investments. Total nuclear reactor R&D
investments sum to €458 million, almost half of which is financed by the private sector
(45%). France accounts for more than half (52%) of the aggregated EU Member States' public
nuclear reactor R&D spending and French companies hold an even higher share in the
industrial nuclear reactor related R&D investments. The total investment dedicated to fusion
research is around €480 million but there is hardly any private sector R&D investment due to
the long time horizon of this research area and the high capital investment needed for the
construction phase of the International Thermonuclear Experimental Reactor (ITER). The
Member States account for 58% of all R&D investment in fusion, while the EU share is 42%.
Corporate and public R&D investments in SET-Plan priority technologies largely concentrate in
only few Member States
Both public and private R&D investments in (nuclear and non-nuclear) SET-Plan priority
technologies are largely concentrated (see Figure 1). For many technologies, the countries
EN
vii
EN
with high public R&D funds simultaneously account for the largest corporate R&D
investments.
The estimates of the present report indicate that 99% of the aggregated national R&D budgets
on SET-Plan priority technologies originate from eleven Member States namely France,
Germany, Italy, the UK, Denmark, Spain, the Netherlands, Belgium, Sweden, Finland and
Austria with the first three accounting for two thirds. At the same time, R&D investments in
SET-Plan priority technologies from companies located in Germany, France, the UK,
Denmark, Spain and Sweden were found to account for almost 95% of the total corporate
R&D investments. In many cases, the group of countries that give strong public support to
research into a certain technology simultaneously accounts for the largest R&D investment of
industry into that technology. This may be seen as an indication of a positive correlation
between public research support and industrial R&D investment.
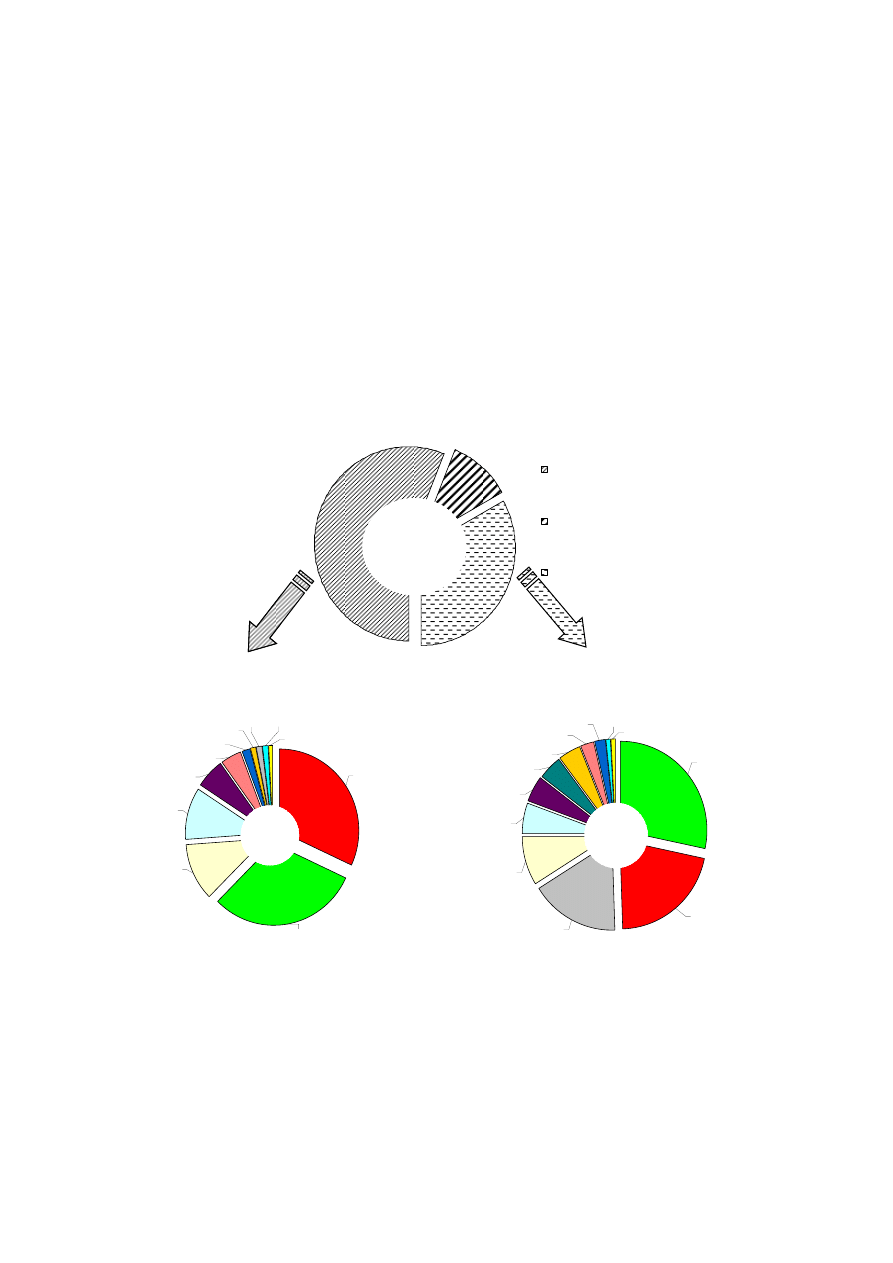
Total estimated R&D investments in SET-P priority energy
technologies
56%
11%
33%
Corporate R&D investment
(2007)
Public EU (FP6 respectively
EURATOM; annual average)
Public R&D spending of EU
Member States (2007)
~ €3.32
billion
(of which 72%
is non nuclear)
Distribution of corporate R&D investments in SET-P priority
technologies across EU Member States in 2007
(location of company headquarters)
Spain
Sweden
Others
Austria
Belgium
Finland
Italy
Denmark
UK
France
Germany
~ €1.86
billion
Distribution of public R&D investments in SET-P priority
technologies across EU Member States in 2007
Others
Denmark
Sweden
Finland
Belgium
Netherlands
Spain
UK
Italy
Germany
France
Austria
~ €1.10
billion
Figure 1:
Approximate R&D investment in SET-Plan priority technologies (nuclear and non-
nuclear) by Member State
Source: JRC-IPTS, rounded numbers
Note:
Figures are subject to uncertainties in particular for industrial R&D investments. Uncertainties become
more elevated when displaying corporate R&D investments at Member State level given that the availability of
data differed between countries. Furthermore, the regional allocation of R&D investment by site of the
registered companies' headquarters needs to be considered when interpreting the above figure.

EN
8
EN
2.
INTRODUCTION
The present report aims to provide a rough estimate of the current corporate and public
research and development (R&D) investments in low-carbon energy technologies in the EU-
27. Its ultimate objective is to offer a benchmark of their current R&D spending to serve as a
basis for the comparison with the future R&D investments that will be needed for addressing
the key technology challenges identified by the Strategic Energy Technology Plan (SET-
Plan).
The report has been prepared by the Institute for Prospective Technological Studies of the
European Commission JRC as part of the regular mapping of energy research capacities that
is being undertaken within SETIS. It has been used as an input to the forthcoming
Communication on Investing in the Development of Low Carbon Technologies . This
communication is foreseen as part of the implementation of the SET-Plan (European
Commission, 2007a; European Council, 2008). It will address options for meeting the
financing needs of low-carbon technologies. As a starting point, it will thus need to identify
the potential gap between present R&D investments and the investments required for
achieving the SET-Plan targets.
This report assesses the current R&D spending in the EU-27 allocated towards low-carbon
energy technologies. The technologies considered include those for which the SET-Plan
proposes to launch European Industrial Initiatives, i.e. wind; solar photovoltaic (PV) and
concentrating solar power (CSP); carbon dioxide capture and storage (CCS); smart grids; (2
nd
generation) transport biofuels; nuclear fission (with a focus on generation IV reactors). Two
additional technologies, for which joint activities already existed and which are mentioned in
the SET-Plan, are also assessed: hydrogen and fuel cells, and nuclear fusion. For
simplification, this group of technologies will be called 'SET-Plan priority technologies' in the
following, sometimes grouped into nuclear and non-nuclear technologies due to the distinct
research structure between the two.
For the technologies listed above, data on R&D spending by industry, the public sector and
from EU funds have been gathered
7
. However, data on corporate R&D investment are scarce.
The data situation becomes even worse when looking into R&D spending at the level of the
aforementioned technological fields. Various data sources and approaches have therefore been
tested and combined where feasible. The methodology developed for obtaining estimates of
the corporate R&D is described in detail in chapter 2 of this report. It is complemented by a
description of the data sources used with regard to public national R&D funding, i.e. the
GBAORD from Eurostat and the RD&D statistics of the International Energy Agency. For an
overview of the EU funding, the 6
th
Research Framework Programme and the EURATOM
Framework Programme have been assessed.
The results of this approach are presented and discussed in chapter 3, both for aggregates and
for individual SET-Plan priority technologies. To the extent possible, a breakdown by
Member States is shown for public funds. Moreover, investments are grouped according to
7
Note that in some cases the allocation of research investment to either industry or the public sector is
not straightforward. For example, in Denmark the electric utilities finance (via an add-on to the
electricity bill) a research programme that is publicly controlled (SRS project, 2007). Also, part of
companies' R&D expenditures may be (co-)financed with public money. The way in which this is
tackled in the present report is described in the methodological part.

EN
9
EN
the source of funds and compared to other studies where available. The chapter ends with an
analysis of the uncertainties. Chapter four draws the main policy-relevant findings from the
present data assessment. However, given the lack of data and the problems with compatibility
across different data sources, the results of this report must not be regarded as exhaustive and
comprehensive.
3.
METHODOLOGY
3.1.
Scope of the report
The objective of this report is to estimate the current public and industrial R&D investments
directed towards SET-Plan priority technologies in the EU. These comprise wind energy;
concentrating solar power (CSP) and solar photovoltaic (PV); carbon dioxide capture and
storage (CCS); smart grids; transport biofuels; hydrogen and fuel cells; nuclear fission (with a
focus on generation IV reactors); and nuclear fusion.
The assessment is focused on a single indicator representing research and development inputs:
the R&D investments. R&D outputs, such as innovation surveys or analyses of patents that
are considered valuable indicators for innovation activity (Griliches, 1990; Jaumotte and Pain,
2005), are not included.
Besides, the indicator 'R&D investments' may be too narrow for capturing the scope of
industrial R&D activities, parts of which may be conducted within departments or groups that
are not formally designated as 'R&D' departments (see Freeman and Soete, 2009 with further
references
8
). Furthermore, a considerable part of innovation in the energy sector takes place
on the side of the component supplier, i.e. new technologies are rather bought in by the energy
companies than being developed in-house (Jacquier-Roux and Bourgeois, 2002; Kaloudis and
Pedersen, 2008). Even though the approach of the present report aims at going beyond the
boundaries of the classical energy sector, it can capture this phenomenon only to a limited
extent, thus leading to a systematic under-estimation of innovation efforts related to energy.
Future work that considers major parts of the supply chains in various energy sectors might be
able to overcome this.
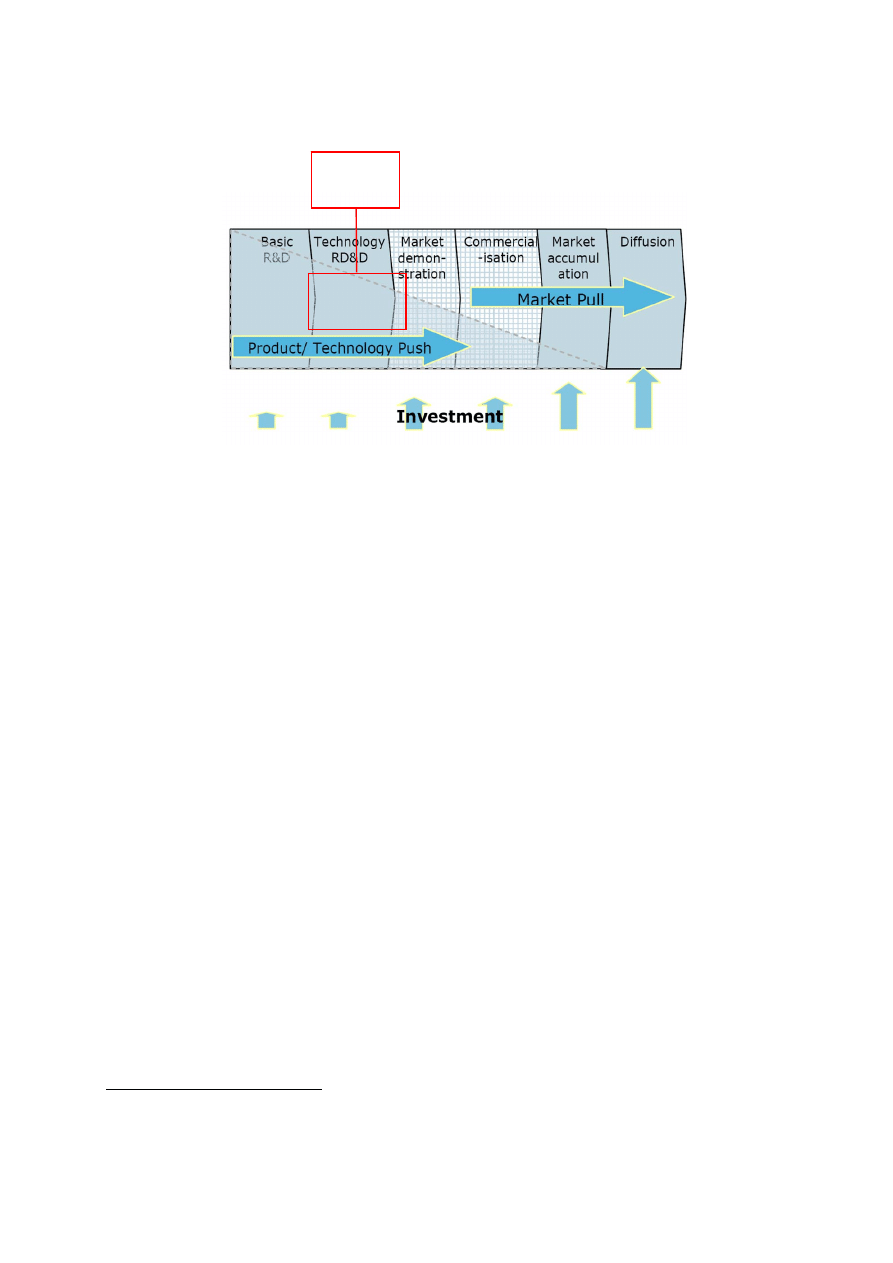
Above and beyond, innovation depends on a wide variety of factors throughout all phases of
the innovation chain, i.e. the scientific research, development and market introduction of new
technologies. Hence, a more comprehensive approach would need to consider the broader
context of 'push' and 'pull' policies and measures that address the research, development,
demonstration and deployment of innovative technologies
9
(see Figure 2), as well as
institutional capacities, the role of stakeholders, related policies and measures and their use
and interplay (see e.g. Foxon, 2003; Grubb, 2004; Kaloudis and Pedersen, 2008, chapter 5.2).
Notwithstanding the above-listed limitations of the focus on one single indicator, the present
analysis of energy-related R&D investments can help in better understanding the status quo of
8
Freeman and Soete (2009) also apply Goodhart's law (Goodhart, 1972) to Science, Technology and
Innovation Indicators: once these indicators are made policy targets, they loose much of their
information content that qualified them to play such a role.
9
Empirically, Johnstone et al. (2008) show on the basis of an assessment of exhaustive panel data on
patent applications that both, dedicated R&D spending and (quantity and price-based) 'pull-policies' are
significant determinants of patenting in renewable energy.
EN
10
EN
one central step in the innovation cycle, without claiming to provide an indication of the total
European innovation capacities with regard to SET-Plan priority technologies.
Original figure: Grubb, 2004
Scope of the
assessment
Original figure: Grubb, 2004
Scope of the
assessment
Figure 2:
Steps of technological innovation and scope of the assessment
Source: Grubb, 2004 (original figure)
But even the present assessment which focuses only on R&D investments requires an upfront
definition of the research, development and demonstration activities that it covers:
R&D covers three activities according to the Frascati Manual (OECD, 2002): basic research,
applied research, and experimental development. Basic research is experimental or theoretical
work undertaken primarily to acquire new knowledge of the underlying foundation of
phenomena and observable facts, without any particular application or use in view. Applied
research is also original investigation undertaken in order to acquire new knowledge. It is,
however, directed primarily towards a specific practical aim or objective. Experimental
development is systematic work, drawing on existing knowledge gained from research and/or
practical experience, which is directed to producing new materials, products or devices, to
installing new processes, systems and services, or to improving substantially those already
produced or installed. RD&D includes demonstration in addition.
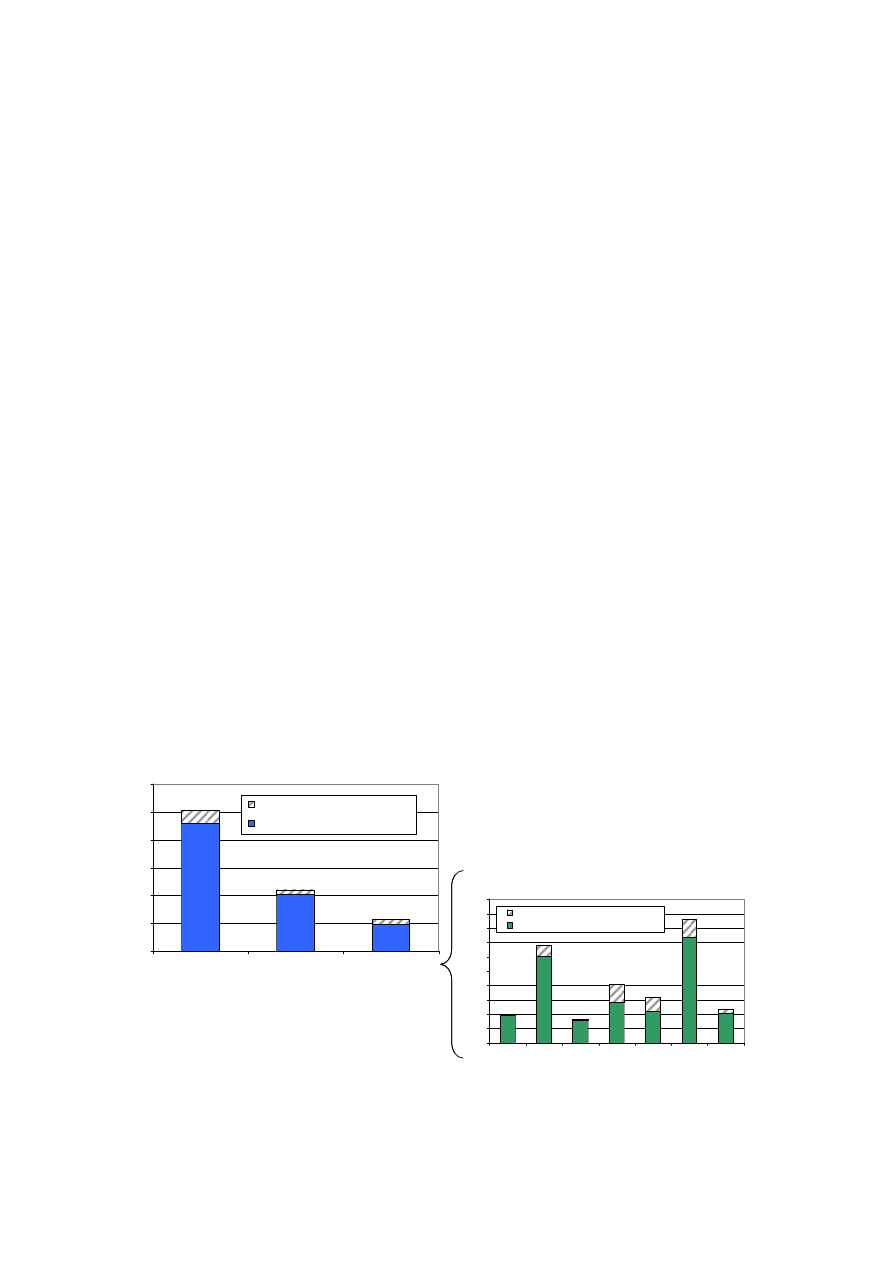
The degree to which the financing of different RD&D activities are included in the figures of
the present report differs between industrial and public national and EU funds as well as
across individual Member States
10
:
• Data on public national R&D investments of EU Member States are generally taken from
the IEA RD&D statistics (see section 1.1.1) or the GBOARD (socio-economic objective
5). While the latter focuses on R&D, the IEA also includes demonstration activities. In
practice, however, most Member States do either not provide data on funds directed
towards demonstration or do not display them separately. Hence, data on aggregated public
national funds of EU Member States dedicated to demonstration amount to some 9% of the
10
The aim of this section is to clarify the scope of RD&D covered in the present report. For a more
detailed description of the IEA database see section 1.1.1.
EN
11
EN
total energy R&D budget, only. Differences in the share of funds directed towards
demonstration occur between technologies, as illustrated in Figure 3. Given the high
amounts needed for large-scale demonstration projects and considering the data gaps, the
figure on public support to demonstration activities included in the IEA database seem to
be an under-estimation at the aggregated EU level. In the following, we thus assume that
the IEA database largely focuses on R&D (a hypothesis that is supported by the large
similarity of the aggregated EU figures with data from the GBOARD, the latter of which
focusing on R&D only). Note also that basic research shall be excluded in the IEA
database unless it is clearly oriented towards energy-related technologies. However, in
some Member States, the institutional budgets included in the submission data may
partially cover research of more basic nature.
• Regarding the EU public R&D spending, only funds within the 6
th
Research Framework
Programme have been assessed. While these indeed include some support to demonstration
activities, their main focus lies on R&D.
• For estimating industrial R&D investments, companies' annual report (largely via the 'EU
Industrial R&D Investment Scoreboard') have been used as a starting point. They thus
follow the accounting definitions of R&D, such as within the International Accounting
Standard 38 ('Intangible Assets'), which uses the definition of R&D of the Frascati Manual
(OECD, 2002). In general, technology demonstration mostly incurs engineering costs and
is thus recommended to not be included under R&D investment. However, this can be
expected to strongly depend on the type of sector/activity, influenced e.g. by the maturity
of the technology and/or the policy support to its deployment.
Following these considerations, the term R&D will be used in the following despite the fact
that demonstration activities are included to a certain extent that varies across different
funders, countries and companies. Note that even within the category 'R&D' systematic
differences may occur, for example between public and industrial research with the former
often focusing on research of a more basic nature, while industry tends to finance more
applied research.
Share of demonstration activities in the non-nuclear
SET-P technologies
0
20
40
60
80
100
120
140
160
180
200
CCS
PV
CSP
Wind
energy
Transport
biofuels
H2 and
fuel cells
Smart
Grids
€
m
illion
Demonstration (D)
Research and Development (R&D)
Public R&DD budget breakdown in 2007
(Member States only)
0
500
1000
1500
2000
2500
3000
Total Energy R&D
budget
SET-Plan
technologies
Non-nuclear SET-P
technologies
€
m
ill
ion
Demonstration (D)
Research and Development (R&D)
9%
8%
15%
1%
11%
3%
30%
11%
14%
29%
Figure 3:
Share of demonstration activities in the IEA RD&D statistics, 2007

EN
12
EN
Source: Data from IEA, gap filled and complemented with national data for DE, UK, FR, AT, BE. Irish data on
demonstration activities (year 2006) could be obtained only for the total energy R&D budgets, but not broken
down by technology.
3.2.
Industrial R&D investments
3.2.1.
Allocating companies' annual R&D investments by technology
3.2.1.1. General approach
Data on corporate R&D expenditures are difficult to obtain (see e.g. de Nigris et al., 2008;
SRS Project, 2008; van Beeck et al., 2009; Wiesenthal et al., 2008). The data become even
sketchier when looking at the R&D expenditure by technology. The difficulties can be
explained by the lack of a regulatory framework that obliges private companies to report their
R&D investment, the fact that some companies consider this information as confidential, and
that others use them for strategic purposes (Gioria, 2007).
For this reason, there is currently no single database that can provide a comprehensive
overview of industrial R&D investments dedicated to individual technologies. In order to
nevertheless gather a maximum of information, various data sources have been assessed in
parallel in this report, all of which have their own specific strengths and shortcomings. The
most promising method turned out to be a novel and assumption-based approach. It combines
data on R&D investments of individual companies, primarily taken from the EU Industrial
R&D Investment Scoreboard (Hernández Guevara et al., 2008), with additional information
about the company, thus allowing a rough estimation of a companies' R&D investment by
SET-Plan priority technology.
This bottom-up approach has thus been chosen as a first option for deriving an estimation of
the corporate R&D investments in the relevant technological fields. In brief, this approach
includes the following steps:
• The identification of key industrial players for a certain sector.
• The gathering of information on R&D investments of these companies preferably through
the EU Industrial R&D Investment Scoreboard, but also web-published annual reports or
direct contacts.
• For companies active in several technological fields (such as electrical utilities, oil
companies, component suppliers), an allocation of the R&D investments to individual
technologies to the extent possible. For companies that are specialised in one technological
field only, their entire R&D expenditure was allocated to that technology.
• The summing up of the individual companies' R&D investments by technology.
This approach has been complemented by data extracted from official databases (BERD) and
EU-financed projects (e.g. SRS NET: Scientific Reference System on new energy
technologies, energy end-use efficiency and energy RTD; and ERMINE: Electricity Research
Road Map in Europe) as well as other literature, as sketched out in Figure 4. This is described
in more detail in the following sections.

EN
13
EN
Identify key EU companies by technology
Approximate R&D expenditures by technology
YES
NO
R&D expenditure of the company
Sources: EU Industrial R&D Scoreboard; Annual Reports
Estimation for companies that are not listed on the stock exchange
Is the company
active in one
technological
field only?
Allocate 100% of its
R&D expenditures
to the relevant
technology
Allocate a certain
part of the
company’s R&D
expenditure to the
technology
Sum of R&D
expenditure by
technology
Approaches: Through direct contact;
Additional information from the company, e.g.:
Corporate Social Responsibility reports;
speeches; plans;
experts involvement;
assessment of R&D outcome (e.g. patents)
Application of R&D investments per R&D employee;
Check with ‘comparable’ companies;
Use of other studies
Sources: Experts; breakdown of a sector’s turnover by company
Additional information sources:
Eurostat BERD
SRS Project
ERMINE project
Proxies derived from turnover
New Energy Finance
☺
☺
Note:
☺ indicate the level of certainty of the step / information underlying the step
Identify key EU companies by technology
Approximate R&D expenditures by technology
YES
NO
R&D expenditure of the company
Sources: EU Industrial R&D Scoreboard; Annual Reports
Estimation for companies that are not listed on the stock exchange
Is the company
active in one
technological
field only?
Allocate 100% of its
R&D expenditures
to the relevant
technology
Allocate a certain
part of the
company’s R&D
expenditure to the
technology
Sum of R&D
expenditure by
technology
Approaches: Through direct contact;
Additional information from the company, e.g.:
Corporate Social Responsibility reports;
speeches; plans;
experts involvement;
assessment of R&D outcome (e.g. patents)
Application of R&D investments per R&D employee;
Check with ‘comparable’ companies;
Use of other studies
Sources: Experts; breakdown of a sector’s turnover by company
Sources: Experts; breakdown of a sector’s turnover by company
Additional information sources:
Eurostat BERD
SRS Project
ERMINE project
Proxies derived from turnover
New Energy Finance
☺
☺
Note:
☺ indicate the level of certainty of the step / information underlying the step
Figure
4:
Schematic overview of the methodology applied for estimating corporate R&D
investments by technology
Source: JRC-IPTS
3.2.1.2. Breaking down corporate R&D investments
As introduced above, an allocation of individual companies' annual R&D investment to the
various technologies of interest was the central approach followed in the present report.
The EU Industrial R&D Investment Scoreboard proved to be the single most important data
source for obtaining basic information on annual corporate R&D investments (Hernández
Guevara et al., 2008), which was used as a starting point for the subsequent assessment. The
data analysed relate to the companies R&D investments in 2007. The EU Industrial R&D
Investment Scoreboard provides data on investment in R&D from 2000 companies (1000 EU-
based and 1000 non-EU based). It is prepared from companies' annual audited reports and
accounts
11
. The companies are grouped by sectors of activity following the ICB classification
(Industry Classification Benchmark). Companies are allocated to the country of their
11
A general concern raised with regard to assessing R&D expenditures based on the companies' annual
reports is that the figures may include the parts financed through public budgets, thus creating problems
with double-counting (SRS project, 2007). This problem does, however, not occur for the Scoreboard
database, which only includes the R&D financed by the company as a general principle. If disclosed,
the externally funded R&D parts (i.e. by public sector as well as companies outside the group) are
deducted. In case that a company does not disclose the part of the R&D that has been externally funded,
it cannot be deducted and the public part is thus included in the company's investment, thus accepting a
slight systematic error.

EN
14
EN
registered office, which may differ from the operational or R&D headquarters in some
cases
12
.
The Scoreboard's breakdown by field of activity does not allow for the technology-oriented
grouping required for this work. Furthermore, Jacquier-Roux and Bourgeois (2002) showed
that much of the R&D efforts relevant for the energy sector are being carried out by the
supplier of energy equipment, making the energy sector a supplier-dominated sector in the
taxonomy developed by Pavitt (1984). In order to capture the R&D investments of the
different types of companies, the present report therefore had to identify a number of
companies that are considered relevant for research in a certain SET-Plan priority technology
instead of relying on existing classifications of companies (such ICB or NACE, the statistical
classification of economic activities). The assessment of the present report is thus based on
the estimation of R&D budgets from both traditional energy companies – such as 'oil and gas
producers'; 'electricity'; 'gas, water and multiutilities' following the ICB classification – and
companies that are active in sectors like 'alternative energy'; 'automobiles and parts';
'chemicals'; 'construction and materials'; 'electrical components and equipment'; 'industrial
machinery'; 'industrial metals'; and 'general industrials'.
For each of the technological fields of interest, key industrial EU-based companies have been
identified. This has been based on analyses of the various markets (e.g. through the
barometers from EUROBSERV'ER 2008a-c), expert knowledge and other sources (such as
the members of Technology Platforms or associations; companies' internet websites). Of
course, a number of companies are active in various fields simultaneously, which meant that
they figure in various 'technology groups' at the same time.
Such an approach bears the risk of missing a central player for R&D as the selection is
strongly based on the market share of companies. However, a large market share does not
necessarily imply a high R&D intensity. This is supported by the fact that innovation may
happen on the component supplier side rather than within the known energy companies. Since
the lists of companies that are considered within a certain field are not exhaustive, neglecting
minor players that might, in sum, provide a far greater R&D commitment; they tend to
underestimate the total R&D efforts dedicated to SET-Plan technologies.
Overall, a total of 136 companies were identified as central R&D investors on the SET-Plan
priority technologies, a large number of which being simultaneously active in several SET-
Plan technologies. 72 of the 136 companies identified are listed among the TOP1000 R&D
investors of the Scoreboard, allowing the direct extraction of R&D investment data. However,
for four of them, no further breakdown of the R&D investment by technology could be
performed. Some of the companies of interest are smaller overall R&D investors and
therefore do not rank among the TOP1000 R&D investors; as they are nevertheless important
for a certain (smaller) technological field, an in-depth research has been carried out by
looking at a more detailed database containing some 7000 companies, which is the basis
underlying the EU Scoreboard. Data for 12 companies was extracted from this extended
database. A web-based search provided some information for 26 additional enterprises
12
Note that the way in which corporate R&D investments are allocated to countries can significantly
influence the outcome of the analysis. The EU Industrial R&D Investment Scoreboard allocates
companies to the country of their registered office, while BERD refers to all R&D activities performed
by businesses within a particular sector and territory, regardless of the location of the business’s
headquarters. This important difference needs to be kept in mind when comparing results from different
studies one with another.

EN
15
EN
through e.g. annual reports or other information for those companies that are not listed on the
stock exchange and thus are not obliged to publish their financial report. Haug et al. (2009)
provided information for nine additional companies active in research on CSP. Combining
data from the various sources, data were available for 115 out of the 136 companies
identified.
The R&D Investment Scoreboard does not allocate the R&D investments to individual energy
technologies. For companies being active mostly in one technological field (e.g. Vestas for
wind power), one may assume that their R&D investment remains within their main field of
business activity. This has been the case for around 25 companies, for which the R&D
investments by technological field could thus be identified with a high accuracy. For another
eight companies, a very high confidence level could be obtained in the assumptions made in
the present analysis building on information from official sources (see also section 4.3).
For large companies operating in manifold areas, however, the amount of research
investments that is dedicated to a certain technology cannot be directly derived from the R&D
Investment Scoreboard. This is the case in particular for car manufacturers, oil companies,
electric utilities, and large component manufacturers. For this reason, the Scoreboard data
proved to be of more direct help in the areas of PV and wind than for CCS, biofuels or
hydrogen/fuel cells, with large multinational utilities and oil businesses being more active in
the latter fields.
For the purpose of this report, the R&D investments of multi-business companies was divided
up and allocated to the different technologies on the basis of assumptions. Companies' annual
reports and corporate sustainability reports were systematically analysed for additional
information on the breakdown of R&D investments. Moreover, the websites of individual
companies and associations were screened for further information, enhanced by free searches
that revealed e.g. presentations and speeches from company key actors or press releases. In
very few cases, newspaper articles provided helpful information. For some companies, work
that had previously been carried out at DG RTD and TREN has been used as input (Naneva
and Paschos, 2008). In addition, information from literature (New Energy Finance, 2008;
PWC et al., 2007) was used as a starting point. Furthermore, some 30 companies or industry
associations were contacted. This direct contact allowed obtaining exact figures for four large
companies, and helped to refine assumptions for another handful of companies.
In the easiest cases, this additional information revealed the allocation of the R&D investment
to the different technologies. For most companies, however, the R&D expenditures could be
narrowed down to a particular field (e.g. 'renewables') with a certain accuracy but then needed
to be further split between the various renewable energy sources based on qualitative
information. In that cases, some substantiated "guess-timates" had to be performed in order to
allocate their R&D investment to single technologies, based on information available for the
individual companies obtained through the sources described above.
This included, for example, the number of researchers by field that allowed a rough
estimation of the R&D investments by applying an average R&D investment per research
employee. Figure 5 shows information on R&D investment per research employee gathered
for 31 companies or research centres. An average investment of €120000 to €150000 per
research employee was found for 55% of them. This range was then used for further
estimates, unless more precise figures could be obtained for the specific company.

EN
16
EN
0
2
4
6
8
10
12
14
16
18
[90-120]
[120-150]
[150-180]
>180
R&D investm ent per research em ployee (in k€)
N
u
m
b
er
o
f co
m
p
an
ies
/su
b
s
id
iair
ie
s
Figure 5:
Distribution of R&D investments per research employee
Source: JRC-IPTS based on a variety of information sources
Other companies announced some future R&D investment plans, which were subsequently
"extrapolated" back to the 2007 data. In few cases, the substantiated assumptions were applied
to other, similar companies as well. Often, the R&D expenditures could be narrowed down to
a certain field (e.g. 'renewables') with a certain accuracy but then needed to be further split
between the various renewable energy sources based on qualitative information.
For some selected important R&D investors, patent applications have been used as an
indicator of the R&D breakdown. Based on the assumption that patents may reflect a
company's research effort, which is supported by assessment that show a significant
correlation between patents and R&D spending (e.g. Griliches, 1990; Jaumotte and Pain,
2005), the distribution of patents across the relevant technologies was used as a proxy for the
distribution of its R&D expenditures. Of course, linking input indicators such as energy R&D
spending to output indicators (such as patents
13
) faces a number of problems. These occur in
particular as the 'energy sector' includes a broad variety of technologies and industries with
distinct characteristics regarding the research intensity needed for a patent and the propensity
to patent. In addition, the tendency to patent may also differ across countries. As a
consequence, the average R&D intensity per patent may differ considerably across
technologies. Companies may also decide to classify or label patents in a way that makes it
difficult to detect them with the simplified patent assessment applied in this report.
Despite these general constraints regarding the use of patents, they may nevertheless be used
as a rough indicator within the scope of this report, given that studies show a strong
correlation between the number of energy-related patents granted and the energy R&D
investments (Margolis and Kammen, 1999; Johnstone et al., 2008).
14
However, it needs to be
mentioned that within the present report the patent-based approach could not be exploited in
full. For the above-mentioned reasons, this would have required an in-depth assessment of the
13
The outputs of research are manifold, ranging from the better understanding of presently used
techniques to finding new technologies and attracting public research funding (see overview table in
Ernst, H., 1998, p.3). The use of patents for measuring R&D outputs may thus fall short of the
complexity of the motivations for research, but can nevertheless be used as a suitable indicator
(Griliches et al., 1986; Griliches, 1990). However, Ernst (1998) shows that research does not
necessarily lead to more patents, but to patents of higher quality.
14
Popp (2005) shows that patents are a suitable mean for obtaining R&D activity in highly disaggregated
forms.

EN
17
EN
contents of each patent instead of using a search by keyword and the inclusion of patent
applications that were handed in by subsidiaries.
Additional information has been derived from a detailed database of EU-FP6 projects and was
used for cross-checking the R&D investment of selected companies in e.g. CCS and H2/FC.
From this, the contribution of a company within a certain technological field could be
deducted by summing up the company's contribution in all projects within a certain area.
These figures were only used for verifying that the results of the other approaches lie above it
– if that had not been the case, the estimations would have had to be revisited.
3.2.1.3. Illustration of the approach
In the following, the methodology applied in this report shall be illustrated. The 'wind energy'
sector is a representative example for an area in which the approach allows a relatively
accurate analysis.
Table 1 shows a selection of EU-based industries that are considered of outstanding
importance in the area of wind energy. For these industries, the R&D investment has been
extracted from the EU Industrial R&D Investment Scoreboard and other sources. A first
limitation of the analysis is due to the fact that some important companies are missing, such
as some large electric utilities that carry out wind energy R&D, even though one may safely
assume that much of the innovation is carried out by the component suppliers that are
included. A crucial step lies in the breakdown of the R&D budgets and the allocation of
contributions to the different technologies, as described in detail for the cases of Acciona,
Alstom, Dong Energy, EDF, Iberdrola and Siemens.

EN
18
Company name
Total R&D
investment
2007 (€m)
Assumed
share of
R&D to
wind
Assumed
R&D
investment
in wind
(€m)
Assumptions
Sources
Acciona Energy
39.02
24%
~9.5
Acciona states that €16.3m of its R&D budget (i.e. 42%) is dedicated to energy R&D.
The company is largely active in wind energy and solar (PV and CSP), but also in H2
and bioenergy (solid biomass and biofuels). Given the importance of wind energy, we
assume that slightly more than half of the energy-related R&D budget is allocated to
wind energy, i.e. €9-10m.
EU Industrial R&D Investment
Scoreboard for data on total R&D
investment; assumptions based on
Acciona's annual and corporate social
responsibility reports. Furthermore,
through direct contact the assumed R&D
break-down could be improved.
Alstom 561
4.5%
~25
Alstom is a major component supplier for power generation and transport. R&D
activities in the power sector are carried out through the two sub-sectors "Power
Systems" (mainly CCS and gas/steam turbines R&D) and "Power Services". Wind
energy would classify under the first. An analysis based on the number of researcher,
the split of turnover between the various financial sectors and literature (ZEP, 2008a),
leads to an estimated R&D investments within "Power Systems" in the order of €200-
220m. Out of this, some share would be dedicated to wind energy. As a rough guess,
we assume that some 10% of the 'Power Systems R&D' would go to wind energy
research (ca. €20m). Moreover, the Alstom Group acquired 100% of Ecotècnia in
2007, a Spanish wind turbine company. From a newspaper article (El Pais) we know
that Ecotecnia will invest around 2% of its turnover in R&D (ca. €5m). In total, we
thus assume that some €25m are dedicated to wind energy R&D.
EU Industrial R&D Investment
Scoreboard for data on total R&D
investment; assumptions based on
Alstom's annual and corporate social
responsibility reports, their websites,
patent analysis, newspaper and expert
guesses. Furthermore, through direct
contact the assumed R&D break-down
could be improved. However, figures are
not official figures from the company but
remain own estimates.
Clipper
Windpower
6.89 100% 6.9
Mostly active in wind energy, thus 100% of R&D is assumed to go to wind.
EU Industrial R&D Investment
Scoreboard
Dong Energy
64.24
20%
~13
Wind energy is central for Dong Energy. The company states that it currently accounts
for the largest proportion of wind energy in Europe and plans massive new
investments. However, coal and other renewables also play a key role for Dong
Energy: the company is very active in CCS (see e.g. Castor FP6 project) and second
generation biofuels (e.g. from straw). Furthermore, we know that Dong Energy intends
to invest around DKK350m (€46.8m) in R&D of sustainable energy, including
renewables and CCS. On this basis, we roughly assume that 1/5 of Dong Energy's
R&D budget is allocated to wind.
EU Industrial R&D Investment
Scoreboard for data on total R&D
investment; assumptions based on Dong's
annual and corporate social responsibility
reports and expert estimates.

EN
19
Company name
Total R&D
investment
2007 (€m)
Assumed
share of
R&D to
wind
Assumed
R&D
investment
in wind
(€m)
Assumptions
Sources
EDF 375
0.8%
~3
Out of the total R&D budget, EDF invested around €100m on 'environment', including
energy eco-efficiency, research into Renewable Energies, local impact of climate
change, and other studies furthering knowledge of environmental issues. Out of this,
renewables (excl. hydro) account for 9% according to official data. Based on
information of EDF's R&D efforts on PV, we estimate that around €5.5m are dedicated
to R&D on wind energy, biomass, geothermal and ocean power. Given the
perspectives of wind energy within EDF, we assume that half of that is dedicated to
wind energy research.
EU Industrial R&D Investment
Scoreboard for data on total R&D
investment; assumptions based on EdF's
annual and corporate social responsibility
reports, their websites and expert guesses.
Furthermore, through direct contact the
assumed R&D break-down could be
improved. However, figures are not
official figures from the company but
remain own estimates.
Enercon n.a.
n.a.
~17.5
Enercon's turnover was in the order of €2.4bn in 2007. According to their website,
Enercon employs around 10000 people and over 130 engineers in R&D. If we assume
R&D expenses per R&D employees to be in the typical range of €120000-150000 per
R&D staff, Enercon's R&D expenses were in the order of €15.6m to €19.5m spent in
R&D, with the central value taken for this report. However, this would mean that
Enercon's R&D intensity remains low at less than 1% of the turnover. For this reason,
the above estimate may well be an under-estimation.
Website
Internet pages
Gamesa 30.91
100%
30.9
Mostly active in wind energy, thus 100% of R&D is assumed to go to wind.
EU Industrial R&D Investment
Scoreboard

EN
20
Company name
Total R&D
investment
2007 (€m)
Assumed
share of
R&D to
wind
Assumed
R&D
investment
in wind
(€m)
Assumptions
Sources
Iberdrola 65
6.2%
~4
Iberdrola spent €65m in R&D in 2007. According to their website, Iberdrola plans to
invest €225m in R&D over the period 2008-2010 (i.e. €75m per year) on the three
following activities: 1) Renewables (€70m) and deregulated power business (€70m); 2)
Regulated business (€50m); 3) Information technology and other areas (€35m).
Considering that on the one hand, wind power plays an important role in Iberdrola's
renewables portfolio but on the other hand, Iberdrola is also active in other renewable
energy sources (such as solar thermal and biomass) and on grid integration, we assume
that 20% of the €70m announced for Renewable Energy research would go to wind
energy over the 3 years (i.e. €4.7m per year). We also know that the R&D figures
announced for 2008 (and beyond) imply a 15% increase to the 2007 figures. If we thus
assume that the 2007 wind energy R&D investment is 15% below the above-estimated
figure for 2008, the R&D investment on wind energy in 2007 can be estimated to be
some €4m.
EU Industrial R&D Investment
Scoreboard for data on total R&D
investment; assumptions based on
Iberdrola Press Release 24/03/2008 and
official reports. Furthermore, through
direct contact the assumed R&D break-
down could be improved. However,
figures are not official figures from the
company but remain own estimates.\
Nordex 17.24
100%
17.2
Mostly active in wind energy, thus 100% of R&D is assumed to go to wind.
EU Industrial R&D Investment
Scoreboard
REPower Systems
13.38
100%
13.4
Mostly active in wind energy, thus 100% of R&D is assumed to go to wind.
EU Industrial R&D Investment
Scoreboard
Siemens 3366
0.6%
~21
For SIEMENS, several approaches have been combined:
Firstly, SIEMENS annual report states that 15% (i.e. €505m) of its total R&D
investments are dedicated to energy research. The energy sector is made up of 6
divisions, one of which is the renewable energy division, including wind energy.
Knowing the total staff by division and for wind, the relation of total staff to total R&D
personnel (ca. 5.5%-9% across the various sectors) and the R&D investments per R&D
employee (€132000 per R&D employee in the energy sector), we estimate that R&D
investments dedicated to wind research may be some in the range of €16-27m (i.e. 0.5-
0.8% of total R&D).
Secondly, a research in patent databases showed that 0.5% (depatisnet) and 1.2%
(USPTO) of all SIEMENS patent applications in 2004-2006 were associated with wind
energy.
EU Industrial R&D Investment
Scoreboard for data on total R&D
investment; assumptions based on various
inputs, such as annual and corporate
social responsibility reports and work
done by Naneva and Paschos (2008);
press releases; patent application
assessment.

EN
21
Company name
Total R&D
investment
2007 (€m)
Assumed
share of
R&D to
wind
Assumed
R&D
investment
in wind
(€m)
Assumptions
Sources
Thirdly, Siemens maintains wind turbine R&D centres in Denmark, Germany, the
Netherlands, UK and the USA. For the newly opened USA centre we know that they
aim at a staff number of some 50 researchers, but currently only have 12. Assuming a
similar number of researchers for all centres would give a total number of employees
of 212 people. With an average investment of €132000 per researcher, this would mean
an R&D investment of €28m.
From the approaches above, we deduce that the share of R&D dedicated to wind may
be in the order of 0.5-0.8%. We use 0.6% as best guess, yet with high uncertainties.
Vergnet n.a.
100%
~3.7
In 2007, Vergnet's turnover was €37m out of which 10% were dedicated to R&D
activities, meaning that around €3.7m were spent in R&D for the same year. Moreover,
Vergnet had around 20 engineers in R&D in 2007 . Assuming that €150000 is spent
per R&D employee, on average, this would mean that their R&D expenses account for
€3m which is in line with the €3.7m. We assume that most of this investment was
allocated to wind energy.
Vergnet website
Oseo website (08/2008)
Vestas Wind
127
100%
127
Mostly active in wind energy, thus 100% of R&D is assumed to go to wind.
EU Industrial R&D Investment
Scoreboard
Total
~292
Table 1:
Example of the approach, illustrated for the wind energy sector
Source: JRC-IPTS based on data on total R&D investments from the EU Industrial R&D Investment Scoreboard (except for Enercon and
Vergnet). Assumptions on the share of total R&D investments dedicated to research on wind energy are based on a variety of sources,
including companies' annual reports and corporate social responsibility report as well as websites and direct contact where possible.
Note: Data on the R&D investment in wind energy are own estimates and are related to uncertainties. They do not present any official
company figure.

EN
22
EN
3.2.2.
BERD (Business enterprise sector's R&D expenditure)
In order to complement the company-based information obtained through the Industrial R&D
Investment Scoreboard, the Eurostat/OECD BERD (Business enterprise sector's R&D
expenditure) database has been searched for data on corporate R&D investment. BERD
contains figures on the business enterprise sector's expenditure in R&D, broken down by
different socio-economic objectives following the NACE (Rev 1.1) classification.
Furthermore, the expenditures are broken down by sources of funds, disaggregated into
business enterprise sector (BES), government sector (GOV), higher education sector (HES),
private non-profit sector (PNO) and abroad (ABR).
Within the present report, the energy-related BERD data have been assessed for funds from
all sources and those funds that stem from the business enterprise sector BES. The latter
would be more comparable to the central approach of this report, which assesses the corporate
R&D investments that stem from the companies' funds (to the extent that the publicly funded
parts can be identified and subtracted, see footnote 10).
Unfortunately, the NACE classification does not provide the technological breakdown
required for this report. For this reason, the BERD results on the corporate energy-related
R&D expenditures could only be used for comparison with the aggregate figure of the
analysis based on the method described in section 2.1.1. Table 2 shows those sectors that are
considered as relevant in the context of energy-related R&D as assessed in this report
15
.
The BERD database often misses data for several EU Member States at the high level of
detail that is required for this work, which makes it difficult to obtain a comprehensive
picture. In a number of cases, entries by category are not available for a certain country in the
last year, but for some years before. These gaps for 2007 were filled with the latest data
available back to the year 2003. Even though this approach leads to an error, the mistake
made seems to be smaller than assuming no R&D expenditure for those countries where
entries are missing.
15
Note that the NACE classes chosen in the present assessment comprise more categories than only
classical energy sectors (see the selection in Kaloudis and Pedersen, 2008). A broader approach was
chosen in order to also capture companies that are active in the manufacturing of energy components,
and thus enhance the comparability with the central approach of this study.

EN
23
EN
Funds from
all sectors
(€ million)
BES funds
only (€ million)
Mining and quarrying
584
191
Manufacture of coke, refined petroleum products and nuclear fuel
865 288
Manufacture of engines & turbines, except aircraft,
vehicle & cycle engines
382 58
Manufacture of electric motors, generators and transformers
554 209
Manufacture of electricity distribution and control apparatus
1029 513
Manufacture of insulated wire and cable
129 49
Manufacture of accumulators, primary cells and primary batteries
74 37
Manufacture of lighting equipment and electric lamps
416 50
Manufacture of electrical equipment n.e.c.
969 365
Electricity, gas and water supply
702 434
Total Energy-Related BERD
5703 2194
Total EU27 Business and Enterprise R&D expenditure
144089 105754
Share of energy-related over total BERD
4.0% 2.1%
Table 2:
Business and enterprise R&D expenditures in energy-related fields in 2007 aggregated
for EU Member States
Source: BERD (data retrieved in January 2009)
Note: Data gaps in 2007 have been filled with entries for 2003-2006 where necessary. Less data is available for
'funds by BES' than for 'all funds', thus distorting the aggregates.
3.2.3.
Other research projects
Two research projects were used as information sources on industrial energy R&D spending,
namely the ERMINE project
16
and the SRS NET & EEE project
17
. IPTS accessed the reports
and databases and contacted the project coordinators for clarifications.
The SRS NET & EEE (Scientific Reference System on new energy technologies, energy end-
use efficiency and energy RTD) project aimed at enhancing the availability, quality and
completeness of data on new energy technologies and energy efficiency and at producing
unbiased, validated, organised and scientifically agreed technical and economic information
on renewable and efficient technologies. As part of this work, an extensive database on R&D
expenditure was constructed.
The database contains public and private energy R&D expenditure up to the year 2005.
Private R&D data are taken from several sources such as specific studies, R&D programmes,
activity reports, etc. and are available for wind energy, CCS, H2/FC and nuclear (fission).
Note that PV is included within the "solar energy" technology.
The approach used is presented in the "R&TD Countries' Reference Report" (SRS project,
2007), which includes the name of the sources and their quality level for every Member State.
Unfortunately, data on private R&D spending are only available for a limited number of EU
countries. In some cases, this lack of data unfortunately means that countries that are central
for a given technological field are not covered.
16
http://www.ermine.cesiricerca.it/
17

EN
24
EN
For public R&D investment, the SRS project primarily used the IEA database in conjunction
with other sources such as Eurostat or various studies. See van Beeck et al. (2009) for a more
detailed overview of the project results and data gathering procedures.
Given the difficulties encountered in collecting information on private R&D efforts, one of
the project's conclusions is that "The data collection on ERTD expenditures in Europe would
be facilitated with the appointment of a European institution that ensures a systematic
collection of validated and disaggregated data on public and private ERTD expenditures. For
a comprehensive database, it is vital that such an institution has enough power and prestige,
in particular to urge companies to provide data on private expenditures."
As part of the ERMINE (Electricity Research Road Map in Europe) project, a database on
R&D expenditure in the EU electricity sector has been created based on various prime
resources and direct contact to companies (de Nigris et al., 2008). A central part of the data
collection consisted of questionnaires sent to the main actors of the EU electricity sector
(government institutes, universities, research centres, electricity companies, etc.). Public
energy R&D budgets are primarily taken from the IEA database (but calculated in euro 2004
which may explain some differences to the results of the SRS database). The ERMINE data
have been used for verifying the order of magnitude of the results of the present work to the
extent possible.
3.2.4.
New Energy Finance
New Energy Finance
18
offers an on-line desktop with information on investors and
transactions in clean energy. A core part of this service is based on an extensive database
containing information on financial transactions, such as private equity and venture capital.
Unfortunately, the database does not contain explicit data on R&D expenditure.
However, New Energy Finance recently published an analysis on R&D investments in clean
energies as part of the publication 'Global Trends in Sustainable Energy Investment 2008'
(Boyle et al., 2008) and as a Research Note (New Energy Finance, 2008). The data are based
on the information of 47 companies, mainly extracted from their annual and corporate social
responsibility reports. Similarly to the main approach used in this report (see section 2.1.1),
the R&D expenditures are allocated to the country that hosts the company's headquarters. To
the extent possible, the publicly financed part of the corporate R&D investments is subtracted
(similar to the EU Scoreboard).
According to these studies, global R&D spending into renewable energy technologies and
energy efficiency has increased slightly from 2006 to 2007 to reach a total of US$16.9 billion.
Of this, corporate R&D accounted for US$9.8 billion and public R&D for US$7.1 billion
(Boyle et al., 2008). In 2006, the EMEA (Europe, Middle East and Africa) region accounted
for US$4.8 billion of corporate research in clean energy technologies in 2006, with the largest
part coming from energy and utility companies followed by technology and automobile
sectors (New Energy Finance, 2008).
Note that the assessment done by New Energy Finance defines the category 'clean energy' in a
much broader way than how this report defines 'SET-Plan priority technologies'. The category
'clean energy' also includes energy efficiency R&D efforts as well as co-generation, but does

EN
25
EN
not include nuclear. Unfortunately, no further breakdown of clean energy research into
individual technologies has been available. However, the clean energy investments that were
provided for a number of large companies have been used as one input for the allocation of
those companies' R&D budgets to individual technologies in the present report (see section
2.1.1) and for comparing the order of magnitude of the results of the present report.
3.2.5.
Methodological outlook
The uncertainties related to the various approaches pursued in this report are described above.
In the following, suggestions are made on how to further enhance the accuracy of the
outcome:
• Firstly, and despite the methodological problems related to linking R&D output to -input
indicators (see above with further references), an in-depth analysis of companies' patent
applications may provide useful additional – yet not sufficient – information from which to
derive an indication of their R&D directions. However, such an assessment would also
need to pay attention to systematic problems such as the fact that some sectors are more
"patent-intensive" than others and that the specific R&D costs per patent differ between
technologies.
• Secondly, a company's current (and announced future) positioning across various business-
fields may provide some insights into the areas of research that could be regarded as
strategic. The Compustat database, a database of 88000 companies worldwide maintained
by Standard and Poor's, may be of use here.
• Finally and probably most importantly, a systematic and ongoing direct contact to
companies and associations beyond the scope of this report would be needed for validating
the assumptions used.

EN
26
EN
3.3.
Member States' public R&D investments
Unlike the estimation of corporate R&D investments in energy technologies, the assessment
of public energy R&D investments in Member States is primarily based on available
supranational datasets, which has been enhanced by the use of some national data which result
from the direct contact with EU Member States. The following two datasets have been used as
the principal starting points: the Eurostat GBAORD and the IEA RD&D statistics. They will
be described in more detail in the following.
The Eurostat GERD (Gross Domestic Expenditure on R&D) database
19
, which contains R&D
expenditure by R&D performers, could not be used as its breakdown does not provide the
level of detail on different energy technologies required for this report.
3.3.1.
GBAORD (Government Budget Appropriations or Outlays on R&D)
Government Budget Appropriations or Outlays on R&D are all appropriations allocated to
R&D in central government or federal budgets. It is also recommended that provincial or state
government should be included when its contribution is significant, while local government
funds should be excluded (OECD, 2002). Data are collected from government R&D funders
and maintained by Eurostat and the OECD and follows the NABS (Nomenclature for the
Analysis and Comparison of Scientific Programmes and Budgets) classification.
Socio-economic objective 5 'Production, distribution and rational utilisation of energy' is the
most relevant main category for the present report. It covers research into the production,
storage, transportation, distribution and rational use of all forms of energy. It also includes
research on processes designed to increase the efficiency of energy production and
distribution, and the study of energy conservation.
For this report, data for 2007 have been used mostly. Due to major data gaps that would have
hampered a comprehensive analysis at the EU-27 level, a simple gap filling procedure has
been applied using data from the latest available years back to the year 2003. This is noted in
detail in the notes below the figures presenting the results of this analysis.
The 4-digit level of detail provided by the GBAORD database can be considered as accurate
enough for the objectives of this report (see Table 3). Unfortunately, disaggregated data on
GBAORD energy subgroups were only available for the Czech Republic, Germany, Ireland,
Greece, Spain, Malta, the Netherlands, Romania, Slovenia and the UK
20
. This means that for
some of the major energy R&D funding Member States such as France or Italy no data is
available at this disaggregated level, inhibiting an aggregated figure on the EU-27 Member
States' public R&D investment by technology (see Figure 6).
19
GERD is maintained by Eurostat/OECD on the basis of data collected from all R&D performers. It has
a sectoral breakdown (BES: business and enterprise, GOV: government, HES: higher education; PNP:
private non-profit).
20
In the case of IE and MT the reported values are zero.
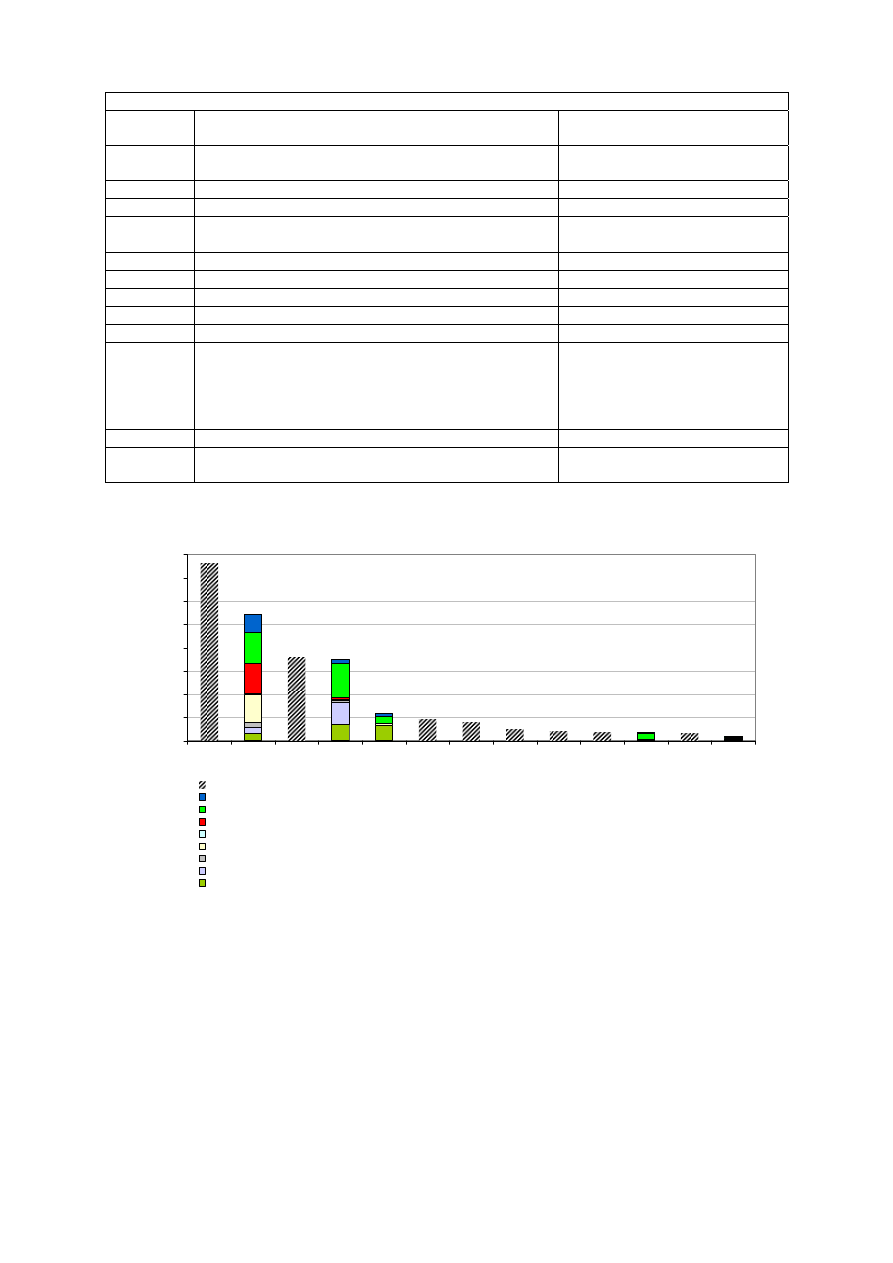
EN
27
EN
S
UBSECTORS OF
P
RODUCTION
,
DISTRIBUTION AND RATIONAL UTILISATION OF ENERGY
"
(
CATEGORY
5)
GBAORD
code
GBAORD term
Term used in this analysis
500
General research on production, distribution, and rational
utilization of energy
General research on energy
501
Fossil fuels and their derivatives
Fossil Fuels
502
Nuclear fission
Nuclear fission
503
Radioactive waste management including
decommissioning with regard to fuel/energy
Radioactive waste
504
Nuclear fusion
Nuclear fusion
505
Renewable energy sources
RES
* 5051
Solar thermal and photovoltaic energy
Solar
* 5052
Geothermal energy
Geothermal
* 5053
Water, wind and wave energy
Water, wind & wave
* 5054
Research into biomass conversion (particularly into the
areas of pyrolysis, gasification, extraction and enzyme
processing); research on the processing of waste from
industry, agriculture and the domestic sector with a view
to energy
Biomass
506
Rational utilization of energy
Rational utilisation
509
Other research on production, distribution and rational
utilization of energy
Other
Table 3:
Classification of energy-relevant sectors in GBAORD
Source: GBAORD
0
100
200
300
400
500
600
700
800
FR
DE
IT
ES
NL
SE
FI
DK
BE
HU
UK
AT
CZ
€ millio
n
Production, distribution and rational util.of energy (main category 5, no further breakdown available)
Rational utilisation of energy
Renewables
Nuclear fusion
Radioactive waste management
Nuclear fission
Fossil Fuels
Other energy subsectors
General research on energy
Figure
6
:
Distribution of energy-related R&D budgets of EU Member States, 2007
Source: GBAORD (data retrieved from Eurostat in January 2009)
Note: No data for BG. Gap-filling was applied by using 2006 data for CZ, DE, ES (all sectors) and UK (500,
501, 503, 505, 506); 2005 data for NL (501) and HU (category 5); 2004 data for SI (all sectors), UK (502, 509)
and NL (509).

EN
28
EN
3.3.2.
IEA RD&D statistics
The International Energy Agency (IEA) hosts a publicly accessible database on energy
RD&D budgets from the IEA member countries. Data is collected from government RD&D
funders.
Unlike the GBAORD, the IEA database covers demonstration activities on top of pure
research and development activities. 'Demonstration projects' are of large scale, but are not
expected to operate on a commercial basis (IEA, 2008). In practice, however, most IEA
member countries do either not provide data on funds directed towards demonstration, or do
not display them separately. As a consequence, the aggregated demonstration activities of EU
Member States that are explicitly specified us such in the IEA database amount to some 9% of
total R&D activities of these countries in 2007 (gap-filled), yet with important differences
across technologies as shown in Figure 3 (see also section 3.1 for a further clarification of the
scope covered by the present assessment). For the purpose of this report, we thus consider the
IEA data as mainly related to R&D investments.
The breakdown of the IEA R&D data follows a scientific/technical nomenclature
21
. The level
of detail more or less matches the requirements of this report. Furthermore, most countries
provided data at this high level of detail, which renders the IEA database central for this work.
Only 19 of the 27 EU Member States are IEA members. Consequently, the database
systematically contains no data for the other countries, i.e. for: Bulgaria, Cyprus, Estonia,
Latvia, Lithuania, Malta, Romania, and Slovenia. Nevertheless, the aggregated R&D budgets
of the Member States covered by the IEA database account for almost 99% of the overall EU-
27 energy budget according to GBAORD data, thus limiting the errors incurred by a lack of
data in the missing EU Member States, notwithstanding that the contributions of the excluded
Member States may be higher for individual technologies.
The latest available data are for the year 2007. Similar to the procedure applied for GBAORD
data, some straight forward 'gap filling' process was applied for the IEA data. For entries
missing for 2007, the value from the latest available year was applied down to the year 2003;
data older than 2003 were not considered. This means that IEA data for Greece (latest
available year at detailed level: 2002), and Luxembourg (2000) were neglected. In the case of
Finland and the Netherlands, mainly 2006 data have been used. For the Czech Republic and
the Slovak Republic 2003 data were used. This approach slightly distorts the overall picture
(see section 4.3), but is nevertheless justified given that the main interest of this report lies on
the aggregated EU figures. Stemming from the consultation process with Member States, it
was decided to use national figures for the year 2007 in the case of France, the UK, Germany,
Austria and Belgium
22
, either replacing the IEA figures or complementing them. In the case
of Ireland, it was decided to use official national figures for the year 2006 as proxy for the
R&D investments in the year 2007 instead of using the data from the IEA RD&D statistics.
21
See also European Commission (2005) for a comparison of energy R&D statistics in the European
Union.
22
Note that in Belgium, nuclear-related R&D (fusion and fission) is under federal responsibility namely
through the DG Energy by the FPS Economy, while administration of non-nuclear-related R&D
activities is the main responsibility of the regional governments. The non-nuclear energy R&D figures
thus are the aggregate of the regional funds.

EN
29
EN
In addition to the 2007 figures, an average of the national R&D investments over the time
span 2002-2007 is displayed in most of the charts shown in the report. This supplementary
information prevents the risk of giving too much weight to data mavericks and one-off events
while at the same time providing a longer term perspective.
3.4.
EU FP6 public energy R&D investments
European funds complement the Member States' public R&D support. The Research
Framework Programme and EURATOM Framework Programme are the key source of R&D
financing on energy technologies. Other EU funding schemes such as the Competitiveness
and Innovation Programme with its pillar Intelligent Energy Europe, the Cohesion funds,
Trans-European Networks, etc. could either not be assessed quantitatively on the level of
detail needed for this report, or were considered less relevant for research as they mainly
focus on deployment. They are mentioned in box 1.
For the purpose of this report, the expenditures
23
of the 6
th
Research Framework Programme
and the EURATOM Framework Programme 2002-2006 have been analysed. As FP6 ended in
2006, detailed data on R&D expenditures are available on a project level, which allows a
decent allocation of R&D spending to the various technology types. Such detailed data is not
yet available for FP7, thus preventing the use of FP7-figures for an in-depth assessment.
Nevertheless, some detail is provided on the evolution of energy-related R&D investments
from FP6 to FP7 to allow for an assessment of future trends. The reflections on FP7 are based
on the budget decisions taken so far.
The breakdown of the FP6 investments has not been based on the budget lines (such as
'Sustainable Energy Systems'), as this would not provide the level of detail required by the
present work. Instead, individual projects have been allocated 'manually' to the various SET-
Plan priority technologies, which allowed estimating the total EU-funded expenditures for
various technologies under FP6. The assessment systematically includes all projects funded
within of the core budget line used for energy-R&D projects (Sustainable Energy Systems); to
the extent possible it has been complemented by other energy-relevant projects that are
funded through other budget lines (e.g. 'sustainable surface transport' or 'horizontal research
activities involving SMEs') based on various publications (European Commission, 2004;
2007b-e). This allocation approach is associated with (limited) uncertainty as some projects
simultaneously address various technologies (e.g. projects on alternative motor fuels comprise
work on biofuels, H2 and natural gas; projects on integrating fluctuating renewable electricity
sources may be allocated to renewables or to grids). In those cases, a decision was taken on to
which technology the expenditures should be allocated. Even though this process creates a
potential source of error (see section 4.3.2) it is justified as it avoids a double-counting of the
budget of one single project. In future work, one may go a step further and allocate fractions
of the project budget to individual technologies; this would nevertheless require an in-depth
knowledge of the contents of each project. Despite the uncertainties related to the present
approach, a comparison with other sources (Rossetti di Valdalbero et al., 2007; European
Commission, 2007b-e; Langlois D'Estainot, 2009; EPIA, 2007; Orion Innovations, 2008;
Filiou et al., 2009) does reveal only limited differences.
Note that the analysis of EURATOM funds is based on budgets. Furthermore, not only
project-related funds have been included but also the JRC funds dedicated to nuclear energy.
23
The assessment is based on commitments, not payments.

EN
30
EN
As the EU Research Framework Programmes are of multiannual nature, while the present
report aims at presenting the EU R&D investments for the most recent year available, they
had to be broken down further in order to determine the specific budgets available for one
single year. In order to level out annual fluctuations in the budget that are due to the project
cycles, it was decided to assume an even allocation of the total expenses to every year of the
FP6 duration (the financially effective duration of FP6 was four years). The figures shown for
the EU public R&D investment thus relate to an average annual investment over the years of
the duration of FP6.
4.
RESULTS
4.1.
Overall results
Overall, the findings of this report indicate that already today, substantial R&D investments
are directed towards low-carbon energy technologies, in particular from industry. Public
research funding in EU Member States complements corporate R&D investments. However,
the share of energy-related research in the total of public research remains limited for most
Member States.
The aggregated R&D spending towards selected non-nuclear SET-Plan priority
technologies
24
amounted to €2.38 billion in 2006/7, out of which €1.66 billion originate from
corporate R&D investments in 2007, while €0.57 billion stem from public national R&D
budgets in EU Member States in 2007
25
and €0.16 billion are financed through the European
6
th
Research Framework Programme
26
69%
7%
24%
Corporate R&D investment (2007)
Public EU (FP6; annual average)
Public R&D spending of EU Member
States (2007)
ca. €2.38 billion
Figure
7
:
Indicative R&D investment in non-nuclear SET-Plan priority technologies from industry
(2007), the public national sector (2007) and EU funds through FP6 (2006)
Source: Corporate data result from the present analysis carried out by JRC-IPTS; public national data from
IEA, complemented with direct information from some Member States; EU data from FP6.
24
Technologies included are: hydrogen and fuel cells; wind energy; photovoltaics; carbon capture and
storage; biofuels; smart grids and concentrating solar power.
25
The public R&D budgets of EU Member States are taken from the IEA R&D statistics. They refer to
the year 2007, but data gaps were filled with data from earlier years back to 2003. Note that the IEA
statistics miss data for a number of EU Member States.
26
The payment commitments under the Sixth EC Framework Programme were assumed to be evenly
spread over the years of its duration. Note that the (annualised) energy-related R&D budget of FP7 is
substantially above that of FP6.
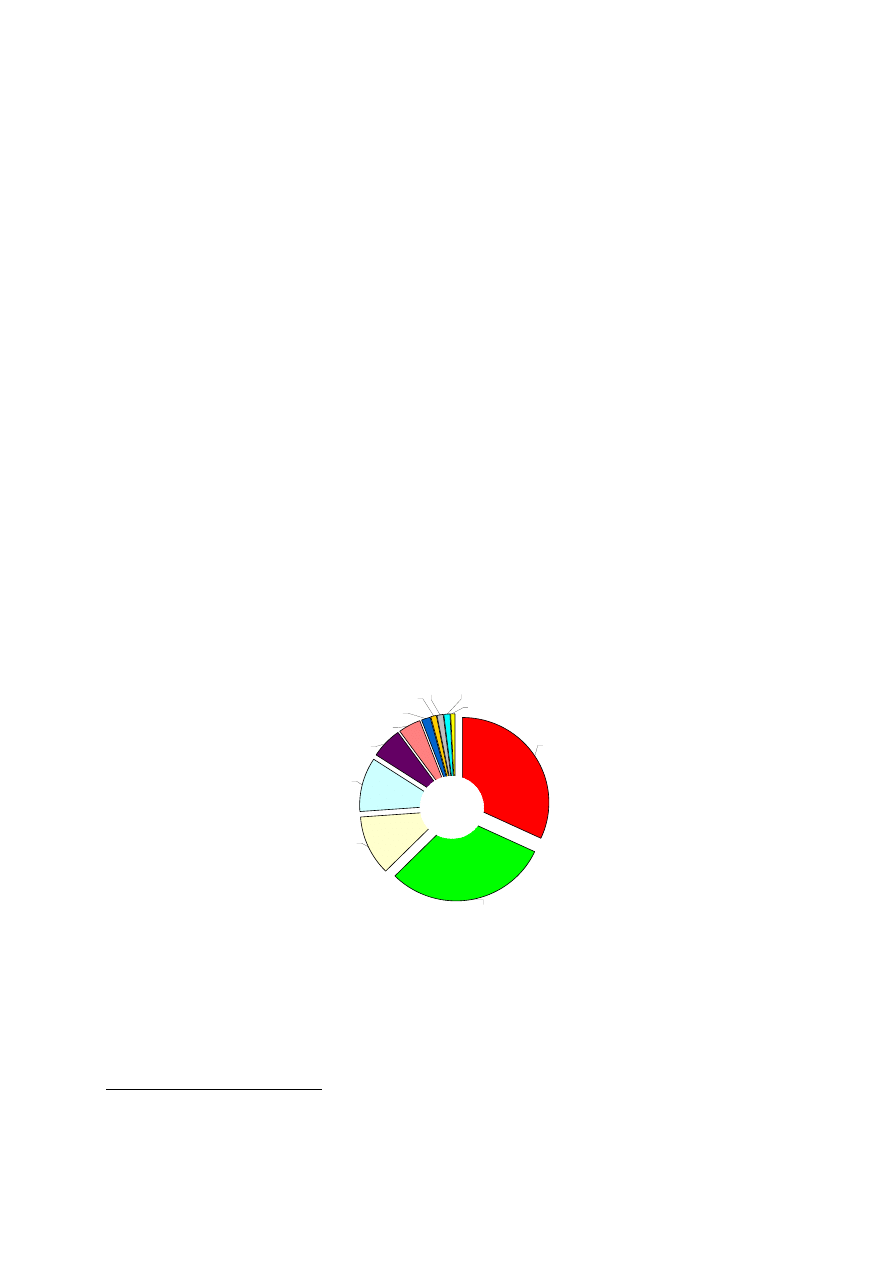
EN
31
EN
This is complemented by the nuclear R&D budget, for which no single figure can be
provided as it was not possible to narrow down R&D investments to research on generation
IV reactors, which are the focus of the nuclear fission related activities within the SET-Plan.
Nevertheless, some distinction could be made between the total nuclear-related budgets and a
limited nuclear R&D budget excluding e.g. research on environmental protection, waste
storage and safety considerations, which narrow down the nuclear research on plain reactor
technologies that are considered to include research on generation IV. Following the narrow
approach, reactor-related research investments may be around €0.46 billion, while the total
nuclear fission R&D budgets including research on all nuclear energy-related would exceed
€1.2 billion. Fusion related research adds another €0.48 billion to this figure.
The central figure taken in the following as estimate for the total R&D investments in all
(nuclear and non-nuclear) low-carbon technologies highlighted by the SET-Plan therefore
amounts to €3.3 billion.
4.1.1.
Corporate R&D investments
The central approach used in this report leads to an estimate of around €1.86 billion in 2007
of total corporate R&D investment in the low-carbon technologies considered (nuclear + non-
nuclear SET-Plan priority technologies).
27
This meant an increase in the order of magnitude
of some 15% compared to the roughly estimated R&D investment in the year 2006 (for
limitations of this comparison see box 3).
Corporate R&D investments are spread throughout most EU Member States. Nevertheless,
the headquarters of companies with a substantial R&D investment in low-carbon technologies
are largely concentrated in a few Member States, namely Germany, France, UK, Denmark,
Spain and Sweden, which together account for almost 95% of the total. Note, however, that
this picture may be distorted by uncertainties associated with the methodology applied.
Germany
France
UK
Denmark
Italy
Finland
Belgium
Austria
Others
Sweden
Spain
~ €1.9
billion
Figure 8:
Indicative regional distribution of corporate R&D investment (2007) in SET-Plan
priority technologies by countries that host the headquarters of the R&D investing
companies
Source: JRC-IPTS
Note: Figures are subject to important uncertainties. The associate to countries is done at the basis of location
of headquarters, not on the basis of location of the R&D activities.
27
This figure would rise to some €2.2 billion if all nuclear-related R&D efforts were included, i.e. also
those related to radiation safety and waste management.

EN
32
EN
Source
This report
BERD
New Energy
Finance
ERMINE
SRS
NET&EEE
Sectoral
coverage
Total selected
low-carbon
technologies
Business- and
Enterprise R&D
expenditure in
energy-related
fields
Clean Energy
R&D
Investment
including
energy
efficiency but
excl. nuclear
R&D
investments in
power
generation (all
technologies)
All private
energy
research
Geographical
coverage
EU EU EMEA
EU
EU
Corporate R&D
(€ billion)
1.9
5.7 (2.2 if only
funds by BES)
3.5 3.9 2
Table 4:
Comparison of results across various studies
Despite the uncertainties associated with the approach, a comparison to the results of other
studies (see Table 4) supports the approximate size of this outcome while at the same time it
confirms that this figure should be considered as rough estimate only.
• According to the New Energy Finance assessment, the corporate investment in clean
energy technologies amounted to around US$4.8 billion (ca. €3.5 billion) in 2006 in the
EMEA region. A large part of the discrepancy with the findings of this report may be
explained by the broader definition of clean energies applied, which comprises
substantially more technologies than the few considered in this report such as
improvements of energy efficiency, even if nuclear technologies have not been included.
The difference in the geographical boundaries may be considered as of limited importance.
• The ERMINE project found for 2004 an overall R&D investment of the EU electricity
supply industry of €1 billion and €7.5 billion of other industries. A large part of this (€3.9
billion) was attributed to R&D in the power generation sector, yet comprising all and not
only low-carbon technologies.
• According to the SRS project results, industry spent around €2 billion in energy research.
Note that the latter database contains important gaps and may thus be an underestimation.
• According to the Eurostat BERD database, the business and enterprise R&D expenditures
for various energy-related sectors amounted to €5.7 billion in 2007 (gap filled; see Table
2). Note that this aggregated figure likely constitutes a low estimate as data for some
Member States are missing at the high level of detail. In order to make these figures more
comparable to the central approach used within this report, only the R&D expenditures that
are funded by the business enterprise sector should be compared. These would amount to
around €2.2 billion for energy-related sectors. However, this is most probably an
underestimation, given that the data availability is worse for data broken down by source
of funds than for expenditures financed from all funds. If, therefore, we assumed that the
share of energy-related R&D expenditures within total BERD (4%) is similar for
investments from all funders and those from the business sector only, the business sector
funded energy-related R&D expenditures would amount to €4.2 billion. The BERD figure
would then more or less confirm the order of magnitude of the results obtained, bearing in
mind the data problems and the fact that the technologies considered in the present report
are a small but innovation-intensive subset of all energy technologies. Furthermore, unlike
the EU R&D Investment Scoreboard, the BERD figures relate to R&D investments
performed by business on a certain territory, while disregarding the geographic location of
the headquarters.

EN
33
EN
4.1.2.
Public R&D investments by Member States
Overall spending on energy R&D
The total energy-related public R&D spending in the EU Member States amounted to €2.56
billion or €2.52 billion in 2007 according to the GBAORD and IEA databases, respectively.
This amount is less than half of the energy-related public R&D budgets in 1985 due to a sharp
decline in the 1980s and early 1990s in particular of nuclear energy R&D, but is well above
the low spending of the late 1990s/early 2000s (see Figure 10).
Note that the IEA RD&D statistics and the energy-related parts of the GBAORD in theory
cannot directly be compared as the IEA database includes demonstration on top of R&D
activities. In practice, however, budgets for demonstration activities are provided only by few
IEA members, amounting to about 9% of the total on the aggregated EU level (see section
3.1).
Table 5 shows the overall energy-related R&D budget by EU Member State according to the
GBAORD and IEA Member States. It becomes obvious that public energy R&D largely
concentrates on a few Member States. The aggregated energy R&D budgets of France,
Germany and Italy account for around 65% of the aggregated budget from all Member States
according to both the GBAORD and the (modified) IEA databases. Relative to GDP, France
and Finland are spending the highest energy R&D investments among the EU Member States
(based on GBAORD data). In general, however, the differences among EU Member States are
of limited nature. Compared with the Japanese public energy R&D budget appropriations
(0.11% of GDP in 2006), the aggregated EU figure (0.02% of GDP in 2007, almost
unchanged from 2006) reveals an enormous difference in the importance attributed to energy
R&D.
Setting the energy-related part of the GBAORD in relation to the overall GBAORD can
provide an indication of the importance of energy in a country's overall research budgets. The
result is presented in Figure 9. On an EU aggregated level, the share of energy R&D in total
R&D budgets was 2.9% in 2007, with only few Member States showing a substantially higher
share (such as Hungary). This compares to a share of 15.2% in Japan and of 1.1% in the USA.
Note, however, that a comparison between individual EU Member States and Japan or the
USA is distorted due to the fact that the budgets from the EU Research Framework
Programme are not included, which can play an important role e.g. for nuclear fusion.
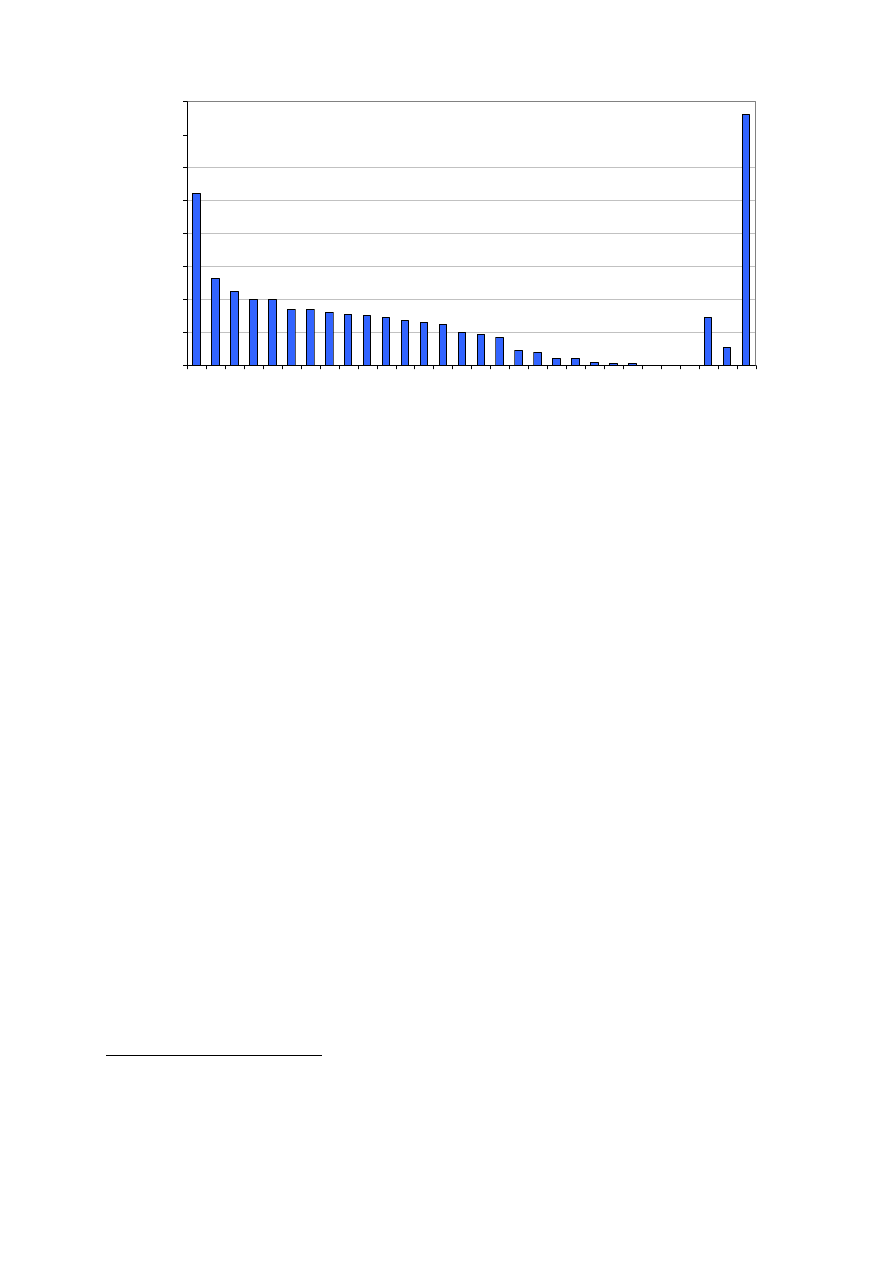
EN
34
EN
0
2
4
6
8
10
12
14
16
HU
FR
FI
IT
LV
SE
RO
LT
ES
NL
DE
DK
CZ
EE
GR
BE
AT
PT
PL
SI
LU
UK
CY
SK
IE
MT
EU27
US
JP
Pe
rc
en
ta
ge
o
f t
o
ta
l GOV
bu
dg
et
R
&
D
2.9
(2007)
4
(1990)
9.4
(1985)
*
*
*
11.6
(1982)
*
Figure
9:
Share of energy-related R&D funding (i.e. production, distribution and rational
utilisation of energy) in the overall public R&D funding in selected EU Member States,
Japan and the USA (2007)
Source: GBAORD
Table 5 reveals differences in the aggregated EU totals between the GBAORD and the IEA
databases in the order of €40 million, despite the fact that one might have assumed the IEA
figures to be larger due to their (partial) inclusion of demonstration activities on top of R&D.
Parts of the difference may be explained by the distinct regional coverage of the databases,
which stems from the fact that not all EU Member States are IEA members. Other
dissimilarities relate to the sectoral breakdowns with GBAORD following the NABS
nomenclature and the IEA a scientific/technological structure
28
. With regard to individual
countries, important discrepancies between the two databases can be observed in particular for
Spain and the UK, but also for Denmark, Germany and France. From a methodological point
of view, Table 5 illustrates the differences made by the gap-filling procedure explained in
section 2.2 and discussed further in section 4.3.2. In this report, however, a number of gaps
could be filled through direct contact with the Member States, thus reducing the need for gap
filling.
28
Moreover, even though both database ask for provincial (e.g. Länder) R&D spending to be included
when significant, there may be differences in the extent to which this data is being submitted by the
Member States. For many countries, this data is not in the data submitted to the IEA (see also section
2.2.2).

EN
35
EN
GBAORD for "Production,
distribution and rational
utilization of energy" (2007)
1) 2)
Public budget for energy RD&D, IEA (2007), gap-filled
3) 4)
€ million
% of EU total
No gap filling; 2007
data
(€
2007
million)
Gap filling up to
2003 & with
national data
( €
2007
million)
% of
total
Average
2002-07
(€
million)
% of
total
Austria 31.7
1.2% 31.9
31.9
1.3%
34.1
1.6%
Belgium 38.4
1.5%
94.3
94.3
3.7%
n.a.
n.a.
Bulgaria n.a.
n.a.
Not
IEA
member
Cyprus 0.1
0.0%
Not
IEA
member
Czech Rep.
20.2
0.8%
n.a. 7.0
0.3%
n.a.
n.a.
Denmark 47.5
1.9%
99.7
99.7
4.0%
59.3
2.8%
Estonia 1.9
0.1%
Not
IEA
member
Finland 78.1
3.0% n.a.
5)
102.9
4.1%
83.9
3.9%
France 760.1
29.7% 867.2
867.2
34.4%
847.5
39.4%
Germany 542.7
21.2%
414.4
414.4
16.4%
378.7
17.6%
Greece 13.4
0.5%
n.a.
Hungary 34.1
1.3%
5.6
5.6
0.2%
4.4
0.2%
Ireland 0.0
0.0% -
6)
16.3
0.6%
10.9
0.5%
Italy 359.5
14.0%
354.5
354.5
14.1%
326.8
15.2%
Latvia 2.7
0.1%
not
IEA
member
Lithuania 3.1
0.1%
not
IEA
member
Luxemburg 0.5
0.0%
n.a.
Malta 0.0
0.0%
not
IEA
member
Netherlands 118.5
4.6%
n.a. 147.4
5.8%
139.2
6.5%
Poland 8.2
0.3%
n.a.
Portugal 10.5
0.4%
2.0
2.0
0.1%
2.4
0.1%
Romania 14.8
0.6%
not
IEA
member
Slovak Rep.
0.2
0.0%
n.a.
Slovenia 1.0
0.0%
not
IEA
member
Spain 350.0
13.7% 70.6
70.6
2.8%
59.0
2.7%
Sweden 90.5
3.5% 87.5
87.5
3.5%
90.6
4.2%
UK 32.6
1.3%
220.8
220.8
8.8%
116.1
5.4%
Total EU
2560.3
100.0%
2248.5 2522.1
100%
2149.5
100%
US (IEA data)
2616.7
104%
2363.3
110%
JP (IEA data)
2505.8
99%
2680.8
125%
Table 5:
Total energy-related R&D budgets in EU Member States, the USA and Japan according
to the GBAORD and IEA databases
Source: GBAORD, IEA (based on data retrieved in January 2009), manipulated as described below
Notes
1) Gap-filling back to 2003, details on gap filling in the main sheet of each technology.
2) Data on GBAORD energy for HU from 2005; Data for PT, UK and IT come from 2006.
3) Gap-filling in the IEA data is the following: 2007 for DK, HU, IT, PT, ES, SE (excl. smart grids for 2003), the
US and Japan; 2006 for FI (excl. CSP for 2004), NL (excl. CSP for 2003); 2003 for CZ; No or very limited data
for SK (2003), GR (last in 2002), LU (last in 2000) and PL (no data). Note that data for the year 2007 have been
taken directly from national sources instead of the IEA for the following Member States: AT, DE, UK, FR and
BE.
4) No average values over the period 2002-2007 have been estimated for BE, CZ and GR due to limited time
series data (data available for one year only).
5) Official national data for Finland show that the total Finnish energy R&D investment increased by around
40% between 2006 and 2007 to reach €142.8 million. As, however, no official breakdown by technology could
be obtained for the year 2007, the present assessment is based on data from 2006 instead.
6) Official national figures for 2006 were used as proxy for the year 2007 (instead of using IEA data).
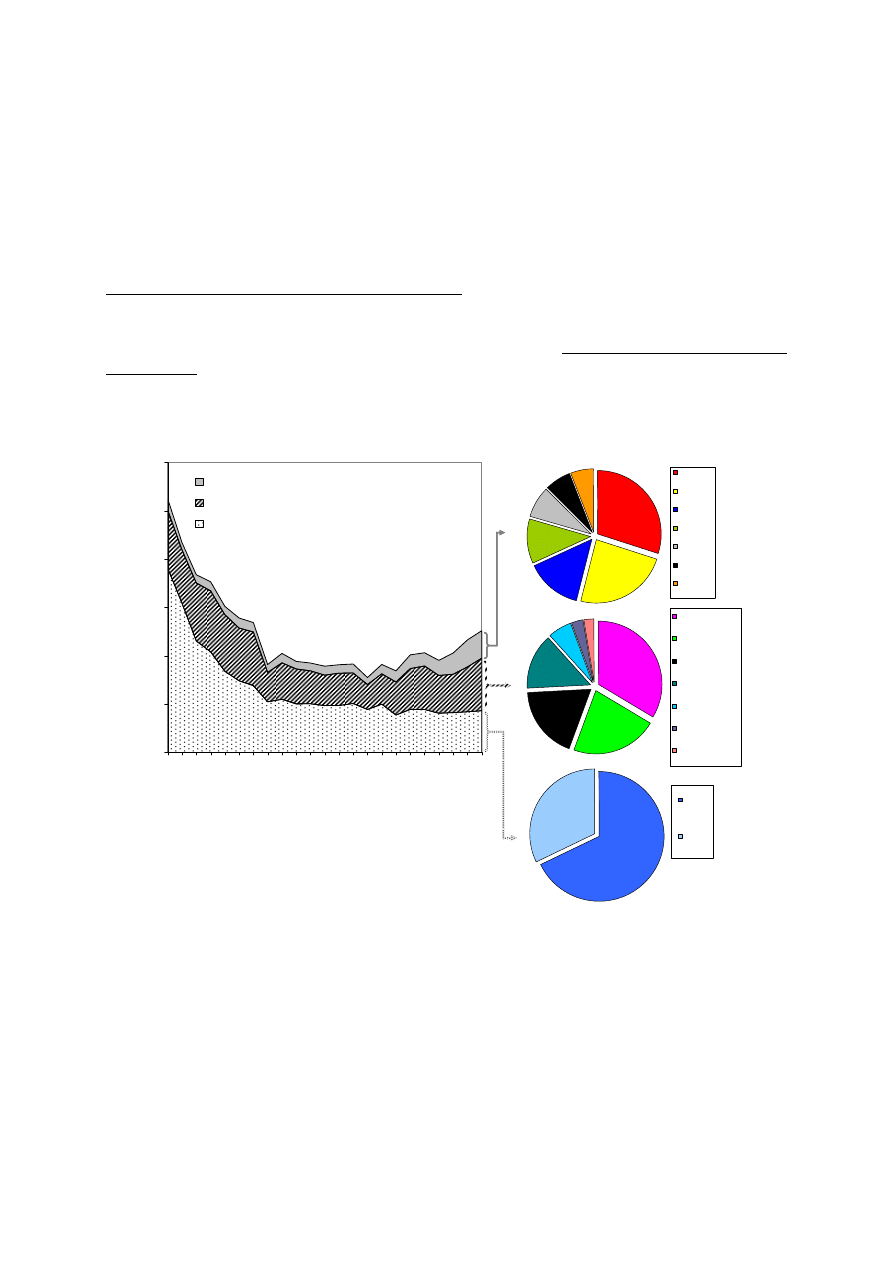
EN
36
EN
Overall, the above figures indicate that in absolute numbers public energy-related research in
the EU is still concentrated on relatively few Member States. The aggregated Member States
public energy-related R&D budget saw an increase compared to its minimum in the late
1990s/early 2000s, but still remains far below its values from two decades ago, largely due to
declining nuclear energy R&D funds. Despite the renewed increase in recent years, the share
of the EU's total budget dedicated to energy-related research (yet excluding the funds of the
EC through e.g. the Framework Programmes) was limited (2.9%) and well below its share in
the early 1980s (around 12%) or 1990 (4%).
R&D spending in SET-Plan priority technologies
Despite an overall decreasing energy research budget over the past two decades (with a slight
uptake in more recent years, see Figure 10), investments in non-nuclear SET-Plan priority
technologies have been more or less stable throughout the 1990s with an increase afterwards.
In 2007, Member States invested around €570 million in R&D related to the non-nuclear
SET-Plan priority technologies, some 35% of their total public non-nuclear energy R&D
budgets.
0
1000
2000
3000
4000
5000
6000
19
85
198
6
198
7
19
88
198
9
19
90
199
1
199
2
19
93
199
4
19
95
199
6
19
97
19
98
199
9
20
00
200
1
20
02
20
03
200
4
20
05
200
6
20
07
Aggre
g
ated publi
c
R&D budgets
(€
2007
mill
ion)
R&D to non-nuclear SET-P priority technologies
Other non-nuclear energy R&D
Nuclear energy R&D
Source data: IEA
68%
32%
Nuclear
fission
Nuclear
fusion
22%
19%
14%
6%
3% 3%
33%
Energy efficiency
RES (excl. PV,
CSP, wind, biofuels)
Fossil fuels (excl.
CCS)
Other energy R&D
Electric power
conversion
Energy system
analysis
Energy storage
30%
24%
14%
11%
8%
7%
6%
H2/FC
PV
Wind
Transport
biofuels
Smartgrids
CCS
CSP
2007 (Gap filled)
Figure 10:
Trends in the aggregated public energy R&D funding of EU Member States (1985-2007;
excluding EU funds) and detailed breakdown for the year 2007
Source: JRC-IPTS based on IEA data (retrieved in January 2009),gap filled and complemented by official
national data for some Member States
Note: The 2007 figures include the filling of data gaps with data from back to 2003. Note that no modification
was undertaken to e.g. account for differences related to the changes in the French methodology for data
between 1990 and 2002 (see also section 4.3.2), the fact that German data do not include the new Länder prior
to 1992 or missing data for Belgium for the years 2000-2006. For the year 2007, both national (DE, FR, UK,
AT, BE) and IEA data have been considered and gaps were filled for only FI, NL and CZ. For Ireland, official
national data for the year 2006 have been used instead of the 2007 figures from the IEA database. Only 19 of the
27 EU Member States are IEA members, meaning that data for 8 Member States are systematically missing; for
others, data for some years may be missing.
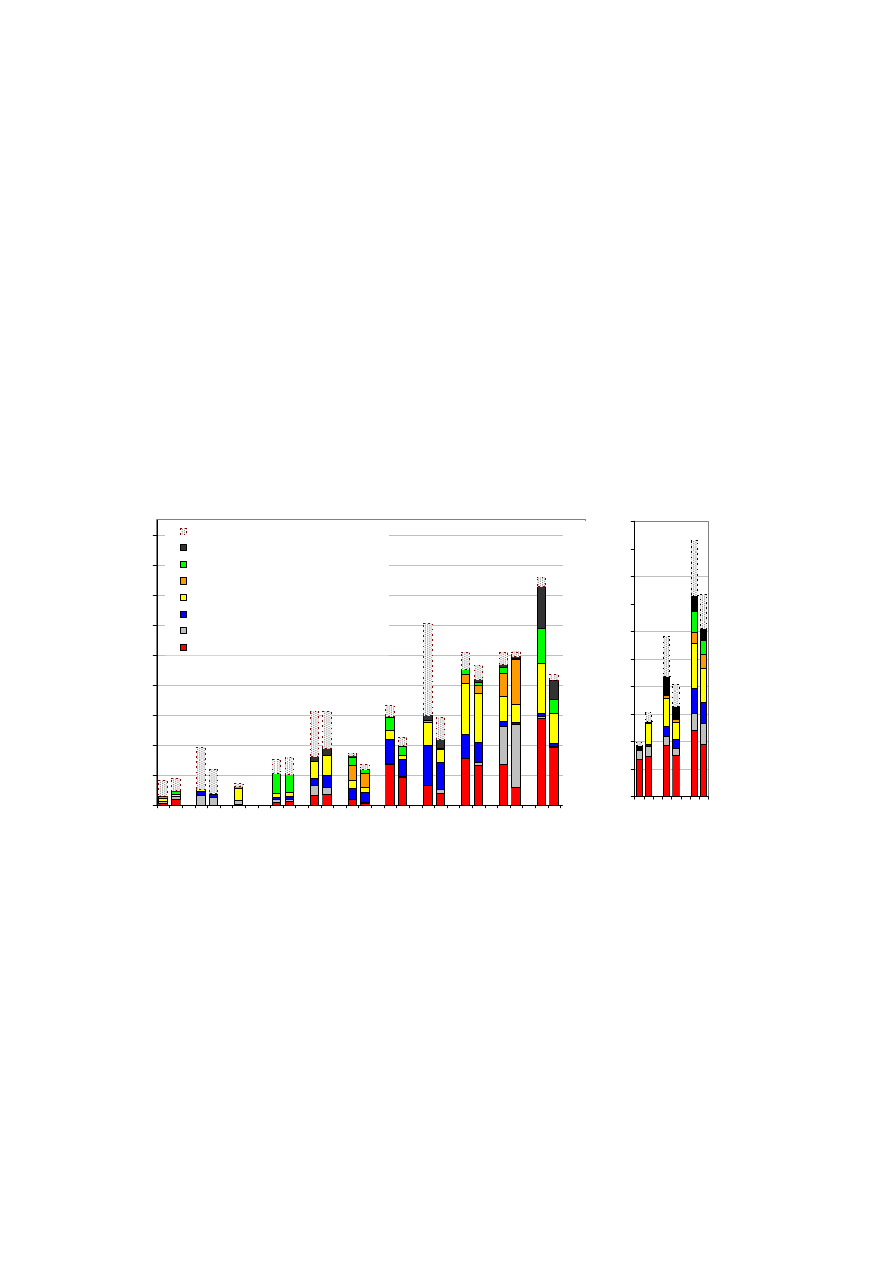
EN
37
EN
In 2007, France, Italy and Germany are the largest European public investors in the selected
non-nuclear SET-Plan priority technologies, followed by the UK, Denmark, Spain and the
Netherlands (see Figure 11). The distribution of research spending towards the individual
technologies, however, varies substantially across the Member States, reflecting different
constraints with regard to the natural potential of renewable energy technologies, the current
energy mix and its historical developments and industrial capacities.
The EU funds through FP6 (€157 million; see section 3.1.3 for more details) are in the order
of the top investing Member State. Adding those funds to the aggregated Member States
funding would bring the EU's total public R&D investment to non-nuclear SET-Plan priority
technologies to €728 million.
This would put the EU ahead of comparable R&D budgets in the USA (€437 million in the
USA) and Japan (€187 million; see Figure 11), despite the fact that both regions have slightly
higher total energy R&D budgets (see Table 5). Such a pure quantitative comparison,
however, is misleading due to the important differences in the way in which energy R&D is
being carried out in the different regions.
Public R&D spending in non-nuclear SET-P priority technologies
1- 2007 data (gap filled)
2- Annual average over the period 2002-2007
0
20
40
60
80
100
120
140
160
180
Austria
Finland Belgium SwedenNetherlands Spain
Denmark
UK
Germany
Italy
France
EU FP6
(avg per
year)
P
ubl
ic
R&D i
n
ves
tm
en
t by
technol
ogy
[€
200
7
m
ill
io
n
]
Total bioenergy minus biofuels
CO2 Capture and Storage
Transport Biofuels
Solar Thermal Power and High Temp. Apps
Photovoltaics
Wind Energy
Electricity Transm. & Distr. (Smart Grids)
H2 and Fuel cells
0
100
200
300
400
500
600
700
800
900
1000
Japan USA
EU
(MS+FP6)
1
2
1
2
1
1
1
1
1
1
1
1
2
2
2
2
2
2
2
2
2
2
1
1
2
1
1
Figure 11:
Aggregated public support to selected non-nuclear SET-Plan priority technologies of
some EU Member States (and FP6 funds), the USA and Japan
Source: JRC-IPTS based on IEA RD&D statistics, gap filled and complemented by official national data for
some Member States as described below; FP6
Note: The R&D investments of Slovakia, the Czech Republic, Portugal, Ireland and Hungary are not displayed
as they would not be visible at the scale used in this chart. They are nevertheless respected in the present
assessment.A comparison between countries suffers from data gaps as the IEA database missed data for a
number of EU Member States. Gap filling for EU applied with data from back to 2003. Older data for e.g.
Greece and Luxembourg are not included and were dismissed. Furthermore, data on regional R&D investments
are often not included. Also relevant energy R&D that is being carried under non-energy research programmes
(e.g. basic research) is not included for many countries. Data are complemented by or modified according to
national statistics in the case of Germany, France, the UK, Austria and Belgium. For Ireland, official national
data for the year 2006 have been used instead of the 2007 figures from the IEA database.The latest available
IEA data for the USA are for 2002 for PV and CSP. Hence, 2007 data were taken from US DOE (2008) and
Curtright et al. (2008). No annual average is provided for BE due to a lack of data over the period 2002-2007

EN
38
EN
(only 2007 was available).For FP6, commitments have been assessed at the project level and then annualised
over the effective duration of FP6 as described in detail in section 3.1.3.Even though the present analysis
focuses on transport biofuels rather than total bioenergy-related R&D, an indication of the latter is also
provided in the chart. This seems necessary given that many countries provide data on bioenergy research, but
not on the sub-category 'biofuels' even though it would be sensible to assume for a number of countries that a
substantial part of bioenergy research is dedicated to biofuels R&D.
Unlike the strongly focussed and coordinated energy technology policies in the USA through
the Department of Energy (DoE) and Japan through the Ministry for Economy, Trade and
Industry (METI), no single European programme exists for fostering low-carbon technologies
(with the exception of fusion related research).
Pan-European cooperation is hampered by diverse organizational structures in energy R&D,
ranging from the institutional set-up to programmes and public private partnerships
(Wiesenthal et al., 2008). Non-aligned research strategies and sometimes subcritical
capacities, the variety of national regulations and technical specifications tend to fragment the
market and inhibit industry investments in high-risk technologies. Even though a number of
recent initiatives aim at improving both the science-industry link and cooperation among
Member States, current procedures remain far away from a coherent strategic priority setting
at pan-European level that would enable to exploit synergies in energy R&D.
Recent initiatives such as the ERA-NETs have started to tackle this problem. So far, however,
NETWATCH
29
data indicate that transnational R&D co-operation in low carbon energy R&D
has been rather limited until now. Under FP6, energy R&D represented 7% of the whole
ERA-NET activity
30
, or 5 ERA-NETs in 5 different low carbon energy areas. 22 countries
have been involved: 19 EU Member States and 3 associated countries, Norway being very
active with 3 participations. In general, the EU Member States being most active in ERA-
NETs stem from the group of large energy R&D investors (see Table 5). Germany and the
Netherlands participate in all 5 co-operations, and also coordinate all energy ERA-NETs.
Sweden, Denmark, Austria, Spain, France and United Kingdom participate in 4 of them. Italy
is underrepresented with participation in only 1 energy-related ERA-NET. The new Member
States on average participate in only in 1 ERA-NET in this field, Poland leading with 2
participations and 1 observer role.
The fields covered by the FP6 ERA-NETs are photovoltaic solar energy (PV-ERA-NET),
innovative energy technologies (INNER), hydrogen and fuel cells technology (HY-CO), clean
energy fossil technologies (FENCO-ERA) and bio-energy (BIOENERGY). Most of the calls
had a clear experimental character and were used by the ERA-NETs to develop and test
possible strategies of future cooperation. Between 2006 and 2008, these five ERA-NETs
launched 11 joint calls. The time from the start of the ERA-NETs to the first call is about 2
years, which seems to be a standard in all ERA-NETs, not only in energy. Future
transnational co-operation initiatives will therefore have to take into account a certain delay in
the launch of first calls. All calls were funded through a virtual pot mode, enabling countries
and regions to apply existing national procedures and to pay for their own participants,
without trans-national flows of national funding. The budget committed by these five ERA-
NETs to the 11 joint calls has been €23.3 million, equalling a mere 4 % of the total
29
NETWATCH is a Central Information Platform on Transnational R&D Programme Collaboration,
being constructed by IPTS and contracted by DG RTD.
30
Note that for comparison purposes, other energy related ERA-NETs such as ERA-NET Transport or
ERA-Build are not included since in earlier surveys of DG-RTD they were not attributed to this
thematic field.

EN
39
EN
aggregated public budget that Member States dedicated to R&D on non-nuclear SET-Plan
priority technologies in 2007
31
.
Overall, the assessment indicates that despite important steps towards an increased
collaboration in energy research, the EU may not be using the full potential for innovation of
the internal market by exploring synergies between Member States in the development and
deployment of new energy technologies. This means that even though the sum of national
public budgets of EU Member States exceeds those of the USA and Japan, such a comparison
is misleading. The USA and Japanese market size, investment and research capacities far
exceed those of most Member States alone.
Public R&D budgets from Member States directed to nuclear-related research amount to
€0.59 billion for nuclear fission. If, for the purpose of this report with its focus on generation
IV reactors, the parts dedicated to nuclear safety, environmental protection, fissile materials
control and radiation protection
32
were not taken into consideration; the nuclear fission
'reactor technology related' R&D budget would be reduced to €0.25 billion. €0.28 billion are
invested in R&D on nuclear fusion.
The overall aggregated Member States' public spending towards SET-Plan priority
technologies in the year 2007 amount to around €1.1 billion (around half of which goes to
each nuclear and non-nuclear low-carbon technologies) thus accounting for 43% of the total
energy-related public R&D investments (i.e. not only those to low-carbon technologies).
Table 6 summarises the aggregated Member States public R&D support by SET-Plan priority
technology based on GBAORD and IEA data (with and without gap-filling for the IEA data,
indicating the importance of and risks related this type of data treatment). For information,
figures for Japan and the USA are also provided, based on the data from the IEA RD&D
database.
As in some cases Member States provided data for a main category (e.g. bioenergy), but not
for the subcategory selected for this report (e.g. transport biofuels), relevant main categories
are also included in Table 6. The additional information is useful for estimating the
uncertainty created by using data on the high level of detail. For example, the USA
significantly invests in bioenergy research, but, no data is available on biofuel-related R&D in
the IEA database. Considering the ambitious US targets on biofuels in general and second
generation biofuels in particular (ligno-cellulosic ethanol), one may assume that substantial
parts of the bioenergy research budgets are dedicated to biofuels R&D. This, however, could
not be captured with the available data
33
.
31
Note that the comparison of the total amount of all energy-related ERA-NETs calls launched under FP6
with the annual public R&D spending of Member States towards non-nuclear SET-P priority
technologies results in an overestimation of the percentage dedicated to joint calls, given that the calls
usually relate to multi-annual projects and that they were launched during the period 2006-2008.
32
These parts are summarised in the IEA category IV.1.4 'Nuclear Supporting Technology'.
33
In Figure 11 and Figure 15 this is addressed by including also the total bioenergy R&D budgets.
Furthermore, in Figure 11, estimates have been made for the PV and CSP R&D budgets despite this
data not having been available.

EN
40
EN
GBAORD 2007
IEA (EU19) 2007
IEA
R&D budget
RD&D budget
€ million
€ million
€ million
USA Japan
Categories
used in this
report
Terms by GBAORD
with gap filling
(2003-2006)
Terms by IEA
without
gap
filling
with gap
filling up
to 2003
€ million
€ million
Renewable
Energy
Sources
Renewable Energy
Sources
351
Renewable
Energy Sources
(cat. III)
469 557 304 128
Wind
Water, wind and wave
energy
15 Wind
(cat.
III.2.)
72 81
36 2
PV
Photovoltaics
(cat. III.1.2.)
123
136
101 2
CSP
Solar thermal and
photovoltaic energy
125
Solar Thermal
Power and High
Temp. Apps. (cat.
III.1.3.)
32
33
11 0
Biofuels
Production of
Transp. Biofuels
incl. from Waste
(cat. III.4.1.)
65
65
n.a. 5
Bioenergy
Research into biomass
conversion... with a
view to energy
21
Total bioenergy
(cat. III.4)
183 245 143 15
H2/FC
n.a. n.a.
H2 and fuel cells
(cat. Group V.)
164
171
183 135
Smart
Grids
n.a. n.a.
Electricity
transm. & distr.
(cat. VI.2.)
33
47
35 34
CCS
n.a. n.a.
Total CO2
Capture and
Storage ( II.3.)
36
39
71 9
Fossil fuels
Fossil fuels and their
derivatives
33
Fossil Fuels (cat.
II)
219 240 268 221
Nuclear
fission
Nuclear fission
140
Nuclear fission
(cat. IV.1.)
559 587 231
1528
Nuclear
fission:
narrow
down to
SET-P
technology
Nuclear fission
(cat. IV.1.) -
Nuclear
Supporting
Technology (cat.
IV.1.4)
231
248
153 652
Nuclear
fusion
Nuclear fusion
139
Nuclear fusion
(cat.IV.2.)
265
278
228 94
Table 6:
Aggregated public R&D support to selected energy technologies in the EU, Japan and
USA in 2007 according to GBAORD and IEA
Source: JRC-IPTS based on data from GBAORD and IEA RD&D statistics; all data downloaded in January
2009; data treated as described.
Note: Data on the selected low-carbon technologies considered in this report are put in bold letters.
Data for PV and CSP in the U.S. based on recent literature (Curtright, 2008; US DOE, 2008). Data are
complemented by national statistics in the case of Germany, France, the UK, Austria and Belgium. For Ireland,
official national data for the year 2006 have been used instead of the 2007 figures from the IEA database.

EN
41
EN
4.1.3.
Energy-related R&D investments under FP6
The most relevant budget line in FP6 for energy-related R&D projects was 'Sustainable
Energy Systems' with an allocated budget of €810 million over the period 2002-2006
34
. In
addition to the project funds, the European Commission's Joint Research Centre spent €72.6
million on the priority 'Energy' over the FP6 period (JRC, 2008). It should be noted that the
budget earmarked in FP7 for non-nuclear energy activities is €2350 million, yet over a longer
time period (2007-13). On an annual average, this nevertheless means a substantial increase.
The scope of the present analysis goes beyond the energy projects financed under the 'core'
energy budget line 'sustainable energy systems' as described in section 3.4. To the extent
possible, it also includes relevant projects funded under budget lines such as 'sustainable
surface transport' or 'horizontal research activities involving SMEs', 'Aeronautics and Space'
and 'Nanotechnologies and nanosciences'. In total, project funds stemming from 'non-core-
energy funds' add some €100 million to the R&D on SET-P priority technologies, mainly in
the areas of hydrogen and fuel cells, CSP and PV.
The total support to non-nuclear SET-Plan priority technologies through the various budget
lines of FP6 has been estimated to have been in the order of €629 million over the period
2002-2006, or €157 million on an annual average.
Complementing the FP budgets, the EURATOM framework program allocated €815.5
million to fusion activities. The total EURATOM contribution for nuclear fission-related
activities was €189.2 million. However, only a smaller part of this is dedicated to research in
new nuclear (GEN IV) reactor technologies, which are explicitly mentioned in the SET-Plan.
Those activities are mainly financed under the topic 'Innovative Concepts' (ca. €17 million)
within the budget line 'Other activities'. The JRC spent an additional €280.1 million on
nuclear energy, yet mainly not directed towards GEN IV reactors (JRC, 2008).
A broad range of other funding schemes exist, parts of which may be used for e.g.
demonstration projects of new energy technologies. Without being comprehensive, box 1
briefly describes some of them, largely based on an earlier study (DG TREN Task Force,
2008).
34
Decision 1513/2002/EC of the European Parliament and of the Council

EN
42
EN
Box 1 - Other EU financing funds
Intelligent Energy Europe has been an EU programme for the promotion of energy
efficiency and renewable energy sources. The IEE I programme lasted from 2003 to 2006. It
had a total budget of €200 million over the period 2003-2006, of which €69.8 million were
allocated to energy efficiency, €80 million to renewable energy sources, €32.6 million to
energy aspects of transport, and €17.6 million on the promotion of renewables and efficiency
at international level.A further breakdown can be obtained when assessing the commitments
under IEE I instead of the budget. Within ALTENER, commitments to Renewables for
Electricity Generation amounted to €18.6 million, to Renewables for Heating and Cooling to
€16.6 million and for Small Renewables to €15.9 million; commitments to biofuels
accumulated to €10.5 million. The IEE II programme started in 2007 as part of the €3.6
billion Competitiveness and Innovation Framework Programme. It will last to 2013.
Altogether, around €727 million will be available to fund projects for the promotion of
energy efficiency and renewable energy. This implies a doubling of the average annual
budget compared to the IEE I Programme.
Within the Cohesion Policy, support to energy-related R&D activities takes place in various
forms. Firstly, within the Cohesion Policy €49.9 billion are allocated for supporting Research
and Technological Innovation over the period 2007-2013, parts of which apply to the
technologies and actors considered here. In addition, these funds will help to improve the
research infrastructure in general, supporting e.g. R&D activities in research centres,
technology transfer and cooperation activities. Secondly, €9 billion are allocated to support
renewables and energy efficiency over the same period, mainly focusing on demonstration
and deployment. In the context of the Cohesion Policy initiatives to support the European
Economic Recovery Package, an amendment has been adopted to the European Regional
Development Fund to allow energy efficiency and renewables interventions in residential
buildings in all EU Member States. This opens the possibility for Member States to reallocate
a further €8 billion to these types of investments. Finally, Cohesion Policy funds can also use
innovative financing mechanisms to increase the leverage of public investments and
encourage private sector participation. Examples of this are JESSICA and JASPERS that can
both support energy investments with Cohesion Policy funds with the collaboration of the
EIB among other international institutions.
The Trans-European Networks 'Energy' are used for promoting electricity and gas
infrastructure projects. With regard to low-carbon energies, they may play a role for e.g.
financing offshore wind connections or of reserve capacities and smart grids for a better
integration of fluctuating renewable energy carriers.
The last reform of the Common Agricultural Policy decided in November 2008, known as
'Health Check', shifts funds from direct aid to farmers into Rural Development funding
through the European Agricultural Fund for Rural Development (EAFRD). The additional
funding obtained for five identified "new challenges", including climate change and
renewable energy, totals 8.2 billion Euros for 2010-2013.
4.2.
R&D investments by SET-P priority technology
In the following, the results of the assessment shall be presented at the basis of the individual
low-carbon technologies that are the focus of this report. The assessment of the public
national R&D budgets of Member States largely relies on the IEA RD&D statistics, thus

EN
43
EN
lacking information about a number of EU Member States (see section 1.1.1). Due to the
limited data availability described above, it was also not always possible to narrow the
industry's research investment down to definite figures in the individual technologies. This
means that when comparing e.g. the R&D investments by technology fields, it should be kept
in mind that the uncertainties might be larger than the differences between the investments.
All in all, it is likely that the approach followed leads to an under-estimation of the corporate
R&D investments, stemming from the fact that only a limited number of companies could be
considered for each sector, and due to missing data that sometimes did not allow an educated
estimation for some of the companies (see section 3.2.1).
In general, data for PV, wind and concentrating solar power are more robust than those for
H2/FC, biofuels and CCS. This is due to the fact that in prior fields, a substantial number of
companies are specialised in this technology only; therefore their total R&D investment could
be assumed to be spent on those technologies, thus reducing the uncertainty (see section 4.3).
The figures on R&D investment for Smart Grids should be considered as particularly
uncertain as research in this area is often subsumed under headings on a more general level;
besides, no comprehensive list of key actors could be generated for this sector.
4.2.1.
Wind energy
Europe is leading in wind energy, holding a 61% share of the globally installed wind energy
capacity in 2007 (EUROBSERV'ER, 2008a). Given the high global investments in this
technology (around US$50 billion in 2007; Boyle et al., 2008), it is not surprising that
research investments in the EU reached €383 million in 2007.
With wind energy in general being considered a rather mature technology, R&D investments
are clearly dominated by industry, accounting for three quarters of the total. The comparably
elevated maturity of wind energy would also be supported by wind energy showing the largest
share of support to demonstration activities within the aggregated national R&D investments
across all technologies considered (see Figure 3 and section 3.1 for a further explanation of
the limitations of the underlying data).
Both corporate and public investments mostly occurred in those EU Member States that have
a large wind energy share and industry (Germany, Denmark or Spain). The large public
budgets of other Member States may be explained by plans that aim at actively increasing
their wind energy share, such as the UK with ambitious offshore wind plans. However, even
if the above Member States accounted for some 90% of the EU aggregated funds, also other
Member States such as Italy, Sweden or France invested in wind energy related research. The
EU funds that were dedicated to wind energy projects within FP6 remained limited.
Compared to the year 2006, the estimated corporate R&D investments in wind energy
increased significantly (by an order of magnitude above 20%) to reach €292 million in 2007
while public national funds showed a small decrease (-7%). The EU funds under FP6
amounted to around €43 million over the period 2002-6 (or €11 million on an annual
average), a figure which is similar to the one estimated by Langlois d'Estainot (2009).
The aggregated R&D investment of EU-based companies (€292 million in 2007) is the result
of an assessment of 13 companies. Companies being entirely or mostly active in this sector
such as Vestas, Gamesa, Enercon, Nordex and RE Power are among the largest investors.
This figure of €292 million compares relatively well to the results of other studies:
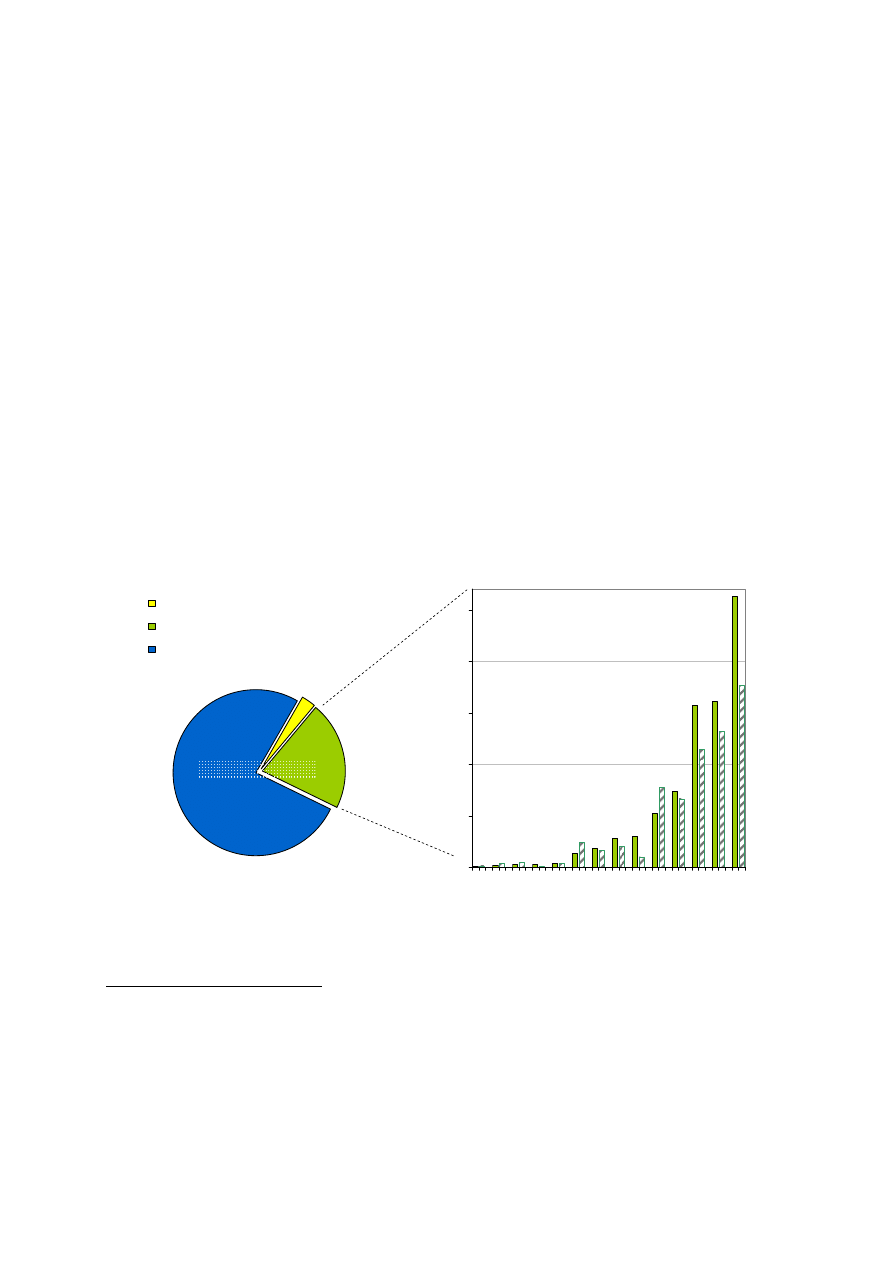
EN
44
EN
• The Technology Platform Wind assumed corporate R&D investments of a set of 6 selected
companies to be in the order of €175 million in 2006
35
(TP Wind, 2008), based on an
approach similar to the one used here. The differences to the present report can be
accounted for by the extended research scope of the present study, covering 13 companies.
• The SRS project estimated the corporate R&D investment allocated to wind energy to be in
the order of €110 million for 2005. The discrepancy to the assessment in the present report
may be explained by the lack of data for countries with an important wind industry (such
as Germany and Spain). Furthermore, the R&D investments of the wind industry have
been growing substantially in recent years, explaining another part of the differences in the
results of the SRS and the present report.
• The comparison of the corporate R&D investments with the turnover of the European wind
energy sector further confirms the result of this work. Assuming its turnover to have been
in the order of €11.3 billion
36
(Zervos et al., 2008), the results of the present report would
thus indicate an R&D intensity of this sector of 2.6%-3.0%. This is considerably above the
low R&D intensities of companies active in the electricity sector (0.6%) and oil and gas
producers (0.3%) and in the order of magnitude of producers of electrical components and
equipment (3.4%) and industrial machinery (2.6%) (Hernandez et al., 2008). Considering
that the selection of companies associated with research on wind energy made in the
present report consists of companies from all of the above sectors with a focus on
component suppliers and specialised wind energy turbine producers, this comparison
supports the finding of the present assessment
37
.
0
5
10
15
20
25
HU AT IE PT CZ SE FR FI
IT NL ES DK DE UK
€ mi
ll
io
n
3%
21%
76%
Public EU (FP6, annual average)
Public R&D spending of EU MS (2007)
Corporate R&D investment (2007)
1 2 1
1
1
1
1
1
1
1
1
1
1
1
1
2
2
2
2
2
2
2
2
2
2
2
2
ca. €383 million
2
1- 2007 data (gap-filled)
2- Annual average over the period 2002-2007
Figure 12:
Approximate R&D investment in wind energy from industry and public sectors
Source: JRC-IPTS based on IEA RD&D statistics and official information from some Member States; FP6; EU
Industrial R&D Investment Scoreboard
35
Data are corrected from the original report as Nordex had been counted twice.
36
The turnover of the European wind industry was estimated to have been around €9 billion in 2006
(EWEA, 2007). Extrapolating this into 2007 would result in an approximate turnover of €10 billion
(EUROBSERV'ER, 2008a), supporting the figure provided by Zervos et al., 2008.
37
From this comparison one cannot derive whether the R&D intensity of the sector is sufficient or not.
For deriving such a conclusion, it may be more appropriate to compare with R&D intensities of other
rapidly developing sectors as done in chapter 5 despite some methodological problems that may arise
when linking distinct sectors with different innovation systems.
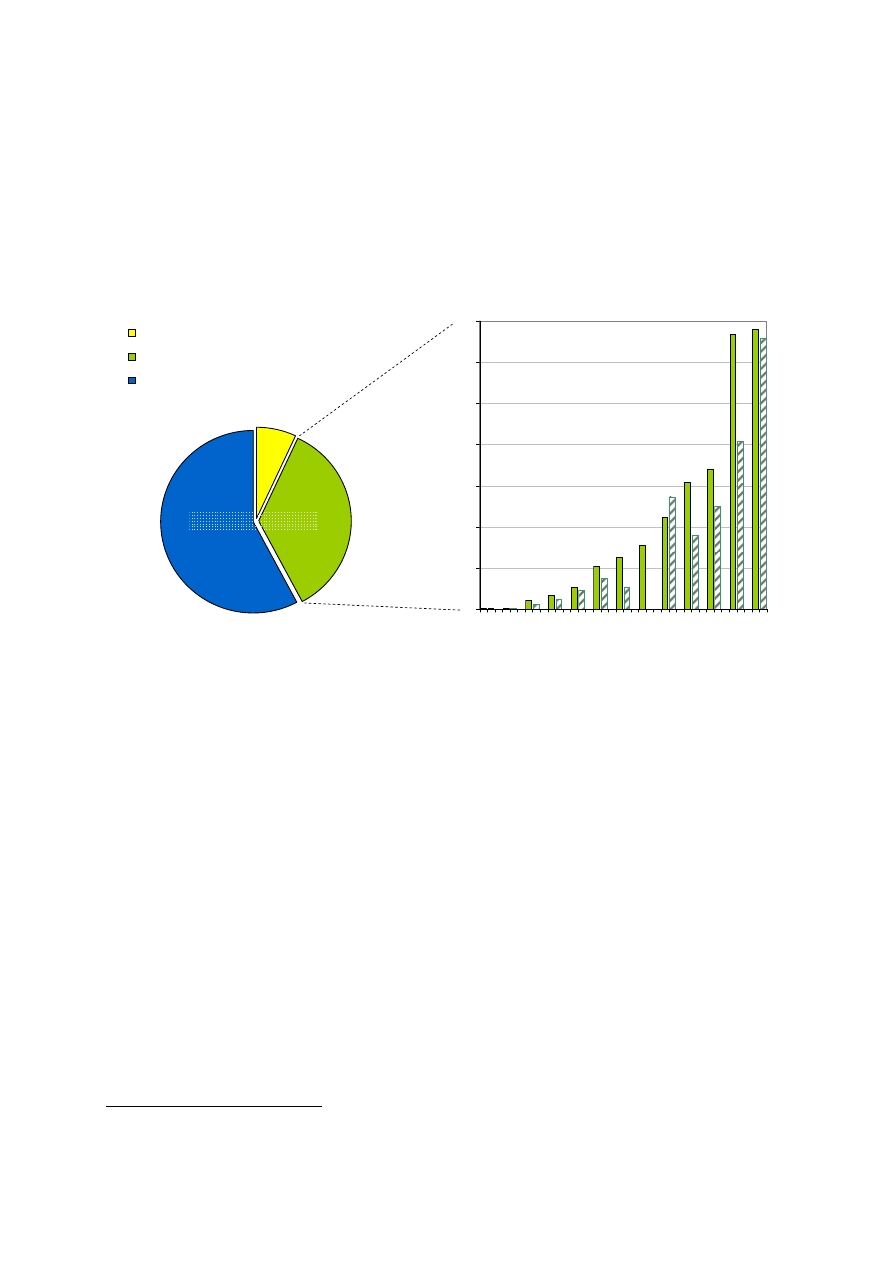
EN
45
EN
Note: Some EU Member States are not IEA member and do thus not figure in the database; for others no data
are available. Irish data refer to the year 2006. R&D investments for Belgium cannot be displayed at the current
scale of the chart.
4.2.2.
Photovoltaics
The aggregated research investments in photovoltaic technologies are estimated to have been
€384 million in 2007. The data indicate that public funds account for a substantial share
(42%), and even so may not yet fully reflect all PV-related spending in large national
institutes which partially is not included in the data collected in the IEA RD&D statistics (see
section 1.1.1). Compared to the year 2006 public national funds increased by almost 15%.
0
5
10
15
20
25
30
35
PT
IE
FI
AT SE ES DK BE NL UK
IT
FR DE
€ m
illi
o
n
7%
35%
58%
Public EU (FP6, annual average)
Public R&D spending of EU MS (2007)
Corporate R&D investment (2007)
1
1
1
1
1
1
1
1
1
1
1
2
2
2
2
2
2
2
2
2
2
2
ca. €384 million
1
1- 2007 data (gap-filled)
2- Annual average over the period 2002-2007
1
2
Figure 13:
Approximate R&D investment in photovoltaics from industry and public sectors
Source: JRC-IPTS based on IEA RD&D statistics and official information from some Member States; FP6; EU
Industrial R&D Investment Scoreboard
Note: Some EU Member States are not IEA member and do thus not figure in the database; for others no data
are available. No annual average estimated for Belgium due to a limited number of data; Irish data refer to the
year 2006.
The funds spent through the EC FP6 are in the order of 17% of the aggregated Member States
national public funds (see Figure 13). On an annual average over the duration of FP6, they
were €27 million, or €108 million over the entire FP6 period. This result of the present
project-based assessment of EU funds is fully in line with figures provided by EPIA (2007)
and Menna et al. (2007).
Most of the public funds originated from countries with a comparably high deployment of
PV, such as Germany, France, Italy, and the Netherlands. Despite a limited deployment of PV
in the UK, British public R&D investments are relatively high while the opposite is the case
for Spain. Most of the EU corporate R&D investments in PV stem from companies with
headquarters in Germany, France, Spain and the UK.
The Spanish data presents a contrast in that on the one hand, the country has an excellent solar
resource, and combines a favourable deployment scheme with high growth rates in installed
PV capacities
38
, while on the other the public and corporate research budgets are relatively
38
In 2007, it ranked second among EU Member States in terms of installed PV capacity.

EN
46
EN
low. This may partly be explained by the use of imported technology. Also PV has become a
priority in the Spanish national energy strategy only recently, and would thus impact on future
R&D budgets but would not yet be reflected in R&D budgets that are the results of decisions
taken some years before.
Only 4 (Q-cells, Solarworld, BP Solar, Isofoton) of the top 15 manufacturers of PV modules
are located in the EU and the EU correspondingly produced 28.5% of global PV cells
(EUROBSERVER, 2008b). At the same time, given the high growth rates of the global PV
market in recent years and its potentials for further expansion, the sector has become
attractive for a number of non-specialised multi-business companies (such as Siemens, Shell,
BASF, Schott and Total) and saw a corporate R&D investment of €221 million in 2007 in the
EU, well above comparable figures for the year 2006 (an increase of more than 20%). This is
the result of the assessment of 30 key companies in this sector, for which data could be
obtained. Unfortunately, for some important companies, no data could be acquired
39
.
However, a comparison with other studies endorses the findings obtained with the present
approach:
• In particular, according to an estimate published by the German Association of solar
industry (Bundesverband Solarwirtschaft BSW) the German PV industry invested €176
million in R&D in 2007, out of which €150 million came from the dedicated PV industry
and business units and another €26 million from suppliers (Ruhl et al., 2008
40
). This R&D
investment from 'industry' (€150 million) can be compared to the R&D investment of
companies considered in the present report with headquarters in Germany, which
amounted to €118 million in 2007. This reveals reasonable accordance between the two
studies, in particular when one considers that the German approach assesses the R&D
investment of both German and foreign enterprises in Germany (this latter part is not
covered by the approach applied in the present report) and that the company assessment
approach used here was not fully complete as noted above.
• Compared to the turnover of the EU PV sector, which was around €9-10 billion in 2007
(EPIA personal communication; EUROBSERV'ER, 2008b), the estimated R&D intensity
is 2.2-2.5%. Given that the assessment includes a mix of companies with one part coming
from less R&D intensive sectors with R&D intensities below 1% (e.g. construction and
materials, oil and gas producers and electric utilities) and the from sectors with R&D
intensities of the order of 2% to 4% (chemicals, electrical components and alternative
energy), the R&D intensity found for PV would support the finding of the analysis.
4.2.3.
Concentrating solar power
CSP-related research spending (approx. €86 million) was relatively limited in 2007 compared
with other SET-Plan priority technologies, reflecting the fact that interest in this field has
started growing again only relatively recently. The potential locations of CSP plants are
focused in the countries around the Mediterranean and as such, it is not surprising that public
R&D support is dominated by Italy and Spain, accounting for more than three quarters of the
aggregated EU Member States funds (see Figure 14).
39
For another 7 companies that were identified as important players, no figures could be obtained.
40
The study was also used for verifying that all major companies were included in the present work.
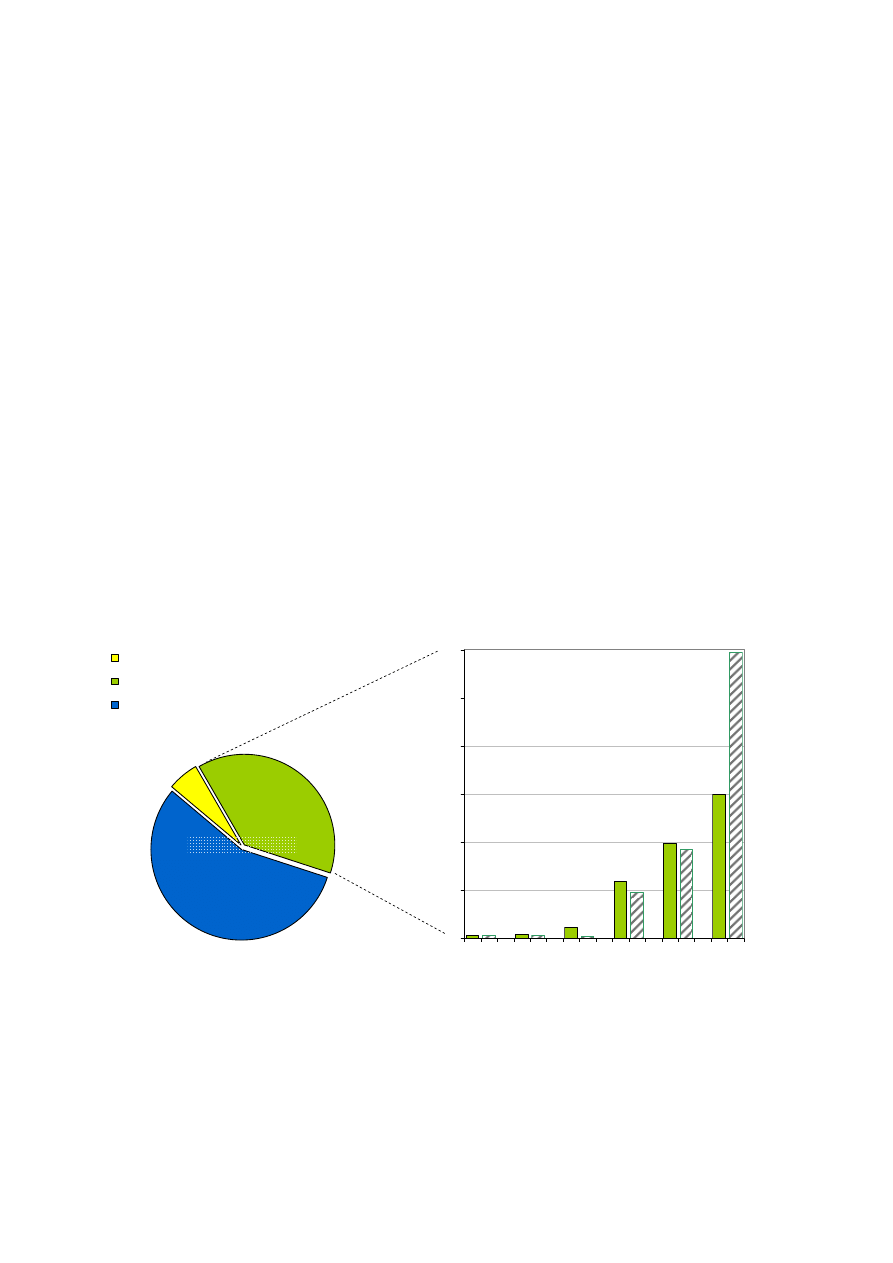
EN
47
EN
The German contribution to CSP-research amounts to another 18% of the EU Member States'
public aggregated investment, which may be explained by the strong position of German
industry in this technological field. This means that three Member States i.e. Italy, Spain and
Germany account for around 95% of the total public R&D investment in this technology. It is
noted, however, that these figures may not fully reflect CSP-related R&D spending in French
national R&D centres.
The EU support to CSP-related R&D activities through FP6 funds as assessed in the present
report reached €20 million over the FP6 duration (or €5 million on an annual average). This
figure is slightly below the investments of €25 million published in European Commission
(2007d), which can partly be explained by the fact that some CSP-related projects have been
allocated to other SET-Plan priority technologies in order to avoid double counting.
Corporate R&D investments (around €50 million) accounted for 56% of the overall spending,
led by companies based in Spain and Germany, followed by Italian and French companies.
Spanish and German companies are the main actors involved in the ongoing demonstration
projects launched in Spain, supported by the national feed-in programme. The estimation of
the corporate R&D investment relies on the assessment of 18 larger companies for which data
could be obtained. The assumptions for these companies have been checked with and revised
in line with an in-depth assessment of this sector (Haug et al., 2009), which also provided
aggregated information on a number of smaller companies that were as well included in the
present assessment. As a consequence, the estimation of corporate R&D investments of this
report is rather well in line with the findings of €52.5 million in Haug et al. (2009). Note,
however, that this should be considered as a low estimate. The uncertainties related with the
estimation of R&D investments for the year 2006 do not allow for an indication of the trend
in corporate R&D investments in this sector.
0
5
10
15
20
25
30
DK
FI
UK
DE
ES
IT
€ mil
lio
n
6%
38%
56%
Public EU (FP6, annual average)
Public R&D spending of EU MS (2007)
Corporate R&D investment (2007)
ca. €86 million
1
1
1
1
1
1
2
2
2
2
2
2
1- 2007 data (gap-filled)
2- Annual average over the period 2002-2007
Figure 14:
Approximate R&D investment in CSP from industry and public sectors
Source: JRC-IPTS based on IEA RD&D statistics and official information from some Member States; FP6; EU
Industrial R&D Investment Scoreboard
Note: Some EU Member States are not IEA member and do thus not figure in the database; for others no data
are available. R&D investments for Austria cannot be displayed at the current scale of the chart.

EN
48
EN
4.2.4.
Biofuels
Transport biofuels have become a priority in the EU policy over the past years with a rapidly
growing market. This is reflected by an important research budget of €347 million in 2007.
Note that this figure is not restricted to research into 2
nd
generation biofuel production
pathways that are a priority within the SET-Plan, but comprises all transport biofuel
technologies. Unlike for many other technologies, the Member States with the largest public
R&D budgets in many cases do not coincide with the countries that host the headquarters of
biofuel-research intensive companies.
The public share of R&D investments remains low with only 23% of the total budget (see
Figure 15). EU funds through FP6 amounted to around €13.5 million on an annual average,
which compares well to the assessment in Kutas et al. (2007). The limited share of public
R&D investments may not only be due to the relatively elevated maturity of biofuels, but may
also be explained by data restrictions:
• Public research budgets for first generation biofuels would naturally be limited considering
the maturity of these technologies. However, due to the potential negative impact of these
starch- or oil-based fuels on food prices and the environment, advanced biofuel processes
are increasingly being considered as the more promising future pathways. As research into
those '2
nd
generation biofuels' has only recently become a (public) priority, it is reasonable
to assume that it is not yet fully reflected in the national R&D budgets that are based on
budget decisions taken some years ago.
• Furthermore, the data suggest that some Member States may not explicitly disclose R&D
on biofuels, but rather allocate it under the category bioenergy-related research. In 2007,
the total R&D investment in bioenergy for the EU Member States reaches €245 million of
which only €65 million is allocated to transport biofuels. For this reason, the overall
bioenergy-related public national research budgets are also shown in Figure 15.
Corporate R&D investments into biofuels are €269 million, based on an assessment of the
R&D expenditures of 23 companies. Compared to the roughly estimated 2006 figures, this
would mean an increase of some 10% to 20% (note the uncertainties related to such a
comparison as explained in box 3). The companies included in the analysis consist of
specialised biofuel companies, large car manufacturers and oil companies, with the latter two
accounting for the larger part of corporate R&D investments. Unfortunately, no figures could
be obtained for a number of important biodiesel and -ethanol producers.
Within the limits of data accuracy a regional breakdown indicates that corporate R&D
investments do not necessarily originate from companies with headquarters in countries that
show a high public R&D budget. Indeed, all countries with high public biofuel-related R&D
budget are home to companies with substantial research investment for biofuels (i.e.
Germany, France, Denmark, Sweden, Spain and Austria). But at the same time, the
assessment finds that substantial contributions also come from British and Finnish companies,
even their public budgets do not explicitly allocate funds to biofuels R&D. A slightly better
match would thus be obtained between the location of corporate and public funds, if the total
public bioenergy-related budgets were considered instead of transport biofuels only, which
may be a sensible proxy for some countries that do not explicitly reveal figures on biofuel
R&D (see bullet point 2 above).
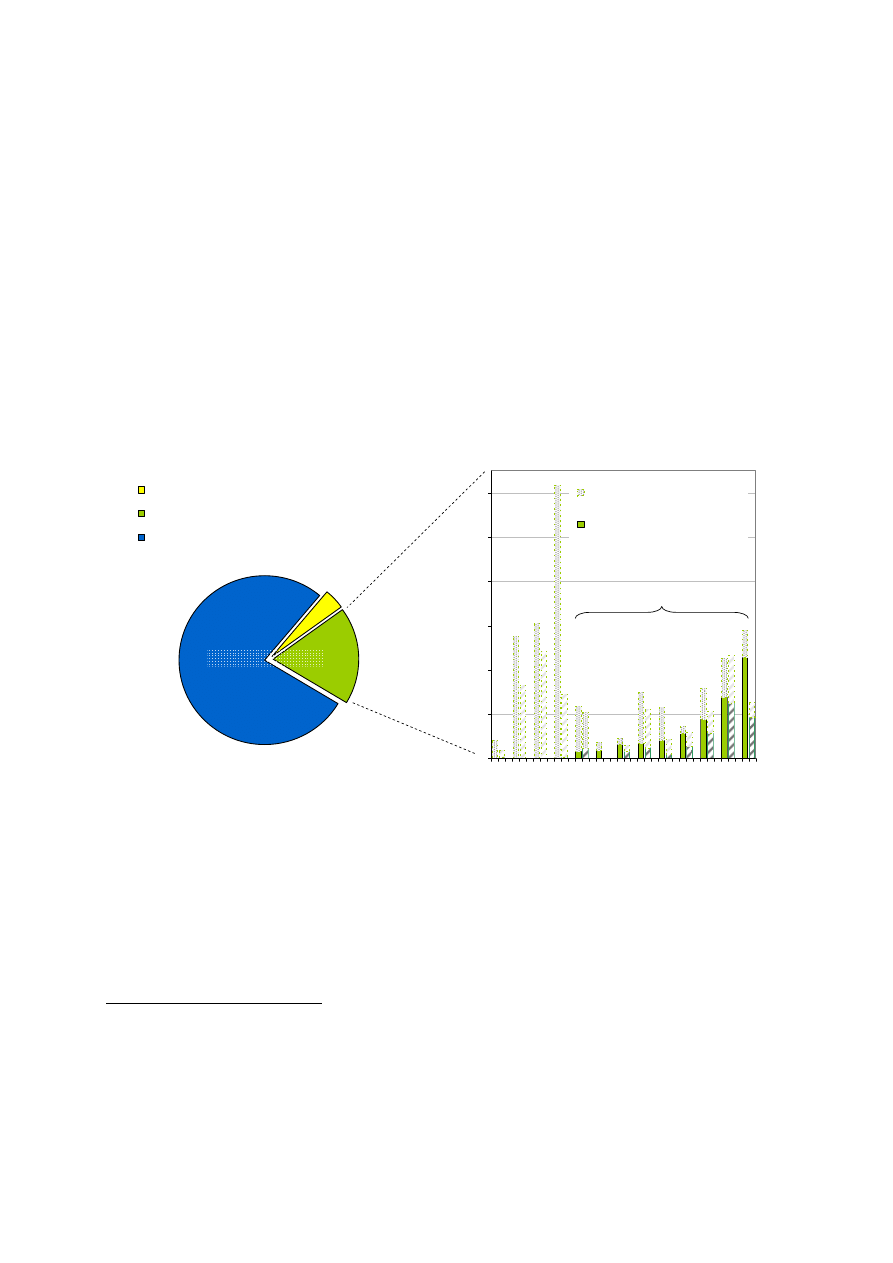
EN
49
EN
If we assume the turnover of the EU biofuel industry to have been in the order of €6-7.5
billion in 2007
41
, the results of the present report (€269 million) would imply an R&D
intensity of 3.6-4.5%. This R&D intensity may seem elevated at first glance if compared to
the results for the wind energy and PV sectors. However, it seems more plausible when
considering that manufacturers of automobiles/parts, which are among those companies
interested in biofuel research, have a relatively higher R&D intensity (4.6%) than most
energy-related sectors.
The comparison with the SRS project results indicates that the present analysis may be overly
optimistic. According to that project, corporate R&D expenditures in bioenergy amounted to
less than €50 million in 2005. However, it is important to note that biofuel research has
gained in momentum over the last years, which may account for parts of the difference.
Furthermore, the approach used in the present assessment allocates R&D expenditure to the
site of the headquarters. As such, all research done by large EU-based oil companies active in
biofuels research (e.g. Shell, BP, Total) or car manufacturers (e.g. Volkswagen) is allocated to
the EU.
0
10
20
30
40
50
60
IE
FI NL UK AT BE HU DE IT ES DK SE FR
€
m
illi
o
n
Total bioenergy minus biofuels
Prod. of Transport Biofuels incl.
from Wastes
4%
19%
77%
Public EU (FP6, annual average)
Public R&D spending of EU MS (2007)
Corporate R&D investment (2007)
ca. €347 million
1
1
1
1
1
1
1
1
1
1
1
1
2
2
2
2
2
2
2
2
2
2
2
2
1
MS with reported R&D
investments in transport biofuels
1- 2007 data (gap-filled)
2- Annual average over the period 2002-2007
Figure 15:
Approximate R&D investment in transport biofuels from industry and public sectors
(R&D investment in bioenergy is also included as supplementary information)
Source: JRC-IPTS based on IEA RD&D statistics and official information from some Member States; FP6; EU
Industrial R&D Investment Scoreboard
Note: Some EU Member States are not IEA member and do thus not figure in the database; for others no data
are available. R&D investments of Portugal and Slovakia cannot be displayed at the current scale of the chart.
No annual average estimated for Belgium due to a limited number of data; Irish data refer to the year 2006.
41
Note that no official figure could be obtained for the turnover of the EU biofuel industry. For this
reason, it had to be approximated by two distinct approaches. Firstly, multiplying the EU biofuel
production figures with the typical market prices for bioethanol, biodiesel and pure vegetable oil would
result in a turnover of some €6 billion, yet disregarding benefits from the sale of co-products. Secondly,
the turnover of the German biofuel industry (BMU, 2008) has been extrapolated to the total EU on the
basis of Germany's contribution to overall EU biofuel production (data based on EUROBSERV'ER,
2008c). This would result in a turnover of almost €7.5 billion.
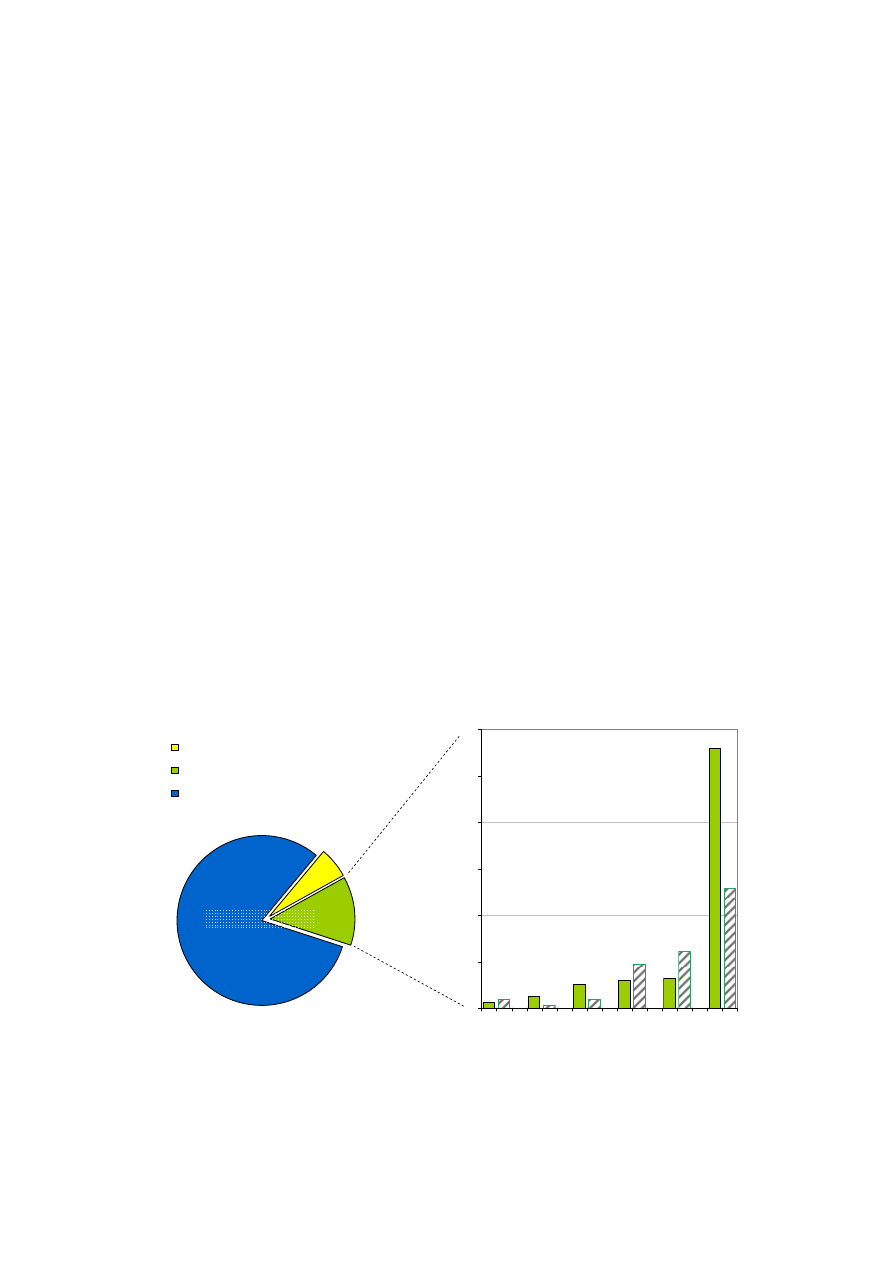
EN
50
EN
4.2.5.
Carbon dioxide capture and storage (CCS)
Research investments into CCS amounted to €296 million in 2007. Both public and corporate
R&D investments largely stemmed from relatively few Member States and companies with
headquarters in these countries, namely Germany, France, and the UK (as well as Sweden and
Denmark with regard to corporate investments). Together with biofuels, CCS-related research
showed the by far lowest amount of public funding with a share of 19% (see Figure 16).
Somehow similar to the case of biofuels, this low amount and share of public funding might
be explained by three factors:
• Firstly, CCS has only recently become a priority for many Member States, reflecting the
increasingly stringent targets on climate change. This may not (yet) be reflected in the past
decisions that underlie the public R&D budgets for the year 2007, which might imply an
underestimation of current public R&D efforts in that area.
• Secondly, with CCS being a relatively new technology, many Member States may not yet
have accounted for CCS in an explicit category, but ranked it within the category of 'fossil
fuels', which has an important EU Member States budget of €240 million. This would also
explain why data on CCS are available for only eight Member States.
• Thirdly, even though CCS is still in its developing phase, most of the single processes
underlying it are rather well proven and the main challenges are its large-scale application
and cost reduction. The latter may not be considered as R&D but rather demonstration or
even early deployment, and would thus not necessarily be included in public research
efforts.
EU funding through FP6 dedicated to CCS-research has been in the order of €70 million (or
€17 million as annual average). This result is fully supported by an assessment made by the
European Commission (2007e), which estimated the FP6 support to CCS-projects to be €70
million.
0
5
10
15
20
25
30
DK
ES
IT
NL
UK
FR
€ mi
ll
io
n
6%
13%
81%
Public EU (FP6, annual average)
Public R&D spending of EU MS (2007)
Corporate R&D investment (2007)
ca. €296 million
1
1
1
1
1
1
2
2
2
2
2
2
1- 2007 data (gap-filled)
2- Annual average over the period 2002-2007
Figure 16:
Approximate R&D investment in CO
2
capture and storage from industry and public
sectors
Source: JRC-IPTS based on IEA RD&D statistics and official information from some Member States; FP6; EU
Industrial R&D Investment Scoreboard

EN
51
EN
Note: Some EU Member States are not IEA member and do thus not figure in the database; for others no data
are available. R&D investments for Portugal, Belgium and Austria cannot be displayed at the current scale of
the chart.
The elevated corporate R&D investments in this sector (around €240 million in 2007) are
based on the fact that most large utilities, oil companies and some component suppliers have
an interest in this technology. This is underlined by the activities within the 'Greenhouse Gas'
Implementing Agreement, one of the transnational R&D programme cooperation activities of
the IEA, which is dominated and mainly financed by industry. Out of the 23 companies
assessed in this sector, seven are electric utilities, three are oil companies, three are large
component suppliers and another three are major chemical companies. Given the
methodology applied, the intrinsic uncertainties of determining the R&D share dedicated to a
certain technology are elevated for these companies as they are also active in many different
areas (see section 4.3).
Nevertheless, corporate CCS-related R&D investments are of the same order of magnitude as
information provided by the Technology Platform for Zero Emission Fossil Fuel Power Plants
in a letter to Commissioner Piebalgs from February 2008 (ZEP, 2008b), according to which
the "corporate commitments" of the companies signed "to the early development of CCS, as
well as the achievement of CCS-related efficiency-increase, already amount to a total of more
than €635 million over the past five years in aggregate". This figure would more or less
confirm the estimation of the present report when considering that the research efforts in later
years have probably been more intense than those in earlier years given the increasing
importance of CCS, and considering further that the present assessment is based on a group of
EU-based companies that is (slightly) larger than the signees to the letter.
4.2.6.
Hydrogen and fuel cells
Hydrogen and fuel-cells seem to attract the largest R&D investments among the non-nuclear
energy technologies considered in this report: around €616 million are dedicated to this
technology. This elevated investment may be explained by the fact that, unlike for most other
technologies assessed, the category 'hydrogen and fuel cells' comprises an entire fuel chain
from production to consumption with a broad range of transportation, stationary and portable
applications, thus attracting a large number of different private and public actors. As such, a
multitude of different single technologies are subsumed under the heading 'hydrogen and fuel
cells', all of which are at different levels of maturity.
Public R&D investments of EU Member States in 2007 and (annualised) EU funds under FP6
amounted to around €241 million, with the EU funding under FP6 having accounted for more
than one quarter of this. This would mean that the EU FP6 funds for H2/FC research projects
reached around €70 million on an annual average (€280 million over the duration of FP6).
This figures remains below the estimates of other sources that are in the order of €300-320
million (European Commission, 2007b; Filiou et al., 2009; Orion Innovations, 2008). This
discrepancy can be explained by the allocation process undertaken in the present work (see
section 3.4). If all projects that were somehow related to H2/FC research had been allocated to
H2/FC (even though their focus has been on other research areas such as CCS), the total EU
R&D investment in H2/FC would have reached €318 million in the present analysis.
However, for consistency reasons, such double counting has been avoided, which may have
caused some (limited) distortions for individual sectors (see also section 4.3.2).
Compared to the year 2006, public national R&D budgets of the EU Member States included
in the analysis increased by 17%. Member States with important R&D spending on hydrogen

EN
52
EN
and fuel cells include France, Germany, Italy and Denmark, followed by the UK with some
distance (see Figure 17). The same countries also host the companies with the largest
corporate R&D investments, led by German, British and French companies.
The public R&D investments found in the present report remain below those of a recent
publication based on data from the HY-CO project, according to which the aggregated EU
and Member States budgets amounted to €275 million in 2005 with further increases to be
expected (Neef, 2008). Parts of the discrepancies may be explained by missing data on
regional R&D funds that are excluded for some countries. In Germany, for example,
hydrogen and fuel-cell related research investments financed by the Länder amounted to €18
million in 2006 (Schneider, 2007). It is also possible that the important regional investments
into H2/FC-related research in Italy are not included in the IEA database.
The high corporate R&D investments (€375 million) might be explained by the number of
companies interested in this research area as well as the fact that hydrogen and fuel cells are
considered as a strategic research field for many of the large multinational companies with
high overall research expenditures. The present assessment looked into 68 companies active
in this area, among them eight car manufacturers; six oil companies or utilities and four large
component suppliers. The remainder predominantly comprises various small companies
specialised in fuel cells, but also includes some large chemical or gas companies that are
mainly involved in hydrogen-related research.
In particular for multinational companies it is important to note that the approach used in this
report allocates the R&D to the location of headquarters and not to the country in which the
research is effectively being carried out. This may explain part of the differences of the
present results with other studies:
• The '2007 Worldwide Fuel Cell Industry Survey
42
' (PWC et al., 2007) collected data on the
global fuel cell industry through a web-based survey. It finds that global R&D investment
in fuel cells amounted to US$829 million in 2006. However, only some US$107 million
(ca. €80 million
43
) occurred in EU Member States. Compared with the findings of the
present work, this estimate on EU investment in the Fuel Cell Survey seems rather low.
This may primarily be due to the differences in the allocation of companies to geographic
regions, which is of particular importance for this sector as it involves many multinational
companies. Unlike the present report, the Fuel Cell Report allocates R&D investments to
the country in which the R&D is being carried out. In addition, the response rate of EU
based companies in the study was limited (out of the 182 responses, only 37 where
received from EU companies). Finally, the Fuel Cell Report concentrates on fuel cells and
therefore leaves out the hydrogen production part.
• The SRS project concludes that some €30 million were spent on hydrogen-related research
in 2005. According to ERMINE, even less (€14 million) was spent on that line of research,
yet restricted to the electricity sector. These differences cannot be explained in simple
terms but may partially stem from lack of data in those projects. Furthermore, car
42
http://www.usfcc.com/resources/2007worldwide_survey_final_low.pdf
43
If this amount was amended by data for the Netherlands and France (based on figures from ECN
(Energy Research Centre of the Netherlands) and l'Association Française de l'Hydrogène), which are
not explicitly included, the EU total would rise to some €150 million. Such an approach would however
lead to major methodological problems.
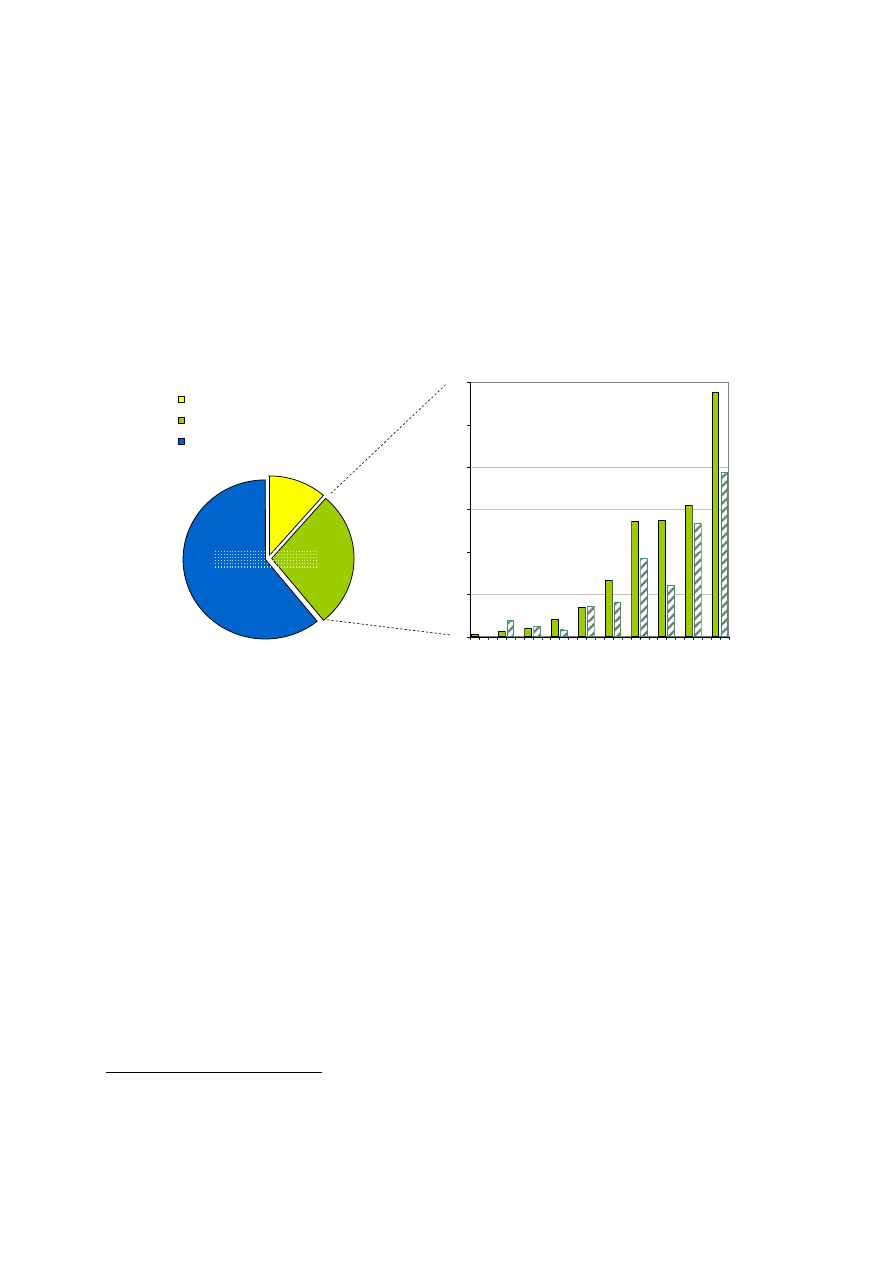
EN
53
EN
manufacturers, which are among the prime investors in fuel cells according to our analysis,
are not considered by the ERMINE study.
• In 2004, the IEA roughly estimated the private sector's R&D investment in hydrogen and
fuel cells to be in the order of US$3-4 billion (IEA, 2004). Despite the lack of a regional
breakdown and important developments in the sector since then, this estimation would
support the order of magnitude of the present assessment.
Given the particular uncertainties for deriving the corporate R&D investments in the present
report and considering the wide span of results found in literature, the results on industrial
R&D investments in H2/FC must be regarded with care. A further comparison would be
needed with a special focus on the differences in the geographical allocation and definition of
the sectoral boundaries.
0
10
20
30
40
50
60
BE
AT
SE
ES
NL
UK
DK
IT
DE
FR
€
m
illio
n
11%
28%
61%
Public EU (FP6, annual average)
Public R&D spending of EU MS (2007)
Corporate R&D investment (2007)
ca. €616 million
1
2
1
2
1
1
1
1
1
1
1
2
2
2
2
2
2
2
1
1- 2007 data (gap-filled)
2- Annual average over the period 2002-2007
Figure 17:
Approximate R&D investment in hydrogen and fuel cells from industry and public
sectors
Source: JRC-IPTS based on IEA RD&D statistics and official information from some Member States; FP6; EU
Industrial R&D Investment Scoreboard
Note: Some EU Member States are not IEA member and do thus not figure in the database; for others no data
are available. Portuguese R&D investments cannot be displayed at the current scale of the chart. No annual
average estimated for Belgium due to a limited number of data.
4.2.7.
Smart grids
The investments in R&D related to smart grids seem to be in the order of €273 million with
private funds accounting for more than 75% of the total (€212 million). Note that this figure is
highly uncertain both with regard to data from industry and to public data
44
, and most likely
comprises grid-related research that goes beyond a narrow definition of 'smart' grids.
Due to the somehow 'fuzzy' boundaries of the 'smart grids' category, it was often not possible
to make a substantiated assumption for the share of R&D investments dedicated to that
technology. For this reason, the assumptions were made for all grid-connected research
investment. Similarly, the IEA R&D statistics used for assessing the national public R&D
44
According to IEA database, public national support to smart grids decreased by almost 50% between
2006 and 2007. This is largely caused by a fall in Italian funds, which had shown very elevated R&D
investments on smart grids for the year 2006 compared to data from both the years before and 2007.
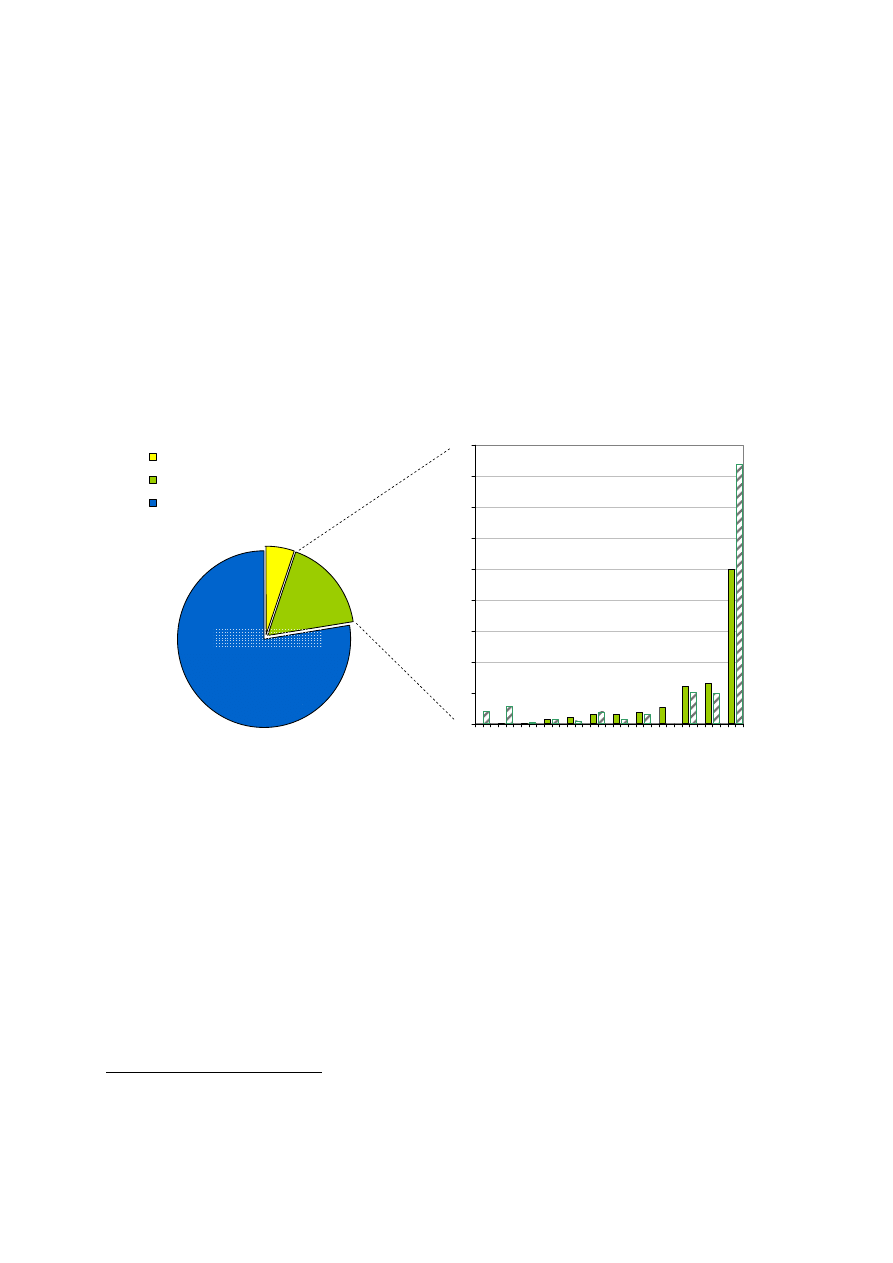
EN
54
EN
spendings do not contain a dedicated category for smart grids; instead category IV.2
'Electricity Transmission and Distribution' was used.
Also the EU funds through FP6 that have been estimated to have been €14 million on an
annual average over the effective duration of FP6 remain below the estimates made in
European Commission (2007c). Parts of the differences stem from the allocation process
applied in the present work. Other parts may be explained by the fact that not all R&D
included in European Commission (2007c) would necessarily be associated with the group
'smart grids'.
Finally, smart grid related research may attract companies that go beyond the search pattern
applied in this report. Besides the component suppliers, electric utilities and other energy
companies assessed, companies active in sectors such as information technologies may be
active in this area, such as IBM which has initiated the Intelligent Utility Network. Corporate
R&D investments in smart grids largely stem from French-based companies (e.g. Areva, EdF
Group) and German companies (e.g. Siemens).
0
5
10
15
20
25
30
35
40
45
DE UK SK DK
IE
AT FR SE BE NL
FI
IT
€ mill
ion
5%
17%
78%
Public EU (FP6, annual average)
Public R&D spending of EU MS (2007)
Corporate R&D investment (2007)
ca. €273 million
1
1
1
1
1
1
1
1
1
2
2
2
2
2
2
2
2
2
2
1
1- 2007 data (gap-filled)
2- Annual average over the period 2002-2007
1 2
Figure 18:
Approximate R&D investment in smart grids from industry and public sectors
Source: JRC-IPTS based on IEA RD&D statistics and official information from some Member States; FP6; EU
Industrial R&D Investment Scoreboard
Note: Some EU Member States are not IEA member and do thus not figure in the database; for others no data
are available. Note that the IEA category IV.2 'Electricity Transmission and Distribution' comprises more than
smart grids only. No annual average estimated for Belgium due to a limited number of data.
4.2.8.
Nuclear fission
Within the context of the SET-Plan, research into 'generation IV' reactors is of particular
interest. Unfortunately, it has not been possible to narrow down either the public or the private
nuclear fission related R&D investments exclusively to research on generation IV
technologies, meaning that the figures provided in the following are likely to be an
overestimation
45
. In order to limit the overestimation, the main analysis refers to research
45
The concept of Generation IV is linked to particular objectives such as greatly increased sustainability
and minimised long-lived waste production, increased resistance to weapons proliferation, a level of
safety at least equivalent to the best achievable in current technology with emphasis on passive and

EN
55
EN
investments in the area of nuclear reactor technology and the fuel cycle (to the extent that this
was possible for the private sector). To simplify, this group will be referred to as 'nuclear
reactor R&D' in the following. Nonetheless, it was decided to also present figures on 'total
nuclear fission related R&D', which besides reactor technology R&D also contains topics
such as nuclear safety, environmental protection, waste management, fissile materials control
(i.e. security issues), and a variety of other topics – some of which may have no direct relation
to energy production. Figure 20 thus provides information on these total nuclear fission
related R&D budgets as well.
Note, that these cannot be directly compared with the investments in any other technology
assessed within the present report, since the R&D is for the sector as a whole whereas all
other technologies focus on innovative "low carbon" aspects only (e.g. CCS research does not
include any activities on coal mining, fossil fuel combustion technology, etc.). Even a
comparison between the R&D investments of other technologies with those in 'nuclear reactor
R&D' thus remains difficult without a clear idea of the generation-IV component. Besides, it
should be remembered that generation IV is a refinement of a technology already responsible
for large-scale low-carbon energy production. The nuclear industry is a well-established,
profitable and high-tech industrial sector that, as part of normal investments in improvements
and everyday developments in current technology, already devotes considerable resources to
R&D on the nuclear fuel cycle in general and nuclear reactor technology in particular.
The difference between total nuclear fission R&D and reactor-related R&D is illustrated for
the national public budgets in Figure 19 – the difference between the two categories is
accounted for by 'nuclear supporting technologies', which is excluded when focusing on
'nuclear reactor R&D'. There is some doubt, however, over the exact definition of the R&D
undertaken and even the public or industrial attribution of parts of this spending. In particular,
though some revenue is attributed within the public domain, it may originate from the sale of
nuclear electricity or nuclear reactors / services. For example, it is known that the funding of
R&D on waste management (in particular geological disposal) is supported essentially
through the "polluter pays principle" (i.e. revenue from sale of nuclear electricity) even
though funds are often managed in the public domain. More detailed analysis than was
possible within the present survey will be needed in order to quantify such effects.
intrinsic design features, and other uses of nuclear energy such as process heat for industrial processes,
e.g. hydrogen production. It is these aspects that are of particular interest in the context of the SET-Plan.
Most of this effort is currently at the stage of pre-competitive research.

EN
56
EN
0
100
200
300
Nuclear
Supporting
Tech.
Fuel Cycle
Other
Converter
Reactors
Light-Water
Reactors
Other
Nuclear
Fission
Nuclear
Breeder
€
20
0
7
milli
o
n
FR
BE
IT
DE
NL
FI
SE
CZ
Others
"Nuclear reactor R&D"
Figure
19:
Aggregated public support of EU Members to R&D in selected nuclear energy
technologies in 2007
Source: IEA RD&D statistics
Note: Gap filling applied with data from back to 2003 as follows: 2006 data were used for Finland and the
Netherlands while for the Czech Republic 2003 data were used. Note that only the total fission R&D is given for
the UK in 2007 (€4.3 million); no nuclear R&D breakdown is available except for nuclear breeder in 2003 for
the UK.
R&D investment in nuclear reactor R&D amounted to around €458 million in 2007, almost
equally financed by the private (€205 million) and the public sector (€253 million). Both
private and public funds largely concentrate within France. In 2007, France accounted for
more than half of the total public budgets of EU Member States in nuclear-reactor related
research. This result is to be viewed in the light of France's large share of nuclear generating
capacity in Europe. i.e. ca. 50%. Other Member States directing important budgets towards
nuclear-reactor related research were Italy, Germany and the Netherlands (though very little
was related to generation IV).
Total investments in all nuclear fission related R&D (€1.25 billion) would be almost three
times the part that is dedicated to research on nuclear reactor technologies. Corporate R&D
investments account for 44% of this budget. 76% of the Member States funding stems from
France, which spends half of its total energy R&D budget on nuclear fission (again, must be
viewed in the light of the 79% of domestic electricity consumption being of nuclear origin in
France).
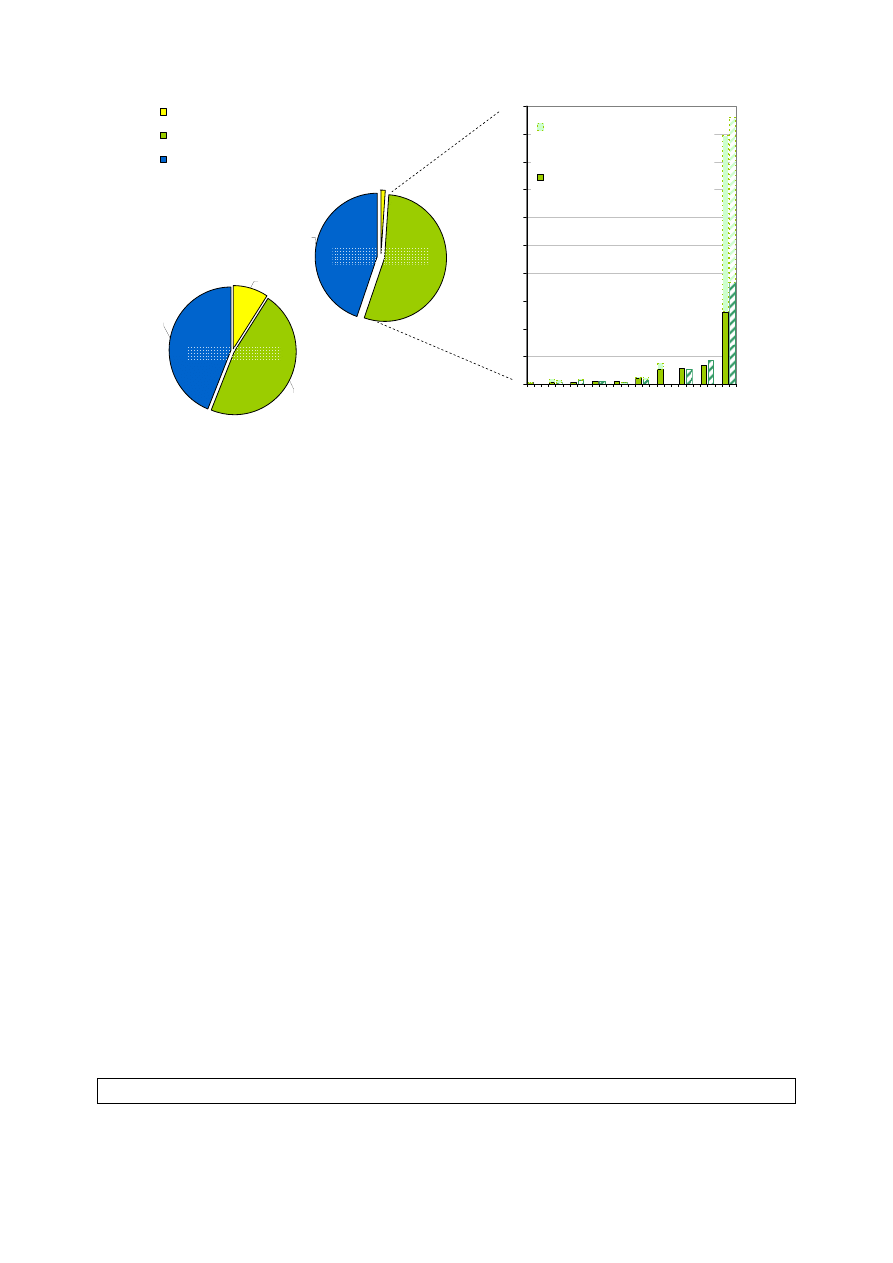
EN
57
EN
0
50
100
150
200
250
300
350
400
450
500
CZ
FI
ES
SE
UK
NL
BE
DE
IT
FR
€
m
illio
n
Other nuclear fission (i.e. nuclear
supporting technology)
Nuclear fission (mainly reactor
research and fuel cycle, thus without
safety, waste, environment)
54%
1%
45%
Public EU (EURATOM budget; annual average)
Public R&D spending of EU MS (2007)
Corporate R&D investment (2007)
ca. €458 million
47%
9%
44%
ca. €1250 million
Total nuclear
fission
Nuclear reactor
technology
1
1
1
1
1
1
1
1
1
2
2
2
2
2
2
2
2
1
1- 2007 data (gap-filled)
2- Annual average over the period 2002-2007
Figure 20:
Approximate R&D investment in nuclear fission from industry and public sectors
Source: JRC-IPTS based on IEA RD&D statistics and official information from some Member States; FP6; EU
Industrial R&D Investment Scoreboard
Note: Some EU Member States are not IEA member and do thus not figure in the database; for others no data
are available. Date for Slovakia, Denmark and Hungary cannot be displayed at the scale of the present chart.
Note that it was not possible to narrow the analysis on 'generation IV' reactors. For this reason, a sub-group
'nuclear reactor technology' has been artificially created, which mainly ignores R&D dedicated to
environmental safety, radiation protection etc., but is still much broader than pure 'generation IV'. No annual
averages estimated for Belgium and Czech Republic due to a limited number of data. Regarding EU funds for
'total nuclear fission', not only project-related funds under EURATOM have been included but also the JRC
funds dedicated to nuclear energy.
The assessment of corporate R&D investments in nuclear energy is based on nine companies
only, reflecting the limited number of major players in this sector. Similar to the public
funding, French companies (AREVA, EdF, GDF-Suez to a lesser extent) largely dominate the
total corporate R&D investments in nuclear fission. Unfortunately, for most companies it was
not possible to determine the part of nuclear R&D that is dedicated to reactor technologies.
Nevertheless, a rough estimate indicates that corporate R&D investment in nuclear reactor
technology may be in the order of €200 million, while corporate research into all nuclear
fission related aspects would amount to around €550 million. However, only a fraction of this
will be on generation IV technology, reflecting unwillingness by industry to invest heavily in
a technology that is 30 years from possible commercial deployment and in a sector where
there is considerable political and regulatory uncertainty. Consequently, most industrial
players see this currently as the principal responsibility of the public sector.
This compares to the results of the ERMINE project, which estimated the private investment
into nuclear fission-related R&D to be in the order of €304 million in 2004. Given that
AREVA, by far largest spender in this area, saw an annual increase in its R&D expenditure of
more than 20% over the past three years, the ERMINE result are relatively well in line with
the present assessment.
Box 2 – Euratom FP budget (indirect actions) on Gen IV reactors

EN
58
EN
In Euratom FP6 some €17 million were dedicated to 'innovative concepts' out of a total of
€189 million for all fission-related research (i.e. less than 10%). This is support to pre-
competitive research on the potential of Gen IV technology. The overall Euratom FP7 budget
for 'indirect actions' in nuclear fission has not increased above inflation relative to FP6, and
the programme retains its broad-based nature dealing with a number of priority areas in
nuclear science and technology, some of which have little if anything to do with nuclear
energy per se. Nonetheless, it is likely that Gen IV-related research will constitute a larger
percentage of the total during FP7 than during FP6.
4.2.9.
Nuclear fusion
Nuclear fusion is publicly financed with the EU-funds contributing around 42% of the total
(up to FP6 2006) and the Member States contributing the remaining 58% in 2007, amounting
to a total of around €482 million (see Figure 21). Germany is the by far largest singly
spending country, followed by Italy, France and the UK.
Nuclear fusion energy research constitutes an exception among the SET-Plan priority
technologies. There is hardly any corporate R&D investment and most public R&D
investments are implemented in one single European Programme coordinated by EURATOM.
After the decision to build ITER was taken in 2006, the implementation of the largest
programmes (ITER and Broader Approach) is carried out through the "European Joint
Undertaking for ITER and the Development of Fusion Energy", which was established in
April 2007.
Taking into account that the bulk of the budget for ITER construction will be provided
through the EU budget, it may be expected that the EU share of the overall expenditure in the
next years will clearly exceed that of the Member States. This will reaffirm the exceptionality
of the fusion case, while at the same time showing that major global endeavours, such as the
development of fusion energy through ITER, necessitate a different approach. Within the 7
th
EU Framework Programme (and here within the EURATOM part), the maximum amount for
the implementation budget dedicated to fusion related research for the period 2007 to 2011
will be €1947 million, which means more than a doubling compared to the FP6 support. More
than half of this amount is allocated to work involved in the construction of ITER, but not less
than €900 million is reserved for other ITER relevant activities including fundamental plasma
research and technology development projects. It must be noted that this research cannot
directly be compared to other technologies given the scale of the initial investments needed
for constructing ITER (with capital costs expected to be some €5 billion and the total
expected costs over its 35-year experimental lifetime reaching around €10 billion).
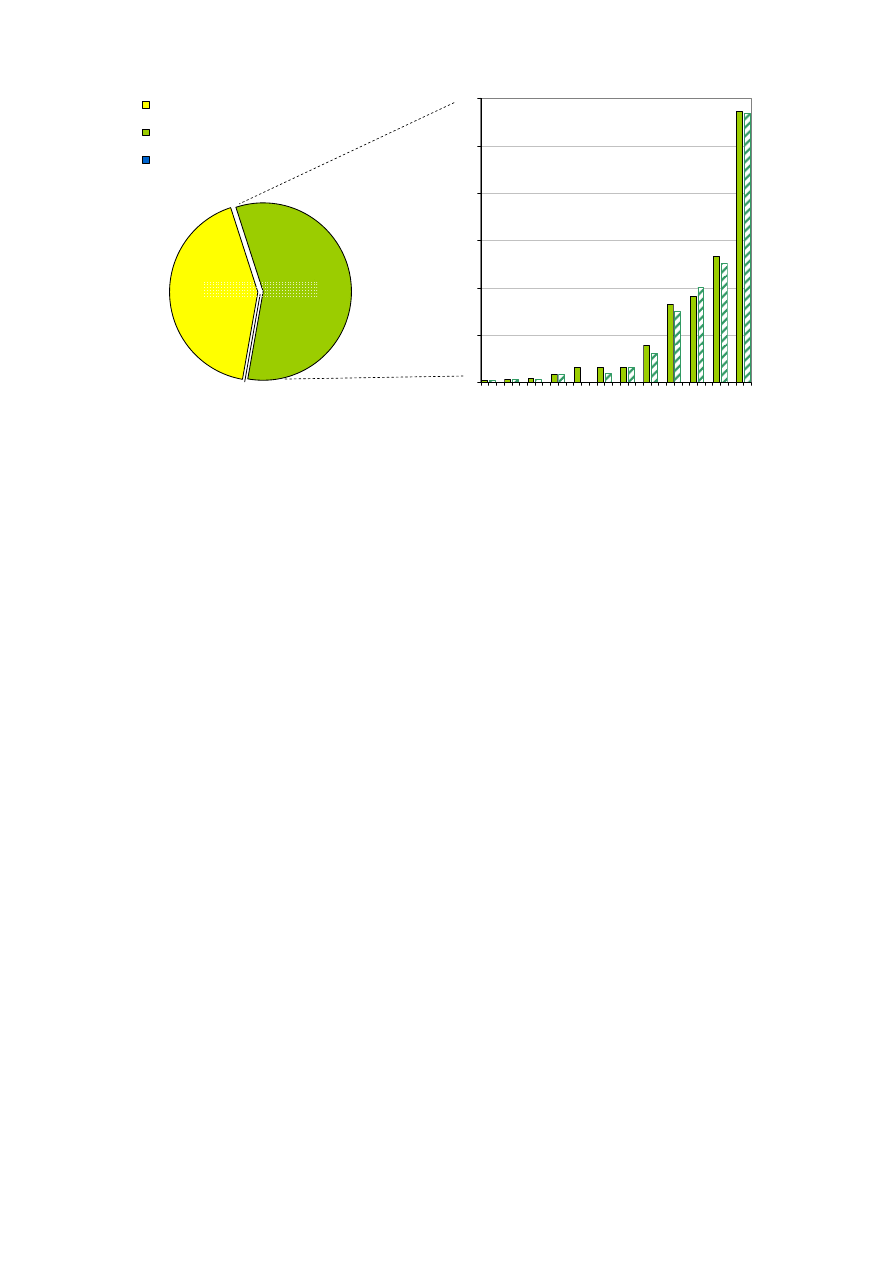
EN
59
EN
0
20
40
60
80
100
120
PT SE DK AT BE
FI
NL ES UK FR
IT
DE
€ mi
llion
42%
58%
0%
Public EU (EURATOM budget; annual average)
Public R&D spending of EU MS (2007)
Corporate R&D investment (2007)
ca. €482 million
2
1
1
1
1
1
1
1
1
1
1
1
2
2
2
2
2
2
2
2
2
2
1 2
1- 2007 data (gap-filled)
2- Annual average over the period 2002-2007
Figure 21:
Approximate R&D investment in nuclear fusion from industry and public sectors
Source: JRC-IPTS based on IEA RD&D statistics and official information from some Member States; FP6; EU
Industrial R&D Investment Scoreboard
Note: Some EU Member States are not IEA member and do thus not figure in the database; for others no data
are available. No annual average estimated for Belgium due to a limited number of data.
4.3.
Analysis of uncertainties
Both the assumption-based approach for estimating corporate R&D investments by
technology and the data on public R&D investments are associated with some uncertainties.
The main uncertainty related with the estimates of corporate R&D investments stems from the
assumption-based allocation process used for breaking down a company's R&D investment in
the technologies considered in the report, and from missing data for some companies. With
regard to public R&D investments, differences in the extent to which individual Member
States include regional funding, institutional budgets and support to demonstration activities
in their submission to the International Energy Agency are the main source of uncertainty.
Finally, the project-based allocation process of the EU FP6 funds is a potential source of
(minor) errors.
4.3.1.
Uncertainties associated with estimates for corporate energy R&D investments
The analysis of corporate R&D investments by technology includes a number of uncertainties,
the level of which depend on whether exact figures could be obtained, official data was
available as a starting point, or 'educated guesses' had to be made.
Figures with a 'very high accuracy' (or very high confidence level) could be obtained for
companies
• for which the R&D investment is known through annual reports or the EU Industrial R&D
Investment Scoreboard, and that are active exclusively in one technological field. Here, it
was assumed that 100% of the well-known total R&D investment is allocated to the
respective technology;
• that provided the exact breakdown of their R&D investments either through direct contact
or in official publications.

EN
60
EN
The uncertainty associated with figures on R&D investment for this group of companies is
estimated to be in the order of ±2%.
Figures with 'high accuracy' (or high confidence level) are those that may be slightly inexact,
but the probability of missing at least the right range is very low with an estimated uncertainty
range around ± 10%. They relate to
• companies for which the estimates made in the present report were refined through direct
contact, but which did nevertheless not provide exact figures on their R&D investments by
technology;
• companies for which the present estimates (or range) are supported by figures from other
studies.
Figures with 'significant uncertainties' relate to estimates that had to be made on the
allocation of the total R&D investment to individual SET-Plan priority technologies. This is
the case for companies that are active in various fields at the same time and for which none of
the above two points applies. Here, the R&D expenditures have been assessed with the
methodology described above, which relies on a number of assumptions based on indirect
indicators (such as the number of staff or patents; total sales by division), press released and
expert guesses. Whenever possible, different approaches have been combined in order to
control the uncertainties related with one approach. For example, an analysis based on the
number of R&D employees working in this specific technology was cross-checked with a
parallel assessment based on patents or turnover. Nevertheless, the estimates made for the
R&D investments for this group of companies are approximate values only and we assume an
uncertainty range that may reach ± 50% of the central estimate.
Overall, the allocation process thus proves to be the greatest source of uncertainty in the
approach. Enhancing the level of certainty of the outcome would require a more systematic
research. A more comprehensive analysis will require an intensified direct contact to
companies, a more systematic assessment of the companies' patent registrations, an
assessment of the business areas and a closer look into press announcements that may reveal
plans for future development and thus allow some conclusions regarding R&D priorities (see
also section 3.2.5).
Finally, there have been a few companies for which the lack of information did not even allow
a rough estimate. However, this does not concern any of the major R&D investors and would
thus not distort the aggregated result to a large extent. The total lack of data typically occurred
for some small companies active in one technological area only, such as biofuels or H2/FC. It
can also refer to companies for which the total R&D expenditure is available from the EU
Scoreboard but the lack of any information did not allow any allocation to individual
technologies.
Figure 22 illustrates the distribution of results with the various levels of accuracies in terms of
both the number of companies and the total R&D investment.

EN
61
EN
Number of EU companies
(total of 136)
33
68
21
14
Very high accuracy
High accuracy
Significant uncertainty
No data
Share of corporate R&D investments
24%
20%
56%
Very high accuracy
High accuracy
Significant
uncertainty
Figure 22:
Number of companies and share of corporate R&D investments by level of uncertainty of
the analysis
Source: JRC-IPTS
Applying the uncertainty ranges of ±2%, ±10% and ±50% to the overall results, the overall
uncertainty in the total corporate R&D investment could amount to a maximum of ± €568
million, roughly ±30% of the total
46
. This figure does, however, not include any
uncertainties that stem from the fact that some companies are not considered due to lack of
data.
The composition of companies associated to the different levels of accuracy and with it the
uncertainty ranges vary across individual technological sectors. In the areas of wind energy
and CSP with an elevated share of specialised companies, the R&D investments can be
estimated with a very high accuracy for more than 75% of the companies considered. This
share decreases for PV (around 40%) and even more so for sectors such as CCS and smart
grids, in which most of the companies considered are active in multiple business fields, thus
necessitating an assumption-based breakdown that decreases the level of accuracy.
While the above description applies for the estimates made for the year 2007, the uncertainties
associated to the rough estimates provided for the year 2006 are larger as the latter are partly
derived from the hypotheses made for the year 2007. This is described in more detail in box 3.
Box 3 - Methodology and uncertainties for approaching the 2006 R&D corporate
investments
The scope of this report lies in the estimation of selected R&D investments for the year 2007.
As an assessment of a one-year snapshot, however, bears a risk of giving too much weight to
one-off events or data mavericks, it was decided to also include an annual average of the
public national R&D expenditure between 2002 and 2007 (see section 1.1.1). Even though
data scarcity does not allow for a similar approach on corporate R&D investments, a rough
estimation of the corporate R&D investments for the year 2006 has been carried out.
Nevertheless, the accuracy of the 2006 figures remains below the 2007 estimates. This is due
to the fact that a simplified approach has been used for estimating 2006 corporate R&D
investments, partly derived from the assumptions made for 2007. Depending on the data
availability for an individual company, an estimate has been produced on the following basis:
46
An uncertainty analysis performed at the level of individual companies indicates a smaller uncertainty
range of ±18% but contains some methodological problems and has thus not been further pursued.

EN
62
EN
1- The exact figure has been taken from official reports, the EU R&D scoreboard, etc. where
available for 2006.
2- The total R&D investment was provided for 2006 but there was no information about how
it was spread over the SET-Plan priority technologies. In this case, the same share (in terms of
percentage of the total R&D) has been assumed as for the year 2007. This extrapolation is the
source of some additional uncertainties given that the assumptions were originally 'tailored'
for the year 2007.
3- It has been assumed that the 2006 R&D investments are equal to 2007 figures. This is
mainly assumed for small companies for which no information was available for 2006. This
requires an idea on whether significant changes in the R&D activities from 2006 to 2007 have
occurred for the company considered.
4- An estimate of the 2006 R&D expenses has been obtained on the basis of the number of
R&D employees in the year 2006. This approach was mainly applied for companies
specialised in a particular technology (e.g. fuel cells small companies).
All in all, the results for 2006 are associated with higher uncertainties than the 2007 figures,
impeding a direct comparison between them. Nevertheless, we consider that the accuracy
allows a qualitative indication of the trends in corporate R&D investments, without being
able to quantify it with a high degree of precision.
4.3.2.
Uncertainties associated with estimates for public energy R&D investments
As the assessment of national public R&D investments of EU Member States largely draws
on the IEA RD&D statistics and refers to the GBOARD only as a reference for cross-
checking on the aggregated level, the following assessment of uncertainties focuses on data
based on the IEA database.
Uncertainties in the IEA figures mainly originate from the differences in the extent to which
individual Member States include regional funding, institutional budgets and support to
demonstration activities in their original data. Such discrepancies limit the accuracy of a
direct comparison across Member States. Furthermore, it needs to be noted that even for a
given Member State, this may change over time, adding some uncertainty when assessing the
R&D trends over time. The mismatch between IEA members and EU Member States as well
as the lack of data for some IEA members for a certain year and technology makes it difficult
to derive an aggregated figure for the EU Member States' public energy R&D investment. As
this is nonetheless needed for the present analysis, it had to be approximated by applying a
gap filling procedure and by excluding some Member States from the analysis of public
national R&D investments (unless official data could be obtained through the consultation
process with Member States). The impact of the above limitations on the present results is
discussed below.
According to the IEA questionnaire (IEA, 2008), federal R&D budgets should be
complemented by regional (e.g. provincial) R&D spending when significant. Even so, this
does not seem to be the case for many countries, while it is included for others (e.g. Belgium).
In the case of Germany, for example, R&D support through regional governments (Länder) is
not part of the data underlying the IEA statistics. The regional support to non-nuclear energy
R&D of the 16 German Länder amounted to around €96 million in 2006 (Schneider, 2007),
equivalent to considerably more than one third of the equivalent federal budget in 2006. At

EN
63
EN
the aggregated EU-level, the regional German funds would be in the order of 4% (including
both nuclear and non-nuclear energy R&D as one may assume that regional funds directed
towards nuclear R&D are of limited nature). Unfortunately, the under-estimation on the
aggregated EU level that stems from the non-inclusion of some regional funds cannot be
further quantified as it would require an in-depth assessment of the national data included in
the IEA RD&D statistics, which has been outside the scope of the present work. However, it
must be noted that regional R&D funds take an important role only in a limited number of
Member States, foremost all Germany, for which an estimation of the uncertainty could be
performed. One may thus speculate that the total uncertainty stemming from potentially
missing regional funds should not exceed some ±10-15% of the total.
The IEA data focuses on energy-related R&D and as such excludes basic research 'unless it is
clearly oriented towards the development of energy-related technologies' (IEA, 2008; section
3.1). Often, this implies that the national data relate to a national energy R&D programme,
thus missing additional energy-related R&D spending that stem from other programmes (such
as defence or general research programmes). At the same time, parts of the institutional
funding included may in practice cover research of a more basic nature. The extent to which
such data are included can not be further quantified. It is expected to vary across the Member
States, influenced by the structure of their national energy research programmes and
institutional set-up, and must be taken into account when comparing Member States' data one
with another.
As explained in section 3.1, the data included in the IEA RD&D statistic shall capture public
national support to demonstration activities in addition to their R&D support. However, most
of the IEA members do not include or display this data. The share of demonstration activities
thus remains small in general, yet differs between countries and technologies (Figure 3). This
needs to be kept in mind when comparing data across countries and technologies.
Data gaps make it difficult to assess the trend of R&D investments over time (such as the one
shown in Figure 10). This is due to changes in the methodology, the geographical coverage
etc. For example, the German data prior 1992 do not include the new Länder. Other Member
States have provided only partial information for few years. For Belgium, data for the years
2000-2006 are missing. France recently changed the methodology applied for calculating its
national public research and development expenditure on energy (DGEMP 2007;
MEEDDAT, 2008). Public budgets were re-calculated officially in accordance with the new
methodology back to the year 2002 and match the IEA figures for those years. The figures of
the IEA database prior to 2002 relate to the previous methodology. Any trends over time need
to note this break in series, in particular considering the discrepancy between the two
approaches (e.g. the results differ by a factor of 1.9 for the year 2002) and the fact that France
accounts for around one third of the EU Member States' aggregated budget. Despite this risk
of distortion it was decided to not manipulate the IEA data for France prior to 2002, but to
restrict the analysis to the data directly available from the database in order to ensure
comparability with other sources.
As mentioned in section 1.1.1, only 19 of the 27 EU Member States are IEA members. This
implies that the database systematically contains no data for Bulgaria, Cyprus, Estonia,
Latvia, Lithuania, Malta, Romania, and Slovenia. A comparison with the energy R&D
budgets according to the GBAORD database, which includes data for most Member States,
reveals that the mistake made in the EU-aggregate that is caused by the lack of data for some
Member States remains limited (see Table 5). The aggregated R&D budgets of the Member
States covered by the IEA database account for around 99% of the overall EU-27 energy

EN
64
EN
budget according to GBAORD data, notwithstanding that the contributions of the missing
Member States may be higher for individual technologies.
The aggregated EU Member States' national public R&D budgets would be more distorted by
the lack of data on R&D investments that occur for some IEA members for a single year –
often the most recent year; here: 2007 – and technology. At the time of downloading the
information form the IEA RD&D statistics in January 2007, information on their 2007 energy
R&D investments was lacking for 10 of the countries assessed. Consequently, the aggregated
figure for the year 2007 would have summed up to €1237 million only. Due to the exchange
of data with a number of Member States, official national figures could be obtained to fill
these gaps for three countries (and adapt the figures for two others); for the others, a simple
gap filling procedure has been applied. For entries missing for 2007, the value from the latest
available year was applied down to the year 2003. Overall, once the 'data gaps' are filled,
public national energy R&D investments in 2007 are almost a factor of two above the
aggregate that was based on the 'raw data', and are well in line with the levels found for the
years before and the GBAORD figures. This result justifies the data manipulation applied in
the present report.
The distortion caused by the gap filling procedure is limited. Gap filling with values from
previous years has been done for three countries with a total R&D investment of €257
million. If one assumes that the maximal annual changes of their energy R&D investments do
not exceed the relatively high value of 20%, the mistake caused by the gap filling would be
€57 million, equivalent to 2.4% of the total aggregated figure over all EU Member States
considered. Of course, for some technologies, a more drastic gap filling procedure has been
necessary. Nevertheless, given that the main interest of this report lies on the aggregated EU
figures, the gap filling approach seem appropriate and the related distortions could be limited
due to the direct exchange of data with some Member States.
In total, we assume that the potential errors made in the estimation of the aggregated public
R&D investments of EU Member States should not exceed ± 13 to 19%, notwithstanding that
it may be larger for individual technologies.
Main uncertainties associated with the assessment of EU R&D funds under FP6 results from
the biunique allocation of individual projects to one group of SET-Plan technologies and the
assumption of an even split of the investments over the entire duration of FP6. The latter
seems fully justified for the present work as it levels out annual fluctuations due to the project
cycles.
In order to avoid double-counting of projects, as a general principle the funding of an
individual project was allocated to not more than one technology. Considering that a number
of projects simultaneously undertake research in fields related to different groups (e.g. CCS
and hydrogen production), this leads to an uncertainty associated with the aggregated EU FP6
funds by SET-Plan priority technology. This is most elevated for the sector hydrogen and fuel
cells: if all related projects were accounted for in this sector instead of removing those that
have their research focus in other technological fields, the total FP6 funds would amount to
€318 million over the period 2002-2006 instead of the central figure of €279 million used in
this report (i.e. ± 13%). Also for CCS, biofuels and to a lesser extent CSP the bijective
allocation process generates some distortion. At the aggregated level over all technologies,
however, these uncertainties level out unless they occur between SET-Plan priority and non-
priority technologies (such as between transport biofuels and bioenergy). We estimate this
error to not exceed ± 5%.

EN
65
EN
4.3.3.
Combined uncertainties
Not all uncertainties of the present analysis can be quantified. In particular, the present
assessment of corporate R&D investments tends to be an under-estimation of total industrial
research efforts in this area, given that a number of companies could not be included in the
present assessment due to either the lack of data or their missing inclusion in the list of
relevant companies by technology. Furthermore, important up-stream research activities that
are realised in the supply chain could only be captured to a limited extent.
Keeping in mind that the overall figures tend to be an underestimation, an upper range of the
uncertainties related with the R&D investments that are included in the present assessment
can be roughly quantified. Assuming from the above reasoning an overall uncertainty of not
more than ± 30% for the estimates on the corporate R&D investments, ± 19% for public
national investments and ± 5% for the EU funds, the cumulative error on the total R&D
investment in SET-Plan priority technologies (€3.3 billion) would not exceed ± €784 million,
or 24% of the total.

EN
66
EN
5.
CONCLUSIONS
The present report provides an estimate of the current corporate and public European R&D
investments in those low-carbon technologies that are of particular interest in the context of
the European Strategic Energy Technology Plan
47
('SET-Plan priority technologies'). Its
ultimate objective is to offer a benchmark of the current R&D spending of those technologies
to serve as a basis for the comparison with their future R&D needs
48
.
For corporate and Member States' national public R&D spending the focus of the analysis lies
on the 2007 figures while the relevant EU R&D investments are annualised figures under FP6
(2002-2006). In order to avoid putting too much weight to one-off events or data mavericks,
annual average of the public national R&D expenditure between 2002 and 2007 are also
included for comparison as well as a very rough estimation of the corporate R&D investments
for the year 2006.
Currently, no single database exists which would allow for an estimation of the overall
research efforts by technology in the EU-27. Data are particularly sketchy with regard to
corporate R&D, even though public R&D budgets are also incomplete. The low availability
of data on industrial R&D data is influenced by the fact that companies consider information
on their detailed R&D expenditure as confidential. Therefore, a new methodology has been
developed for assessing corporate R&D investments on company level. For each SET-Plan
priority technology, the number of key R&D investors has been identified. A company's
overall R&D investment has then been allocated to individual technologies based on the
combination of publicly available information with expert judgment. Hence, the estimates of
corporate R&D investments are subject to significant uncertainties. They should thus not be
used or compared without taking into account the methodological limitations of this approach.
With regard to public national R&D funding, the most recent available data (2007) have been
used from Eurostat (GBAORD) and the International Energy Agency, complemented by
information that was directly obtained from various Member States. Unfortunately, both the
GBOARD and the IEA databases miss some entries at the technological level of detail needed
and not all EU Member States are covered in the IEA database as only 19 EU Member States
are also IEA members. Data missing for 2007 have been gap filled with data from previous
years back to 2003 if available.
For an overview of the EU funding, the 6
th
Research Framework Programme and the
EURATOM Framework Programme were assessed. An assessment of the basis of individual
project has been performed, going beyond projects financed under the 'core energy budget
line' 'sustainable energy systems' and also including relevant projects funded under budget
lines such as 'sustainable surface transport' or 'Horizontal research activities involving SMEs'
etc. An annual average of the commitments has been used for these multiannual programmes
(2002-2006).
47
Technologies included are: hydrogen and fuel cells; wind energy; photovoltaics; concentrating solar
power; carbon capture and storage; biofuels; smart grids; nuclear fission (Gen IV reactors); nuclear
fusion.
48
See section 2.1 for a definition of the boundaries of R&D. The underlying data also include some
support to some demonstration activities (in particular the public national budgets), but the focus of the
assessment lies on the R&D investments.

EN
67
EN
Both the basic data as well as the approach applied in the present work are associated with a
number of potential errors. The main uncertainties for the estimates of corporate R&D
investments derive from the assumption-based allocation process used for breaking down a
company's R&D investment in the technologies considered in the report. Furthermore, it is
reasonable to assume that the results on industrial R&D investments constitute a lower
estimate of industrial research efforts, resulting from the lack of data and the limitation in the
number of companies included in the assessment. Moreover, important up-stream research
activities that are realised in the supply chain could only be captured to a limited extent. With
regard to public R&D investments, differences in the extent to which individual Member
States include regional funding, institutional budgets and support to demonstration activities
in their submission to the International Energy Agency add some uncertainty. Also the lack of
data for an individual year and technology and the resulting gap filling process forms a
potential source of error.
Keeping in mind that the overall figures on corporate R&D efforts tend to be an
underestimation, an upper range of the uncertainties associated with the R&D investments
presented in the following can be roughly estimated. Applying an overall uncertainty range of
not more than ± 30% for the estimates on the corporate R&D investments, ± 19% for public
national investments and ± 5% for the EU funds, the cumulative error on the total R&D
investment in SET-Plan priority technologies does not exceed ± 24% of the total even though
higher uncertainties may apply to the results related to one individual technology. Future
work may reduce the uncertainties associated with the estimation of corporate R&D
investments by expanding the list of companies assessed, enhancing direct contact with
industries; and making a more systematic use of indirect indicators such as patent
applications.
Despite the uncertainties described, the order of magnitude of the results obtained in the
present report is supported by a comparison with other sources both on the overall level and at
the level of individual technologies and funders. It can thus be considered as a reasonable
approximation of the present R&D investments.
Hence, the following substantiated conclusions can be derived on the basis of the present
assessment. Due to the different nature of nuclear and non-nuclear energy research, the
respective conclusions are being kept apart with points (1) to (3) relating to non-nuclear R&D,
(4) on nuclear and (5) and (6) on nuclear and non-nuclear research.
(1)
R&D investments in non-nuclear SET-Plan priority technologies amounted to
€2.38 billion in 2007
49
in the EU. The fact that large parts of non-nuclear energy
research are dedicated to these selected low-carbon technologies indicates that
they are seen as a strategic research field by both public and industrial R&D
investors.
National public non-nuclear energy R&D budgets in EU Member States amounted to more
than €1.6 billion in 2007, out of which €571 million were dedicated to non-nuclear SET-Plan
priority technologies. The increase of R&D investments in non-nuclear SET-Plan priority
technologies since the late 1990s meant that their share in the total non-nuclear energy R&D
49
2007 figures are provided for corporate and Member States' national public R&D spending while the
relevant EU R&D investments are annualised figures under FP6 (2002-2006).

EN
68
EN
spending rose from around 20% in 1999 to 34.5% in 2007, indicating the rising importance
being given to those technologies.
Under the 6
th
Research Framework Programme, the EU spent around €157 million on non-
nuclear SET-Plan priority technologies on an annual average. No detailed figures could be
obtained on the level of detail needed from FP7 (2007-13). However, taking into account that
the average annual non-nuclear energy R&D budget has increased substantially compared to
FP6, one may assume that also budgets directed to (some) non-nuclear SET-Plan priority
technologies are above those of FP6.
Almost 39% of the European public non-nuclear energy research budget (including Member
States and the EU FP6 contribution) are dedicated to the non-nuclear SET-Plan priority
technologies considered in the present report. This figure would increase to more than 50% if
instead of including only R&D on wind, PV, biofuels and CSP, all renewable energy-related
research was included.
Both in absolute and in relative terms this puts the EU in front of the US and Japanese public
R&D funds dedicated towards a similar set of 'non-nuclear SET-Plan priority technologies',
despite both countries having slightly larger total energy-related R&D budgets (yet including
nuclear). However, such comparison is misleading as it disregards the fact that the US and
Japanese energy programmes are strongly focussed, while synergies between EU Member
States currently remain under-exploited due to limited alignment of national programmes and
the slow uptake of joint activities.
The significant corporate R&D investments in non-nuclear SET-Plan priority technologies
indicate that these technologies are also being considered as important by industry. Corporate
R&D investments exceeded €1.65 billion in 2007, implying an important increase from 2006
in the order of magnitude of some 15%.
No data are available that would allow for an assessment of the share of corporate R&D
investments dedicated to non-nuclear SET-Plan priority technologies within the overall
energy-related R&D investments of industry. However, a very rough comparison with other
studies indicates that research investments for SET-Plan priority technologies play an
important role in total corporate energy R&D investments. The (rising) importance given to
R&D into SET-Plan priority technologies by both the corporate and the private sector would
also be supported by the increasing number of patent applications in renewable energy
technologies (Johnstone et al., 2008).
Even so, the R&D intensities in those sectors for which a turnover could be obtained remain
low compared to other emerging sectors.
50
For the wind, PV and biofuel sectors, the R&D
intensities derived from the present report are in the order of 2.2-4.5%. Even though they are
well above the R&D intensities of traditional energy companies (see below conclusion 3),
they fall largely behind the R&D intensities of other sectors that experienced a boom in recent
years, such as the IT-related sectors 'software', 'computer hardware' or 'semi-conductors' with
R&D intensities in the order of 8% to 18% over the past five years
51
.
50
Note that from a methodological point of view R&D intensities cannot directly be compared between
different sectors due to the considerable differences in their innovation systems (see e.g. Malerba, 2004,
on sectoral systems of innovation; Kaloudis and Pedersen, 2008, on the energy sector).
51
Figures relate to EU-based companies and are taken from various versions of the EU Industrial R&D
Investment Scoreboards (Hernandez Guevara et al., 2008).
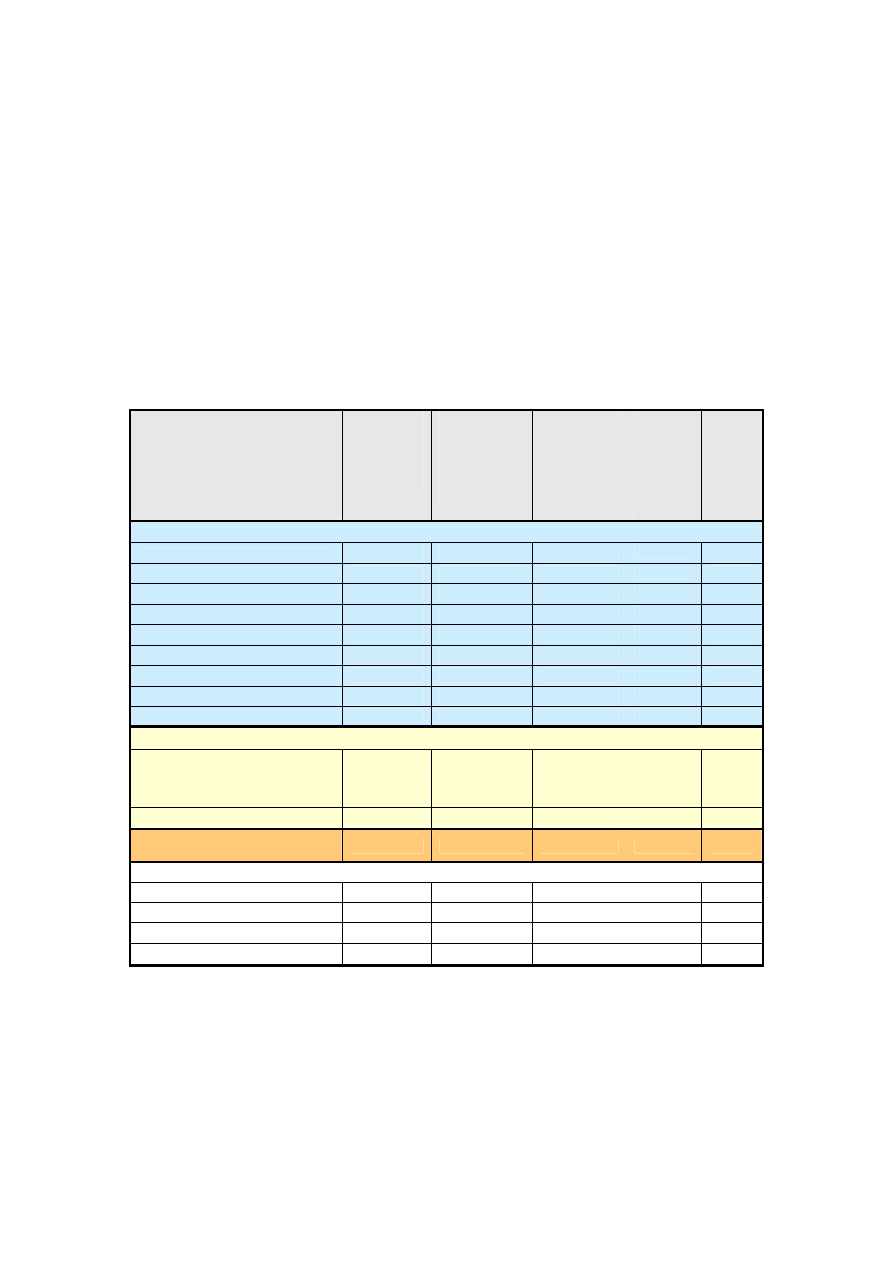
EN
69
EN
(2)
Aggregated public and corporate R&D investments are in a similar range for
most non-nuclear SET-Plan priority energy technologies. Exceptions are R&D
funds dedicated to hydrogen and fuel cells and those for concentrating solar
power.
European R&D investments dedicated to CCS, smart grids, biofuels, wind energy and
photovoltaics are in-between €270 million and €380 million each (see Table 7). Substantially
larger R&D investments were found only for hydrogen and fuel cells research. This may be
explained by the fact that this field comprises a broad diversity of different technologies from
various ways of hydrogen production to manifold areas of applications for fuel cells, and is
thus of interest to a large number of large and small companies with different backgrounds
(e.g. car manufacturers; electric utilities; chemical companies and component suppliers). On
the other hand, R&D investments in Concentrating Solar Power are considerably below
investments in other SET-Plan priority technologies due to the fact that this technology is of
interest to a limited number of EU countries and companies only.
Corporate
R&D
investment
2007
(€ million)
Public EU
(FP6
respectively
EURATOM;
avg per year) in
€ million
Public R&D
spending of
EU Member
States in
2007
(€ million)
(Out of
which
demonstra
tion in
MS
national
budgets)
Total
Non-nuclear SET-P priority technologies
Hydrogen and fuel cells
375
70
171
(24)
616
Wind
292
11
81
(24)
383
PV
221
27
136
(15)
384
CCS
240
17
39
(0)
296
Biofuels
269
13
65
(19)
347
Smart Grids
212
14
47
(5)
273
CSP
48
5
33
(1)
86
SUM (non-nuclear LC techs)
1656
157
571
(88)
2385
Distribution by investor
69%
7%
24%
100%
Nuclear SET-P priority technologies
Nuclear Fission reactor (mainly
reactor related research, thus
without safety, waste, environment)
205
4
248
(0)
458
Nuclear Fusion
0
204
278
482
Total SET-Plan priority energy
technologies
1862
366
1097
(88)
3325
Other relevant energy technology groups (including some of the above)
Fossil Fuels
n.a. n.a 240
(5)
All Renewable Energies
n.a. 94 557
(142)
Bioenergy
n.a. 31 245
(94)
Total Nuclear Fission
550 115 587
(1)
1252
Table 7:
Summary of results
Source: JRC-IPTS, rounded numbers
The uncertainties stemming from the methodology applied in this report do not allow a
precise ranking of R&D investments by technology as uncertainties may reach the same order
of magnitude as the actual differences between the R&D investments found for those
technologies. In particular, uncertainties for corporate R&D investments are larger for those
technological fields that attract large companies which are simultaneously active in research

EN
70
EN
on various technologies. This is the case e.g. for hydrogen and CCS, while many of the
companies active in e.g. wind energy research primarily work in this area. In the latter case
uncertainties are reduced as no assumptions would need to be made on how R&D investments
are distributed across different technologies. At the same time, public R&D budgets may be
underestimated for novel technologies such as CCS, biofuels or smart grids, thus creating an
additional uncertainty.
(3)
Corporate R&D investments account for an important share in overall R&D
spending for almost all non-nuclear SET-Plan priority energy technologies.
Component suppliers, machinery industry and specialised (alternative) energy
companies play an important role for innovation in the energy sector.
Corporate R&D investments account for almost 70% of the total R&D spending in non-
nuclear low carbon technologies. This hints at the active role of EU-based companies in these
technologies and the acknowledgment of the importance of R&D for maintaining a strong
profile in those promising technologies.
The assessment indicates that innovation in the energy sector may not predominantly being
carried out by classical energy companies such as electric utilities or oil/gas suppliers.
Industries with elevated research activities in low-carbon energy technologies include
companies active in industrial machinery, chemicals, energy components or those that are
exclusively active in one area. This finding is also confirmed by the R&D intensities (2.2%-
4.5%) found for a number of SET-Plan priority sectors, which are well above those of
companies active in the electricity sector (0.6%) and oil and gas producers (0.3%). Their order
of magnitude rather compares to the R&D intensities of producers of electrical components
and equipment (3.4%) and industrial machinery (2.6%). This indicates that important parts of
the energy research are being carried out by companies other than traditional energy
companies (and that companies may consider the SET-Plan priority technologies as important
research areas).
This result is supported by previous assessments (e.g. Jacquier-Roux and Bourgeois, 2002
52
).
It is in line with the hypothesis that classical energy companies show a limited R&D intensity
due to the fact that they produce a homogenous good (electricity; fuels) with price
competition being the main competition success criterion; the energy sector could thus be
described as a 'supplier-dominated sector' following the classification of Pavitt (1984).
(4)
Substantial investments are also dedicated to R&D in nuclear SET-Plan priority
technologies (approx. €0.9 billion). Fusion R&D receives high public budgets due
to the capital investment needs of the on-going ITER construction.
Even though all nuclear electricity production is considered low carbon, the focus of the
nuclear-fission related research in the SET-Plan lies on generation IV reactors. Unfortunately,
no estimation of the R&D investments for generation IV reactors could be made within the
present report. Nonetheless, in order to narrow down the nuclear fission related nuclear R&D
investments, research efforts on nuclear reactor technologies have been used as a proxy, even
though this approach overestimates the generation IV-related parts of the R&D spending.
52
See also Kaloudis and Pedersen (2008) who state that "Very schematically, we could claim that the
sector is polarised between large, non-R&D process innovating incumbents on the one hand, and on the
other hand small new entries, often R&D-based and specialised on one type of renewable energy
technology."

EN
71
EN
Nuclear reactor related R&D investments total around €460 million, almost half of which is
being financed by industry (45%). Both private and public R&D efforts are largely
concentrated in France. Public sector financing tends to concentrate on commercially riskier,
longer-term and pre-competitive R&D, e.g. that currently being undertaken on generation IV
reactor systems.
Fusion-related energy research constitutes an exception in a threefold way. Firstly, it is
implemented through a single European Programme, which explains the high contribution of
EU EURATOM funds. Secondly, there is currently hardly any industry investing in fusion
given the long time horizon of this research area. Thirdly, the forthcoming construction phase
of ITER is associated with high capital investments on a large scale research infrastructure
that will be used by the global fusion research community for a long period of time. These
factors explain the R&D investments in nuclear fusion of around €482 million in 2007 and the
further increase of the budgets for the next years, all of which are publicly financed. In FP7,
the Euratom contribution has risen to €1947 million over 5 years.
(5)
Both public and corporate R&D investments in SET-Plan priority technologies
are largely concentrated in a limited number of EU Member States. For many
technologies, the countries with high public R&D funds simultaneously account
for the largest corporate R&D investments.
The assessment of the present report indicates that more than 99% of the aggregated national
(nuclear and non-nuclear) R&D budgets directed towards SET-Plan priority technologies
originate from eleven Member States: France, Germany, the UK, Denmark, Italy, Spain,
Sweden, Belgium, the Netherlands, Finland and Austria with the first three accounting for
almost 70% of the total. At the same time, the R&D investments from companies located in
Germany, France, the UK, Denmark, Spain and Sweden were found to make up almost 95%
of the total corporate investments.
(6)
Public and industrial research investments seem to complement one another.
In many cases, the group of countries that give strong support to research into a certain
technology from public funds simultaneously shows the largest R&D investment of industry
into that technology. This may be seen as an indication of a positive correlation between
public research support and industrial R&D investments. Such a hypothesis would be
supported by Jaumotte and Pain (2005), who found that an increase of non-business R&D had
a positive effect on both private sector R&D and patenting.
Such a relation, is however not straight-forward. Without being exhaustive, Member States
may decide to support research to those technologies for which a domestic industry exists. At
the same time, technologies that are considered strategic within a national energy strategy
would be supported both through push (R&D) and pull (deployment) instruments, which may
trigger the creation of a domestic industry for that technology. In this context, Johnstone et al.
(2008) demonstrate on the basis of patent applications for renewable energies that both R&D
policies and market introduction policies have a significant impact on the innovation activity
in a country.
According to the classical innovation theory, technologies that are close-to-market and thus
require expensive pilot plants and up-scaling would face larger industrial contribution, while
technologies that are further from market are mainly publicly financed as industry would not

EN
72
EN
want to take the risk. At the same time, the share of support that targets demonstration
activities within public budgets would be elevated for more mature technologies.
This theory can partially be supported by the assessment of the present report, even if the
scope of the report includes demonstration only to a very limited part (see section 2.1).
Besides, data gaps prevent a clear proof. Nevertheless, it can be observed that the share of
corporate R&D investments is elevated for rather mature technologies like wind energy and
biofuels
53
. Also the publicly funded demonstration activities are comparably large for wind
and biofuels. At the same time, PV, generation IV reactors and CSP experience relatively less
industrial support (and a lower part of the public R&D funds is dedicated to demonstration).
Following the above hypothesis, this may be explained by the fact that the latter three
technologies can be considered as less mature if one assumed that research in PV largely
focuses on new technologies rather than dealing with the more mature crystalline silicon cells.
On the extreme end, all fusion related research is publicly funded. Hydrogen and fuel cell
research somehow constitute a hybrid due to the fact that this category comprises a wide
variety of technologies both on the fuel production as well as on the (mobile and stationary)
consumption side, with the individual technologies having reached different levels of
maturity.
However, the above finding must be interpreted with care. The direct comparison between
public and corporate R&D investments faces some uncertainties that result from likely
differences in the definitions of R&D between these actors (see also section 2.1 for a
definition of the scope of RD&D covered). The publicly (co-) funded research budgets
assessed in the present report probably tend to focus on basic research and pre-competitive
industrial research, while industry would be inclined to finance more applied research,
including pilot projects.
53
It is also elevated for CCS. This may, however, be due to an under-estimation of the public R&D
efforts.

EN
73
EN
6.
REFERENCES
BMU (German Ministry for the Environment, Nature Conservation and Nuclear Safety)
(2008): Erneuerbare Energien in Zahlen. Nationale und internationale Entwicklungen. Internet
Update Dec. 2008.
Boyle, R., Greenwood, C., Hohler, A., Liebreich, M., Sonntag-O'Brian, V., Tyne, A., Usher,
E. (2008): Global Trends in Sustainable Energy Investment 2008. Analysis of Trends and
Issues in the Financing of Renewable Energy and Energy Efficiency. United Nations
Environment Programme and New Energy Finance.
Curtright, A.E., Morgan, M.G., Keith, D.W. (2008): Expert Assessment of Future
Photovoltaic Technologies. Environ. Sci. Technol. 2008, 42 (24), 9031-9038.
De Nigris, M., Cereda, E., Thommessen, A., Flatabo, N., Graziado, M., Scarpa Mattachini, F.,
Paun, M., Czarnecki, B., Bolt, N., Gast, C. (2008): European Research spending for
Electricity Supply. Data Mining Final Report. Deliverable D3 of the ERMInE project
('Electricity Research Road Map in Europe').
DGEMP (Direction Générale de l'Energie et des Matières Premières – Observatoire de
l'Energie) (2007): Public Research and Development Expenditure on Energy in France, 30
May 2007.
DG TREN Task Force (2008): Report of the Task Force on Financing Low Carbon Energy,
July 2008.
Ernst, H. (1998): Industrial Research as source of important patents. Research Policy 27
(1998) 1-15.
EPIA (European Photovoltaic Industry Association) (2007): EPIA round table 6 - Research
and Development. In EPIA: Creating conditions for Solar Photovoltaic to go large, EPIA
Round Tables – Conclusions.
EUROBSERV'ER (2008a): Wind Energy Barometer. 57 Gigawatts in Europe – 93.7
Gigawatts worldwide.
EUROBSERV'ER (2008b): Photovoltaic Energy Barometer. Total EU installed capacity in
2007 4689.5 MWp.
EUROBSERV'ER (2008c): Biofuels Barometer. 7.7 Mtoe consumed in EU in 2007.
European Commission (2004): European Hydrogen and Fuel Cell Projects. EUR 21241.
European Commission (2005): Energy R&D Statistics in the European Research Area – Final
report. Brussels.
European Commission (2007a): A European Strategic Energy Technology Plan. Towards a
Low Carbon Future. Communication. COM (2007)723 final.
European Commission (2007b): European funded research on Hydrogen and Fuel Cells,
review assessment future outlook. Conference Proceedings of the Hydrogen and Fuel Cell
Review Days. Brussels, 10-11 October 2007. EUR 23171.
European Commission (2007c): European Electricity Projects 2002-2006. Project Synopses.
EUR 22575.
European Commission (2007d): Concentrating Solar Power, from Research to
Implementation.

EN
74
EN
European Commission (2007e): CO2 Capture and Storage Projects. Project Synopses. EUR
22574.
European Council (2008). Presidency Conclusions. Council of the European Union. Brussels,
28 February 2008.
EWEA (European Wind Energy Association) (2007): European Market for Wind Turbines
Grows 23% in 2006. EWEA News Release.
Filiou, C., Moretto, P., Martin-Bermejo, J. (2009): Research Priorities and Progress in
Hydrogen Energy Research in the EU. In: Wicks, G., Simon, J. (eds): Materials Innovations
in an Emerging Hydrogen Economy. Wiley. New Jersey.
Foxon, T.J. (2003): Inducing innovation for a low-carbon future: drivers, barriers and
policies. A report for the Carbon Trust. ICCEPT.
Freeman, C., Soete, L. (2009): Developing science, technology and innovation indicators:
What we can learn from the past. Research Policy 38 (2009) 583-589.
Gioria, M. (2007): Gathering private energy R&D expenditure: A methodological note. In
SRS Project (2007).
Goodhart, C.A.E. (1975): Monetary Relationships: A view from Threadneedle Street. Papers
in Monetary Economics. Reserve Bank of Australia.
Griliches, Z. (1990): Patent statistics as economic indicators: a survey. J. Econ. Lit. 18(4),
1661-1707.
Griliches, Z., Pakes, A., Hall, B.H. (1986): The value of patents as indicators of inventive
activity. Discussion paper no 1285. Harvard Institute of Economic Research, Cambridge.
Grubb, M. (2004): Technology Innovation and Climate Change Policy : An Overview of
Issues and Options. Keio economic studies 41(2) pp.103-132.
Haug, M. et al. (2009): The role of public and private R,D &D expenditure in the diffusion of
renewable energy: a CSP case study. Hohenheimer Diskussionsbeiträge, forthcoming.
Hernández Guevara, H., Tübke, A., Brandsma, A. (2008): The 2008 EU Industrial R&D
Investment Scoreboard. DG Research – Joint Research Centre, Institute for Prospective
Technological Studies. EUR 23530 EN.
IEA (2004): Hydrogen and Fuel Cells – Review of National R&D Programs. IEA/OECD.
IEA (2008): Questionnaire for country submissions for the 2008/2009 SLT/CERT annual
review of energy policies. Annex II. IEA/SLT/CERT (2008)5.
Jacquier-Roux, V., Bourgeois, B. (2002): New Networks of Technological Creation in Energy
Industries: Reassessment of the Roles of Equipment Suppliers and Operators. Technology
Analysis & Strategic Management 14(4), 399-417.
Jaumotte, F., Pain, N. (2005): "From Ideas to Development: The Determinants of R&D and
Patenting. OECD Economics Department Working Papers, No. 457, OECD Publishing.
doi:10.1787/702226422387
Johnstone, N., Hascic, I., Popp, D. (2008): Renewable Energy Policies and Technological
Innovation: Evidence Based on Patent Counts. NBER Working Paper Series, Vol. w13760,
pp. 1-36, 2008.
JRC (2008): The Joint Research Centre. Facts and Figures for the Ex-Post FP6 Evaluation
Panel.

EN
75
EN
Kaloudis, A., Pedersen, T.E. (2008): Sectoral Innovation Systems in Europe: Monitoring,
Analysing, Trends and Identifying Challenges. The Energy Sector. Europe Innova.
Kutas, G., Lindberg, C., Steenblik, R. (2007): Biofuels - At What Cost? Government support
for ethanol and biodiesel in the European Union. One of a series of reports addressing
subsidies for biofuels in selected OECD countries, prepared for the Global Subsidies
Initiative, October 2007.
Langlois d'Estainot, T. (2009), European Perspective on Wind Energy Research, presentation
at the European Wind Energy Conference and Exhibition (EWEC), Marseille, 2009.
Malerba, F. (Ed) (2004): Sectoral Systems of Innovation. Concepts, Issues and Analyses of
Six Major Sectors in Europe. Cambridge University Press.
Margolis, R.M., Kammen, D.M. (1999): Evidence of under-investment in Energy R&D in the
United States and the Impact of Federal Policy. Energy Policy 27, 575-84.
MEEDDAT (Ministère de l'écologie, de l'énergie, du développement durable et de
l'aménagement du territoire) (2008): Dépenses publiques de recherche et développement sur
l'énergie en France, 22 juillet 2008.
Menna, P., Gambi, R., Gillett, W., Tondi, G., Anderson, D., Deschamps, G., Ostrom, R.,
Scholz, H.(2007): European Photovoltaic RTD and Demonstration Programme. Paper
presented at the 22nd European Photovoltaic Solar Energy Conference, Milan, September
2007.
Naneva, M., Paschos, V. (2008): Assessment of corporate R&D investments in the energy
sector. Work prepared during an internship at the European Commission.
Neef, H.-J. (2008): International overview of hydrogen and fuel cell research. Energy (2008),
doi:10.1016/j.energy.2008.08.014. To be published.
New Energy Finance (2008): Corporate RD&D into clean energy in 2007: General Electric
sets example. Research Note, 14 January 2008.
OECD (2002): Proposed Standard Practice for Surveys on Research and Experimental
Development: Frascati Manual 2002. OECD, Paris.
Orion Innovations (2008): Hydrogen Future Study – HyFuture. Report prepared for the
Scottish Hydrogen and Fuel Cell Association, Final Report, 31 March 2008.
Pavitt, K. (1984). Sectoral patterns of technological change: towards a taxonomy and a theory.
Research Policy Vol. 13, pp. 343-373.
Popp, D. (2005): Lessons from patents: using patents to measure technological change in
environmental models. Ecological Economics 54(2005)209-226.
PWC (Price Waterhouse Coopers), US Fuel Cell Council, Hydrogen and Fuel Cell Canada,
Fuel Cell Commercialisation Conference of Japan, Fuel Cell Europe (2007): 2007 Worldwide
Fuel Cell Industry Survey.
Rossetti di Valdalbero, D., Schmitz, B., Raldow, W., Poireau, M. (2007): European Union
Energy research. Revue de l'Energie, 576:77-85.
Ruhl, V., Lütter, F., Schmidt, C. (2008): Standortgutachten Photovoltaik in Deutschland -
Aktualisierung wichtiger Kennzahlen. EUPD-Research.
Schneider, R. (2007): Förderung der nichtnuklearen Energieforschung durch die
Bundesländer. Forschungszentrum Jülich GmbH.

EN
76
EN
SRS project (2007): Gathering Energy RTD Expenditures: The conditions for data
collections. Developed within the SRS NET & EEE project under FP6 ("Scientific Reference
System on new energy technologies, energy end-use efficiency and energy RTD").
SRS project (2008): Analysis of Energy RTD expenditures in the European Union. Results of
the Work Package 4 of the SRS NET & EEE project under FP6 ("Scientific Reference System
on new energy technologies, energy end-use efficiency and energy RTD").
TP Wind (2008): European Wind Energy Technology Platform - Strategic Research Agenda.
Market Deployment Strategy. From 2008 to 2030.
U.S. DOE, Energy Efficiency and Renewable Energy (EERE) (2008): Fiscal Year 2009:
Budget-in-Brief. http://www1.eere.energy.gov/ba/pba/budget_09.html
Van Beeck, N., Doukas, H, Gioria, M., Karakosta, C., Psarras, J. (2009): Energy RTD
expenditures in the European Union: Data gathering procedures and results towards a
scientific reference system. Applied Energy 86(2009) 452-459.
Wiesenthal, T., Saveyn. B., Soria, A., Nill, J., Rubio, J. Nemeth, G. (2008): Energy Research
Capacities in EU Member States. IPTS Scientific and Technical Reports EUR 23435.
ZEP (Technology Platform for Zero Emission Fossil Fuel Power Plants) (2008a): Zero
Emission fossil fuel Power plants. Country profile UK. May 2008 update.
ZEP (2008b): The European energy industry commits to the costs and risks of an EU
Industrial Initiative on CCS. Letter to Commissioner Piebalgs from 21. February 2008.
Zervos, A., Kjaer, C., Clifford, S. (2008): Pure Power. Wind Energy Scenarios up to 2030.
European Wind Energy Association.

EN
77
EN
7.
L
IST OF ACRONYMS
BERD Business Expenditures on R&D
BES Business Enterprise Sector
bn billion
CCS Carbon dioxide capture and storage
CSP
Concentrating Solar Power
DG RTD
Directorate-General for Research
DG TREN
Directorate-General Energy and Transport
DG Directorate-General
(of
the European Commission)
DoE Department of Energy (USA)
EC European
Commission
EII European
Industrial
Initiative
EMEA Europe, Middle East and Africa
EPIA European Photovoltaic Industry Association
ERA-NET
European Research Area Networks
ERMINE
Electricity Research Road Map in Europe (FP6 project)
EU or EU-27 European Union
EWEA European Wind Energy Association
FP Framework
Programme
FP6 6
th
Research Framework Programme
GBAORD
Government Budget Appropriations or Outlays on R&D
GDP Gross Domestic Product
GEN-IV
Generation IV nuclear reactors
H2/FC Hydrogen and Fuel Cells
ICB
Industry Classification Benchmark
IEA
International Energy Agency
IPTS Institute for Prospective Technological Studies (of the JRC)
ITER International Thermonuclear Experimental Reactor
JRC
Joint Research Centre (of the European Commission)
JTI
Joint Technology Initiative
m million
MEEDDAT Ministère de l'écologie, de l'énergie, du développement durable et de
l'aménagement du territoire (France)
METI Ministry for Economy, Trade and Industry (Japan)
MS
Member State of the European Union
NACE Statistical Classification of Economic Activities
NNE Non-nuclear
Energy
OECD Organisation for Economic Co-operation and Development
PV Photovoltaic
R&D Research and Development
RD&D Research, Development and Demonstration
RTD Research Technology Development
SETIS Strategic Energy Technology Plan Information System
SET-Plan (European)
Strategic Energy Technology Plan
SME Small and Medium Sized Enterprises
SRS NET & EEE
Scientific Reference System on new energy technologies, energy end-
use efficiency and energy RTD (FP6 project)
TP Technology
Platform
Document Outline
- 1. EXECUTIVE SUMMARY
- 2. INTRODUCTION
- 3. METHODOLOGY
- 3.1. Scope of the report
- 3.2. Industrial R&D investments
- 3.3. Member States' public R&D investments
- 3.4. EU FP6 public energy R&D investments
- 4. RESULTS
- 5. CONCLUSIONS
- 6. REFERENCES
- 7. LIST OF ACRONYMS
Wyszukiwarka
Podobne podstrony:
Being Warren Buffett [A Classroom Simulation of Risk And Wealth When Investing In The Stock Market]
[Mises org]Raico,Ralph The Place of Religion In The Liberal Philosophy of Constant, Toqueville,
Investing in the Future
Homosexuals in the Military Analysis of the Issue
Blood in the Trenches A Memoir of the Battle of the Somme A Radclyffe Dugmore
Increased diversity of food in the first year of life may help protect against allergies (EUFIC)
Knudsen, 3rd Hand in the Angers Fragment of Saxo Grammaticus
Haranas Redshift Calculations in the Dynamic Theory of Gravity
In the Key Chords of Dawn
Robert P Smith, Peter Zheutlin Riches Among the Ruins, Adventures in the Dark Corners of the Global
NLP How MetaStates Fill In The Missing Pieces of NLP
recent developments in the med chem of cannabimimetic indoles pyrroles and indenes curr med chem 12
Sipperl The Machine in the Pastoral Imagery of 18th century utopia
Holt Edward Out of many One The voice(s) in the crusade ideology of Las Navas de Tolosa Thesis final
Stephen King A Bedroom In The Wee Hours Of The Morning
Production networks and consumer choice in the earliest metal of Western Europe
How Meta States Fills in the Missing Pieces of NLP
więcej podobnych podstron