
1
Absorption, marginal
and activity based costing
Chapter
4

2
4.1
Absorption costing
When costing for the manufacturing of different products, the direct or variable cost of
producing the product can be found easily enough to find a cost per unit. However the fixed
or indirect production overhead cost is harder to identify for the manufactured cost of making
a finished product. Fixed production overhead is an example of a period cost, a cost deducted
as an expense during an accounting period, it is a cost relating to time rather than the direct
manufacturing or brought in cost of a product.
Absorption costing attempts to calculate a budgeted fixed production overhead cost per
activity e.g. using units or hours, at the beginning of a period. This information can be used
for full cost pricing of different products (the variable as well as the fixed production
overhead cost per unit of a product identified). It will help to cost and price different
products more effectively; also it helps develop a costing system to charge fixed production
overhead during a period to different jobs, batches, contracts or work-in-progress accounts.
Indirect overhead or fixed cost is a cost which cannot be easily identified or related to a cost
per unit produced or an activity of any kind e.g. a cost which remains constant when the
production of a good or service within the organisation rises or falls.
Absorption costing forecasts the fixed production overhead to be budgeted at the
beginning of a period, for different cost centres e.g. departments or items of equipment.
It then divides the budgeted fixed overhead for the different cost centres, by a normal
(budgeted) activity level within each cost centre, to find an overhead absorption rate.
Overhead absorption rate (OAR) = Budgeted fixed production overhead
Normal (budgeted) level of activity
This is a simple method and allows fixed overhead to be allocated to products in order to
standard cost, value stock, obtain prices or measure profitability. It is over 100 years old.
Traditionally
1. A company had a single or small range of products.
2. Fixed overhead was a small percentage of total cost.
3. Mass production techniques were used.
This is why absorption costing 100 years ago and in simple modern environments today, is
still accepted and used in practice as a costing system.

3
4.2
Cost centres
Cost centres act as collection places or codes for costs to be analysed, before they are
analysed further and ascertained to a cost unit.
A cost centre is a production or service location, function, activity or item of equipment for
which overhead costs are accumulated. (CIMA)
A production cost centre is a cost centre directly involved in the production process e.g. a
production, machining or assembly department. A service cost centre supports the different
production cost centres. Service centres are not directly involved in the production process
e.g. the canteen, warehouse or quality control department.
4.3
The absorption process
Step 1
Allocate (give directly to) or apportion (share/divide) budgeted fixed production
overhead between cost centres used by the organisation at the start of the financial
period.
Step 2
After the first process above reapportion the budgeted fixed production overhead
allocated or apportioned to service cost centres to production cost centres. This
eliminates any fixed overhead apportioned to service cost centres in Step 1.
Step 3
Absorb (charge) the budgeted fixed production overhead from production cost
centres directly to cost units, work-in-progress accounts or jobs undertaken during
the financial period by the organisation, using budgeted fixed overhead absorption
rates calculated for the different production cost centres.
4
Absorbing indirect production overhead to cost units, work-in-progress or jobs
Once the process above has been completed pre-determined overhead absorption rates can be
calculated at the beginning of the period for each production cost centre
Overhead absorption rate (OAR) =
Budgeted production overhead
Normal level of activity
The normal activity can be based upon
Budgeted units
Budgeted labour hours
Budgeted machine hours
Budgeted % of direct labour cost
Budgeted % of direct material cost
Budgeted % of prime cost
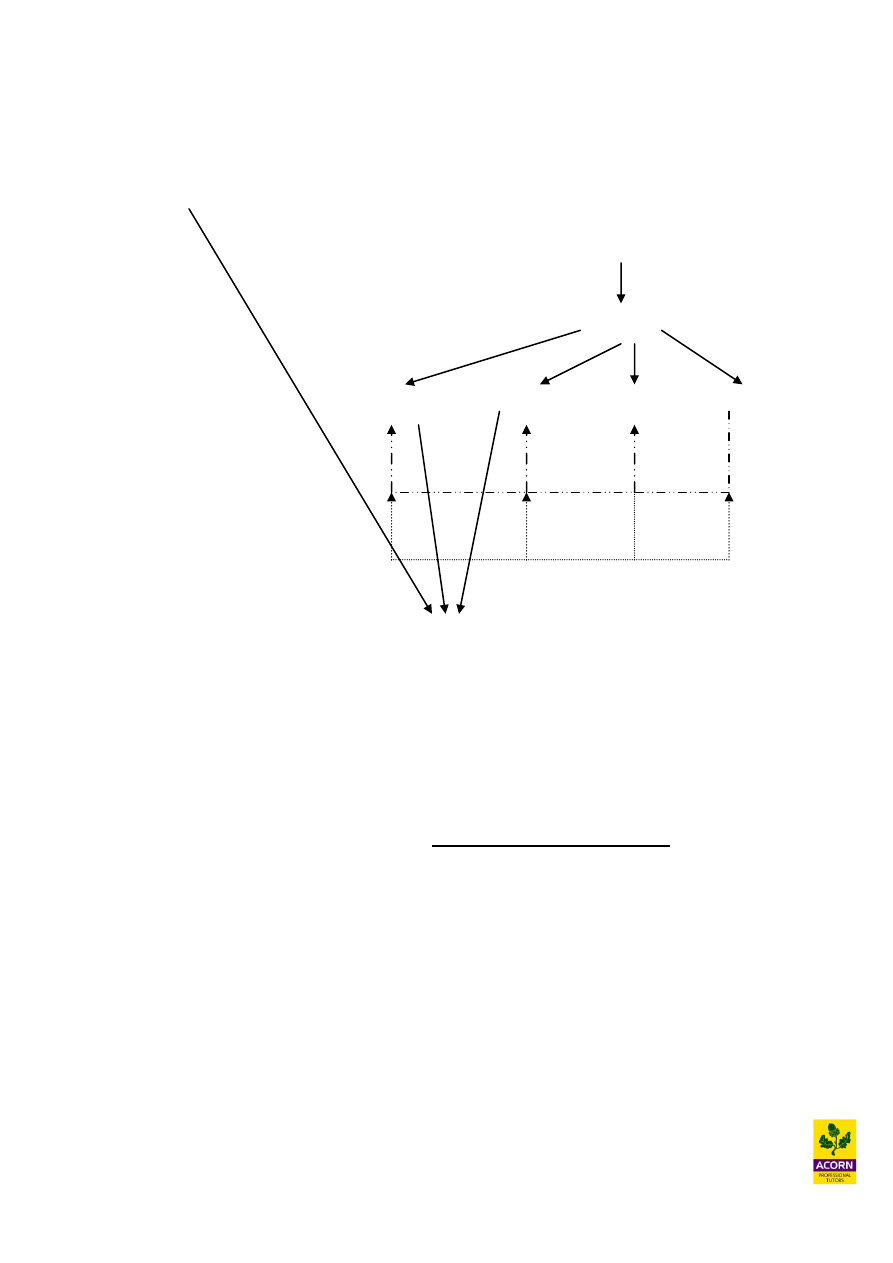
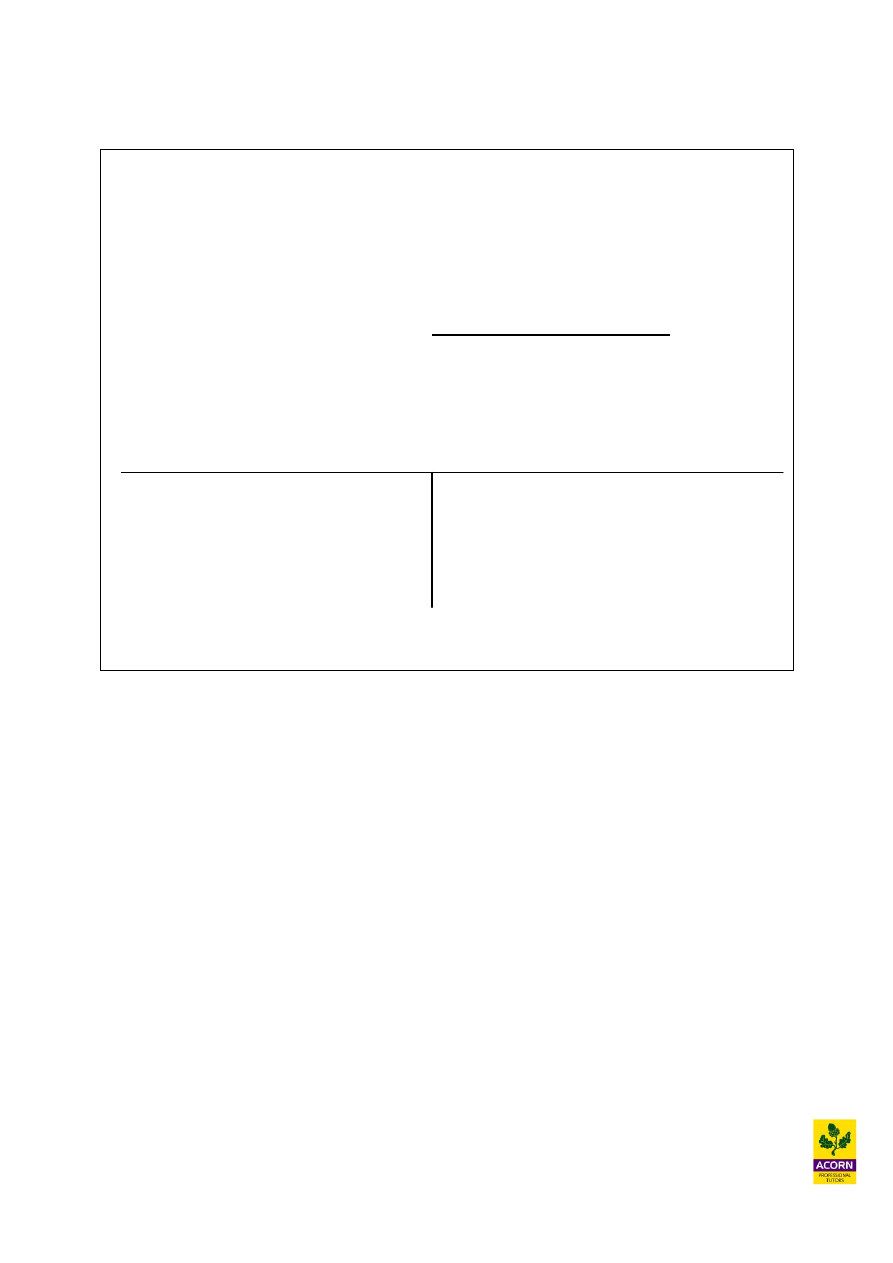
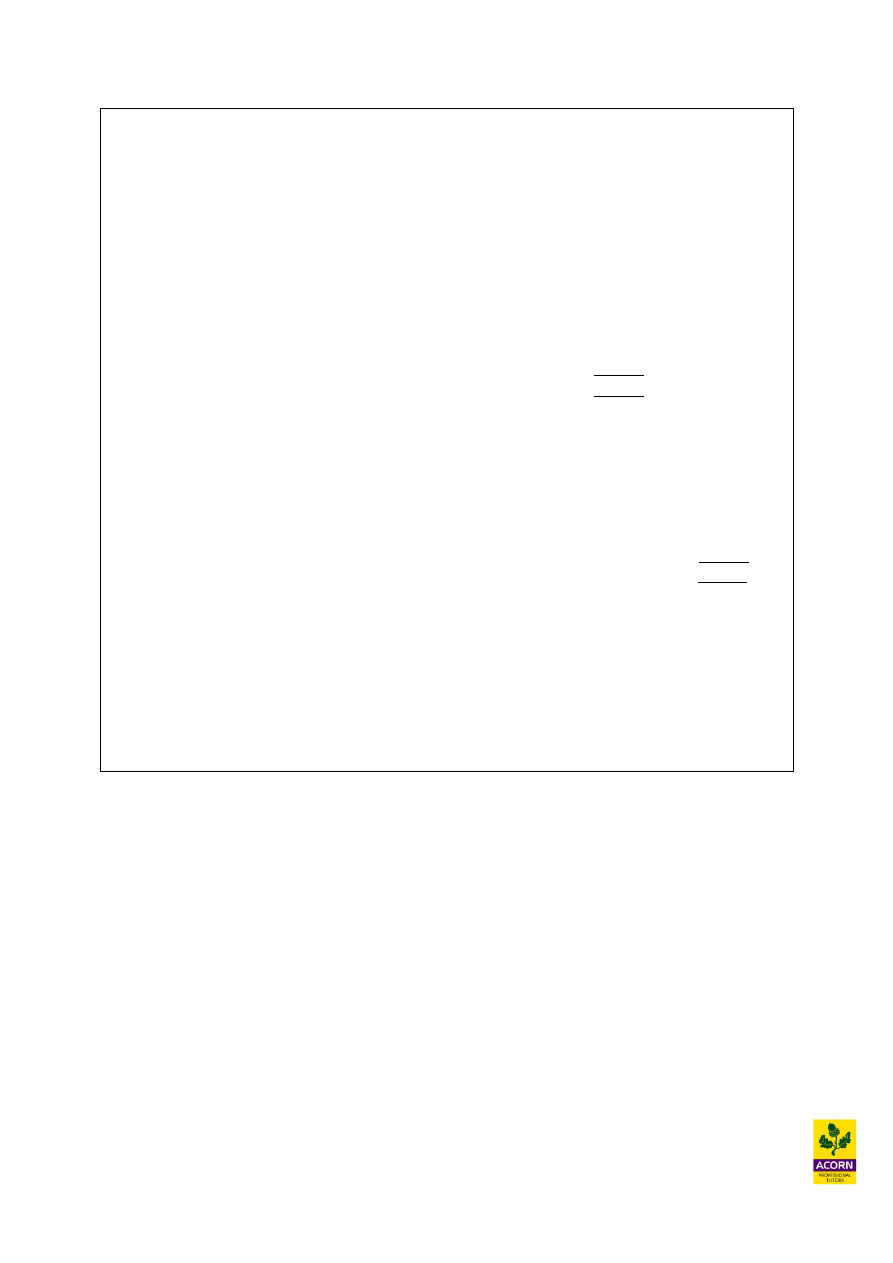
COST CENTRES
Reapportion overhead from
service to production cost
centres
Production 1
BUDGETED DIRECT COST
BUDGTED
INDIRECT
COSTS
(Production overhead)
Production 2
Service 2
Service 1
Absorb budgeted
production overhead from
production cost centres to
cost units
COST UNIT

5
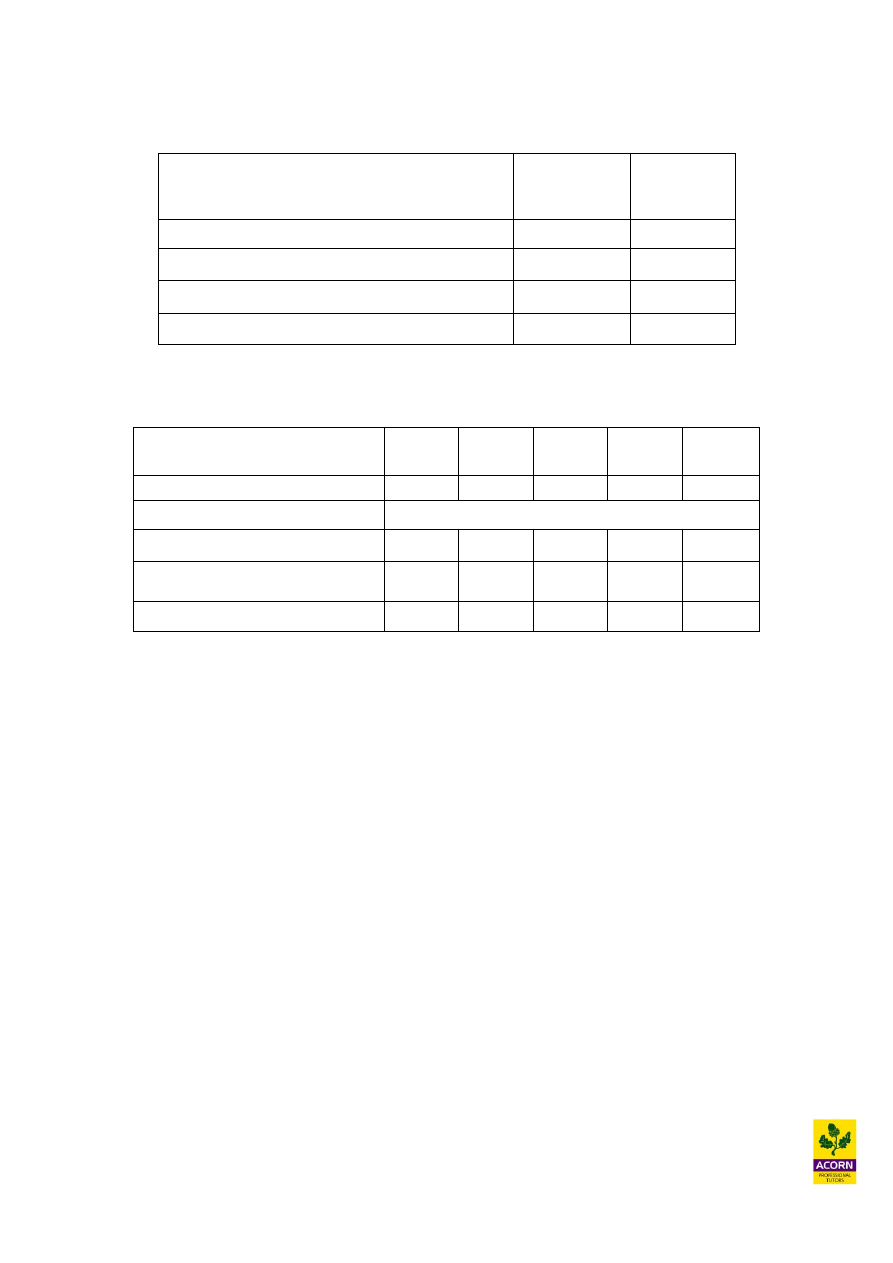
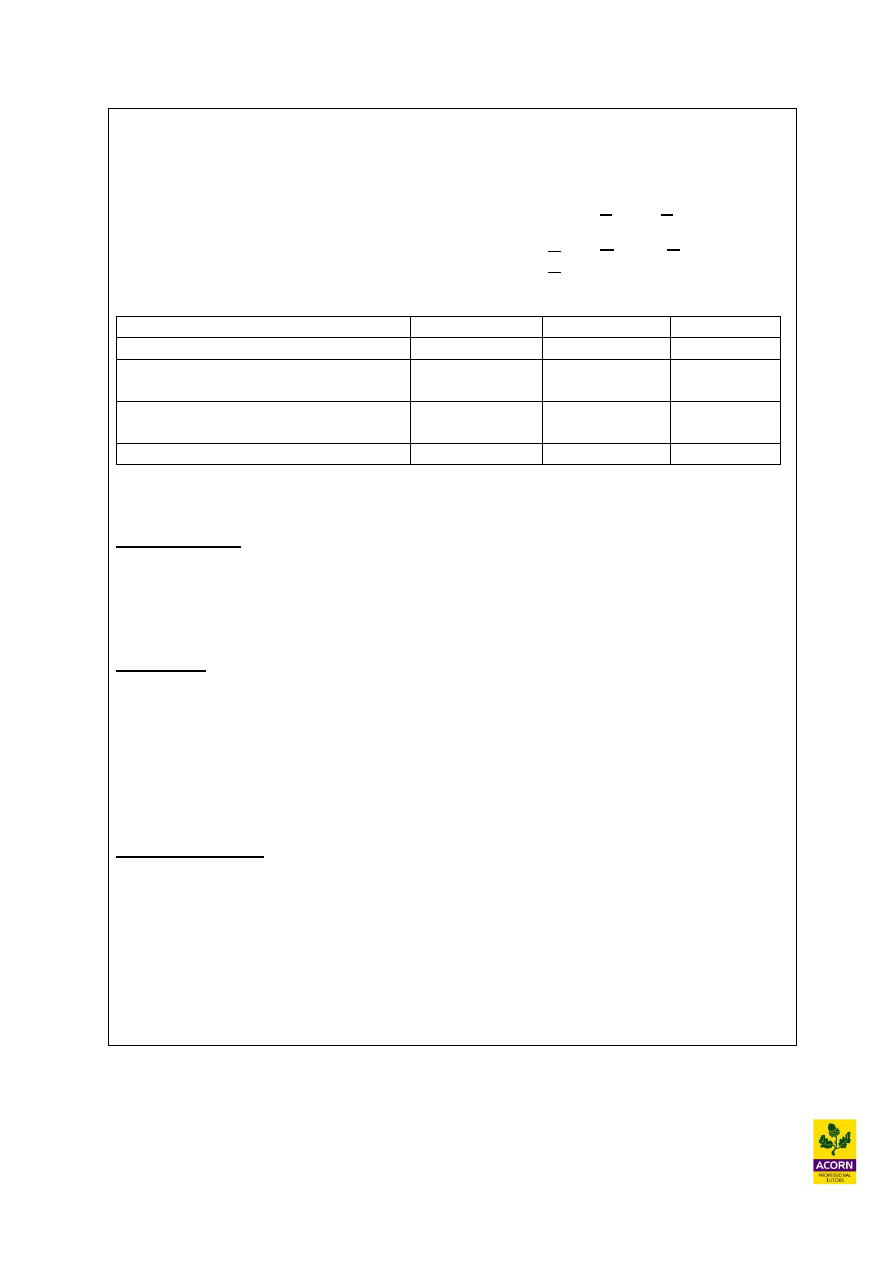
Example 4.1 – Worked example
The following budgeted overhead has been apportioned to production cost centres only
Assembly Machining
Budgeted indirect overhead
allocated and apportioned (£000s)
1473.1
1976.8
The following information is available
Budgeted machine hours in department 20,000
200,000
Budgeted labour hours
in department 130,000
100,000
Given that assembly would seem to be more labour than machine hour intensive an overhead
absorption rate would be calculated as follows, using labour hours
£1,473,100/130,000 hours = O.A.R £11.33 per labour hour
Given that machining would seem to be more machine than labour hour intensive an
overhead absorption rate would be calculated as follows, using machine hours
£1,976,800/200,000 hours = O.A.R £9.88 per machine hour
These absorption rates could now be used as a basis of charging production overhead to jobs
or work-in-progress in order to find a price or measure the profitability of a job or batch
produced, we could have also used budgeted units or % of budgeted cost as other methods of
finding an overhead absorption rate.
4.4
Accounting for fixed production overhead when absorption costing
Absorption accounting assigns fixed production overheads to cost units, jobs or work-in
progress accounts by using overhead absorption rates. When calculating overhead absorption
rates there is no true scientific technique used in order to select an activity level e.g. fixed
overhead can be charged on the basis of actual hours, units or cost. The method selected
should be a fair and reasonable one.
An overhead absorption rate (O.A.R) is pre-determined at the beginning of a financial period
and actual fixed overhead is charged by the process of absorption (the accounting process
below). It is likely a difference or balance within the production overhead control account
will arise at the end of a financial period, this balance is referred to as an under or over
absorption of fixed overhead. This would mean fixed overhead accounted for during a
financial period has been under or over charged.
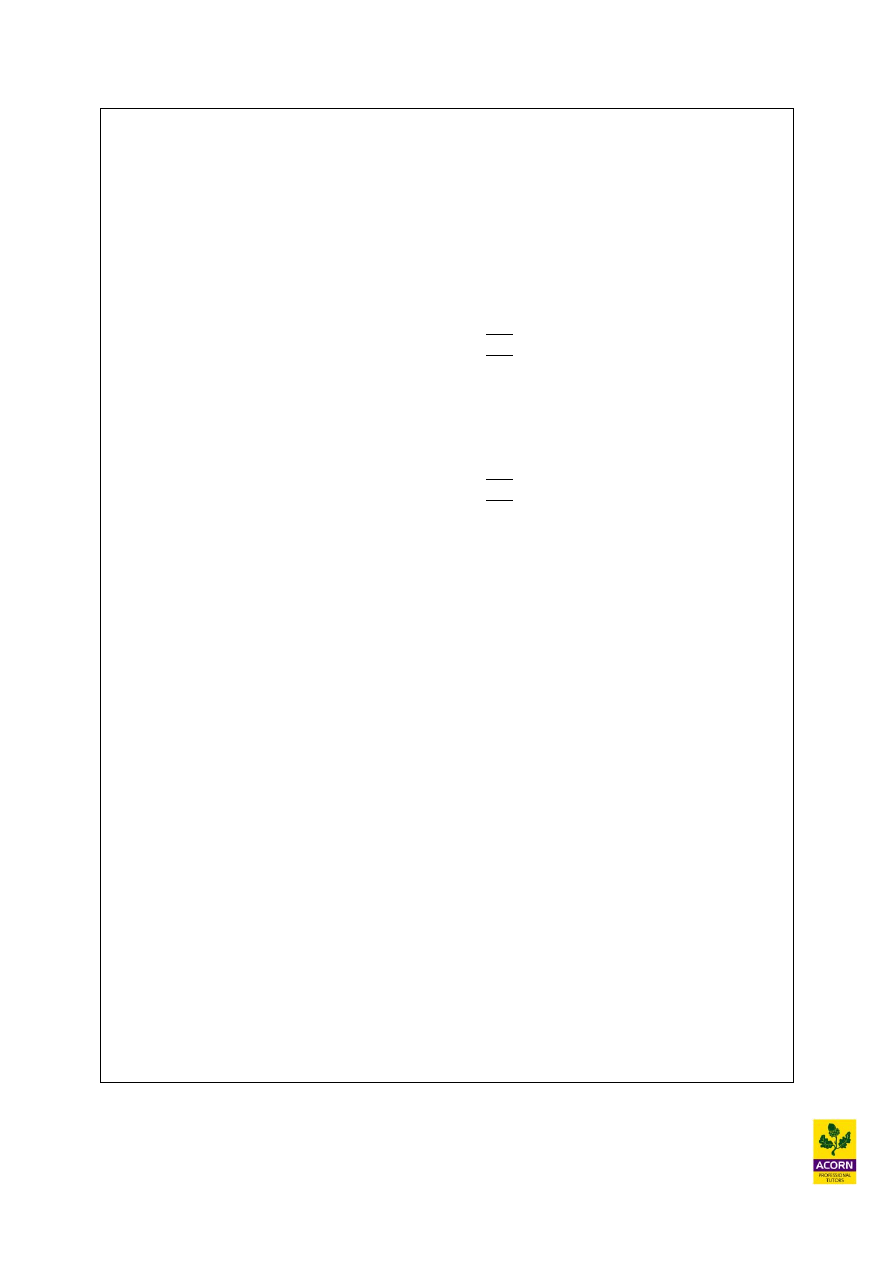
6
During the financial period the actual fixed overhead incurred is recorded within the
production overhead control account
Debit Production overhead control account
Credit
Creditor (or cash)
During the financial period fixed overhead is absorbed (charged) from the production
overhead control account to jobs or work-in-progress accounts (ultimately ending up
being charged as an expense in the income statement).
Debit Income statement (as a fixed overhead expense)
Credit
Production overhead control account
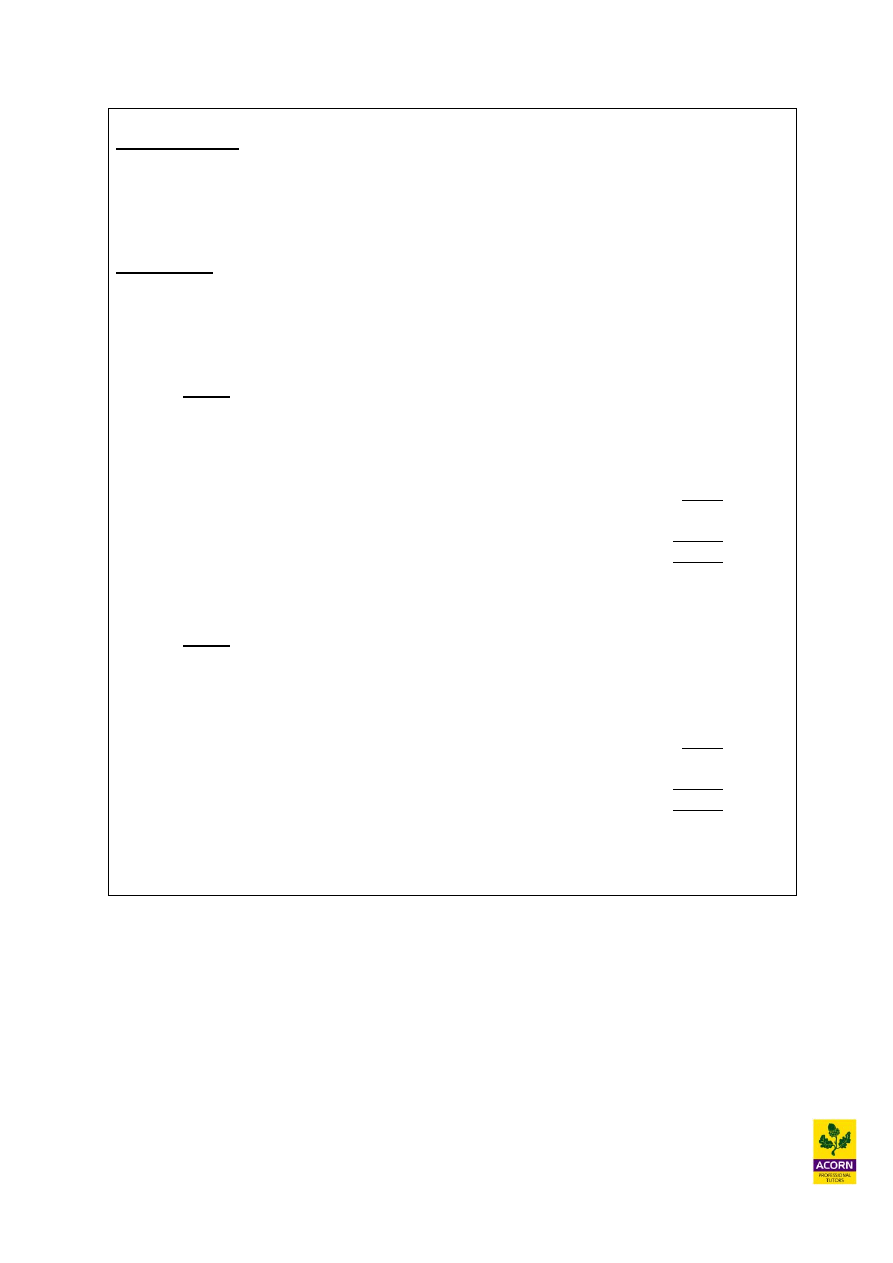
At the end of the financial period the fixed overhead ‘absorbed’ is compared to the
actual production overhead recorded and incurred for the period.
Any shortfall in fixed overhead absorbed during the financial period to the income
statement would be an ‘under absorption’ of production overhead
Debit Income statement (as a fixed overhead expense)
Credit
Production overhead control account
Absorbed fixed overhead + Under absorption = Actual production overhead
Any surplus in fixed overhead absorbed during the financial period to the income
statement would be an ‘over absorption’ of production overhead
Debit Production overhead control account
Credit
Income statement (as a fixed overhead expense)
Absorbed fixed overhead - Over absorption = Actual production overhead
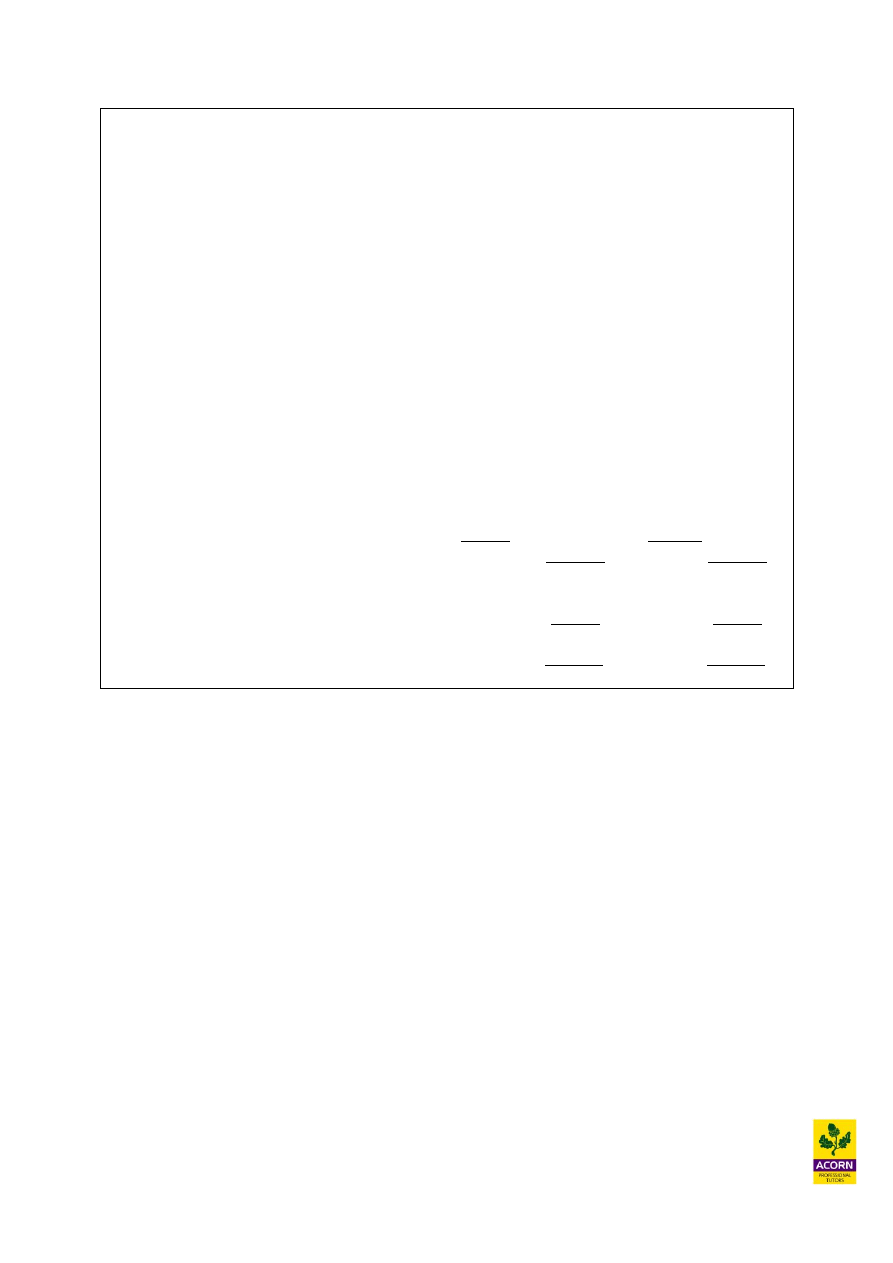
Actual production overhead
Over absorption (Balance)? X
Absorption of fixed overhead
for the financial period
actual activity level x O.A.R
Under absorption (Balance)? X
Production overhead control account
X
X
7
Under absorption = Actual FOH > Budgeted FOH
Over absorption = Actual FOH < Budgeted FOH
Causes of over absorption for a financial period
The actual activity used to absorb fixed overhead was greater than the budgeted
activity used to calculate the overhead absorption rate and/or
The actual fixed overhead was less than the budgeted fixed overhead
Causes of under absorption for a financial period
The actual activity used to absorb fixed overhead was less than the budgeted activity
used to calculate the overhead absorption rate and/or
The actual fixed overhead was more than the budgeted fixed overhead
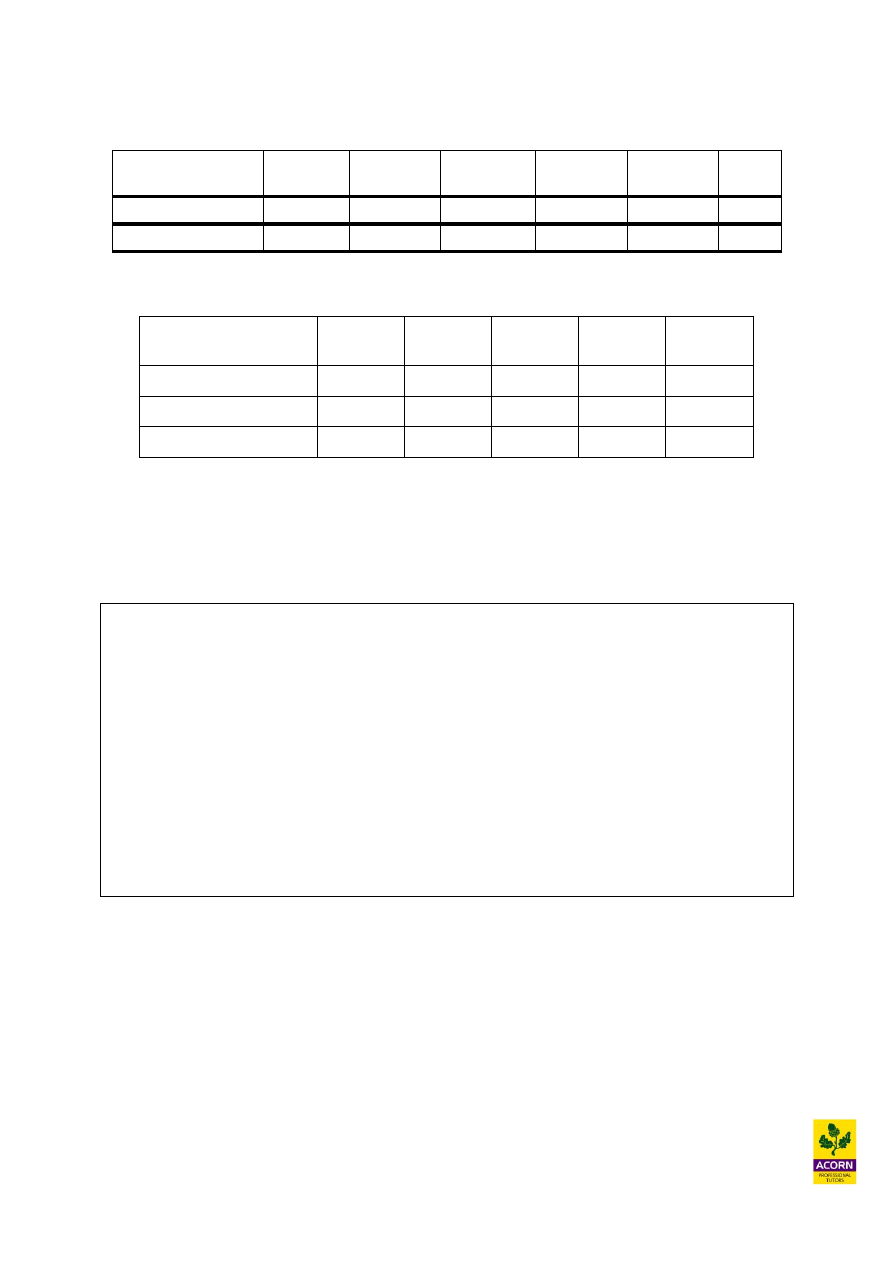
Example 4.2 – Worked example
A plc operates an absorption costing system; details about budget and actual cost and activity
levels are as follows:
Budget
Actual
Production (units)
12,000
12,300
Production overhead ($)
120,000 128,000
Calculate the under or over recovery of these costs for the above period.
OAR = 120,000/12,000 = $10 per unit
Absorbed (12,300 x $10)
123,000
Actual overhead
128,000
Under absorption
5,000
Example 4.3 – (CIMA past exam question)
A company operates a standard absorption costing system. The budgeted fixed production
overheads for the company for the latest year were £330,000 and budgeted output was
220,000 units. At the end of the company’s financial year the total of the fixed production
overheads debited to the Fixed Production Overhead Control Account was £260,000 and the
actual output achieved was 200,000 units.
Calculate the under / over absorption of overheads.
8
4.5
Marginal costing
Tip: A marginal cost (direct or variable cost) is a cost that can be avoided if a unit is not
produced or incurred if a unit was produced. Fixed cost remains constant whether a unit is or
is not produced, therefore including fixed overhead within a cost unit can distort decision
making when working out the profit affect of increasing or decreasing sales volume.
Marginal (or variable) costing assigns only variable costs to cost units while fixed costs are
written off as period costs.
(CIMA)
Marginal costing as a method makes no attempt to ‘absorb’ fixed production overheads
within a cost per unit or the income statement. Marginal costing treats fixed production
overheads as a period cost only and charges it entirely to the income statement for each
period. Marginal costing systems value inventory of finished goods at the direct
production cost only never full production cost. Absorption costing as a method does
however charge fixed or indirect production overheads to different products or services.
Absorption costing calculates a fixed overhead cost per unit for different products and will
value inventory of finished goods at full production cost e.g. the direct cost and indirect
production overhead per unit.
Absorption costing
Marginal costing
Values inventory of finished goods
at full production cost e.g. the
direct and indirect production cost
for each unit.
Absorbs
indirect
production
overheads using the actual level of
activity for a period x overhead
absorption rate (O.A.R).
The
income
statement
format
deducts first all production cost
(variable and fixed), then second all
non-production cost (variable and
fixed), in order to arrive at net profit.
Values any inventory of finished
goods
at
variable
(marginal)
production cost only for each unit.
Does
not
absorb
indirect
production overheads it charges all
fixed production overhead as a period
cost only.
The income statement format deducts
first all variable cost (production and
non-production), then second all
fixed cost (production and non-
production) in order to arrive at net
profit.

9
Valuation of finished goods inventory
Direct costs of production
Direct labour
X
Direct material
X
Direct variable production overhead
X
Total direct variable cost or total prime cost
X
Marginal costing stock valuation
Indirect production overhead absorbed
X
Full production cost
X
Absorption costing stock valuation
When standard costing, marginal costing organisations only use the fixed overhead
expenditure never the fixed overhead volume variance when reconciling actual to budgeted
results. Also marginal costing organisations use profit statements that highlight
‘contribution’ earned, therefore the sales volume variance would be different as would too the
operating statement, when compared with absorption costing organisations.

10
Marginal costing – pro forma income (profit) statement
$
$
Sales
X
Less cost of sales
Opening stock (valued at variable production cost only)
X
Total variable production cost*
X
X
Less closing stock (valued at variable production cost only) (X)
(X)
Less non-production variable cost
(X)
Contribution
X
Less fixed production cost
(X)
Less fixed non-production cost (X)
Net profit
X
*Direct labour, direct material and direct (or variable) production overhead
Terminology: Contribution equals Sales less ALL marginal (or variable) cost
Absorption costing – pro forma income (profit) statement
$
$
Sales
X
Less cost of sales
Opening stock (valued at full production cost)
X
Total variable production cost*
X
Fixed production overhead absorbed
X
X
Less closing stock (valued at full production cost)
(X)
X
(Over)/under absorption of fixed production overhead
(X)/X
(X)
Gross profit
X
Less non-production fixed and variable cost (X)
Net profit
X
*Direct labour, direct material and direct (or variable) production overhead

11
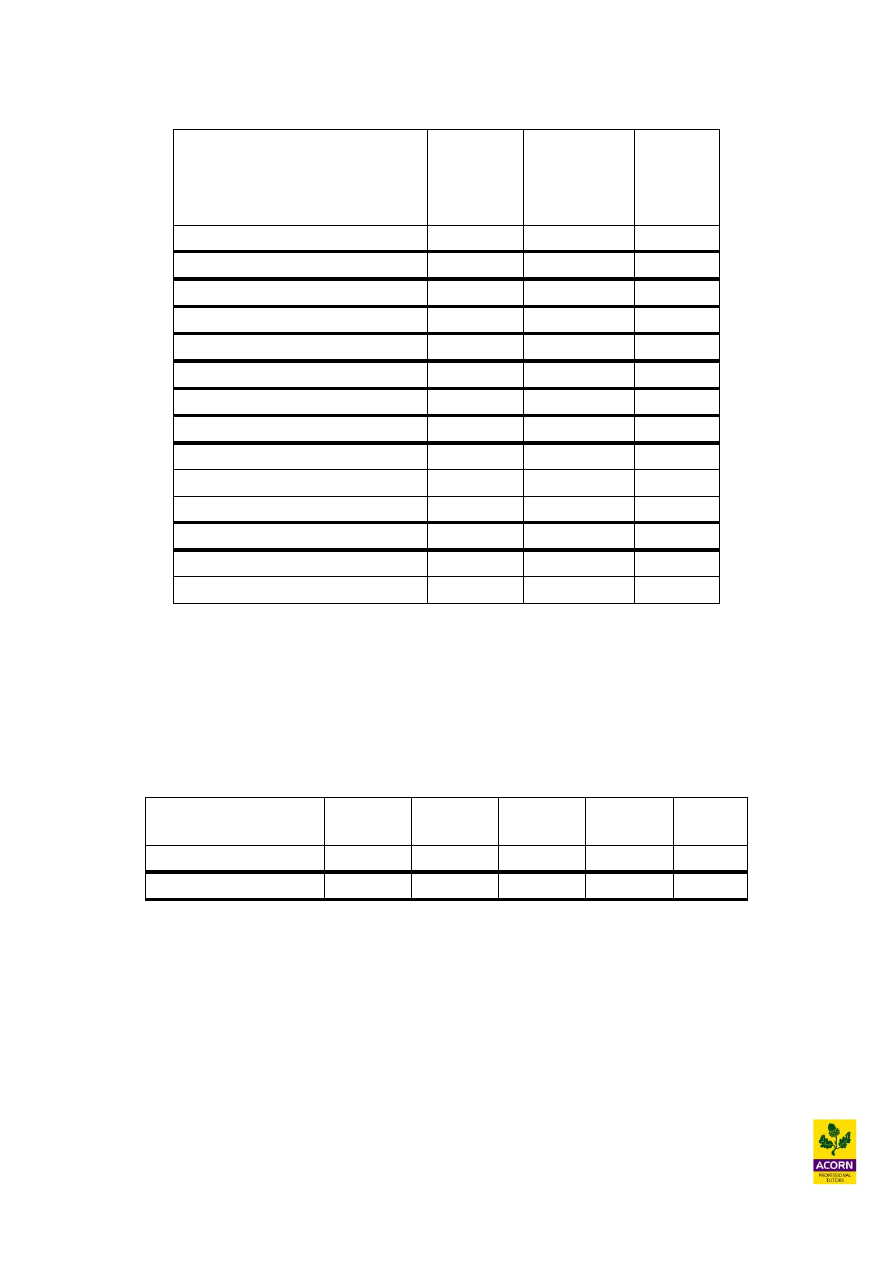
Example 4.4
Selling price £30.
Cost card per unit:
£
Direct material
8.00
Direct labour
5.00
Variable production overhead
4.00
17.00
Year 1
Year 2
Units
Units
Budgeted production
10,000
10,000
Actual production
11,000
9,000
Actual sales
10,000
10,000
The budgeted production overhead for both periods was £20,000 in both periods the actual
production overhead was £21,000. There is no opening stock
Produce a profit statement under both methods of absorption and marginal costing for the
above two periods?
12
4.6
Contrasting absorption with marginal costing profit
Tip: The only reason why profits will differ under both methods of costing is due to the way
that each method values finished goods inventory. The marginal costing method values
inventory at variable production cost only never full production cost. The absorption costing
method values inventory at full production cost.
When production volume > sales volume during a period
Inventory levels rise (closing inventory > opening inventory) therefore a greater amount of
fixed overhead under absorption costing is being carried forward to the following period
within the valuation of the closing inventory, therefore creating a higher profit than
marginal costing.
When production volume < sales volume during a period
Inventory levels fall (closing inventory < opening inventory) therefore a smaller amount of
fixed overhead under absorption costing is being carried forward to the following period
within the valuation of the closing inventory, therefore creating lower profit than marginal
costing.
When production volume = sales volume during a period
Inventory levels remain unchanged (closing inventory = opening inventory) therefore both
methods would give exactly the same profit.
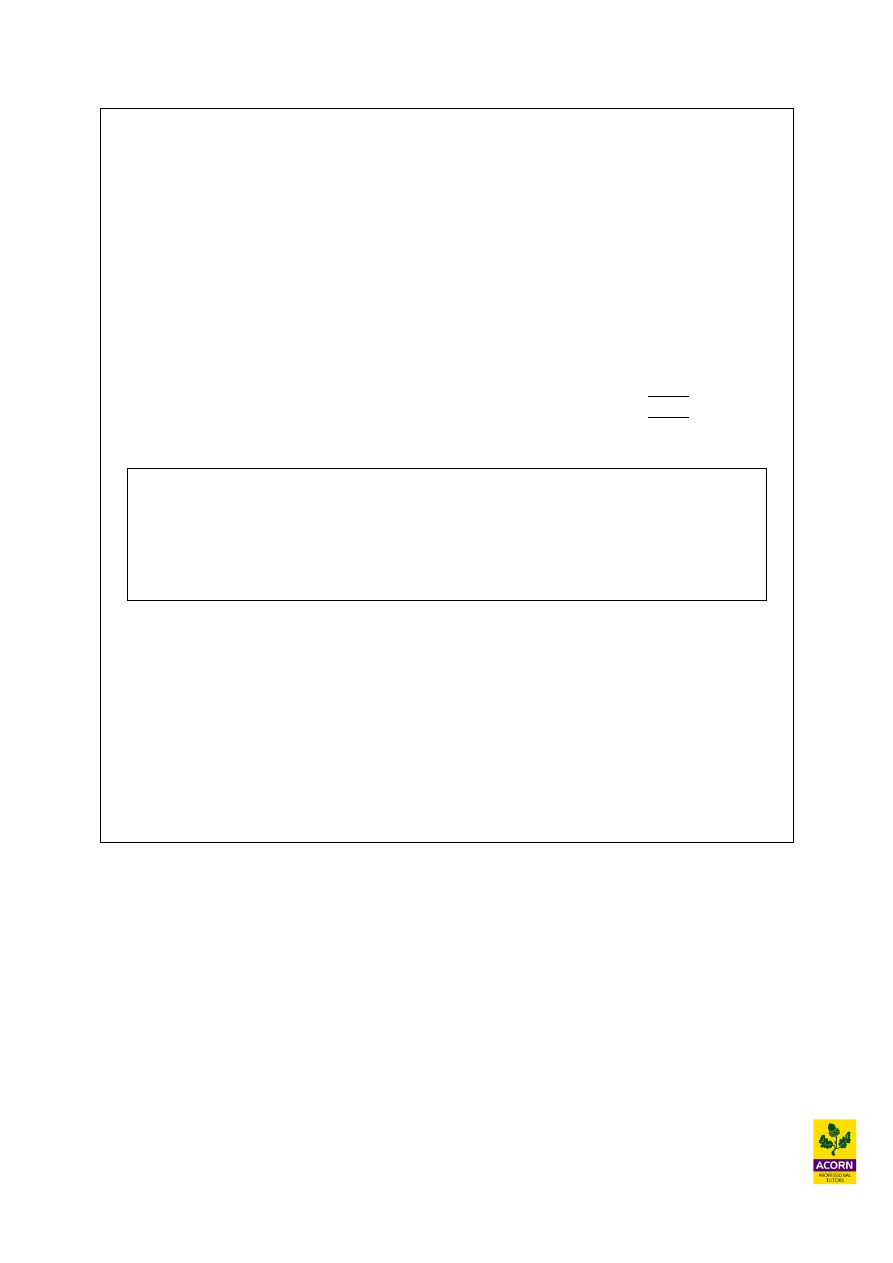
Reconciliation of absorption to marginal costing profit
AC profit
X
Less: fixed overhead included within Closing inventory (X)
Add: fixed overhead included within Opening inventory X
MC profit
X
Closing Less
Opening Add
or ‘CLOA’

13
Example 4.5 – Worked example
Using the information from example 3.4 profits under absorption costing are reconciled to
marginal costing profit below for year 1.
AC profit (year 1)
111,000
Less: fixed overhead included within Closing inventory (1,000 x £2) (2,000)
Add: fixed overhead included within Opening inventory nil
MC profit (year 1)
109,000
Note: You can reconcile MC to AC profit by reversing the addition and subtraction of fixed
production overhead included within the finished goods inventory above.
4.7
Advantages and limitations of absorption costing
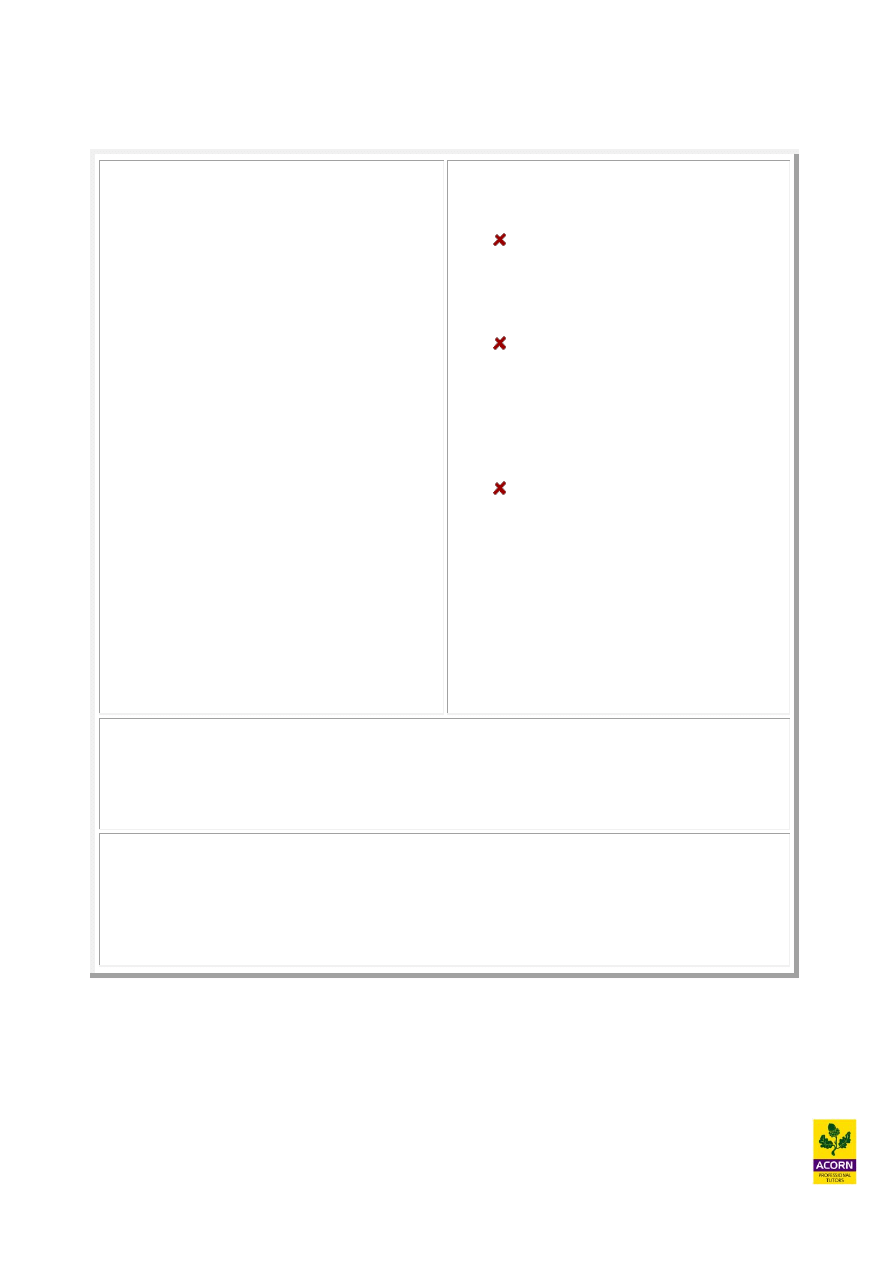
Advantages
Valuation of finished goods
inventory complies with IAS
2.
Better understanding of the
profitability of products due
to the allocation of fixed
overhead to find a full
production cost per unit.
Better
understanding
for
pricing products due to the
allocation of fixed overhead
to find a full production cost
per unit e.g. pricing will
ensure
production
fixed
overhead is covered in the
long-run.
Limitations
A products unit cost will include fixed
production overhead. Fixed costs are not
relevant for decision making e.g. the
nature of cost behaviour is distorted as
fixed overhead does not rise or fall when a
different number of units are produced.
The method of absorbing fixed production
overhead to a product cost is subjective
e.g. this subjectivity could distort pricing
and profitability analysis for different
products.
Profit can be manipulated by a manager
e.g. a higher profit can be achieved by
deliberately setting a higher production
volume than sales volume for a period.
IAS 2 “Inventories” is the international accounting governing the valuation of inventory. The
accounting standards state that the cost of finished goods should include some apportioned
share of any indirect or fixed production overhead for a financial period. No detailed
knowledge of accounting policies is required for this subject.
14
4.8
Advantages and limitations of marginal costing
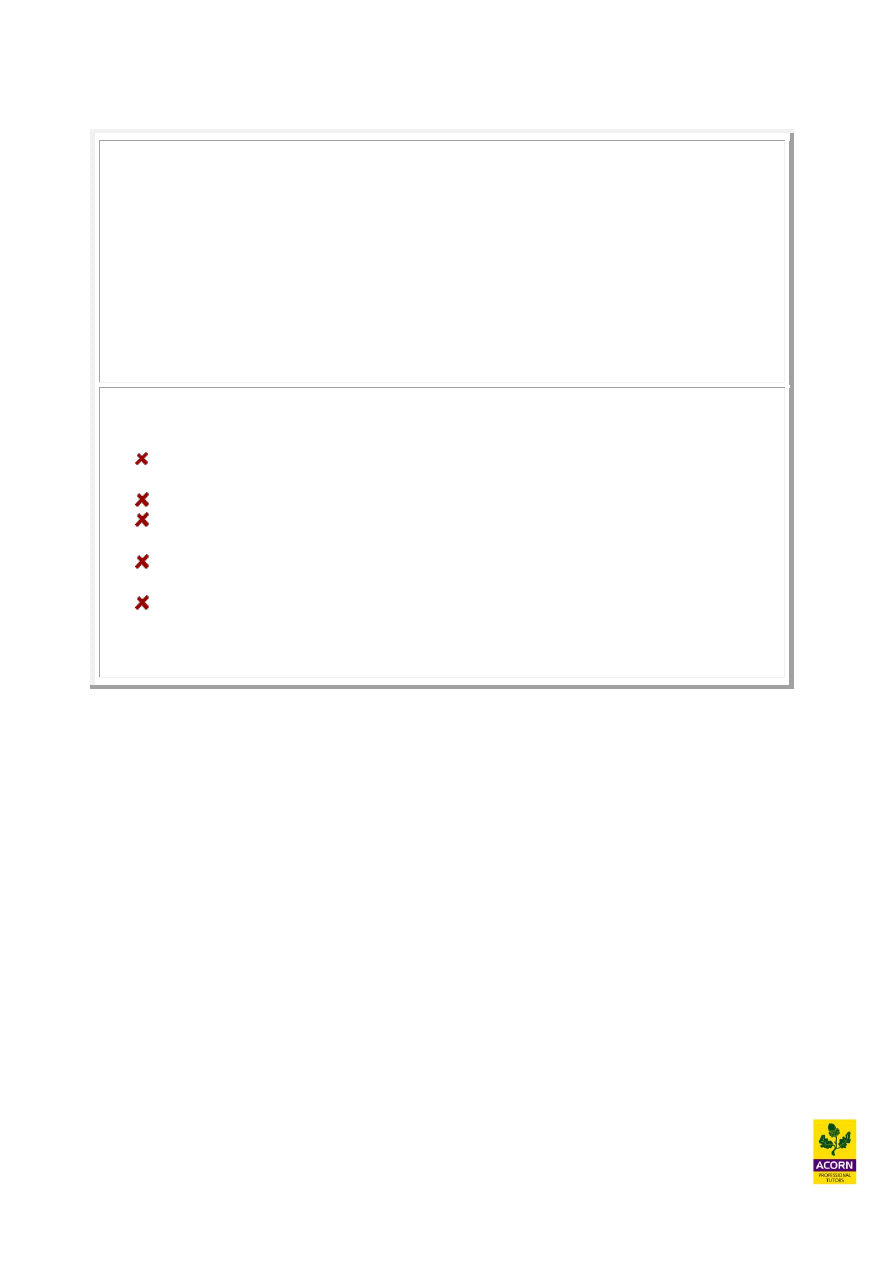
Advantages
A better method for decision
making in the short-term e.g. the
nature of cost behaviour is not
distorted
by
excluding
fixed
production
overhead
from
a
product unit cost. The effect on
contribution and therefore profit
can be more accurately measured
when sales volume changes.
Fixed costs are treated in
accordance with there nature e.g. it
could be argued that fixed cost is a
period not product cost.
Profit cannot be manipulated by a
manager e.g. a higher profit cannot
be achieved by deliberately setting
a higher production volume than
sales volume for a period. This is
because no fixed overhead will be
carried forward within the value of
finished goods inventory.
A simpler costing system to
understand and maintain.
Limitations
The valuation of finished goods
inventory does not comply with IAS
2. No indirect or fixed production
overhead is included within the unit
cost of making a product.
Less understanding about the cost of
making a product e.g. only the direct
or variable production cost is
considered.
This
may
distort
information used when pricing or
undertaking a profitability analysis
for different products.
All production and non-production
cost would need to be analysed into
the fixed and variable component, in
order
to
produce
an
income
statement.
This
can
be
time
consuming
especially
if
the
organisation has a high proportion of
semi-variable (or mixed) cost.
Marginal costing is more appropriate for decision making e.g. the nature of cost behaviour is
not distorted by including fixed overhead within a cost unit. Therefore in a situation where a
manager wants to view the true profit effect of increasing or decreasing sales volume,
marginal costing as a method would be more appropriate than absorption costing.
With marginal costing a manager cannot manipulate profit from one period to another by
deliberately setting the volume of production higher than the volume of sales for a period
e.g. stock piling. Using marginal costing would therefore allow a better performance
evaluation of a manager and ensure they concentrate on the maximisation of contribution
rather than profit, leading to greater cash-flow for the organisation.

15
Example 4.6 – (CIMA past exam question)
A manufacturing company uses a standard costing system. Extracts from the budget for April
are shown below:
Sales 1,400 units
Production 2,000 units
Direct costs $15 per unit
Variable overhead $4 per unit
The budgeted fixed production overhead costs for April were $12,800.
The budgeted profit using marginal costing for April was $5,700.
(i) Calculate the budgeted profit for April using absorption costing.
(ii) Briefly explain two situations where marginal costing is more useful to management
than absorption costing.

16
4.9
Activity based costing (ABC)
Activity based costing (ABC) looks in more detail about what causes fixed overhead to be
incurred and works out many ‘cost drivers’ (activities). It is used in order to obtain a more
accurate way of looking at how fixed overhead is driven and should give a more accurate
picture when measuring the cost of supporting different products, markets or customers. It
can also be used to budget more effectively e.g. set prices. The associated revenues and cost
can be ascertained to different product lines or customer groups which can help an
organisation to understand products and customers as a source of earnings. ABC methods
allow an organisation to understand these earnings by linking fixed overhead to the support
activities these customers or products consume.
Characteristics of modern manufacturing
Wide and diverse product ranges e.g. multi-products all consuming different amounts
of manufacturing and support resources e.g. departments, machines and staff.
Fixed overhead a large percentage of total cost therefore ‘material’ in terms of how
fixed overhead should be shared between different products.
Complexity and diversity of production driving fixed overhead.
Steps in ABC
1. Group types of fixed overhead together e.g. overheads which are driven by the
same type of activity or ‘cost driver’
2. Calculate from fixed overhead cost pools a fixed overhead ‘cost per driver’ e.g.
cost per mile, cost per delivery, cost per sales visit, cost per order processed, cost per
call etc.
3. Absorb fixed overhead using ‘multiple cost drivers’ e.g. use ‘cost per driver’ to
identify costs to products, product stages, distribution channels, customer or customer
segments etc.
A cost driver is any factor that causes a change in the cost activity, so it is important to
identify a causal relationship between the cost driver and the cost. This can be done by the
logic of the situation or because some form of physical relationship does exist. Quality
control costs as an example are caused by the carrying out of inspections to ensure quality
standards are being achieved, so this seems to be a good relationship for planning and
controlling the resources that cause this cost.
Factors to consider when selecting cost drivers
1. Is there a cause and effect relationship
2. Does a suitable measure exist

17
Classification of activities
Unit-level activities
Performed each time a unit of the product or service is produced.
Resources are consumed in proportion to the number of units produced or sold.
Examples include direct materials and labour, energy costs and expenses consumed in
proportion to machine processing time.
Batch-related activities
Performed each time a batch of goods is produced.
Costs vary with the number of batches made.
Examples include set-ups, purchase ordering and first item inspection activities.
Product/service sustaining activities
Performed to enable the production of individual products or services.
Examples include activities related to maintaining an accurate bill of materials, preparing
engineering change notices.
Facility-sustaining (or business-sustaining) activities
Performed to support the organisation as a whole.
Examples include plant management, property costs and salaries of general administrative
staff. These are common to all products and services. A ‘pure’ ABC system would treat
facility-level costs as period costs and would not assign them to products. In practice,
facility-level costs might be allocated to individual products using unit-level, batch-level, or
product-level cost drivers.
18
Advantages of ABC
More efficient management of resources by understanding what drives fixed
overhead incurred e.g. elimination, reduction or improvement in the efficiency of
how resources are used can improve profitability.
Better costing information for planning and control e.g. how different products,
customers or distribution channels consume different resources.
More realistic and competitive pricing to cover overhead.
Better profitability analysis because there is more accuracy over costs. It is used in
the retail sector to understand the profitability of different products and services.
Disadvantages of ABC
Time consuming and expensive system to run and maintain e.g. ‘bespoke’
management information systems.
Limited analysis if only a small range of products or a single product is produced.
Danger of going into too much detail. For example the need to strike a balance
between benefit and cost of information.
Assumes fixed overhead is driven ‘directly’ by volume however in reality it tends to
behave in a ‘stepped cost’ way.
It maybe seen as a 100% accurate which is not true as it is only improves our
understanding of overhead cost consumption but it will not tell us how the overheads
were precisely consumed.
19
4.10
Examples of cost drivers
Activity
Cost driver
Material procurement
Material handling
Quality control
Maintenance
Production Scheduling
Set-ups
Finishing
Packaging & Shipping
No. of purchase orders
No. of movements or number of parts
No. of inspections
No. of break-downs
No. of production ‘orders’
No. of production line set-ups
Direct labour hours
Number of orders shipped
Cost drivers can also be identified in the service sector e.g., in a Hospital Cardiology Unit:
Activity
Cost driver
Booking appointments
Treating Patients
Providing hygienic care
X-ray: Equipment preparation
Patient preparation
Film processing
Responding to patient requests
Monitoring patients
Patient aftercare
No. of patients
No. of treatments
Time taken
Time taken
Time taken
No. of images
No. of requests
Monitoring hours
Time taken
Illustration of applying ABC within a service sector organisation
The Services Agency, a Not For Profit (NFP) organisation, has two divisions operating
within the same building which occupies 30,000 square metres that deliver the following
range of services to a range of customers:
Description
Service 1 Industry Advisory Services
Service 2 Community Education
Service 3 Private Practitioner Accreditation
Service 4 Policy Advice & Coordination
Employee Related Costs is the major category of cost incurred by each division. The
divisional management considers that it is cost beneficial to trace these costs directly to
individual services. All Employee Related Costs have been assumed to behave in the same
way and traced to services on the same basis. (A direct cost is a cost that can be directly
traced to a cost object in an economically feasible manner).
20
The divisional directors provided the following analysis of time spent on each service:
Service
Delivery
Division
Regulation
and Policy
Division
Service 1 : Industry Advisory Services
90%
10%
Service 2 : Community Education
10%
30%
Service 3 : Private Practitioner Accreditation
-
50%
Service 4 : Policy Advice & Coordination
-
10%
Based on this analysis, Employee Related (direct) Costs are traced to services as
follows:
Costs
Service
1
Service
2
Service
3
Service
4
Total
$’000
$’000
$’000
$’000
$’000
Employee Related Expenses:
Service Division
94,500 10,500
-
-
105,000
Regulation and Policy Division
3,200
9,600 16,000
3,200
32,000
Total Direct Costs
97,700 20,100 16,000
3,200 137,000
Other indirect costs (operating expenses) are aggregated in two cost pools:
Administration cost pool
Occupancy cost pool
It was decided that administration costs were driven by the number of employee full-time
equivalents (FTE’s) and occupancy costs were driven by space occupied by each division.
21
Service
Regulation
Delivery and Policy
Division
Division
Total
$’000
$’000
$’000
Administration cost pool
Advertising and promotion
750
250
1,000
Auditor’s remuneration
250
250
500
Consultancies
1500
500
2,000
Courier and freight
300
100
400
Operating lease
2,000
500
2,500
Telephone
2,000
1,000
3,000
Travel and accommodation
3,000
600
3,600
Other operating expenses
1,500
700
2,200
11,300
3,900
15,200
Service Sustaining cost pool
Technology
1,400
400
900
Consultancy Rooms
18,000
5,000
23,000
Total
19,400
5,400
24,800
Managers of the two divisions were asked to quantify the cost drivers. The managers
estimated the proportion of the 30,000 square metres of floor space occupied by the two
divisions to be the appropriate driver for Service Sustaining costs and the proportion of FTE’s
involved in delivering each service as the appropriate driver for administration costs.
The following budgeted driver volumes were established:
Cost Driver
Service 1 Service 2 Service 3 Service 4
Total
Employees (FTE)
1,898
390
310
62
2,660
Floor area (sq. metres) 19,000
5,000
5,000
1,000
30,000
The cost drivers established were:
Administration = $15,200 / 2,660 = $5.714 per FTE
Occupancy = $24,800 / 30,000 = 0.827 per sq. metre
22
Applying these costs drivers to each service resulted in the following activity based costs:
Costs Pool
Cost
Driver
Service 1
$’000
Service 2
$’000
Service 3
$’000
Service 4
$’000
Total
$’000
Administration
No. FTE
10,846
2,229
1,771
354 15,200
Occupancy
Floor area
15,713
4,135
4,135
827 24,800
Total Service Cost = Direct Costs + Indirect (Activity Based) Costs
Service Costs
Service 1
$’000
Service 2
$’000
Service 3
$’000
Service 4
$’000
Total
$’000
Direct Costs
97,700
20,100
16,000
3,200
137,000
Activity Based Costs
26,559
6,364
5,906
1,181
40,010
Total Service Costs
124,259
26,464
21,906
4,381
177,010
If it is not possible to find a sensible cost driver for an activity then you should leave the
activity out of your calculations as including it will make the information meaningless
because the activity will be distributed in an arbitrary basis between products. Instead we
should not include it in our calculations and seek more information about a sensible cost
driver for the activity. This should be stated quite clearly in your answer if appropriate.
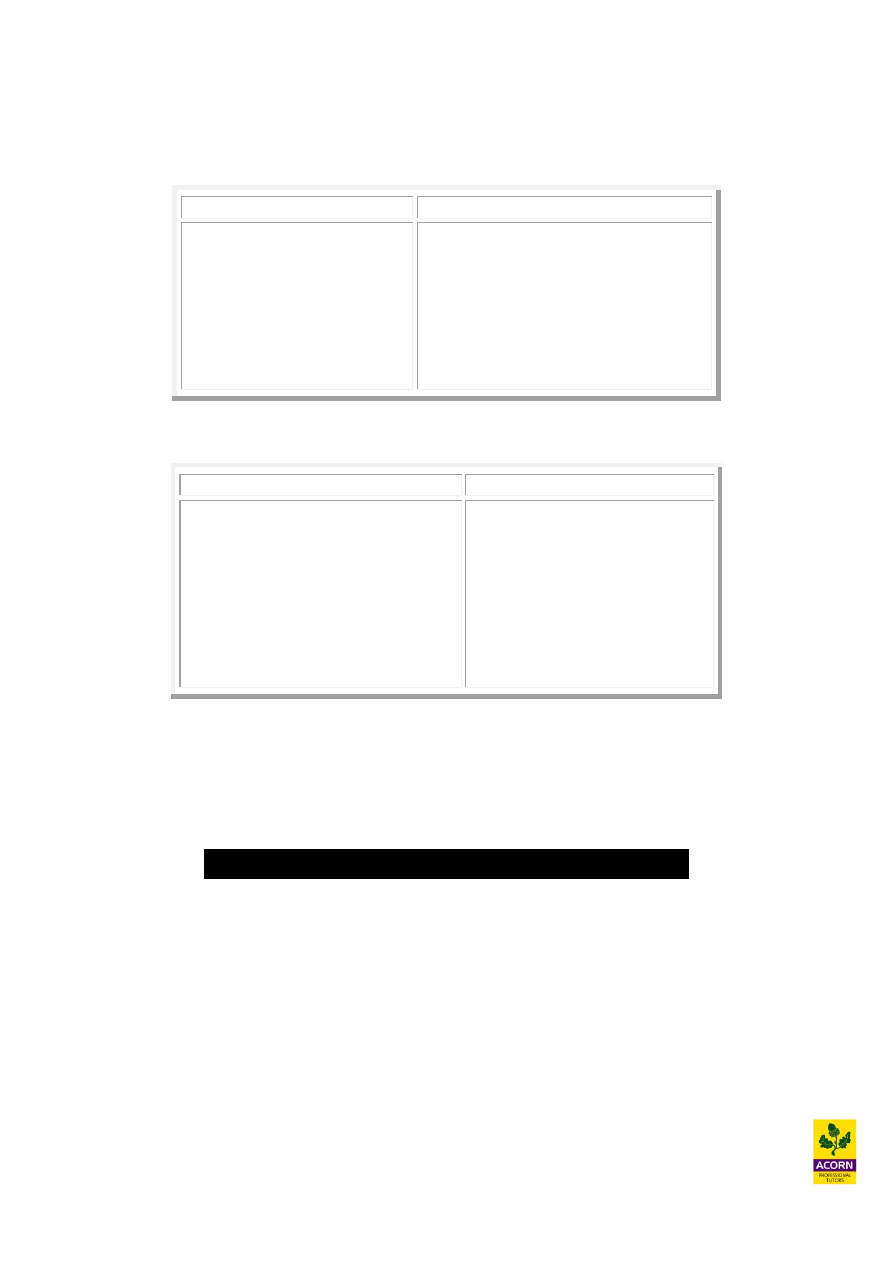
Example 4.7
For a hospital which of these does not seem like a sensible activity and cost driver?
Activity
Cost driver
a) Insurance for building
Maintenance costs
b) Phone appointments
No. of patients
c) Patient main reception
No. of patients
d)
Length of patient stay
No. of patients

23
Example 4.8 – Worked example
A Ltd has recently introduced an activity based costing system. It manufactures two products
details were as follows:
Product A
Product B
Budgeted annual production (units) 50,000
30,000
Batch size (units)
1,000
300
Machine set ups per batch
7
5
Budgeted costs for the machine set up for the above period was £55,250.
Calculate the budgeted machine set up cost for the above period.
Number of batches (50,000/1,000 = 50) + (30,000/300 = 100) = 150 batches
Number of set ups (50 x 7) + (100 x 5) = 850
Therefore £55,250/850 = £65 a set up

24
Example 4.9
Pre-packed Plc makes a range of microwaveable dishes, which sell in well-known
supermarkets across the U.K. Details about 3 products it sells are as follows.
Chicken Sweet and
Lamb
Curry
Sour Vegetables Vindaloo
Monthly sales
40,000
25,000
30,000
£ £ £
Selling price
2.99
3.50
3.99
Ingredients
(0.99)
(0.50)
(1.49)
Labour
(0.50)
(0.75)
(0.50)
Contribution
1.50
2.25
2.00
Budgeted fixed overhead for one month in the factory is £100,000 and staff are paid £4 an
hour.
Pre-packed Plc also has the following information available:
Chicken
Sweet and
Lamb
Curry
Sour Vegetables Vindaloo
Cooking time per batch
In Kilojoules
6,000
4,000
10,000
Batches (number of
Set ups per month)
4
5
10
Shredding, mixing and
Packaging per batch
(Machine hours)
100
25
125
The monthly overhead after being analysed is as follows:
£
Set up costs
50,000
Cooking
30,000
Shredding, mixing
and packaging
20,000
100,000
Analyse the profitability of the 3 products using both AC and ABC costing?

25
Longer term decisions and ABC
ABC has many uses and there are very good benefits to an organisation when formulating
their long term strategic decisions, such as product pricing, mix of products, discontinuance,
launch or promotion of existing products and the launch of new products.
ABC’s strength lies in the fact it allows accuracy over costs and drivers for products and as a
result a sensible pricing strategy is achieved. It more specifically gives a good long term
understanding of the variable costs being very relevant for decision making.
However ABC information must be put into perspective as these are historic costs and cannot
be used alone to predict future costs. They should be used as a starting point and other
internal and external information should be used to determine future costs. All costs are
variable in the long term and subject to change.
4.11
Customer profitability analysis (CPA)
Relating specific costs to serving customers or groups of customers, so that their relative
profitability can be assessed. CPA uses ABC techniques in order to allocate cost.
Customer profitability analysis (CPA) focuses on cost reduction by understanding how
customers consume different support resources e.g. processing, delivery, sales visits,
telephone support, internet support etc. It allows an organisation to concentrate on the most
profitable of its customers.
CPA
Revenue
X
Less discounts (X)
Net revenue
X
Less cost of goods sold (X)
Gross margin
X
Customer specific costs
Financing
(X)
Purchasing costs
(X)
Invoicing
(X)
Deliveries made
(X)
Sales visits
(X)
After sales support
(X)
Inventory cost
(X)
Net margin
X
Gross margin/contribution is what the
organisation traditionally relied upon
Better profitability analysis using ABC
techniques

26
Other types of customer driven costs include
1. Location
2. Delivery frequency
3. Quality provided
4. After sales service activities
5. Sales and promotion effort
6. Administration
Benefits of CPA
Customer group (segment) profitability can be better understood e.g. marketing focus
on the most profitable customers.
Unprofitable customers groups can be rationalised or strategies implemented to
reduce their consumption of resources.
More effective pricing policies e.g. financial effect of customer proposals can be
better analysed when negotiating with customers.
Limitations of CPA
Limited analysis if only a small range of customer groups.
Time consuming and expensive system to run and maintain e.g. ‘bespoke’
management information systems.
Assumes fixed overhead is driven ‘directly’ by volume however in reality it tends to
behave in a ‘stepped cost’ way.

27
Example 4.10
Industrial floorings Ltd, specialises in a range of flooring for all industrial purposes. The MD
wishes to analyse two customers Robertson Interiors and BJ Flooring in order to assess their
relative profitability.
Robertson Interiors give 10 batches of orders a year (averaging 1,000 tiles in one order) and
because of this size receive a 15% discount. They are also a popular customer and therefore
are visited once a month, with sales reps driving a total of 4,500 miles a year to see this
client.
BJ Flooring gets no discount, orders 4 batches a year (averaging 500 tiles in an order), and is
normally visited twice a year. They are based in Europe and therefore sales mileage per year
for this client is 10,000 miles.
You are also provided with the following information
Total transport cost £200,000 (sales fleets normally travel about 200,000 miles a year)
Purchase order-processing cost in total £500,000 (receiving 500 very complex orders a year)
Salesman salaries £500,000 a year (the team doing around 25,000 visits a year between them)
The average price of a single floor tile is around £50 and the normal variable cost of
manufacture is £30 a tile.
Conduct a CPA on the two clients?
4.12
Direct product profitability (DPP)
By the use of “shopping basket analysis” a retailer can understand consumer behaviour
through the products that they purchase. Through database warehousing and mining of
customer purchases e.g. through EPOS systems and loyalty card schemes, a retailer can try to
infer interest, values and choice criteria and predict purchase probabilities for other products
customers may buy. ABC techniques can also be applied within the retail sector.
Traditionally the retail industry relied upon gross margins (the ratio of gross profit to sales,
also referred to as contribution to sales ratio) as a focus point for determining product
profitability. However this analysis ignores the direct store support activities, such as shelf
filling, warehousing and transportation for each product.
DPP is a decision making tool that helps a food merchandiser by providing a better indication
of the profitability of products on the supermarket shelves. DPP allocates direct product
costs to individual products. These costs are subtracted from gross profit to derive at DPP for
each product. The normal indirect costs attributed to products would be distribution,
warehousing and retailing. DPP would ignore indirect costs such as head office overhead,
only product specific fixed (indirect) cost would be analysed. e.g. shelf filling, warehousing
and transportation.

28
Why the allocation of direct support overhead to products?
Warehousing cost involves refrigeration and storage overhead, the more bulky a product is,
the more floor area it consumes, a limiting factor for most retail organisations e.g. dairy or
frozen produce will cost more to store within refrigerated units. Transport with dedicated
refrigeration will consume more overhead in delivery cost; more bulkiness means a lower
number of units being transported each time, giving a higher unit cost per delivery. The
higher the cubic capacity of a product the more shelf space it uses, the bigger the weight and
cubic capacity the greater the handling costs for staff once a product arrives in store. By
understanding what drives cost when resources are consumed to support products, this will
enable a retailer to maximise throughput of the most profitable products, as well as giving
more effective information to control cost and manage store resources e.g. making sure
vehicles carry full loads to reduce the number of journeys.
Strategies to improve customer or product profitability
1. Increase price
2. Increase volume sold
3. Reduce support activities that incur specific customer or product cost
4. Withdrawal e.g. discontinue selling
Viewing either products or customers as a source of earnings
Profitability analysis often ignores the ‘life cycle of earnings’ from customers or
products e.g. students at university may have low earning potential before graduating,
however could be a bigger source of earnings when they graduate and become more
affluent.
Basis of calculating earnings can be subjective e.g. what costs do we include and how
do we attach them?
Decisions about earnings often ignore interdependence e.g. unprofitable products may
attract more customers into a store to buy other items.
Product or customer views of earnings can conflict e.g. low profit on product A but
customer B buys other products as well therefore a source of high earnings. So do
discontinue A? DPP would suggest so however CPA may not.
29
Example 4.11 - homework
Cheap and cheerful supermarkets operate 5 supermarkets across the UK and details about
current overhead of support activities to the stores are given.
Warehousing cost per week
£000s
Staff overhead
350
Refrigeration
50
Building overhead
250
650
Cost of one supermarket per week
£000s
Staff overhead
50
Refrigeration
50
Building overhead
50
150
Transport cost
Refrigerated lorries £3,000 a delivery (carrying up to 120 cubic metres)
Standard lorries £2,000 a delivery (carrying up to 120 cubic metres)
The total volume of all goods sold for all 5 supermarkets is 100,000 cubic metres a week of
which 20% of this amount is refrigerated produce.
The manager of a supermarket is unsure about 2 products, the 4-pint of organic skimmed
milk and the own brand pack of 50 disposable nappies, details of which are as follows;
Milk
Nappies
Price
£1.09
£11.95
Cost of good
£0.24
£7.95
Number of items per metre cube
100
20
Time in warehouse (weeks)
0.5
4
Time on shelf (weeks)
0.2
1
Sales per week
10,000
500
Conduct a DPP analysis on the 2 products concerned and recommend ways in which Cheap
and cheerful can reduce overhead or increase the efficiency of their operations?

30
4.13
Distribution channel profitability (DCP)
DCP another ABC concept, is about relating specific distribution costs to serving customers
or groups of customers, so that their relative profitability can be assessed. Typical supply
chain channels today include the internet, e-mail, shops/branches, post, telephone, catalogues,
other distributors etc. Supply chain management has become a large part of costs today due
to the huge amount of different sales mediums that organisations now have to offer
customers.
4.14
Activity based budgeting (ABB)
Activity based budgeting (ABB) uses cost driver data in the budgetary planning and control
stage, in other words cost levels are forecast and determined by using ABC techniques.
Therefore ABB is a form of budget preparation that focuses on the activities of an
organisation. All costs are related to those activities and can be split into primary activities
(value added activities) and secondary activities (non-value added activities). Non-value
added activities if not supporting the value added activities effectively, should be questioned
as to whether it should exist at all.
ABB recognises that different costs have different causes, rather than assuming that all costs
can be absorbed on the basis of labour hours (the more traditional approach). ABB therefore
should produce more accurate budgeted figures against which actual costs can be compared
to yield more meaningful variances.

31
Example 4.12
Pre-packed Plc within example 4.9, which makes a range of microwaveable dishes, which
sell in well-known supermarkets across the U.K, is thinking of producing a ‘Mex Tex’ Chilli
version for there existing product range. The new recipe has been given the following details
by the head chef.
Direct cost of manufacture per unit
£
Ingredients
0.89
Labour
0.50
Total direct cost
1.39
‘Mex Tex’ Chilli (2,000 in a batch) new recipe
Cooking time per batch
In Kilojoules
5,000
Shredding, mixing and
Packaging per batch
(Machine hours)
30
Due to uncertainty of forecasting demand, Pre-packed Plc has decided to cook the new dish,
in batches of 2,000 only, selling them at a retail price of £3.99, using the cost drivers
calculated within example 3.9; produce a budget based on 1 batch of ‘Mex Tex’ Chilli, and
comment on your results?
32
Example 4.13 – (CIMA past exam question)
RJ produces and sells two high performance motor cars: Car X and Car Y. The company
operates a standard absorption costing system. The company’s budgeted operating statement
for the year ending 30 June 2008 and supporting information is given below:
Operating statement year ending 30 June 2008
Car X
Car Y
Total
$000
$000
$000
Sales
52,500
105,000
157,500
Production cost of sales
40,000
82,250
122,250
Gross profit
12,500
22,750
35,250
Administration costs
Variable
6,300
12,600
18,900
Fixed
7,000
9,000
16,000
Profit/(loss)
(800)
1,150
350
The production cost of sales for each car was calculated using the following values:
Car X
Car Y
Units
$000
Units
$000
Opening inventory
200
8,000
250
11,750
Production
1,100
44,000
1,600
75,200
Closing inventory
(300) (12,000)
(100)
(4,700)
Cost of sales
1,000
40,000
1,750
82,250
Production costs
The production costs are made up of direct materials, direct labour, and fixed production
overhead. The fixed production overhead is general production overhead (it is not product
specific). The total budgeted fixed production overhead is $35,000,000 and is absorbed using
a machine hour rate. It takes 200 machine hours to produce one Car X and 300 machine hours
to produce one Car Y.
Administration costs
The fixed administration costs include the costs of specific marketing campaigns: $2,000,000
for Car X and $4,000,000 for Car Y.
(a) Produce the budgeted operating statement in a marginal costing format. (7 marks)
(b) Reconcile the total budgeted absorption costing profit with the total budgeted
marginal costing profit as shown in the statement you produced in part (a). (3 marks)

33
The company is considering changing to an activity based costing system. The company has
analysed the budgeted fixed production overheads and found that the costs for various
activities are as follows:
$000
Machining costs
7,000
Set up costs
12,000
Quality inspections
7,020
Stores receiving
3,480
Stores issues
5,500
35,000
The analysis also revealed the following information:
Car X Car Y
Budgeted production (number of cars)
1,100
1,600
Cars per production run
10
40
Inspections per production run
20
80
Number of component deliveries during the year
492
900
Number of issues from stores
4,000
7,000
(c) Calculate the budgeted production cost of one Car X and one Car Y using the
activity based costing information provided above. (10 marks)
(d) Prepare a report to the Production Director of RJ which explains the potential
benefits of using activity based budgeting for performance evaluation. (5 marks)
4.15
Job and batch costing
Job costing is a form of specific order costing where costs are charged to individual orders or
jobs for customers e.g. printers or a special purpose machine, tailor made to order. Job sheets
or cost records are normally assigned to a job code, keeping record of labour, material or
overhead to be charged or allocated to it. This ensures costs are kept under control, but also
cost estimates can be used in order to charge a price, which is more likely to earn profit. Job
cards would include customer details, a job number, as well as columns for calculation of
material, labour and overhead estimates.
Batch costing is a form of specific order costing; similar in most ways to job costing e.g. the
job would be to manufacture a large number of identical items (or a batch), such as 1000
identical commemorative mugs.

34
Example 4.14
Estimate details regarding Job 1056 to make and assemble specialist engineering equipment
for an extraction machine:
Direct labour hours worked on job 1056
37 hours (grade A staff)
50 hours (grade B staff)
Components and parts issued to job 1056
£8,560 (£3,000 returned)
Grade A staff are paid £8.60 an hour
Grade B staff are paid £6.50 an hour
The company operates an absorption costing system charging the following rates for
production overhead
Grade A £5.00 an hour overhead absorption rate
Grade B £3.00 an hour overhead absorption rate
Given the company adds a mark-up of 100% to the total cost of a job in order to charge
the customer, what would be the price of job 1056?
4.16
Service costing
Characteristics of service organisations
Intangible e.g. cannot touch or feel what is offered
Simultaneous e.g. cannot be returned if faulty
Perishable e.g. cannot be stored
Heterogeneous e.g. differences in the exact service supplied each time not perfectly
identical (homogenous)
Why use service costing
To help control the departments costs e.g. budgetary control
To help improve the efficiency of how the service is used by other departments when
internal or external charging takes place

35
Examples of cost units for service organisations
Cost per hour
Cost per tonne
Cost per kilogram
Cost per mile
Cost per service unit produced e.g. any operation performed
Sometimes it is difficult to use a standard single measure, generally defined as cost divided
by a unit of time, weight, distance or unit of measure of some other kind. Service
organisations may make use of composite cost units; whereby the cost is expressed using
two combined measures. Composite cost units are when an organisation uses some kind of
cost per unit made up of two parts, a system used more often for service organisations than a
manufacturer.
Composite cost units are sometimes more useful for control purposes e.g. it may not be just
the weight being carried for a transportation organisation that is important, but also how far it
is transported as well that drives costs to be incurred.
Examples of composite cost units
Cost per tonne per mile
Cost per passenger per mile
Cost per employee per hour
Cost per patient per day

36
Key summary of chapter
Absorption costing
Traditional absorption costing takes the total budgeted fixed overhead for a period and
divides by a budgeted (or normal) activity level in order to find the overhead absorption
rate. This is a simple fixed overhead costing method, allowing fixed overhead to be
allocated to products, jobs, and stock or work-in-progress.
Overhead absorption rate (OAR) =
Budgeted production overhead
Normal level of activity
Any under charge to the profit and loss account would be an ‘under absorption’
of production overhead e.g. DR profit and loss account CR Production overhead
control account.
Any over charge to the profit and loss account would be an ‘over absorption’ of
production overhead e.g. CR profit and loss account DR Production overhead control
account.
Marginal costing
A marginal cost (direct or variable cost) is a cost that can be avoided if a unit is not produced
or incurred if a unit was produced. Fixed cost remains constant whether a unit is or is not
produced. Marginal (or variable) costing assigns only variable costs to cost units while fixed
costs are written off as period costs.
Cost per unit:
Direct costs of production
Direct labour
X
Direct material
X
Direct variable production overhead
X
Total direct variable cost or total prime cost
X
Marginal costing stock valuation
Indirect production overhead absorbed
X
Full production cost
X
Absorption costing stock valuation

37
Marginal costing – pro forma income (profit) statement
$
$
Sales
X
Less cost of sales
Opening stock (valued at variable production cost only)
X
Total variable production cost*
X
X
Less closing stock (valued at variable production cost only) (X)
(X)
Less non-production variable cost
(X)
Contribution
X
Less fixed production cost
(X)
Less fixed non-production cost (X)
Net profit
X
*Direct labour, direct material and direct (or variable) production overhead
Terminology: Contribution equals Sales less ALL marginal (or variable) cost
Absorption costing – pro forma income (profit) statement
$
$
Sales
X
Less cost of sales
Opening stock (valued at full production cost)
X
Total variable production cost*
X
Fixed production overhead absorbed
X
X
Less closing stock (valued at full production cost)
(X)
X
(Over)/under absorption of fixed production overhead
(X)/X
(X)
Gross profit
X
Less non-production fixed and variable cost (X)
Net profit
X
*Direct labour, direct material and direct (or variable) production overhead

38
Reconciliation of absorption to marginal costing profit
AC profit
X
Less: fixed overhead included within Closing inventory (X)
Add: fixed overhead included within Opening inventory X
MC profit
X
Activity based costing (ABC)
Activity based costing (ABC) looks in more detail about what causes fixed overhead to be
incurred and works out many ‘cost drivers’ (activities).
Steps in ABC
1. Group types of fixed overhead together.
2. Calculate from fixed overhead cost pools a fixed overhead ‘cost per driver’.
3. Absorb fixed overhead using ‘multiple cost drivers’.
A cost driver is any factor that causes a change in the cost activity, so it is important to
identify a causal relationship between the cost driver and the cost.
Customer profitability analysis (CPA)
Relating specific costs to serving customers or groups of customers, so that their relative
profitability can be assessed. CPA uses ABC techniques in order to allocate cost.
Customer profitability analysis (CPA) focuses on cost reduction by understanding how
customers consume different support resources e.g. processing, delivery, sales visits,
telephone support, internet support etc. It allows an organisation to concentrate on the most
profitable of its customers.
Direct product profitability (DPP)
DPP is a decision making tool that helps a food merchandiser by providing a better indication
of the profitability of products on the supermarket shelves. DPP allocates direct product
costs to individual products. These costs are subtracted from gross profit to derive at DPP for
each product. The normal indirect costs attributed to products would be distribution,
warehousing and retailing. DPP would ignore indirect costs such as head office overhead,
only product specific fixed (indirect) cost would be analysed. e.g. shelf filling, warehousing
and transportation
Closing Less
Opening Add
or ‘CLOA’

39
Activity based budgeting (ABB)
ABB uses cost driver data in the budgetary planning and control stage, in other words cost
levels are forecast and determined by using ABC techniques. Therefore ABB is a form of
budget preparation that focuses on the activities of an organisation. All costs are related to
those activities and can be split into primary activities (value added activities) and secondary
activities (non-value added activities). Non-value added activities if not supporting the value
added activities effectively, should be questioned as to whether it should exist at all.
Job and batch costing
Job costing is a form of specific order costing where costs are charged to individual orders or
jobs for customers e.g. printers or a special purpose machine, tailor made to order.
Batch costing is a form of specific order costing; similar is most ways to job costing e.g. the
job would be to manufacture a large number of identical items (or a batch), such as 1000
identical commemorative mugs.
Service costing
Characteristics of service organisations
Intangible e.g. cannot touch or feel what is offered
Simultaneous e.g. cannot be returned if faulty
Perishable e.g. cannot be stored
Heterogeneous e.g. differences in the exact service supplied each time not perfectly
identical (homogenous)
Why use service costing
To help control the departments costs e.g. budgetary control
To help improve the efficiency of how the service is used by other departments when
internal or external charging takes place
Examples of cost units for service organisations
Cost per hour
Cost per tonne
Cost per kilogram
Examples of composite cost units
Cost per tonne per mile
Cost per passenger per mile

40

41
Solutions to lecture examples
42
Chapter 4
Example 4.3 – (CIMA past exam question)
Traditional absorption costing takes the total budgeted fixed overhead for a period and
divides by a budgeted (or normal) activity level e.g. units, in order to find the overhead
absorption rate. This is a simple method of charging fixed overhead and allows fixed
overhead to be allocated to products, jobs or work-in-progress
Overhead absorption rate (OAR) =
Budgeted production overhead
Normal/budget level of activity
*Std Overhead absorption rate per unit (£330,000 ÷ 220,000) = £1.50
Over absorption of fixed overheads for the period is £40,000.
Actual production overhead
Actual production (200,000 units) x *O.A.R £1.50
= F/OH charge during the period £300,000
Production fixed overhead control account
£260,000
Over absorption
(£300,000 - £260,000) £40,000
43
Example 4.4
Marginal costing statement
Year 1
Year 2
£
£
£
£
Sales
(10,000 x £30)
300,000
(10,000 x £30)
300,000
Less cost of sales
Opening stock
(1,000 x £17.00)
0
17,000
Production variable cost
(11,000 x £17.00)
187,000
(9,000 x £17.00)
153,000
Less closing stock
(1,000 x £17.00)
(17,000)
0
(170,000)
(170,000)
Contribution
130,000
130,000
Fixed production cost (actual)
(21,000)
(21,000)
Net profit
109,000
109,000

44
Absorption costing statement
Year 1
Year 2
£
£
£
£
Sales
(10,000 x £30)
300,000
(10,000 x £30)
300,000
Less Production cost
Opening stock
(1,000 x £19.00)
0
19,000
Production variable cost
(11,000 x £17.00)
187,000
(9,000 x £17.00)
153,000
Fixed production cost absorbed
(11,000 x £2.00)
22,000
(9,000 x £2.00)
18,000
Less closing stock
(1,000 x £19.00)
(19,000)
0
(Over)/under absorption
(1,000)
3,000
(189,000)
(193,000)
Net profit
111,000
107,000
The delay in charging fixed production overhead under absorption costing leads to the
following situations, assuming the OAR in the case above remains constant.
Production > Sales (Year 1) Stock levels are rising therefore a greater proportion of fixed
overhead under absorption costing is being carried forward to the following period therefore
creating a greater profit than marginal costing.
Production < Sales (Year 2) Stock levels are falling therefore a smaller proportion of fixed
overhead under absorption costing is carried forward to the following period therefore
creating lower profit (by charging more fixed overhead for this period) than marginal
costing.
Production = Sales (Year 1 and 2) As should be in the long-run, both methods would give
exactly the same profit. If you add both years profits above together under both methods, the
total comes to £248,000, in both years together production equals sales. This is because
under absorption costing the same overhead would be brought in as is taken out in stock
valuation.
Note: Remember the only reason why profits differ under both methods is because of
differences in stock valuation.
45
Example 4.6 – (CIMA past exam question)
Part (i)
Under the absorption costing method $3,840 of fixed overhead would be carried forward to
the next financial period, due to production being higher than sales (production > sales).
(2,000 units – 1,400 units) x $6.40 = $3,840. Therefore absorption costing profit would be
$3,840 greater than using marginal costing.
Budgeted profit for absorption costing
$
Marginal costing profit
5,700
Add: Fixed overhead carried forward to the next period
3,840
Absorption costing profit
9,540
Part (ii)
Tip: A marginal cost (variable cost) is a cost that can be avoided if a unit is not
produced or would be incurred if a unit was produced. A fixed cost remains constant
whether a unit is or is not produced, therefore including fixed overhead within a cost
unit can distort decision making when working out the profit effect of increasing or
decreasing sales.
Marginal costing is more appropriate for decision making e.g. the nature of cost
behaviour is not distorted by including fixed overhead within a cost unit. Therefore
in a situation where a manager wants to view the true profit effect of increasing or
decreasing sales volume, marginal costing would be more appropriate e.g. for
techniques such as sensitivity, ‘what if?’ or break-even analysis.
A manager cannot manipulate profit from one period to the next by deliberately
setting the volume of production higher than sales for a period e.g. stock piling.
Using marginal costing would therefore allow a better performance evaluation of a
manager and ensure they concentrate on the maximisation of contribution leading to
greater cash-flow for the organisation.
46
Example 4.7
For a hospital which of these does not seem like a sensible activity and cost driver?
Activity
Cost driver
a) Insurance for building
Maintenance costs
b) Phone appointments
No. of patients
c) Patient main reception
No. of patients
d)
Length of patient stay
No. of patients
The answer is d
Example 4.9
Pre-packed Plc
Absorption costing
Labour hours
CC 40,000 x 0.50/4.00 = 5,000 hrs
SV 25,000 x 0.75/4.00 = 4,688 hrs
LV 30,000 x 0.50/4.00 = 3,750 hrs
13,438 hrs
£100,000 / 13,438 = £7.44 PER LABOUR HOUR
Chicken
Sweet and Lamb
Curry Sour Vegetables
Vindaloo
Monthly sales
40,000
25,000
30,000
£ £ £
Selling price
2.99
3.50
3.99
Ingredients
(0.99)
(0.50)
(1.49)
Labour
(0.50)
(0.75)
(0.50)
Contribution
1.50
2.25
2.00
Fixed overhead
£7.44 x
0.50/4.00
(0.93)
0.75/4.00
(1.40)
0.50/4.00
(0.93)
PROFIT
0.57
0.85
1.07
TOTAL PROFIT £22,800 £21,250 £32,100

47
ABC
Set ups 4 + 5 + 10 = 19
£50,000/19 = £2,632 a batch
Shredding mixing and packaging
100 x 4 = 400
25 x 5 = 125
125 x 10 = 1,250
1,775 machine hours
£20,000/1,775 = £11.27 per machine hour
Cooking
6,000Kj x 4 = 24,000
4,000Kj x 5 = 20,000
10,000Kj x 10 = 100,000
144,000
£30,000/144,000 = £0.208 per Kj
Fixed overhead analysis
Chicken
Sweet and
Lamb
Curry
Sour Vegetables
Vindaloo
£ £ £
Set up
£2632 x
4
10,528
5
13,160
10
26,320
Shredding mixing
And packaging
£11.27 an hour x
100 hrs x 4
4,508
25 hrs x 5
1,409
125 hrs x 10
14,088
Cooking
£0.21 per Kj x
6,000 Kj x 4
5,040
4,000 Kj x 5
4,200
10,000 Kj x 10
21,000
Total F/OH per unit 20,076
38,845
61,408
48
Chicken Sweet and
Lamb
Curry
Sour Vegetables
Vindaloo
Monthly sales
40,000
25,000
30,000
£ £ £
Revenue
119,600
87,500
119,700
Ingredients
(39,600)
(12,500)
(44,700)
Labour
(20,000)
(18,750)
(15,000)
Contribution
60,000
56,250
60,000
Fixed overhead
(20,076) (38,845) (61,408)
PROFIT
39,924
17,405
(1,408)
Notice how after using ABC the overall profitability of lamb turns into a loss. This will be
useful to management!
Example 4.10
Robertson Interiors (£)
BJ Flooring (£)
Revenue
500,000
100,000
15% DISCOUNT
(75,000)
n/a
Net revenue
425,000
100,000
Cost of goods sold
(300,000)
(60,000)
Gross margin
125,000
40,000
Transport
(4500)
(10,000)
Orders
(10,000)
(4,000)
Visits
(240)
(40)
Net margin
110,260
25,960
Transport £200,000/200,000 miles = £1 a mile
Orders £500,000/500 orders = £1,000 an order
Salesman £500,000/25,000 visits = £20 a visit

49
Example 4.11
Warehouse
Labour 350,000/100,000 = £3.50 per mc per week
Refrigeration 50,000/20,000 = £2.50 per mc per week
Building 250,000/100,000 = £2.50 per mc per week
Supermarkets
Staff 50,000 x 5/100,000 = £2.50 per mc per week
Refrigeration 50,000 x 5/20,000 = £12.50 per mc per week
Building 50,000 x 5/100,000 = £2.50 per mc per week
Transport
Refrigeration £3,000/120 mc = £25.00 per mc delivery cost
Standard £2,000/120 mc = £16.67 per mc delivery cost
Milk (£)
Nappies (£)
Price
1.09
11.95
Cost of good sold
0.24
7.95
Gross margin
0.85
4.00
Warehouse
Labour 3.50/100 x 0.5
0.02
Labour 3.50/20 x 4
0.70
Refrigeration 2.50/100 x 0.5 0.013
Building 2.50/100 x 0.5
0.013
Building 2.50/20 x 4
0.50
Supermarkets
Staff 2.50/100 x 0.2
0.005
Staff 2.50/20 x 1
0.125
Refrigeration 12.50/100 x 0.2
0.025
Building 2.50/100 x 0.2
0.005
Building 2.50/20 x 1
0.125
Transport
25.00/100
0.25
16.67/20
0.834
Profit
0.519
1.716
Focus on trying to reduce the stockholding period for nappies. Also transportation costs
could be passed on to the supplier or concentrate on carrying full loads if the company has to
use their own vehicles.
50
Example 4.12
Fixed overhead budgeted cost of a batch of 2.000 ‘Mex Tex’ Chillies
Set up
£2,632
Shredding, mixing and
Packaging
Machine hours £11.27 per machine hour x 30 hours =
£338
Cooking
£0.208 per Kj x 5,000 Kilojoules
£1,040
£4,010
Retail value (2,000 units in a batch x £3.99)
£7,980
Direct cost of manufacture
£1.39 x 2000 units in a batch (£2,780)
Fixed overhead consumed (as above)
(£4,010)
Profit
£1,190
Presumably the retailer will want a fair margin for each unit sold at £3.99; this will not leave
very much profit, if any at all if this is the case. Perhaps the ‘Tex Mex’ is priced
competitively, in which case Pre-packed Plc must find ways of reducing the resources each
production run would consume. Perhaps consider a reduction in weight of the product to
reduce ingredients used or the production of a greater number of units produced in one set up
in order to reduce the average fixed cost per unit.
51
Example 4.13 – (CIMA past exam question)
Part (a)
First we need to work out variable production costs per car. In order to find this we must
work out fixed production costs per car and deduct this from total production costs per car
given to give us variable production cost per car.
Total production costs per car
Car X total production cost per car = $40,000,000 / 1,000 = $40,000
Car Y total production cost per car = $82,250,000 / 1,750 = $47,000
Fixed production overheads absorbed per car
Fixed production overheads = $35,000,000
Budgeted machine hours = (1,100 x 200) + (1,600 x 300) = 700,000 machine hours
OAR = $35,000,000 / 700,000 = $50 per machine hour
Therefore per car:
Car X = $50 x 200 hrs = $10,000
Car Y = $50 x 300 hrs = $15,000
Variable production costs per car
Car X = $40,000 - $10,000 = $30,000
Car Y = $47,000 - $15,000 = $32,000
Car X ($’000)
Car Y ($’000)
Total ($’000)
Sales
52,500
105,000
157,500
Variable costs
Production costs
30,000
56,000
86,000
Admin costs
6,300
12,600
18,900
Contribution
16,200
36,400
52,600
Specific fixed costs
Marketing
2,000
4,000
6,000
14,200
32,400
46,600
General fixed costs
Production
35,000
Admin (16,000 – 6,000)
10,000
Profit
1,600
52
Part (b)
AC profit
X
Less: fixed overhead included within closing stock (X)
Add: fixed overhead included within opening stock
X
MC profit
X
AC profit
$350,000
Car X
Car Y
Less: fixed overhead in closing stock
300 x $10,000
= $3,000,000
100 x $15,000
= $1,500,000
($4,500,000)
Add: fixed overhead in opening stock
200 x $10,000
= $2,000,000
250 x $15,000
= $3,750,000
$5,750,000
MC profit
$1,600,000
Part (c)
Machining costs
This cost is driven by machine hours.
$7,000,000 / 700,000 hrs = $10 per machine hour
Set up costs
This cost is driven by the number of production runs.
Car X = (1,100 /10) = 110 runs
Car Y = (1,600 / 40) = 40 runs
Total runs = 110 + 40 = 150 runs
$12,000,000 / 150 runs = $80,000 per run
Quality inspections
This cost is driven by the number of inspections.
Car X = (110 x 20) = 2,200 inspections
Car Y = (40 x 80) = 3,200 inspections
Total inspections = 2,200 + 3,200 = 5,400 inspections
$7,020,000 / 5,400 inspections = $1,300 per inspection
Closing Less
Opening Add
or ‘CLOA’
53
Stores receiving
This cost is driven by the number of deliveries.
$3,480,000 / (492 + 900) = $2,500 per delivery
Stores issues
This cost is driven by the number of issues.
$5,500,000 / (4,000 + 7,000) = $500 per issue
Car X
$,000
Machining costs
1,100 units x 200 hrs x $10 per hr
2,200
Set up costs
110 runs x $80,000
8,800
Quality inspections
2,200 inspections x $1,300
2,860
Stores receiving
492 deliveries x $2,500
1,230
Stores issues
4,000 issues x $500
2,000
Total overheads
17,090
Direct costs
1,100 units x $30,000 per car
33,000
Total production costs
50,090
Cost per car
$50,090,000 / 1,100 units
45,536
Car Y
$,000
Machining costs
1,600 units x 300 hrs x $10 per hr
4,800
Set up costs
40 runs x $80,000
3,200
Quality inspections
3,200 inspections x $1,300
4,160
Stores receiving
900 deliveries x $2,500
2,250
Stores issues
7,000 issues x $500
3,500
Total overheads
17,910
Direct costs
1,600 units x $32,000 per car
51,200
Total production costs
69,110
Cost per car
$69,110,000 / 1,600 units
43,194
54
Part (d)
REPORT
To: Production Director of RJ
From: Management Accountant
Subject: Potential benefits of Activity based budgeting
Date: 19
th
May 2007
1. Introduction
The purpose of this report is to explain the potential benefits of using activity based
budgeting (ABB) for performance evaluation.
2. Benefits of using ABB
Traditional absorption costing takes the total budgeted fixed overhead for a period and
divides by a budgeted (or normal) activity level in order to find the overhead absorption rate
ABB looks in more detail about what causes fixed overhead to be incurred and works out
many ‘cost drivers’ rather than just labour or machine hours or products produced, all
driving overhead to be incurred. It is used in order to obtain a more accurate way of looking
at how fixed overhead is driven and should give a more accurate picture when costing
products, budgeting or valuing stock.
The modern business produces a wide product range, for example multi-products all
consuming different amounts of resources. Fixed overheads are now a large percentage of
total cost and it is more important to know how it should be shared, and also the complex
and diverse nature of modern production has resulted in many fixed overheads to be
incurred.
The following benefits can be had if using ABB:
More efficient management of resources by understanding what drives fixed
production overheads.
Better costing information for planning and control e.g. how different products
consume different resources or the production of flexed budgets based upon ABB.
More realistic pricing to customers in future, to cover overheads being incurred by
them.
Better profitability analysis of different customers and their orders.
Better comparisons made between budgeted and actual figures and therefore more
meaningful variances.
In conclusion superior information for performance evaluation can be gained from using
ABB rather than traditional absorption. ABB will give better explanations of cost behaviour
and allow better responsibility accounting.
I hope you have found this report useful but should you require any further assistance or
have any questions please do not hesitate to contact me.
Signed
Management Accountant

55
Example 4.14
Job 1056
£
Direct labour
Grade A 37 hours at £8.60
318
Grade B 50 hours at £6.50
325
Materials and components issued
8,560
Materials and components returned
-3,000
Production overhead absorbed
Grade A 37 hours at £5.00
185
Grade B 50 hours at £3.00
150
Total estimated cost
6,538
Mark-up 100%
6,538
Job price
13,076
Wyszukiwarka
Podobne podstrony:
analiza Activity-Based Costing (ABC) (7 str), Analiza i inne
Jak w praktyce wykorzystywać wyniki analiz Activity Based Costing
ZASADY RACHUNKU KOSZTÓW DZIAŁAŃ (ACTIVITY BASED COSTING) NA PRZYKŁADZIE SYMULACYJNEGO MODELU SYSTEMU
101 Drama Games and Activities
Use of clinical and impairment based tests to predict falls by community dwelling older adults
Reading for pleasure Judy Steiner (Extensive reading exercises and activities)
Microsoft Dynamics CRM 2011 Implementation Guide Microsoft Dynamics CRM 2011 and Claims based Authen
Detection of Metamorphic and Virtualization based Malware using Algebraic Specification
Detection of Metamorphic and Virtualization based malware using Algebraic Specification 001
islcollective worksheets beginner prea1 elementary a1 kindergarten ele indoor games and activities 5
sports and activities vocab juniors
Sexual Attitudes and Activities in Women with Borderline Personality Disorder Involved in Romantic R
P1 Standard costing and variance analysis
Content Based, Task based, and Participatory Approaches
NDT 52517 a novel 5 category multi modal t1 and t2wi mri based strati 031914
ZnO nanofluids Green synthesis, characterization, and antibacterial activity
więcej podobnych podstron