
SIMPLE METHOD FOR MEASURING OF
RECOGNITION ACUITY WITH A COMPUTER
Bogusława Dubik, Marek Zając
Institute of Physics, Wrocław University of Technology
♦
WHAT FOR?
•
desease / treatment development monitoring
•
określanie przydatnosci zawodowej / stopnia inwalidztwa
♦
DO I SEE CORRECTLY?
•
quality of retinal image
∗
point spread function,
∗
aberrations
∗
transfer function
∗
two-point resolution
•
visual acuity
∗
quality of retinal image,
∗
retina as a detector
∗
visual path
♦
RESOLUTUION VS RECOGNITION
♦
VISUAL ACUITY TESTS - OPTOTYPES (SNELLEN)
∗
optotype "E"
∗
optotype "C" (Landolt ring)
∗
letter optotypes
∗
bar tests
∗
...
• MEASURES OF VISUAL ACUITY -
•
visus
∗
standard:
distance 6 m (5 m)
whole optotype angle of view 5' (detail 1')
visus=6/6
∗
definition:
V
L
D
=
L - examination distance [m]
D - 5 arc min distance [m]
E
L
ω
•
recognition acuity
∗
MAR (minumum angle of resolution)

2
• MEASUREMENT METHOD
•
Optotype is presented on the computer screen
∗
random orientation (up, down, right, left)
∗
different angular size
•
Subject indicates the optotype orientation
(or onswers "cannot recognize") by pressing the appropriate key
∗
correct recognition - the following optotype smaller
∗
false recognition - the following optotype greater
∗
random drawing procedure assuring uniform distribution of optotype sizes
•
The results
∗
ordering according to the optotype size
∗
counting the percent of correct recognitions in particular angular
intervals
∗
result: psychometric function
0
2
4
6
8
10
12
14
16
18
20
0
50
100
angular size of optotype [arc min]
percent of
correct
recognitions
∗
approximation:
Weibull function
−
−
−
=
β
α
γ
c
c
P
exp
)
1
(
1
)
(
tanh function
(
)
[
]
(
)
{
}
(
)
{
}
(
)
{
}
(
)
{
}
+
+
⋅
−
+
+
⋅
+
⋅
−
−
+
⋅
=
+
+
⋅
=
1
exp
exp
exp
exp
2
1
1
2
1
)
(
1
0
1
0
1
0
1
0
1
0
a
c
a
a
c
a
a
c
a
a
c
a
a
c
a
th
c
P
∗
numerical parameters:
K50
K100
3
EXAMPLES OF PSYCHOMETRIC FUNCTIONS
Subject: BOG12E
0
2
4
6
8
10
12
14
16
18
20
0
50
100
angular size of optotype [arc min]
correct
%
K50=3.532
K100=5.164
Subject: KRZYS12
0
2
4
6
8
10
12
14
16
18
20
0
50
100
angular size of optotype [arc min]
%
correct
K50=10.856
K100=13.552

4
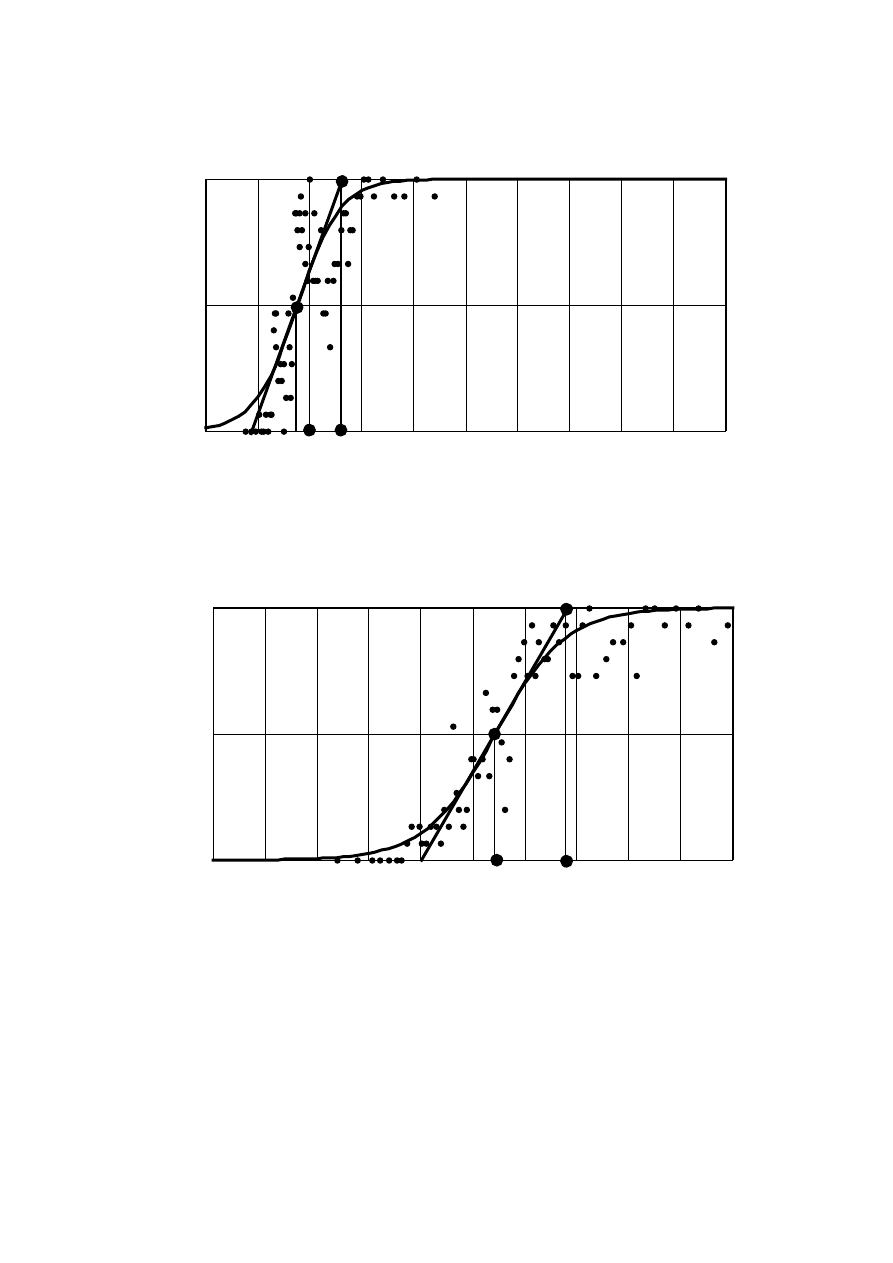
POSSIBLE APPROXIMATIONS - COMPARISON
TANH FUNCTION & WEIBULL FUNCTION
Subject EWA24
0 1 2 3 4 5 6 7 8 9 10 11 12 13 14 15 16 17 18 19 20
0
50
100
angular size of optotype(arc min)
tanh
Weibull
%
correct
tanh function approximation
K50 =6.824
K100=9.632
Weibull function approximation
K50=6.791
GROUPING METHOD
&
NUMBER OF OBSERVATIONS IN A SERIES
NUMBER OF OBSERVATIONS
•
Random choice of 100, 200, 300, ..., 900 observations from 1000
observation's series
GROUPING
•
Equal angular interval, different number of observations in each,
•
Equal number of observations, different angular intervals,
Institute of Physics, Wroc³aw Technical University
EXAMPLE MAR6
100
200
300
400
500
600
700
800
900 1000
5
6
7
8
9
number of observations
MAR
K100
K50
EXAMPLE BOG8
100
200
300
400
500
600
700
800
900 1000
5
6
7
8
number of observations
MAR
K100
K50
CONCLUSION:
•
number of observatioons not less than 500
•
grouping method does not matter

Institute of Physics, Wroc³aw Technical University
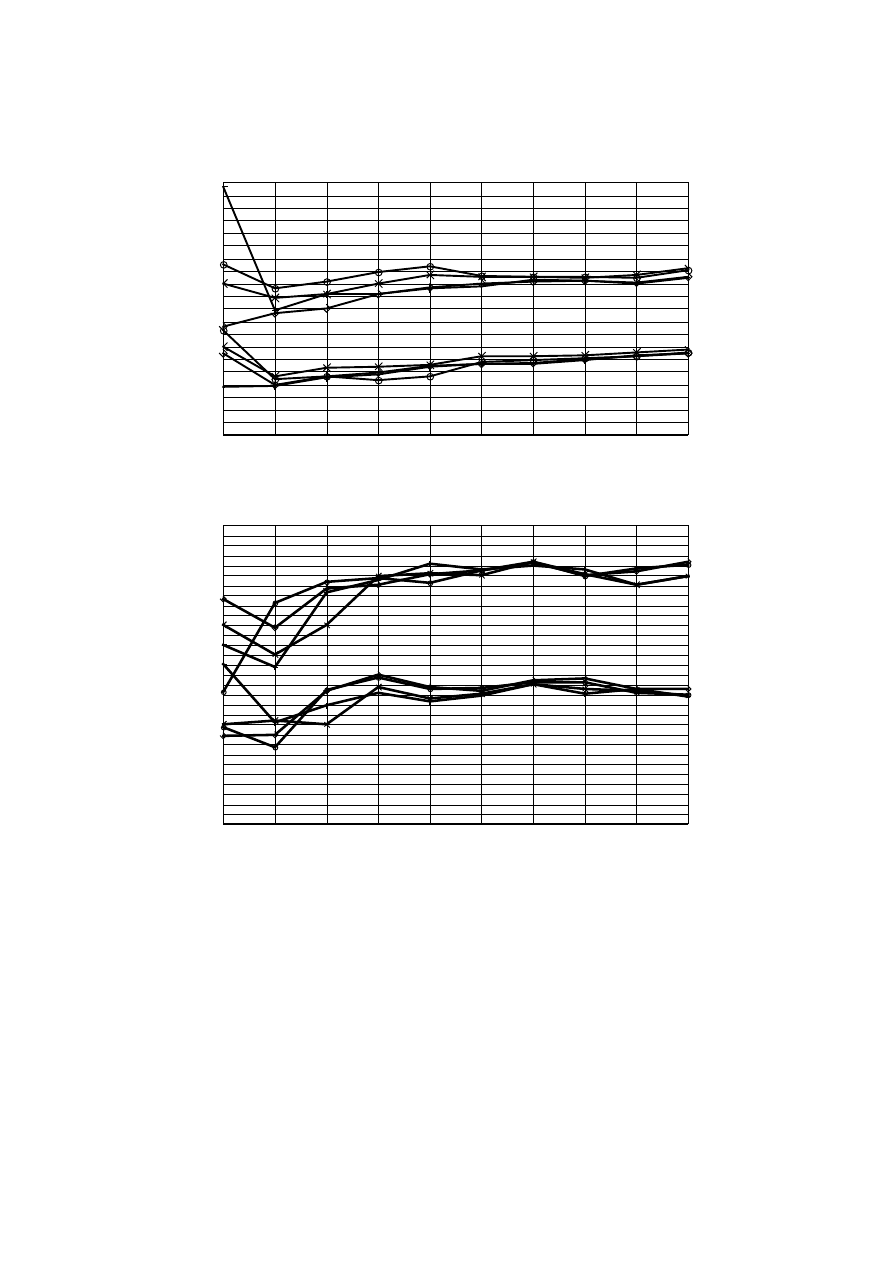
PARTICULAR MEASUREMENT ACCURACY
one measurement = one series of 1000 observations
random choice of 500 observations
Example MAREK6
6
7
8
9
10
11
12
13
14
15
K50
K100
number of "measurement"
=
sr50 11.992
=
sr100 10.057
=
dev50 0.034
=
dev100 0.025
Example EWA4
6
7
8
9
10
11
12
13
14
15
number of "measurement"
=
sr50 11.033
=
sr100 8.188
=
dev50 0.046
=
dev100 0.04
Example KRZYS12
6
7
8
9
10
11
12
13
14
15
i
number of "measurement"
=
sr50 13.564
=
sr100 10.808
=
dev50 0.055
=
dev100 0.044
Example BOGUSIA8
6
7
8
9
10
11
12
13
14
15
number of "measurement"
=
sr50 11.992
=
sr100 7.489
=
dev50 0.034
=
dev100 0.034
CONCLUSION
•
Measurement accuracy is not worse than
±0.15

Institute of Physics, Wroc³aw Technical University
LONG TERM CHANGES IN VISUAL ACUITY
Subject BOGUSIA, test E
0
2
4
6
8
10
12
0
1
2
3
4
5
6
7
8
9
10
number of measurement (day)
MAR
K100
K50
Subject: MAREK, test E
0
2
4
6
8
10
0
1
2
3
4
5
6
7
8
9
10
11
12
13
14
15
number of measurement (day)
MAR
K100
K50

Institute of Physics, Wroc³aw Technical University
VISUAL ACUITY MEASURED WITH "E" TEST & "C" TEST
Subject: MAREK
0
1
2
3
4
5
6
7
0
1
2
3
4
5
6
7
8
9
10
11
12
13
14
15
K100/E
K100/C
K50/E
K50/C
number of measurement
MAR
Subject: BOGUSIA
5
6
7
8
9
10
11
12
13
0
1
2
3
4
5
6
7
MAR
number of measurement
K50/E
K50/C
K100/E
K100/C
Institute of Physics, Wroc³aw Technical University
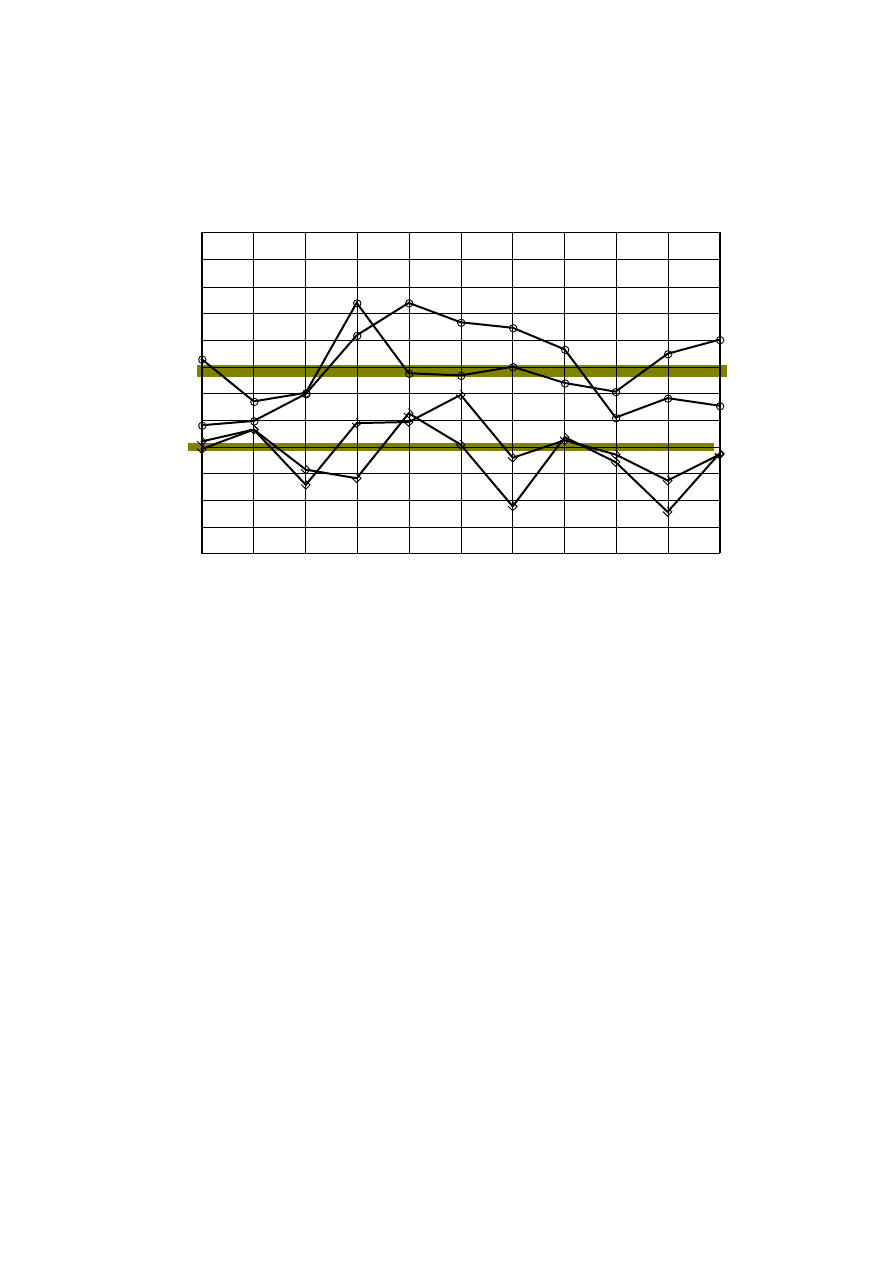
VERTICAL & HORIZONTAL TESTS
(INFLUENCE OF ASTIGMATISM)
0
1
2
3
4
5
6
7
8
9
10
0.8
0.9
1
1.1
1.2
1.3
1.4
MAR(hor)
MAR(ver)
_________
MAREK
BOGUSIA
number of measurement
SUBJECT: MAREK
<K100 v/h> = 1,003 <K50v/h> = 0,976
dev(K100v/h) = 0.015 dev(K50v/h) = 0.017
Subject: BOGUSIA
<K100v/h> = 1,165 <K50v/h> = 1,138
dev(K100v/h) = 0.014 dev(K50v/h) = 0,022

Institute of Physics, Wroc³aw Technical University
INCREASING / DECREASING TEST
COMPARISON TO PSYCHOMETRIC FUNCTION
Example KASIA0
0 1 2 3 4 5 6 7 8 9 10 11 12 13 14 15 16 17 18 19 20
0
50
100
angular optotype size [arc min]
MAR
K1=3,9
K2=4,7
K50=6,6
K100=8,3
Example KRZYS12
0 1 2 3 4 5 6 7 8 9 10 11 12 13 14 15 16 17 18 19 20
0
50
100
angular optotype size [arc min]
MAR
K1=7,2 K2=7,7
K50=10,9
K100=13,5
Wyszukiwarka
Podobne podstrony:
NACA TM 948 A Simple Approximation Method for Obtaining the Spanwise Lift Distribution
A Simple and Effective Method for the Reduction of Acyl
Shakespeare Measure for Measure
Free Energy Bedini Device And Method For Pulse Charging A Battery Patent Info 2004
Fibonacci Practical Fibonacci Methode For Forex Trading
Improvements in Fan Performance Rating Methods for Air and Sound
measure for measure EMH4YESHZ5NVWMNHLNGPH4YSGOZG4YFLFNETRGA
Combinatorial Methods for Polymer Science
Metallographic Methods for Revealing the Multiphase Microstructure of TRIP Assisted Steels TŁUMA
Dynamic gadolinium enhanced subtraction MR imaging – a simple technique for the early diagnosis of L
Methodology for Assessment Biodiversity
Past simple, Methodology, materialy na lekcje
A Simple Circuit For Driving Microcontroller Friendly Pwm Generator 91085A
FOREX Systems Research Practical Fibonacci Methods For Forex Trading 2005
moiz, Metoda MTM, Metoda badania i mierzenia pracy - MTM (Method Time Measurement)
Numerical Methods for Engineers and Scientists, 2nd Edition
Advanced Methods for Development of Wind turbine models for control designe
ASTM D638â99 (1999) [Standard Test Method for Tensile Properties of Plastics] [13p]
Gas chromatography–mass spectrometry method for determining
więcej podobnych podstron