
O R I G I N A L A R T I C L E
Cadmium, chromium, lead, manganese and nickel concentrations
in blood of women in non-polluted areas in Japan, as determined
by inductively coupled plasma-sector field-mass spectrometry
Masayuki Ikeda
•
Fumiko Ohashi
•
Yoshinari Fukui
•
Sonoko Sakuragi
•
Jiro Moriguchi
Received: 16 December 2009 / Accepted: 4 May 2010 / Published online: 3 June 2010
Ó Springer-Verlag 2010
Abstract
Background
Background levels of metals of toxicological
or industrial importance have been reported for several
populations in the world. The information on the levels of
metals of industrial, occupational or clinical importance in
blood of general Japanese populations is however still
scarce.
Objectives
The objectives of the study were to establish
background levels of Cd, Cr, Mn, Ni and Pb in blood of
Japanese population using inductively coupled plasma-
sector field mass spectrometry (ICP-SF-MS), which was
expected to be sensitive enough to measure low-level Pb in
blood of general populations. For this purpose, women,
rather than men, were studied to minimize the effect of
smoking. An additional objective was to examine possible
contamination from devices in phlebotomy process.
Methods
Blood samples were collected in 2000’s from
1,420 adult women in eight prefectures of no known
anthropogenic environmental metal pollution in Japan, and
the samples were subjected to ICP-SF-MS analyses after
wet digestion with extra-pure nitric acid. Ultra pure water
samples aspirated into blood sampling vacuum tubes were
analyzed to detect possible metal contamination.
Results
Contamination of blood samples from phlebot-
omy device was detected for Cr and possibly for Mn and
Ni, whereas it was below measurable levels with regard to
Cd, Ni and Pb. Under this limitation, GM metal concen-
trations in blood were 1.23 lg/l for Cd, 0.55 lg/l for Cr,
13.2 lg/l for Mn, 1.81 lg/l for Ni and 15.8 lg/l for Pb. Cd
and Pb tended to increase in association with age, whereas
Cr, Mn and Ni tended to decrease. Smoking induced ele-
vation both in Cd and in Pb in blood. It was also made clear
that the ICP-SF-MS is reliable for measurements of Cd, Mn
and Pb in blood allowing evaluation even on an individual
basis, while the results of Cr and Ni should be reliable on a
group basis (e.g., n C 5). Limitation in compatibility
was discussed between the results by ICP-SF-MS and
that by traditional graphite furnace atomic absorption
spectrometry.
Conclusions
ICP-SF-MS is a reliable method of blood
analysis for Cd, Mn and Pb even for the evaluation on an
individual basis. Cr and Ni analyses should be reliable on a
group basis, probably due to limited performance inherent
to the analysis principle and matrix. Possible contamination
from phlebotomy devices with Cr should be taken into
account in evaluating the results.
Keywords
Biological monitoring
Blood Cd
Cr
Mn Ni Pb Japanese women
Introduction
Biological exposure monitoring has been winning popu-
larity not only in occupational health fields where the
concept has been first established but also in environmental
health and clinical practice. The target chemicals may be
classified into four groups, i.e., organic solvents, inorganic
metals, pesticides and others (Mikeev
,
).
In the present study, five metals [ i.e., cadmium (Cd),
chromium (Cr), manganese (Mn), nickel (Ni) and lead
M. Ikeda (
&) F. Ohashi Y. Fukui
Kyoto Industrial Health Association (Main Office),
67 Nishinokyo-Kitatsuboicho, Nakagyo-ku,
Kyoto 604-8472, Japan
e-mail: ikeda@kyotokojohokenkai.or.jp
S. Sakuragi
J. Moriguchi
Kyoto Industrial Health Association (Mibu Office),
4-1 Mibu-Shujaku-cho, Nakagyo-ku, Kyoto 604-8871, Japan
123
Int Arch Occup Environ Health (2011) 84:139–150
DOI 10.1007/s00420-010-0542-2
(Pb)] of industrial, environmental or clinical importance
(e.g., Bader et al.
; Herber
; Ikeda et al.
,
;
Apostoli et al.
; Polizzi et al.
; Muttamara and
Leong
; Kim et al.
; Al-Saleh et al.
; Afridi
et al.
,
; Ekong et al.
; Heitland and Ko¨ster
; Vitayavirasuk et al. 2006; Coelho et al.
;
McKelvey et al.
; Antoniou et al.
; Bazzi et al.
; Farzin et al.
; Gao et al.
; Jusko et al.
;
Kummrow et al.
; Bulat et al.
) were selected, and
the levels in the blood of populations in areas with no
known anthropogenic environmental metal pollution in
Japan were determined by inductively coupled plasma-
sector field mass spectrometry (ICP-SF-MS), as a sensitive
tool for metal analysis at low levels (Schramel et al.
;
Zhang et al.
; White
). For this purpose, women
were selected to minimize the effects of smoking. The
results were summarized in the present report and dis-
cussed with existing databases on blood metals in con-
junction with environmental exposure to metals in Japan.
Materials and methods
Blood samples
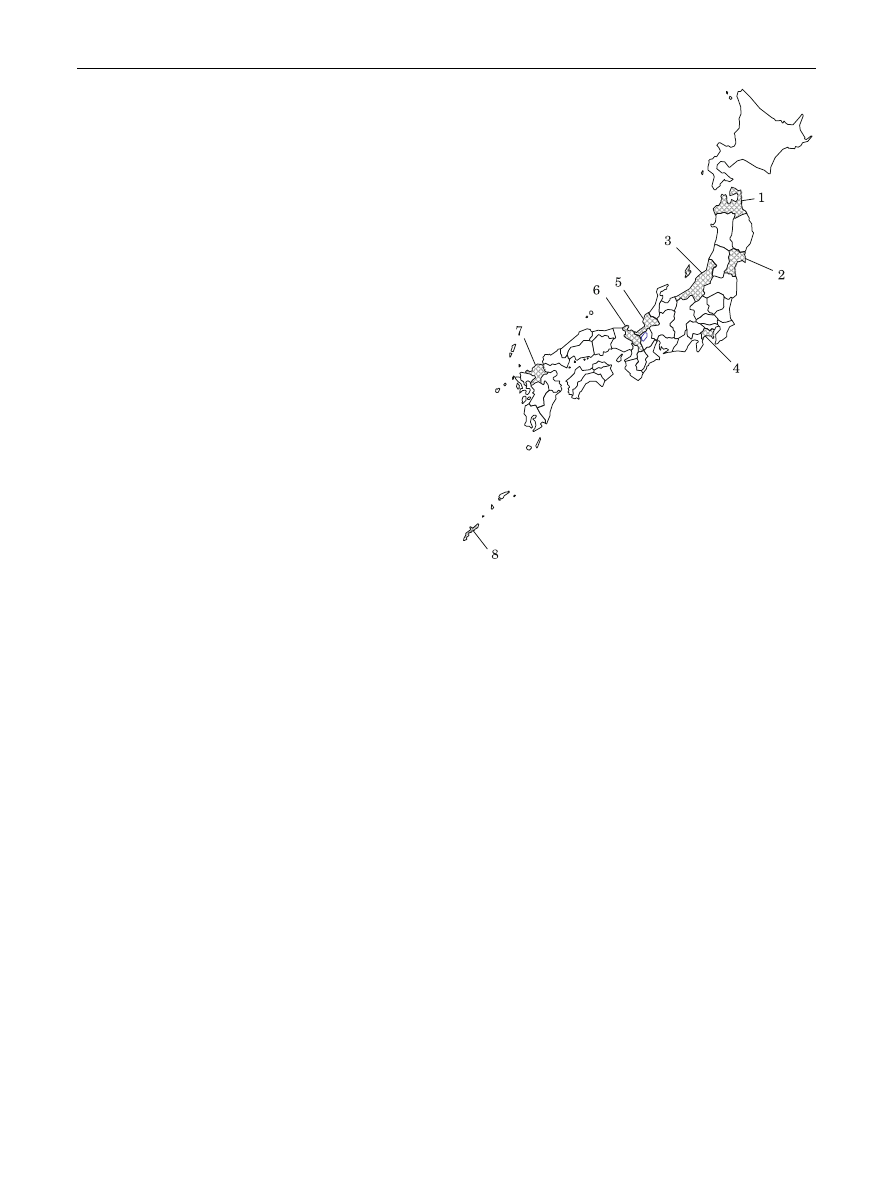
Blood samples, 1,214 in total, collected in a previous study
from adult women in six prefectures (Prefectures 2–4 and
6–8; Fig.
) in Japan in 2002 (Tsukahara et al.
) were
subjected to the analysis. In addition, 100 and 106 blood
samples, respectively, were collected in 2008 from adult
women in other two prefectures (Prefectures 1 and 5;
Fig.
) for the present study. Thus, 1,420 blood samples
were available in total. Of the 1,420 women, 1,383 women
(97%) gave information on smoking habits through a self-
administered questionnaire survey; 978 (71%), 167 (12%)
and 238 women (17%) were never, current and ex-smokers,
respectively (Tsukahara et al.
, and the present study).
The survey covered eight prefectures in total scattering
all over the country of Japan (for locations, see Fig.
Japan consists of 47 prefectures in total. No anthropogenic
metal pollution of the general environment had been
known in the regions where the women lived, and none of
them had ever engaged in work with use of target metals as
confirmed by the questionnaire surveys (Tsukahara et al.
; the present study).
The study protocol was approved by the Ethics Com-
mittee in Kyoto Industrial Health Association. Each of
women provided informed consent in writing.
Blood analyses
An aliquot (0.1 ml) of each blood sample was taken into a
PFA vial (made of perfluoroalkyl vinyl ether; a product of
ARAM Co., Osaka, Japan) and mixed with 0.5 ml extra-
pure nitric acid (for specification, see the Reagent section).
The vessel was sealed, and the mixture was wet-ashed in a
microwave digestion system (ETHOS 1, Milestone Srl,
Sorisole, Italy) by linear heating up to 180
°C for 30 min
and keeping at the temperature for 20 min, followed by
cooling down to room temperature (Mizushima et al.
). The ash was taken up in 5 ml ultra pure water (for
preparation, see the ‘‘
’’ section) and subjected to
ICP-SF-MS analysis.
The instrument used was a double-focusing sector field
ICP-MS (EMENT2, Thermo Fisher Scientific Inc, Bremen,
Germany). The operation conditions are summarized in
Table
The performance of the system was approved by German
Society on Occupational Medicine and Environmental
Medicine (G-EQUAS 44 in 2010) for Cd and Pb in occu-
pational and environmental medicine fields, and for Cr, Mn
and Ni in occupational medicine fields; no test sample was
available for Cr, Mn and Ni in environmental medicine field.
The results of internal quality assurance with SERO AS
(Billingstad, Norway) were such that the accuracy (%) [CV
Fig. 1
The locations of the eight prefectures where blood samples
were collected. The eight prefectures of blood sample collection are
shown with shades. The numbers correspond to the numbers in
Table
. Note that Japan consists of 47 prefectures in total
140
Int Arch Occup Environ Health (2011) 84:139–150
123

(%; n = 10) in parenthesis] with SERO201505 was 93.5
(4.6) for Cd, 76.0 (16.9) for Cr, 100.8 (1.6) for Mn, 94.7
(24.1) for Ni and 101.2 (1.9) for Pb and that with
SERO201605 were 100.6 (9.5) for Cd, 99.7 (3.0) for Cr,
100.3 (2.3) for Mn, 97.6 (16.5) for Ni and 97.2 (1.4) for Pb.
Thus, there was a good agreement of the AM measured
values with the certified values for all five metals, but the
precision might be relatively low for Ni and possibly for Cr
also.
The reagent blank–based limits of determination [LOD
(A)] were calculated as 3xSD; the SD was obtained after
determination of 10 reagent blank samples (i.e., ultra pure
water being employed in place of blood, mixed with nitric
acid and heated in PFA vials by microwave). The 3xSD
values were 0.0001, 0.0076, 0.0049, 0.0132 and 0.0024 lg/l
for Cd, Cr, Mn, Ni, and Pb, respectively. In blood anal-
yses, the wet-ash of 0.1 ml of blood was taken up in 5 ml
ultra pure water (see above) so that each sample was
diluted by 50 times. Taking this dilution into consideration,
the LOD (A) was calculated (after rounding) to be 0.1, 0.4,
0.2, 0.7 and 0.1 lg/l for Cd, Cr, Mn, Ni and Pb,
respectively.
The instrument limits of determination (lg/l) [LOD
(B)] were calculated as 3xSD obtained by 10 times
determination of ultra pure water; the 3xSD values were
0.0006, 0.0006, 0.0003, 0.0012 and 0.0003 lg/l for Cd,
Cr, Mn, Ni and Pb, respectively. Taking the 50-times
dilution into consideration, the LOD (B) was set at 0.03,
0.03, 0.02, 0.06 and 0.02 lg/l for Cd, Cr, Mn, Ni, and Pb,
respectively.
Testing of phlebotomy device for possible
contamination with metals
Two types of popularly used vacuum tubes for phlebotomy
were tested for possible metal contamination in the process
of blood sampling. The tubes tested were 5-ml tubes con-
taining heparin Na (65 units) (as anti-coagulant) and 5-ml
tubes with ethylenediaminetetraacetic acid (EDTA) 2 K
salt (3.6 mg) (both from TERUMO, Tokyo, Japan). Nee-
dles (21G x 1 1/2; MN-2138MS) and holders were also
from TERUMO, Tokyo, Japan.
After connecting a needle to a holder, the sharp top of
the needle was inserted into ultra pure water, and 5-ml of
the water was aspirated into a vacuum tube by connection
of a vacuum tube to the other end of the needle in the
holder. The anti-coagulant in the vacuum tube was thor-
oughly dissolved by gentle shaking. The water in the tube
was taken out, and 0.1 ml aliquot was mixed with 0.5 ml
extra-pure nitric acid. The mixture was subjected to metal
analysis (without microwave treatment) as if the water
were a blood sample. The procedure was repeated with five
sets each of fresh needle–holder–vacuum tube combination
for two types of the tubes. Five portions of the ultra pure
water (without vacuum tube treatment) were also analyzed
for metals. Thus, 15 analyses were conducted in total.
Reagents
Nitric acid of high purity (TAMAPURE-AA-100)
TM
was
purchased from Tama Chemicals, Kawasaki, Japan. The
Table 1
ICP-MS operation conditions
Item
Conditions
System
Thermo Scientific ELEMENT2 High Performance High Resolution ICP-MS
(Thermo Fisher Scientific Inc, Bremen, Germany)
ICP
RF power:
1.250 kW
Nebulizer:
Micro-uptake concentric nebulizer
Plasma gas:
Argon
Gas flow rate:
Cool gas, 16 L/min
Auxiliary gas, 0.87 L/min
Sample gas, 0.979–1.190 L/min
Additional gas, 0.005–0.120 L/min
Ion sampling
Diameter of sampling cone orifice:
1.0 mm
Diameter of skimmer cone orifice:
0.8 mm
MS
Scan mass range:
52(Cr), 55(Mn), 60(Ni), 111(Cd), 208(Pb) m/z
Mass resolution:
Medium resolution (R = 4,000)
Samples per peak:
20
Integration window:
60%
Vacuum:
Fore vacuum, 2–3 E-4 mbar
High vacuum, 1–2 E-7 mbar
Int Arch Occup Environ Health (2011) 84:139–150
141
123

specification concentrations were \100 ng/l for all 5 met-
als, and observed concentrations were \10 ng/l for Cd, Cr
and Mn and \50 ng/l for Ni and Pb. Ultra pure water was
obtained using the Milli-Q system, Nihon Millipore,
Tokyo, Japan.
Statistical analysis
Concentrations of the five metals in blood distributed log-
normally. Accordingly, the metal concentrations were
expressed in terms of geometric means (GMs) and geo-
metric standard deviations (GSDs). A normal distribution
was assumed for age to be expressed in terms of arithmetic
means (AMs) and arithmetic standard deviations (ASDs).
In calculating GM values, the values below LOD (A) or
LOD (B) were taken as if they were half the LOD.
Possible age dependency was examined by simple
(SRA) and multiple regression analysis (MRA). Correla-
tion was examined by correlation matrix analysis. ANOVA
followed by multiple comparison (Scheffe´), t-test and v
2
test was also employed.
Results
Populations surveyed
Ages of the 1,420 women in eight prefectures were distrib-
uted in a wide range from 20 to 81 years, with a median of
45 years. The number of the subjects and their median age
by prefecture were various, i.e., 100 women (median age;
49 years), 122 (44 years), 209 (44 years), 100 (34 years),
106 (45 years), 486 (46 years), 47 (39 years), and 250
(50 years) in Prefecture 1, 2, 3, 4, 5, 6, 7 and 8, respectively.
Reproducibility of metal levels by ICP-SF-MS
In order to confirm that the values obtained by ICP-SF-MS
were reproducible, 60 samples from one prefecture (Pre-
fecture 4) were analyzed twice with a lapse in time of one
year; before and during the 1 year storage, the blood
samples were kept in tightly capped acid-washed tubes at
-30
°C and thawed immediately before each of the anal-
yses. The regression line between the two measurements
(without logarithmic conversion) showed that the measured
values were exactly reproducible in case of Cd, Mn and Pb;
the slopes were essentially 1, and the intercepts on the
vertical axis were very close to zero, with r values next to 1
(p \ 0.01). Thus, the values were thought to be reproduc-
ible even on an individual basis (Table
). In cases of Cr
and Ni, however, r values were as small as \0.2, and the
slopes were not close to 1; the findings were taken to
suggest that the reproducibility on an individual basis was
hardly expectable.
Similar analyses after logarithmic conversion of the
metal concentrations gave somewhat greater r values even
for Cr and Ni (with p \ 0.05) and also greater slopes. The
95% upper limits however did not reach 1.
Nevertheless, the differences between GMs for the first
and the second measurements were statistically insignifi-
cant (p [ 0.10). To examine the smallest number of cases
necessary for group basis evaluation, the 60 cases of the
Table 2
Correlation between the first and the second measurements of metals in blood
Metal
The 1st
a
The 2nd
a
Intercept
Slope
r
p for r
GM
GSD
GM
GSD
a
(95% range)
b
(95% range)
Cd
1.18
1.624
1.19
1.646
-0.042
(-0.129 to 0.045)
1.042
(0.983 to 1.100)
0.98
\0.01
0.002
(-0.016 to 0.019)
0.983
(0.903 to 1.063)
0.96
\0.01
Cr
0.80
1.816
0.84
2.313
0.934
(0.536 to 1.333)
0.226
(-0.093 to 0.545)
0.18
[0.10
-0.025
(-0.119 to 0.069)
0.518
(0.174 to 0.861)
0.37
\0.01
Mn
13.9
1.414
14.1
1.428
-0.676
(-1.524 to 0.172)
1.063
(1.008 to 1.117)
0.98
\0.01
-0.005
(-0.065 to 0.054)
1.009
(0.958 to 1.061)
0.98
\0.01
Ni
1.81
1.550
1.92
1.498
1.739
(1.217 to 2.261)
0.172
(-0.060 to 0.405)
0.19
[0.10
0.227
(0.152 to 0.302)
0.216
(-0.020 to 0.451)
0.23
[0.05
Pb
14.4
1.412
14.9
1.433
-0.621
(-1.454 to 0.212)
1.086
(1.035 to 1.136)
0.99
\0.01
-0.008
(0.074 to 0.059)
1.021
(0.964 to 1.078)
0.98
\0.01
60 blood samples obtained in the same prefecture were analyzed by ICP-MS twice, about 1-year period between the two occasions. The statistical
significance of possible difference was examined by paired t-test, and the by regression analysis taking the first and the second measurement on
the horizontal (X) and the vertical axis (Y), respectively, so that Y = a ? bX. The values in italic show the results after logarithmic conversions
of the metal concentrations
a
The 1st and the 2nd measurements. There was no significant difference between the two values as examined by paired t-test
142
Int Arch Occup Environ Health (2011) 84:139–150
123

first measurement were divided into several cases of an
equal size and possible difference in GMs was examined
by multiple comparison test (Scheffe´). No significant dif-
ference (p [ 0.10) was detected in 12 GM values when the
60 cases were divided into 12 subgroups of an equal size
(n = 5). The results were taken to indicate that five sam-
ples would be sufficient to obtain reproducible GM values.
Possible contamination of blood samples
from phlebotomy device
The results of testing are summarized in Table
, by type
of vacuum tubes employed. It should be noted that a fresh
needle–holder complex was used for each of the five vac-
uum tubes of the two types.
Extent of contamination varied substantially depending
on vacuum tube types and metals. Cr was detected at
measurable amounts in both types. The level was similar in
both types with GM = 0.05 lg/l but the maximum
appeared to be different, i.e., Max = 0.06 lg/l in Type 1
and 0.08 lg/l in Type 2. In case of Mn, contamination was
measurable in Type 1 (GM = 0.28 lg/l) in Type 1 whereas
it was not so in Type 2. With regard to Cd, Ni and Pb, no
measurable contamination was detected irrespective of
tube types.
Metal levels in blood
The GM levels of the five target metals among 1,420 cases
as a whole are summarized in the top line in Table
together with medians (Med) and the maximum (Max).
GSD values are given in the footnote as GSD ranges. For
calculating GM and GSD values, the reagent blank–based
LOD for each metal [(LOD (A); for details, see the
‘‘
’’ section)] was employed. In cases
of Cd, Mn and Pb, all values measured were greater than
LOD (A), and 1.23, 13.2 and 15.8 lg/l were obtained as
GM for Cd, Mn and Pb, respectively. With regard to Cr and
Ni, the values were\LOD (A) in 399 cases (28.1%) and 37
cases (2.6%), respectively. Assuming that the values below
corresponding LOD (A) had been half the LOD (A), 0.55
and 1.81 lg/l were obtained as GM for Cr and Ni,
respectively. It should be noted that Cr values were \LOD
(A) in more than one-fourth of the total cases. When the
instrument limit of determination [i.e., LOD (B)] for Cr
(0.03 lg/l) was applied, the number of \LOD (B) cases
was reduced to 10 (0.7%). The GM value (0.55 lg/l)
however stayed essentially unchanged.
Thus, the GM values were various subject to the metals;
the level was highest for Pb (15.8 lg/l), followed by Mn
(13.2 lg/l). Levels for two metals, Ni (1.81 lg/l) and Cd
(1.23 lg/l), were about one-tenth of that of Pb and Mn, and
the level was lowest for Cr (0.55 lg/l). Cr in addition
showed wide variation in distribution with the largest GSD
(1.97–2.48). In fact, the minimum was below the LOD as
described above. The wide variation in observation might
be related to the analytical difficulty of this metal and
possible contamination from phlebotomy devices as to be
discussed elsewhere.
When the metal concentrations were evaluated by
prefectures (Table
), the GM levels were highest in
Prefecture 3 for Cd, Cr and Ni, but it was in Prefecture 7
for Mn and Prefecture 6 for Pb. ANOVA followed by
multiple comparison test (Scheffe´) showed that age dis-
tribution was not uniform among the prefectures as pre-
viously discussed. Cd, Cr and Ni (after logarithmic
conversion) were significantly (p [ 0.01 to 0.05) higher in
Prefecture 3 than in most of other prefectures, and it was
also the case for log Pb in Prefecture 6. For Mn, however,
no significant (p [ 0.10) bias was observed among pre-
fectures (Table
).
Multiple regression analysis was conducted taking age
and prefectures as independent variables and one of the five
metal concentrations (after logarithmic conversion) as a
Table 3
Possible contamination with metals from phlebotomy device
Type
Anti-coagulant
Metal (lg/l)
a
Cd
Cr
Mn
Ni
Pb
1
Heparin Na
GM
0.05
0.28
GSD
1.28
1.09
Max
\LOD (B)
0.06
0.31
\LOD (B)
\LOD (B)
2
EDTA 2K
GM
0.05
GSD
1.45
Max
\LOD (B)
0.08
\LOD (B)
\LOD (B)
\LOD (B)
Metal concentration in expra-pure water before aspiration were below LOD (B) for all of the five metals; for LOD (B), see the ‘‘
’’
a
Concentration of metal in water collected from each vacuum tuble. Experiments were repeated with five fresh sets for each type
Int Arch Occup Environ Health (2011) 84:139–150
143
123

dependent variable. The analysis showed that age was an
effective variable for Cd, Cr, Mn and Pb (p \ 0.01) and
also for Ni (p \ 0.05). R
2
was 0.014 to 0.110, suggesting
that the power of all nine independent variables in com-
bination was limited.
Correlation between two metal levels
Correlation matrix was calculated first on the prefectural
basis (n = 8) (in the upper-right corner in Table
). Cor-
relations between the five metals were all insignificant
(p [ 0.10). In case of analysis on the individual basis
(n = 1,420) (in the lower left corner of Table
), there
were several pairs for which the correlation between the
pair was statistically significant (p \ 0.05). Nevertheless,
some of the differences might be over-evaluated due to the
large number of cases, e.g., p \ 0.05 despite |r| was as
small as 0.063 for the pair of Mn and Pb. Significant cor-
relation of Cd with Pb (r = 0.235, p \ 0.01) and with Mn
(r = 0.168, p \ 0.01) might deserve attention. The corre-
lation coefficient was even higher (r = 0.501, p \ 0.01)
for the pairs of Cr and Ni. The latter observation should
however be taken as yet inconclusive due to the technical
limitations on the Cr and Ni determination as discussed
above.
A close correlation was observed for Cd, Cr, Mn and Pb
with age. This point will be discussed later.
Effects of aging on metal levels in blood
As the multiple regression analysis showed that the age
was an influential variable on Cd, Cr, Mn and Pb in
blood (after logarithmic conversion), the effect of age on
the logarithm of metal level was examined by simple
regression analysis (top half in Table
). The analysis
revealed that log Cd and log Pb increased and log Mn
decreased as a function of age. |r| was 0.118 (p \ 0.01)
for log Cr or greater. The 95% ranges for slopes did not
include zero. In cases of log Cr and log Ni, the values
decreased as age progressed, but |r| was smaller (i.e.,
0.118 for log Cr and 0.058 for log Ni) although p was
\0.01 probably due to the large number of cases
(n = 1,420).
To examine whether the observation was reproducible
on a single prefecture basis, similar analyses were con-
ducted with cases in Prefecture 6 (the bottom half in
Table
), where the number of cases per prefecture was
largest (n = 486) among the eight prefectures (Table
The increases in log Cd and log Pb with age were noted.
For log Cr and log Ni, the decreasing trends were repro-
duced but the |r|’s were not significant (p [ 0.10), partly
because less number of cases was available.
Table
4
Metal
levels
in
blood
by
prefecture
Study
area
No.
of
cases
Cd
(l
g/l)
Cr
(l
g/l)
Mn
(l
g/l)
Ni
(l
g/l)
Pb
(l
g/l)
GM
Med
a
Max
a
GM
Med
a
Max
a
n
\
LOD
(A)
b
(%)
c
GM
Med
a
Max
a
GM
Med
a
Max
a
n
\
LOD
(A)
b
(%)
GM
Med
a
Max
a
Total
1,420
1.23
1.2
6.9
0.55
0.5
41.8
399
(28.1)
13.2
13.1
33.4
1.81
1.8
75.8
37
(2.6)
15.8
15.7
105.0
Prefecture
1
100
1.37
1.3
4.8
0.50
0.5
5.8
26
(26.0)
12.2
12.0
25.0
1.73
1.6
11.4
5
(5.0)
13.8
14.6
35.4
Prefecture
2
122
1.28
1.2
6.9
0.62
0.7
13.0
33
(27.0)
12.5
12.2
33.4
1.82
1.7
14.9
3
(2.5)
15.0
15.4
57.4
Prefecture
3
209
1.42
1.4
5.3
0.94
0.9
41.8
19
(9.0)
13.4
13.3
27.5
2.37
2.4
21.8
2
(1.0)
14.7
13.9
71.6
Prefecture
4
100
1.11
1.1
3.6
0.78
0.8
5.1
12
(12.0)
13.5
13.1
29.3
1.86
1.8
75.8
4
(4.0)
14.3
14.4
38.3
Prefecture
5
106
1.38
1.4
5.5
0.41
0.4
2.2
36
(34.0)
13.4
13.1
29.6
1.40
1.5
7.4
11
(10.4)
14.2
14.8
42.8
Prefecture
6
486
1.25
1.3
5.4
0.40
0.4
11.4
203
(41.8)
13.2
13.1
32.8
1.72
1.6
22.5
5
(1.0)
18.0
17.3
105.0
Prefecture
7
4
7
1.22
1.2
3.6
0.76
0.7
5.9
3
(6.4)
14.5
14.3
27.4
1.30
1.3
6.1
4
(8.5)
13.9
13.4
36.2
Prefecture
8
250
0.98
1.0
3.1
0.60
0.6
21.3
67
(26.8)
13.2
13.2
33.1
1.93
1.9
14.3
3
(1.2)
15.9
15.9
76.5
GSDs
are
1.58–1.71
for
Cd,
1.97–2.48
for
Cr,
1.31–1.39
for
Mn,
1.75–2.00
for
Ni
and
1.42–1.60
for
Pb,
respectively
a
Med
and
Max
stand
for
median
and
the
maximum,
respectively
b
Number
of
\
LOD
(A)
cases.
[
LOD
for
all
other
cases.
For
LOD
(A),
see
the
‘‘
’’
section;
LOD
(A)
for
Cr
and
Ni
are
0.4
and
0.7
l
g/l,
respectively
144
Int Arch Occup Environ Health (2011) 84:139–150
123

Effects of smoking on metal levels in blood
Metal levels in blood were compared between 1,216 non-
smokers (i.e., never smokers and ex-smokers in combina-
tion) and 167 current smokers by ANOVA (followed by
multiple comparison by Schffe´). The analysis showed that
significant difference (p \ 0.01) was observed between the
two groups for Cd and Pb, but not for other three metals.
GMs (GSDs) for non-smokers and current smokers were
1.20 lg/l (1.70) and 1.41 lg/l (1.67) in case of Cd, and
15.6 lg/l (1.53) and 17.1 lg/l (1.48) in case of Pb,
respectively.
Further analysis by MRA taking either log Cd or log Pb
as a dependent variable and age and smoking habits (non-
smoking vs. current smoking) as independent variables
showed that both age and smoking habits were influential
(p \ 0.01 for all cases) although R
2
was small (i.e., 0.070
for log Cd and 0.120 for log Pb).
Discussion
The present analysis of 1,420 blood samples from adult
Japanese women showed that the GM concentrations in
blood were 1.23 lg/l for Cd, 0.55 lg/l for Cr, 13.2 lg/l for
Mn, 1.81 lg/l for Ni and 15.8 lg/l for Pb (Table
). Cd and
Pb increased with age as previously observed (Watanabe
et al.
,
; Moriguchi et al.
). Smoking induced
increases in Cd and Pb in blood also as previously observed
in urine (Ikeda et al.
). It was further made clear that
the ICP-SF-MS is reliable for measurements of Cd, Mn and
Pb on an individual basis, while the results of Cr and Ni are
reliable on a group basis (n C 5).
Although only two types of vacuum tubes were tested,
the phlebotomy device study (Table
) made it clear that
metal contamination would occur especially with Cr and to
a lesser extent with Mn, possibly both from needles and
from vacuum tubes including anti-coagulant reagents. With
this regard, Minoia et al. (
) compared metal concen-
trations in blood samples obtained by use of steel syringe
with that by Teflon catheter. The difference in the con-
centration (AMs in lg/l; syringe vs. catheter) was
remarkable for Cr (5.65 vs. 0.19), followed by Ni (8.8 vs.
2.3), to less extent for Mn (8.8 vs. 8.4) and minimum for
Cd (0.55 vs. 0.57) and Pb (161 vs. 159). The present
observation that contamination with Cd and Pb from the
device is practically negligible (Table
) is in agreement
with Minoia et al. (
). Takagi et al. (
) also found
Table 5
Correaltion among metals and age on the prefectural and individual basis
On prefecture basis (n = 8)
Cd
Cr
Mn
Ni
Pb
Age
On the individual basis
(n = 1,420)
Cd
–
-0.041 ns
-0.222 ns
0.042 ns
-0.280 ns
0.132 ns
Cr
0.031 ns
–
0.394 ns
0.527 ns
-0.397 ns
-0.523**
Mn
0.168**
0.050 ns
–
-0.351 ns
-0.121 ns
-0.544 ns
Ni
0.026 ns
0.501**
0.044*
–
0.177 ns
0.142 ns
Pb
0.235**
-0.038 ns
-0.063*
0.004 ns
–
0.328 ns
Age
0.226**
-0.118**
-0.183**
-0.058 ns
0.331**
–
Table 6
Effects of aging on metal level in urine in Japan as a whole and in Kyoto
Y
a
|r|
p for r
Slope
(95% range)
Evaluation
Japan as a whole (n = 1420)
log Cd
0.226
\0.01
0.005
(0.004 to 0.006)
Increasing as aged
log Cr
0.118
\0.01
-0.004
(-0.006 to -0.002)
Deceasing as aged
log Mn
0.183
\0.01
-0.002
(-0.003 to -0.002)
Deceasing as aged
log Ni
0.058
\0.01
-0.002
(-0.003 to 0.000)
Deceasing as aged
log Pb
0.331
\0.01
0.006
(0.005 to 0.007)
Increasing as aged
Kyoto (n = 486)
log Cd
0.317
\0.01
0.007
(0.005 to 0.009)
Increasing as aged
log Cr
0.059
[0.10
-0.002
(-0.005 to 0.001)
Decreasing trend
log Mn
0.175
\0.01
-0.002
(-0.003 to -0.001)
Deceasing as aged
log Ni
0.003
[0.10
0.000
(-0.002 to 0.002)
Decreasing trend
log Pb
0.375
\0.01
0.007
(0.005 to 0.008)
Increasing as aged
a
Y shows the logarithm of the metal concentration in lg/l. X shows age in years
Int Arch Occup Environ Health (2011) 84:139–150
145
123

Table
7
Cd,
Cr,
Mn,
Ni
and
Pb
levels
reported
for
adult
general
population
Reference
Metal
in
blood
(l
g/l
as
GM
a
)
Method
of
determination
b
Notes
Authors
Year
Cd
Cr
Mn
Ni
Pb
The
present
study
1.23
0.55
13.2
1.83
15.8
ICP-MS
Adult
Japanese
women
Schermaier
et
al.
0.37
c
GFAAS
Study
in
US
Micciolo
et
al.
148
c
Fl-AAS
Men
in
Italy
Nuttall
et
al.
0.71
g
11.8
g
54.3
g
ICP-MS
Bader
et
al.
7.1
g
German
population,
control
to
a
working
population
Herber
and
Christensen
The
lowest;
0.1
for
men
and
0.3
for
women:
The
highest;
1.0
for
men
and
1.1
for
women
Mostly
GFAAS
12
country
study:
The
lowest
in
Stockholm
and
the
highest
in
Brussels
(men)
and
Tokyo
(women)
Herber
\
0.8
Up
to
0.15
d
(s
e
)
U
p
to
0.63
d
(s
e
or
p
f
)
Unspecified
General
population
in
Europe;
review
(TRACY
study)
Ikeda
et
al.
2.1
GFAAS,
ICP-MS
Women
in
Japan
Rodshkin
et
al.
0.09
g
0.46
g
12
g
2.5
g
15
g
ICP-MS
Zhang
et
al.
0.61
45.8
GFAAS,
ICP-MS
Women
in
China
Zhang
et
al.
1.91
32.2
GFAAS,
ICP-MS
Women
in
Japan
Case
et
al.
0.14
g
0.65
g
ICP-MS
Apostoli
et
al.
38.5
for
men;
29.9
for
women
g
7
sites
in
Italy
Polizzi
et
al.
6.3
g
88.2
g
GFAAS
(assumedly)
Italian
population,
control
to
a
working
group
Muttamara
and
Leong
0.8
c
GFAAS
Thai
population,
men
and
women
combined
Kim
et
al.
1.9
g
3.1
g
ICP-MS
Vitayavirasuk
et
al.
40.7
g
GFAAS
Thai
population
Afridi
et
al.
4.0
g
74.9
g
1.75
g
180
g
GFAAS
Pakistani
population,
control
to
a
working
population
Ekong
et
al.
\
50
Unspecified
Review
on
disturbed
kidney
function
Al-Saleh
et
al.
0.60
g
36.6
g
GFAAS
Women
in
Saudi
Arabia
Heitland
and
Ko
¨ster
0.38
8.6
0.08
19
ICP-MS
Study
in
Germany
Clark
et
al.
21.3
ICP-MS
Non-smoking
Canadians
Coelho
et
al.
0.59
g
72.5
g
GFAAS
Protual
population,
cotrol
to
a
polluted
area
146
Int Arch Occup Environ Health (2011) 84:139–150
123

Table
7
continued
Reference
Metal
in
blood
(l
g/l
as
GM
a
)
Method
of
determination
b
Notes
Authors
Year
Cd
Cr
Mn
Ni
Pb
McKelvey
et
al.
0.77
17.9
ICP-MS
New
York
citizens
Sathwara
et
al.
29
g
Indian
population,
control
to
a
working
population
Antoniou
et
al.
0.05
ICP-MS
Control
to
surgery
patients
Bazzi
et
al.
1.1
g
8.2
g
48.3
g
ICP-MS
South
African
children
(8–10
years)
Farzin
et
al.
1.71
g
112.3
g
ICP-MS
and
GFAAS
Men
and
women
in
Tehran,
Iran,
where
leaded
gasoline
is
in
use
Gao
et
al.
0.05
(p
f
)
1.15
(p
f
)
ICP-MS
Elderly
Chinese
Jusko
et
al.
62
c
,6
5
c
GFAAS
Disturbed
IQ
among
children
in
US
Kummrow
et
al.
0.28
g
23.1
g
GFAAS
Brazilian
population
Afridi
et
al.
48.0
g
GFAAS
Pakistani
population,
control
to
a
working
population
Bulat
et
al.
\
LOD
Fl-AAS
Servian
population;
LOD,
assumedly
0.02
l
g/l
a
GM
,
geometric
mean;
AM
,
arithmetic
mean;
MED
,
median
b
GFAAS
,
graphite-furnace
atomic
absorption
spectrometry;
ICP-MS
,
Inductively
coupled
plasma
mass-spectrometry;
Fl-AAS
,
Flame
atomic
absorption
spectrometry
c
Median
d
AM
e
Serum
f
Plasma
g
GM
estimated
from
AM
and
ASD
by
the
moment
method
(Sugita
and
Tsuchiya
)
Int Arch Occup Environ Health (2011) 84:139–150
147
123

minimum contamination of blood with Pb from the device.
In case of Cr, the expected increment in Cr in blood as the
worst case (as GM 9 GSD
2
) was 0.08 (Type 1) or 0.10 lg/l
(Type 2), whereas observed Cr in blood was 0.55 lg/l as
GM (Table
). Thus about 20% increase may induced by
contamination. Similar worst case estimation for Mn (i.e.,
13.2 lg/l vs. 0.31 lg/l as observed GM in blood vs.
GM 9 GSD
2
of contamination) suggests that about 3%
increment would be expected for Mn, the rate apparently
acceptable for practical purpose. With this regard, no
information is available for the devices used for blood
collection in 2002, unfortunately. In case of 2008 collec-
tion, Type 2 and Type 1 vacuum tubes were employed in
Prefecture 1 and Prefecture 5, respectively. Thus, it may be
possible to estimate that (0.55–0.05) = 0.50 lg/l and
(0.41–0.05) = 0.36 lg/l are true average Cr concentration
in Prefecture 1 and 5, respectively.
The difficulty in ICP-MS measurement for low atomic
weight metals (including Cr and Ni) has been pointed out
by Nuttall et al. (
) as ‘not amenable’. In practice, risk
of interference was pointed out for
52
Cr and for
60
Ni in
massive presence of
40
Ar
12
C and
23
Na
37
Cl, respectively, in
the analyses of biological samples such as blood after wet
digestion (Case et al.
). Thus, the difficulty encoun-
tered in the present study may be inherent to the principle
of the analytical method and analytical conditions, as well
as matrix for analysis, and the sector field technique could
remove the problems only partly.
In Table
, results of the present analysis on metal
concentrations in blood of Japanese women were compared
with the levels reported in literatures. With regard to Cd
levels, the present GM level of 1.23 lg/l was higher than
others except for 4.0 lg/l reported by Afridi et al. (
and 1.7 lg/l by Farzin et al. (
). The high Cd levels in
blood of Japanese populations (Ikeda et al.
; Zhang
et al.
; the present study) are on line with high dietary
intake of Cd among the populations, although lower values
in the present survey when compared with the values
published in 1999 also suggest gradual decrease in the
dietary Cd intake as previously discussed (Ikeda et al.
). In contrast, Pb in blood of Japanese population,
15.8 lg/l, was substantially lower than the levels reported
for other populations, i.e., 21.3 lg/l (Clark et al.
) to
180 lg/l (Afridi et al.
), possibly in refection of low
Pb intake from both the atmospheric air through respiration
and foods via ingestion (Ikeda et al.
,
). The very
low Pb value of 1.15 lg/l (Gao et al.
) should be due
to the fact that plasma (and not whole blood) was analyzed
whereas a majority (some 95%) of Pb in blood is bound to
erythrocytes (Alessio and Foa´
It was difficult to make comparative evaluation of the
present observation on other three metals (separate from
possible problem in analytical chemistry, which was not
taken into account) because data were rather scarce on
these metals. The Cr level, 0.55 lg/l, would probably be
comparable to other values except for two extremely high
values of 74.9 lg/l by Afridi et al. (
) and 29 lg/l by
Sathwara et al. (
). The Mn level, 13.2 lg/l, may be
somewhat higher than others except for 48.0 lg/l reported
by Afridi et al. (
), and the level of Ni, 1.83 lg/l, may
probably be comparable to values reported by others
(Table
). Nevertheless, possible contamination with these
metals from phlebotomy devices should also be considered
as expressed above.
Two major limitations should be considered in evalu-
ating present results. With regard to sample collection,
selection of blood sample donors did not follow rigid
sampling strategy (such as random sampling) but by
chance, which was practically inevitable under present
survey conditions. Furthermore, not all prefectures were
studied (i.e., eight prefectures out of 47), and the number of
samples for each prefecture was not in proportion to the
size of population in each prefecture. Thus, the values
obtained may be taken as an estimate for the national
values. Technically, standard phlebotomy devices (i.e.,
vacuum tube and holder sets for clinical use) were
employed for blood sampling in Prefectures 2–4 and 6–8 in
2002, as the samples were originally for evaluation of Cd
determination and diagnosis of iron-deficiency anemia in
relation to Cd body burden (Tsukahara et al.
). Thus,
the possibility of blood contamination with Cr and Ni from
the device used (Table
, and Minoia et al.
) could not
be ruled out. With regard to samples collected in Prefec-
tures 1 and 5 in 2008, it was possible to estimate Cr and Ni
concentrations in blood excluding contamination from the
devices.
Despite such limitations, however, it is prudent to con-
clude that Cd concentrations for Japanese populations
appeared to be higher than the levels reported for other
populations, whereas Pb concentrations were lower than
others. Due to limitation in availability of information, no
meaningful comparison was possible for the levels of Cr,
Mn and Ni.
Acknowledgments
This study was supported by Grants-in-Aid
from Food Safety Commission, Japan (No. 0802; Head Investigator,
M. Ikeda), for the fiscal years of 2008 and 2009. ICP-SF-MS analyses
for metals were conducted by Inorganic Analysis Laboratories, Toray
Research Center, Inc., Ohtsu, Shiga, Japan. Thanks are due to Hiro-
saki City Medical Association (Hirosaki, Japan) and Fukui Health
Service Association (Fukui, Japan) for their cooperation in collecting
blood samples, and Kyoto University Human Specimen Bank
(Organizer; Professor A. Koizumi) for their generous supply of blood
samples. The authors are grateful to the administration and staff of
Kyoto Industrial Health Association (Kyoto, Japan) for their interest
in and support to this study.
Conflict of interest statement
The authors declare that they have
no conflict of interests.
148
Int Arch Occup Environ Health (2011) 84:139–150
123

References
Afridi HI, Kazi TG, Jamali MK, Kazi GH, Arain MB, Jalbani N, Shar
GQ, Sarfaraz A (2006) Evaluation of toxic metals in biological
samples (scalp hair, blood and urine) of steel mill workers by
electrothermal atomic absorption spectrometry. Toxicol Ind
Health 22:381–393
Afridi HI, Kazi TG, Kazi NG, Jamali MK, Arain MB, Sirajuddin
Kandhro GA, Shah AQ, Baig JA (2009) Evaluation of arsenic,
cobalt, copper and manganese in biological samples of steel mill
workers by electrothermal atomic absorption spectrometry.
Toxicol Ind Health 25:59–69
Alessio L, Foa´ V (1983) Lead. In: Alessio L, Berlin A, Roi R, Boni M
(eds) Human biological monitoring of industrial chemicals
series, vol. 1 joint research centre. Ispra Establishment, Ispra,
Italy, pp 105–132
Al-Saleh I, Shinwari N, Mashhour A, Mohamed GE, Ghosh MA,
Shammasi Z, Al-Nasser A (2006) Cadmium and mercury levels
in Saudi women and its possible relationship with hypertension.
Biol Trace Elem Res 12:13–29
Antoniou J, Zukor DJ, Mwale F, Minarik W, Petit A, Huk OL (2008)
Metal ion levels in the blood of patients after hip resurfacing: a
comparison between twenty-eight and thirty-six-millimeter-head
metal-on-metal prostheses. J Bone Joint Surg 90(Suppl. 3):142–
148
Apostoli P, Baj A, Bavazzano P, Ganzi A, Neri G, Ronchi A, Soleo L,
Di Lorenzo L, Spinelli P, Valente T, Minoia C (2002) Blood lead
reference values: the results of an Italian polycentric study. Sci
Total Environ 287:1–11
Bader M, Dietz MC, Ihrig A, Tribig G (1999) Biomonitoring of
manganese in blood, urine and axillary hair following low-dose
exposure during the manufacture of dry ell batteries. Int Arch
Occup Environ Health 72:521–527
Bazzi A, Nriagu JO, Lunder AM (2008) Determination of toxic and
essential elements in children’s blood with inductively coupled
plasma-mass spectrometry. J Environ Monit 10:1226–1232
Bulat ZP, Ðukic´-C
´ okic´ D, Dokic´ M, Bulat P, Matovic´ V (2009) Blood
and urine cadmium and bioelements profile in nickel-cadmium
battery workers in Servia. Toxicol Ind Health 25:129–135
Case CP, Ellis L, Turner JC, Fairman B (2001) Development of
routine method for the determination of trace metals in whole
blood by magnetic sector inductively coupled plasma mass
spectrometry with particular relevance to patients with total hip
and knee arthroplasty. Clin Chem 47:275–280
Clark NA, Teschke K, Rideout K, Copes R (2007) Trace element
levels in adults from the west coast of Canada and association
with age, gender, diet, activities, and levels of other trace
elements. Chemosphere 70:155–164
Coelho P, Silva S, Roma-Torres J, Costa C, Henriques A, Teixeira J,
Gomes M, Mayan O (2007) Health impact of living near an
abandoned mine—case study: Jales mines. Int J Hyg Environ
Health 210:399–402
Ekong EB, Jaar BG, Weaver VM (2006) Lead-related nephrotoxicity:
a review of the epidemiologic evidence. Kidney Int 70:2074–
2084
Farzin L, Amiri M, Shams H, Faghih MAA, Moassesi ME (2008)
Blood levels of lead, cadmium, and mercury in residents of
Tehran. Biol Trace Elem Res 123:14–26
Gao S, Jin Y, Unverzagt FW, Ma F, Hall KS, Murrell JR, Cheng Y,
Shen J, Ying B, Ji R, Matesan J, Liang C, Hendrie HC (2008)
Trace element levels and cognitive function in rural elderly
Chinese. J Gerontol 63A:635–641
Heitland P, Ko¨ster HD (2006) Biomonitoring of 37 trace elements in
blood samples from inhabitants of northern Germany by ICP-MS.
J Trace Elem Med Biol 20:253–262
Herber RF (1999) Review of trace element concentrations in
biological specimens according to the TRACY protocol. Int
Arch Occup Environ Health 72:279–283
Herber RFM, Christensen JM (1997) Critical evaluation and review
of cadmium concentrations in blood for use in occupational
health according to the TRACY protocol. Int Arch Occup
Environ Health 69:372–378
Ikeda M, Zhang Z-W, Higashikawa K, Watanabe T, Shimbo S, Moon
C-S, Nakatsuka H, Matsuda-Inoguchi N (1999) Background
exposure of general women populations in Japan to cadmium in
the environment and possible health effects. Toxicol Lett
108:161–166
Ikeda M, Zhang Z-W, Shimbo S, Watanabe T, Nakatsuka H, Moon C-S,
Matsuda-Inoguchi N, Higashikawa K (2000a) Urban population
exposure to lead and cadmium in east and south-east Asia. Sci
Total Environ 249:373–384
Ikeda M, Zhang Z-W, Shimbo S, Watanabe T, Nakatsuka H, Moon C-S,
Matsuda-Inoguchi N, Higashikawa K (2000b) Exposure of women
in general populations to lead via food and air in east and southeast
Asia. Am J Ind Med 38:271–280
Ikeda M, Ezaki T, Tsukahara T, Moriguchi J (2004) Dietary cadmium
intake in polluted and non-polluted areas in Japan in the past and
in the present. Int Arch Occup Environ Health 77:227–234
Ikeda M, Moriguchi J, Ezaki T, Fukui Y, Ukai H, Okamoto S, Shimbo
S, Sakurai H (2005) Smoking-induced increase in urinary
cadmium levels among Japanese women. Int Arch Occup
Environ Health 78:533–540
Jusko TA, Henderson CR, Lanphear BP, Cory-Stechta DA, Parsons
PJ, Canfield RL (2008) Blood lead concentrations \ 10 lg/dl
and child intelligence at 6 years of age. Environ Health Perspect
116:243–278
Kim Y-J, Kassab F, Berven SH, Zurakowski D, Hresko MT, Emans
JB, Kasser JR (2005) Serum levels of nickel and chromium
after instrumented posterior spinal arthrodesis. Spine 30:923–
926
Kummrow F, Silva FF, Kuno R, Souza AL, Oliveira PV (2008)
Biomonitoring method for the simultaneous determination of
cadmium and lead in whole blood by electrothermal atomic
absorption spectrometry for assessment of environmental expo-
sure. Talanta 75:246–252
McKelvey W, Gwynn C, Jeffery N, Kass D, Thorpe LE, Garg RK,
Palmer CD, Parsons P (2007) A biomonitoring study of lead,
cadmium, and mercury in the blood of New York city adults.
Environ Health Perspect 115:1435–1441
Micciolo R, Canal L, Maranelli G, Apostoli P (1994) Non-occupa-
tional lead exposure and hypertension in northern Italy. Int J
Epidemiol 23:312–320
Mikeev MI (ed) (1996a) Biological monitoring of chemical exposure
in the workplace, vol 1. World Health Organization, Geneva
Mikeev MI (ed) (1996b) Biological monitoring of chemical exposure
in the workplace, vol 2. World Health Organization, Geneva
Minoia C, Pietra R, Sabbioni E, Ronchi A, Gatti A, Cavalleri A,
Manzo L (1992) Trace element reference values in tissues from
inhabitants of European Community. III. The control of pre
analytical factors in the biomonitoring of trace elements in
biological fluids. Sci Total Environ 120:63–79
Mizushima R, Yonezawa M, Ejima A, Koyama H, Satoh H (1996)
Microwave digestion using dual PTFE containers for analysis of
trace elements in small amounts of biological samples. Tohoku J
Exp Med 178:75–79
Moriguchi J, Ezaki T, Tsukahara T, Fukui Y, Ukai H, Okamoto S,
Shimbo S, Sakurai H, Ikeda M (2005) Effects of aging on
cadmium and tubular dysfunction markers in urine from adult
women in non-polluted areas. Int Arch Occup Environ Health
78:446–451
Int Arch Occup Environ Health (2011) 84:139–150
149
123

Muttamara S, Leong ST (2004) Health implication among occupa-
tional exposed workers in a chromium alloy factory, Thailand.
J Environ Sci 16:181–186
Nuttall KL, Gordon WH, Ash KO (1995) Inductively coupled plasma
mass spectrometry for trace element analysis in the clinical
laboratory. Ann Clin Lab Sci 25:264–271
Polizzi S, Pira E, Ferrara M, Bugiani M, Papaleo A, Albera R, Palmi S
(2002) Neurotoxic effects of aluminium among foundry workers
and Alzheimer’s disease. NeuroToxicology 23:761–774
Rodushkin I, O
¨ dman F, Branth S (1999) Multielement analysis of
whole blood by high resolution inductively coupled plasma mass
spectrometry. Fresenius J Anal Chem 364:338–346
Sathwara NG, Patel KG, Vyas JB, Patel S, Trivedi MR, Dave LM,
Madia MM, Kulkarni PK, Parikh DJ, Saiyed HN (2007)
Chromium exposure study in chemical based industry. J Environ
Biol 28:405–408
Schermaier AJ, O’Conner LH, Pearson KH (1985) Semi-automated
determination of chromium in whole blood and serum by
Zeeman electrothermal atomic absorption spectrophotometry.
Clin Chim Acta 152:123–134
Schramel S, Wendler I, Angerer J (1997) The determination of metals
(antimony, bismuth, lead, cadmium, mercury, palladium, plati-
num, tellurium, thallium, tin and tungsten) in urine samples by
inductively coupled plasma-mass spectrometry. Int Arch Occup
Environ Health 69:219–223
Sugita M, Tsuchiya K (1995) Estimation of variation among
individuals of biological half-times of cadmium calculated from
accumulation data. Environ Res 68:31–37
Takagi M, Tamiya S, Yoshinaga J, Kaji M (2009) Lead in blood of
Japanese children; analytical conditions. Jpn J Hyg 64:403 (in
Japanese)
Tsukahara T, Ezaki T, Moriguchi J, Furuki K, Fukui Y, Ukai H,
Okamoto S, Sakurai H, Ikeda M (2003) No significant effect of
iron deficiency on cadmium body burden or kidney dysfunction
among women in the general population in Japan. Int Arch
Occup Environ Health 76:275–281
Vitayavirasuk B, Junhom S, Tantisaeranee P (2005) Exposure to lead,
cadmium and chromium among spray painters in automobile
body repair shops. J Occup Health 47:518–522
Watanabe T, Koizumi A, Fujita H, Kumai M, Ikeda M (1983)
Cadmium levels in the blood of inhabitants in nonpolluted areas
in Japan with special references to aging and smoking. Environ
Res 31:472–483
Watanabe T, Fujita H, Koizumi A, Chiba K, Miyasaka M, Ikeda M
(1985) Baseline level of blood lead concentration among
Japanese farmers. Arch Environ Health 40:170–176
White MA (1999) A comparison of inductively coupled plasma mass
spectrometry with electrothermal atomic absorption spectrome-
try for determination of trace elements in blood and urine from
non occupationally exposed populations. J Trace Elements Med
Biol 13:93–101
Zhang Z-W, Shimbo S, Ochi N, Eguchi M, Watanabe T, Moon C-S,
Ikeda M (1997) Determination of lead and cadmium in food and
blood by inductively coupled plasma mass spectrometry: a
comparison with graphite furnace atomic absorption spectrom-
etry. Sci Total Environ 205:179–187
Zhang Z-W, Qu J-B, Watanabe T, Shimbo S, Moon C-S, Ikeda M
(1999) Exposure of citizens in China and in Japan to lead and
cadmium; a comparative study. Toxicol Lett 108:167–172
150
Int Arch Occup Environ Health (2011) 84:139–150
123
Document Outline
- Cadmium, chromium, lead, manganese and nickel concentrations in blood of women in non-polluted areas in Japan, as determined by inductively coupled plasma-sector field-mass spectrometry
Wyszukiwarka
Podobne podstrony:
Glądalski, Michał Patterns of year to year variation in haemoglobin and glucose concentrations in t
wearing ideology state schooling and self presentation in japan
Glińska, Sława i inni The effect of EDTA and EDDS on lead uptake and localization in hydroponically
2005 Diet and Age Affect Intestinal Morphology and Large Bowel Fermentative End Product Concentratio
Childhood lead exposure in France benefit estimation and partial cost benefit analysis of lead hazar
Cadmium and Other Metal Levels in Autopsy Samplesfrom a Cadmium Polluted Area and Non polluted Contr
Biochemical Effects of Lead Exposure on Systolic & Diastolic Blood Pressure, Heme Biosynthesis and H
Functional Origins of Religious Concepts Ontological and Strategic Selection in Evolved Minds
Maternal Bone Lead Contribution to Blood Lead during and after Pregnancy
2008 4 JUL Emerging and Reemerging Viruses in Dogs and Cats
Angielski tematy Performance appraisal and its role in business 1
Half Life and?ath Radioactive Drinking Water Scare in Japan Subsides but Questions Remain (3)
Kissoudi P Sport, Politics and International Relations in Twentieth Century
Greenshit go home Greenpeace, Greenland and green colonialism in the Arctic
Ionic liquids as solvents for polymerization processes Progress and challenges Progress in Polymer
Civil Society and Political Theory in the Work of Luhmann
RATIONALITY AND SITUATIONAL LOGIC IN POPPER
więcej podobnych podstron