
S.A.P.I.EN.S
2.2 (2009)
Vol.2 / n°2 Special issue
................................................................................................................................................................................................................................................................................................
Matthieu Ghilardi and Stéphane Desruelles
Geoarchaeology: where human,
social and earth sciences meet with
technology
................................................................................................................................................................................................................................................................................................
Warning
The contents of this site is subject to the French law on intellectual property and is the exclusive property of the
publisher.
The works on this site can be accessed and reproduced on paper or digital media, provided that they are strictly used
for personal, scientific or educational purposes excluding any commercial exploitation. Reproduction must necessarily
mention the editor, the journal name, the author and the document reference.
Any other reproduction is strictly forbidden without permission of the publisher, except in cases provided by legislation
in force in France.
Revues.org is a platform for journals in the humanites and social sciences run by the CLEO, Centre for open electronic
publishing (CNRS, EHESS, UP, UAPV).
................................................................................................................................................................................................................................................................................................
Electronic reference
Matthieu Ghilardi and Stéphane Desruelles, « Geoarchaeology: where human, social and earth sciences meet with
technology », S.A.P.I.EN.S [Online], 2.2 | 2009, Online since 20 December 2008, Connection on 16 October 2012.
URL : http://sapiens.revues.org/422
Publisher: Institut Veolia Environnement
http://sapiens.revues.org
http://www.revues.org
Document available online on: http://sapiens.revues.org/422
This document is a facsimile of the print edition.
Licence Creative Commons

1
’
Geoarchaeology: where human,
social and earth sciences meet
with technology
Matthieu Ghilardi
1
, Stéphane Desruelles
2
1. Centre Franco-Egyptien d’Etude des Temples de Karnak (CFEETK), USR 3172, C.N.R.S.
matthieughilardi@orange.fr
2. J.E. 2532 Dynamiques des systèmes anthropisés, Université de Picardie — Jules Verne, Amiens, France,
stephane_desruelles@yahoo.fr
Over the last decades, archaeologists and historians have faced the necessity to reconstruct ancient
settlement history not only through the study of the material excavated, but also with the use of
palaeo-environmental parameters. Geoarchaeology is a recent field of research that uses the
computer cartography, the Geographic Information System (GIS) and the Digital Elevation Models
(D.E.M.) in combination with disciplines from Human and Social Sciences and Earth Sciences.
Satellite images, high resolution topographic surveys (Shuttle Radar Topography Mission data) and
palaeo-environmental results are used to establish accurate topographic maps, palaeogeographic
reconstructions and three dimensional views of the landscape, contemporaneous to the ancient site
of interest. GIS is used to manage the important amount of data widely dispatched both in space and
in time. This paper describes several powerful methods to infer the evolution of landscapes in the
context of such multi-disciplinary/geoarchaeological programmes. The potential of Geoarchaeology
is illustrated by three case-studies in Albania and Greece, where the neighbourhood of ancient
settlements from the Holocene (the last 10000 years) have been reconstructed into virtual landscape.
These geoarchaeological studies offer now an unprecedented level of integration between disciplines
to visualize a shoreline and its displacement. Over the last 20 000 years, humans had to constantly
adapt their lifestyles according to the displacement of the shoreline. Given the current threats and
uncertainties related to climate change, it is predictable and desirable that many disciplines will
adopt similar integrated approach to model their favourite object of research.
Keywords:
Digital elevation model, geoarchaeology, geographic information
systems, geomorphology, Albania, Greece, projection systems, topographic data
TABLE OF CONTENTS
1. Introduction
2. Methods of Geoarchaeology
2.1. Computer cartography and Computer-Aided Drafting (C.A.D.) for within-site
archaeological studies
2.2. Geographic Information Systems (GIS) and Digital Elevation Models (D.E.M.)
as important tools for management of geoarchaeological studies
2.2.1. Georeferencing process of the cartographical database
2.2.2. Derivation of the D.E.M.
2.2.2.1. Digitalization of contour lines
2.2.2.2. Bathymetric surveys
2.2.2.3. Integration of S.R.T.M. data
2.2.2.4. 3D topography using D.G.P.S. surveys
2.2.3. Environmental, palaeo-environmental and archaeological informations integration
3. Three case studies from Albania and Greece
3.1. Holocene palaeogeographical reconstructions and predictive models of archaeological
site location
3.2. Second case study: geoarchaeological studies of high resolution altimetric map
for a deltaic area
3.3. Third case study: Potential location of an ancient harbour
4. Conclusion
VO
LU
M
E
1
ISSU
E
2
20
0
8
A
b
st
ra
ct
’
http://sapiens.revues.org/index422.html
Received: 2 July 2008 – Revised: 25 October 2008 – Accepted: 10 December 2008 – Published: 20 December 2008.
Edited by: Sébastien Gadal – Reviewed by two anonymous referees.
© Author(s) 2008. This article is distributed under the Creative Commons Attribution 3.0 License.
Analysis
S
.
A
.
P
.
I
.
EN
.
S

1 Abbreviations and acronyms used in the article are listed in Annex 1.
M
ATTHIEU
G
HILARDI ET AL
G
EOARCHAEOLOGY
:
WHERE HUMAN
,
SOCIAL AND EARTH SCIENCES MEET WITH TECHNOLOGY
2
1. INTRODUCTION
Geoarchaeology is a multi-proxy approach where geographical and
geoscientific concepts and methods are applied to Prehistory,
Archaeology and History (Rapp and Hill, 1998).
Geoarchaeology consists in using methods and concepts of the
Earth Sciences for archaeological research purposes. However, to
elucidate environmental contextual issues, geoarchaeologists
must be more than casual practitioners of applied science (Butzer,
1982; Fouache, 2006; Fouache and Rasse, 2007). Indeed, if
archaeological excavation emerged in the 18
th
Century with a
systematic analysis of the material excavated—notably in
Herculaneum (Italy)—, stratigraphic excavation that applied
environmental evolution data for the first time ever did not become
established until the end of the 19
th
Century. Finally, to better
understand environmental changes, particularly throughout the
historical period, geomorphological research became an essential
preliminary to the study of all archaeological sites in the 1980s.
The Geographic Information System (GIS)
1
is a digital support
capable of integrating, storing, editing, analyzing, sharing, and
displaying geographically referenced information (Marble
et al.,
1984). GIS is well adapted to share all the information provided by
different disciplines from Human and Social Sciences and from
Earth Sciences. In an extended sense, GIS is a tool that allows
users to create interactive queries, analyze the spatial
information, edit data, create maps and present the results of all
these operations for archaeological and geoarchaeological
studies (Kvamme, 1999; Fletcher, 2008). This development took
place in the 1970s when several methods became available:
computer cartography and Computer-Aided Drafting, the linking
of computer-drawn maps with relational databases, quantitative
spatial analyses and their mapped by-products, views and uses of
three-dimensional terrain models (Digital Elevation Models),
remote sensing and image processing applications in regional
simulation and modeling exercises (Kvamme, 1999). Nowadays—
far from being limited to produce aesthetically pleasing
cartographic material—GIS plays an important key role in
archaeology and enables dynamic viewing of morphological
activity. This paper presents the methods and the results derived
from several case studies from Albania (Korça Basin) and Greece
(ancient Methoni harbour and Thessaloniki Plain) during the
Holocene—the last 10000 years (Ghilardi, 2006; 2007).
2. METHODS OF GEOARCHAEOLOGY
2.1. COMPUTER CARTOGRAPHY AND COMPUTER-AIDED
DRAFTING (C.A.D.) FOR WITHIN-SITE ARCHAEOLOGICAL STUDIES
Until the 1990s, archaeological studies were essentially based on two-
dimensional (2D) cartographic representation developed on a local (
in
situ) scale (from 0.1 to 10 km
2
). Computer cartography and computer-
aided drafting helped to make within-site geoarchaeological studies,
a rather limited technique compared to GIS. For example, vector
outlines showing the locations of walls, pits, middens, ditches, post
holes, etc., are generally colour coded by feature type, cultural
affiliation or temporal period: various artefact distributions were
similarly portrayed (Kvamme, 1999). Using C.A.D., ground
observations, chart interpretations (topography, geology, etc.) aerial
photographs and satellite image treatments can all be combined into
environmental maps (geomorphological and vegetation maps,
pedological charts, etc.). Until recently, different layers corresponding
to points, lines, and polygons were created using
Adobe Illustrator©
software. This method lacked the possibility to associate graphic
elements with geographic coordinates and to access dynamic
geodatabases. These limitations are now addressed using GIS.
2.2. GEOGRAPHIC INFORMATION SYSTEMS (GIS) AND DIGITAL
ELEVATION MODELS (D.E.M.) AS IMPORTANT TOOLS FOR
MANAGEMENT OF GEOARCHAEOLOGICAL STUDIES
The use of the GIS in archaeology is essential:
At the site level (from 0.1 to 10 km
2
), extensive data about
excavation and surface mappings of artifacts, topography and
other features are collected. It is necessary to efficiently manage
these data and address fundamental research and spatial
analysis questions (Kvamme, 1999). Three-dimensional GIS
allows deposits, features, and artifacts to be visualized in their
proper 3D contexts (Katsianis
et al., 2008). A volume may be
rotated, sliced, diced, or “exploded” to yield virtually any possible
view of internal relationships. These systems allow better
understanding of complex deposits and greatly help in the
interpretation of intrasite spatial relationships, site structure, and
formation processes (Kvamme, 1999).
At the regional scale (areas of more than 10 km
2
), GIS is frequently
used to analyse the spatial distribution of settlements using
statistical methods (Kvamme, 1999; Anschuetz
et al., 2001).
Archaeological predictive modelling—one of the earliest applications
made possible by GIS—continues to grow in importance as a tool for
cultural resource management and planning (Kvamme, 1999; Fry
et
al., 2004). GIS can support other information derived from:
• 3D modelling of present and past environments (relief,
hydrology, shorelines, vegetation cover, etc.) and of their
evolution.
• the cross comparison of environmental, palaeo
-
environmental and archaeological data. For example, GIS
can be used to quantify changes in water volume of ancient
reservoirs caused by the rise or fall of the water level
(Desruelles and Cosandey, 2005).
To create the GIS, various data sources are used, integrated with
the main steps presented below.
2.2.1. GEOREFERENCING PROCESS OF THE CARTOGRAPHICAL
DATABASE
The georeferencing phase of a cartographical study can be
difficult in countries that do not use a single cartographic
M
ATTHIEU
G
HILARDI ET AL
G
EOARCHAEOLOGY
:
WHERE HUMAN
,
SOCIAL AND EARTH SCIENCES MEET WITH TECHNOLOGY
S
.
A
.
P
.
I
.
EN
.
S
3
2 Hatt, Transverse Mercator 3 degrees, Hellenic Geodetic Reference System (H.G.R.S.) 87 and U.T.M. European Datum (E.D.) 50 (Mugnier, 2002; Ghilardi, 2006).
projection system to serve as a unique referential. In Greece for
example, four systems are in use since the beginning of the 20
th
Century
2
that can not be converted into each other. Polynomial
equation (Ghilardi, 2006) and/or freeware (software) can help
significantly to convert geographic coordinates. It is now crucial to
use a single international reference for GIS such as the World
Geodetic System (W.G.S.) 84 cartographic projection.
2.2.2. DERIVATION OF THE D.E.M.
The common definition of a D.E.M. can be presented as follows: a
Digital Elevation Model is the digital image of altitudes for a
topographical surface set in a geographical marker and a 3D
representation of the territory without vegetation or buildings
(Hubert, 2001; Ghilardi, 2006). Two methods of D.E.M are in usage
depending on the community: the first employs the digitalisation
of points on contour lines in order to create a Triangular Irregular
Network (T.I.N.) type D.E.M.: points make up the mesh of the
digital elevation modelling in which all the points are linked
together by lines forming flat triangles that never intersect.
These triangles are contiguous by their sides and form a
continuous surface in space (Hubert, 2001). Raster
D.E.M. has a lower quality of representation but file
created by the GIS—which uses mass points and
provides a smooth view in 2D—is smaller.
The topographic data for the derivation of the D.E.M.
can be obtained from several sources: contour
lines (reported on maps), S.O.N.A.R. records,
S.R.T.M. (Shuttle Radar Topography Mission) data
and D.G.P.S. (Differential Global Positioning
System) surveys:
2.2.2.1. DIGITALIZATION OF CONTOUR LINES
The georeferenced topographic maps have often
the major drawback of presenting an
“artificialised” topography due to the numerous
anthropogenic installations (construction of roads,
railway tracks). Such installations usually imply
the excavation of materials in very high quantity
and/or the accumulation of the excavated
materials over significant thickness to produce
more rectilinear layouts and milder gradients in
favour of establishing communication routes.
Before GIS, contour lines on topographic maps
were digitalized using lines. Today, GIS contour
lines are deduced from a grid of points that gives
a much better modelling of the landscape
(Ghilardi, 2006). To create more realistic palaeo-
topographic reconstructions throughout the
different periods of the site's occupation, the
contour lines must be re-interpreted manually in
the GIS whilst ensuring that the overall aspect of
map contour lines is respected as much as
possible (Ghilardi, 2006; Ghilardi
et al., 2007).
2.2.2.2. BATHYMETRIC SURVEYS
In addition to terrestrial data, it is appropriate to complete the
D.E.M. in marine environment to produce an overall
topographical view of the concerned areas, both above and below
sea level. Bathymetric data provide particularly precious
information concerning the topography of the seabed in areas
recently affected by the last post-glacial sea-level rise.
Bathymetric points, produced using S.O.N.A.R. technique, can be
included to the GIS and added to the D.E.M. (Ghilardi, 2006). In
addition, L.I.D.A.R. technique is currently employed in the
framework of shallow bathymetric surveys (Li, 2005).
Photogrammetry and L.I.D.A.R. data complement each other:
photogrammetry is more accurate in the x and y direction while
L.I.D.A.R. is more accurate in the z direction.
2.2.2.3. INTEGRATION OF S.R.T.M. DATA.
Conventional topographic mapping technologies have
produced maps of uneven quality—some with astounding
accuracy, some far less adequate. Most industrial countries
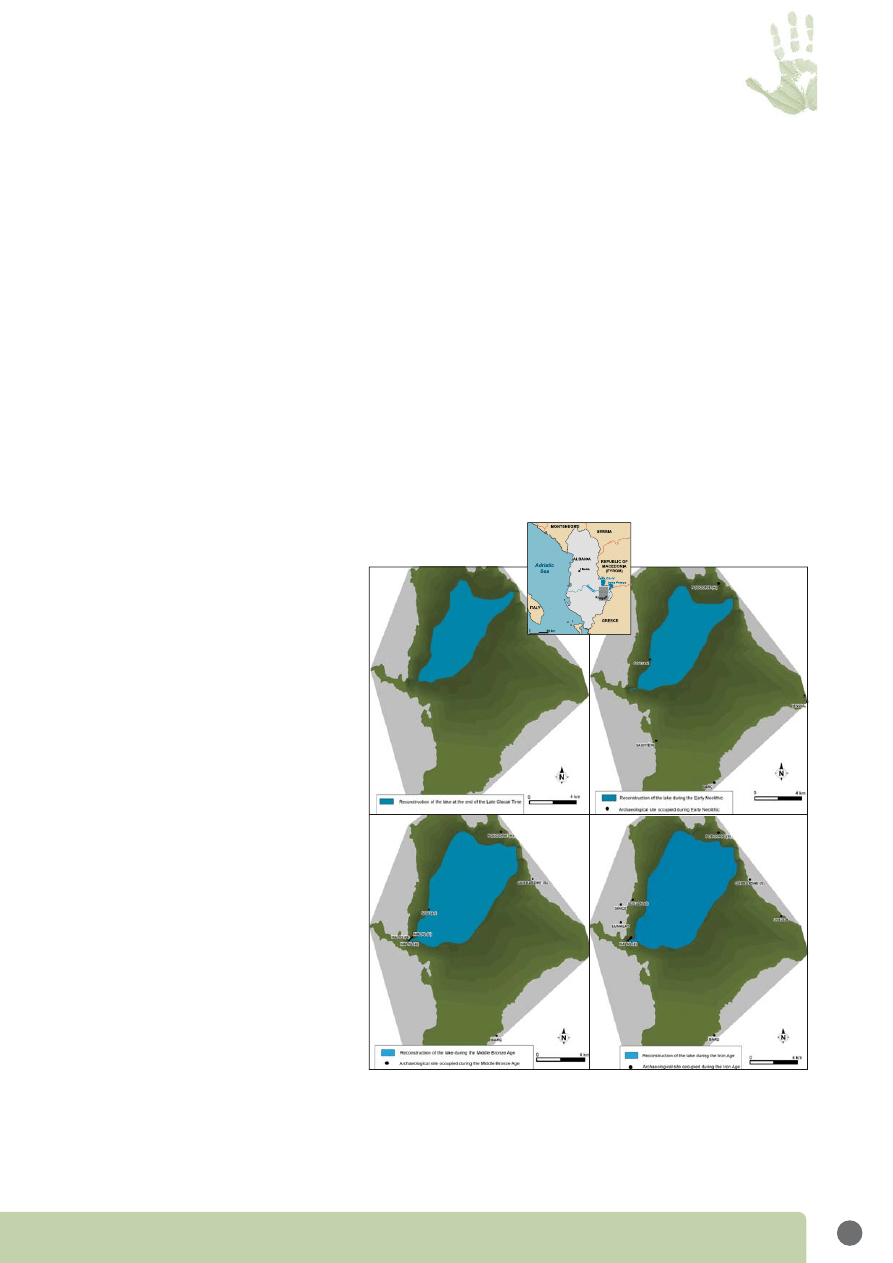
FIGURE 1: Four palaeogeographical reconstructions of palaeo-lake Maliq. a: Last Glacial
Times; b: Early Neolithic; c: Middle Bronze Age; d: Roman Times. The four lake dwelling
sites (Sovjan, Maliq A, Maliq B and Maliq C) discovered by the archaeological team are on
the nearby reconstructed lake shores.
3 The thickness of post-Neolithic sediments (peat deposits at the location of present dried up lake and colluvial deposits at the foot of the hill slopes) was determined by geomorphological
observation in the whole basin.
The geometry of the palaeo-lake Maliq was reconstructed using unpublished data from the Geological Institute in Korça (101 logs obtained in 1974 by core-drilling, E/W and N/S profiles)
A 150m long core transect from the archaeological site to the lake basin was drilled in 2005. Lithostratigraphy description, palynological analyses and A.M.S.
14
C datings from cores
were used to characterize the sedimentary deposits of Lake Maliq and infer palaeo-environmental changes.
M
ATTHIEU
G
HILARDI ET AL
G
EOARCHAEOLOGY
:
WHERE HUMAN
,
SOCIAL AND EARTH SCIENCES MEET WITH TECHNOLOGY
4
maintain national cartographic databases. The map products
derived from these databases vary greatly in scale and
resolution, and are often referenced with country-specific data
and are thus inconsistent across national boundaries. The
Shuttle Radar Topography Mission produced elevation data on a
near-global scale and generated the most complete high-
resolution digital topographic database of Earth (Farr, 2007;
Rabus
et al., 2003). The new S.R.T.M. D.E.Ms. have probably had
the largest impact on studies of regions in the developing world
for which reliable, high-resolution digital topography was not
previously available. With relatively few exceptions, a nearly
complete topographic coverage is now available for most of the
nonpolar world and provides a foundation for a new analysis of
diverse landscapes (Farr
et al., 2007).
2.2.2.4. 3D TOPOGRAPHY USING D.G.P.S. SURVEYS
G.P.S. is an excellent data collection tool for creating and
maintaining a GIS. It provides accurate positions for point, line, and
polygon features. By verifying the location of previously recorded
sites, G.P.S. can be used for inspecting, maintaining and updating
GIS data. G.P.S. provides a tool for validating features, updating
attributes and collecting new features. Differential correction
techniques are used to enhance the quality of location data
gathered using G.P.S. receivers. The underlying premise of
D.G.P.S. is that any two receivers that are relatively close together
will experience similar atmospheric errors.
2.2.3. ENVIRONMENTAL, PALAEO-ENVIRONMENTAL AND
ARCHAEOLOGICAL INFORMATIONS INTEGRATION
The different shapes (points, lines, polygons) are georeferenced
and connected with databases. Regarding the present and the
past environments, stratigraphic, sedimentological, palynological
and/or chronological (
14
C datings) information can be collected.
The archaeological databases can integrate information
concerning the architecture, the function and the dating of
buildings constituting the archaeological sites. The cross-
comparison of these informations into the GIS allows palaeo-
landscapes (hydrology and vegetation, in particular) and palaeo-
topographies reconstruction.
3. THREE CASE STUDIES
FROM ALBANIA AND GREECE
3.1. HOLOCENE PALAEOGEOGRAPHICAL RECONSTRUCTIONS
AND PREDICTIVE MODELS OF ARCHAEOLOGICAL SITE LOCATION
The Korça Basin, located in southern Albania, is a plain at 818 m
surrounded by high mountain ranges which culminate at 2028 m.
The nortwestern part of this basin was occupied by Maliq Lake until
drainage works in the 1950s. Probably due to climatic variability
and, since the second half of the Holocene, to anthropogenic forest
clearances in the catchment area (Bordon
et al., in press), the
surface of the palaeo-lake varied between a minimum of 40 km
2
during periods of low level to a maximum of 80 km
2
(Fouache
et al.,
2001). From the Early Neolithic period (around 9000 B.P.) to the
Early Iron Age (2300 B.P.), and especially during the Middle Bronze
Age (around 4500 B.P.), the nearby lake shore was occupied by
several settlements like Maliq (Prendi, 1966) or Sovjan (Touchais
et
al., 2005). These settlements were studied by a French-Albanian
archaeological team to elaborate a model of human implantation
around the palaeo-lake Maliq. To perform surveys,
palaeogeographical reconstructions of the palaeo-lake were
established using GIS and D.E.M. taking into account
archaeological, geological and new palaeo-environmental data
3
.
Then, geological, palaeo-environmental and archaeological
records have been included to a GIS and connected to the S.R.T.M.
topographic data controlled with D.G.P.S. measurements. Figure 1
presents a 3D modelling of four stages of palaeogeographic
reconstruction of the Maliq Lake along the Holocene period.
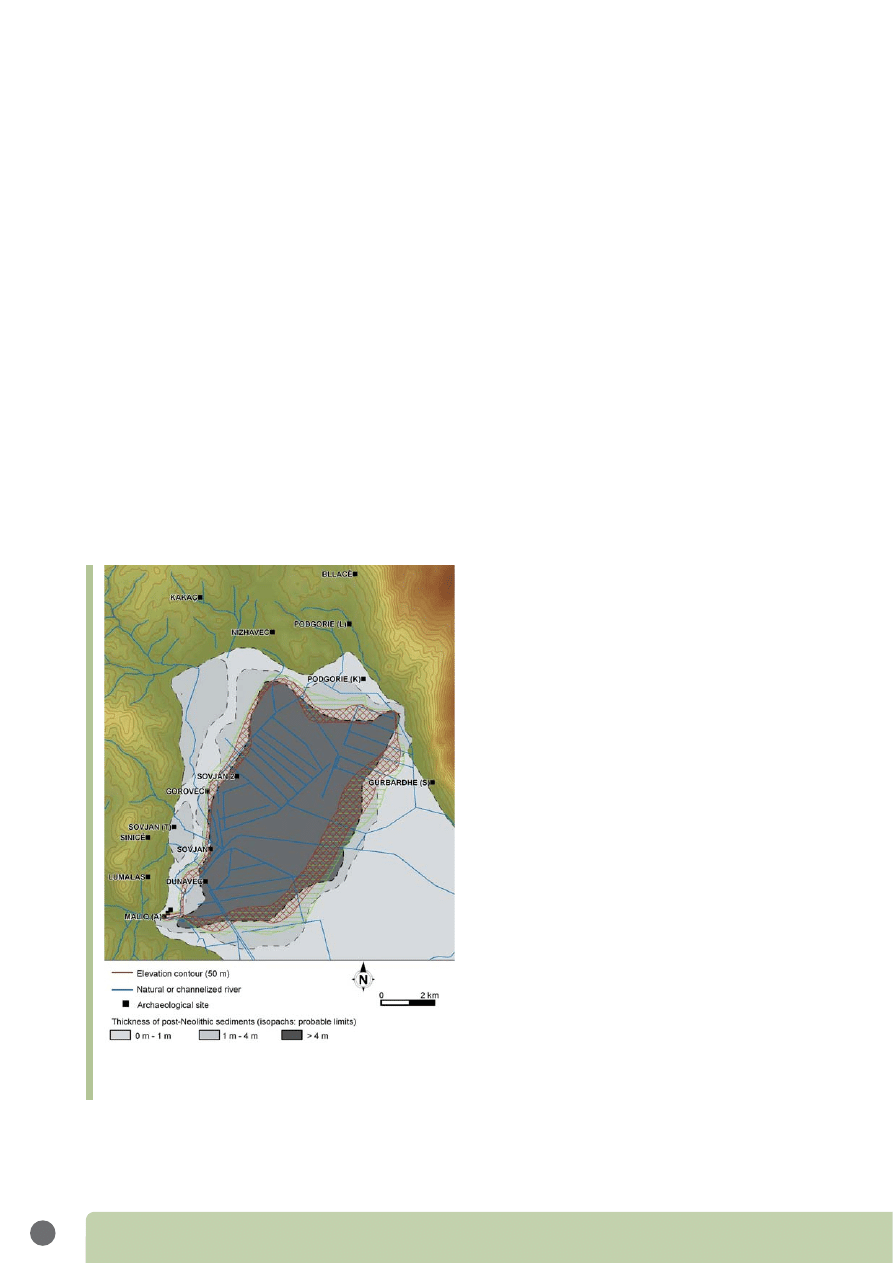
The reconstruction of the extension of the palaeo-lake during high
levels, together with the knowledge of the thickness of the sediment
(accumulation of colluvial deposits) covering settlements allowed
us to design a predictive map of the potential archaeological layers
for the Neolithic, the Bronze Age and the Iron Age (Fig. 2). Since the
FIGURE 2: Predictive map for surface archaeological surveys of
the Korça Basin and thickness of post-Neolithic sediments. The
thickness of sediments covering archaeological layers is inferred
from boreholes studies.
M
ATTHIEU
G
HILARDI ET AL
G
EOARCHAEOLOGY
:
WHERE HUMAN
,
SOCIAL AND EARTH SCIENCES MEET WITH TECHNOLOGY
S
.
A
.
P
.
I
.
EN
.
S
5
lake level rised between the Neolithic and the Iron Age, the increase
of the extension was taken into account to determine potential
areas where sites could be fossilized. The preliminary results of the
prospecting carried out in August 2007 confirmed the predictive
map: lacustrine sites were actually found in the areas designated by
the GIS-based predictions.
3.2. SECOND CASE STUDY:
GEOARCHAEOLOGICAL STUDIES OF HIGH RESOLUTION
ALTIMETRIC MAP FOR A DELTAIC AREA
The Thessaloniki Plain is the largest deltaic complex in Greece,
covering an area of approximately 2000 km² (Fig. 3). This vast
deltaic complex presents a flat relief-topography and originates
mainly from the coalescence of alluvial deposits from Aliakmon
and Axios Rivers, over the past 6000 years (Ghilardi, 2007; Ghilardi
et al., 2008a; 2008b). The palaeo-environmental study allowed
reconstructing the landscape evolution for six millennia (Ghilardi,
2007). Based on chronostratigraphic sequence (
14
C A.M.S. datings
performed on marine shells and peat episodes), derived from
borehole analysis, this important work for the area highlighted the
rapid infilling of a shallow bay from the Neolithic period. Up to a
maximum depth of 11 meters, eight boreholes recorded deltaic
sediments, ranging from marine environment (the lower part) to
lagoonal deposition (the middle part) and finally to fluvial deposits
(upper part); the microfaunal helped in differentiating the different
environmental conditions. Subsequently, sedimentological
analysis helped in classifying the grain-size distribution (clays,
silts, sands, coarse sands) and in identifying the contribution of
the different drainage-basins. The rather flat appearance of
deltaic areas does not reflect a lack of morphological processes.
The three-dimensional display of minor relief forms (deltaic lobes,
debris flow, alluvial fans…) often transpires to be difficult to
implement due to the inaccuracy of available cartographic
documents and also due to the fact that research scales are often
oversized (Ghilardi, 2006). The different landforms (former levees,
alluvial fans, etc.) are identified on satellite image as false colour
composite objects. To obtain altimetric information, high-
resolution topographic data derived from S.R.T.M. surveys are
added in a GIS and superimposed on the satellite imagery.
Subsequently, topographic information is linked to the palaeo-
environmental results derived from borehole stratigraphy. This
combination allows a spatial interpretation and a palaeo
-
geographic reconstruction of the whole area, including location of
settlements (see Fig. 4 for a palaeogeographic reconstruction over
the last 6000 years).
3.3. THIRD CASE STUDY: POTENTIAL LOCATION
OF AN ANCIENT HARBOUR
The ancient settlement of Methoni was an important harbour closely
affiliated with the Athenian Alliance (5
th
Century B.C.). According to
historical manuscripts, the urban settlement was distant from the
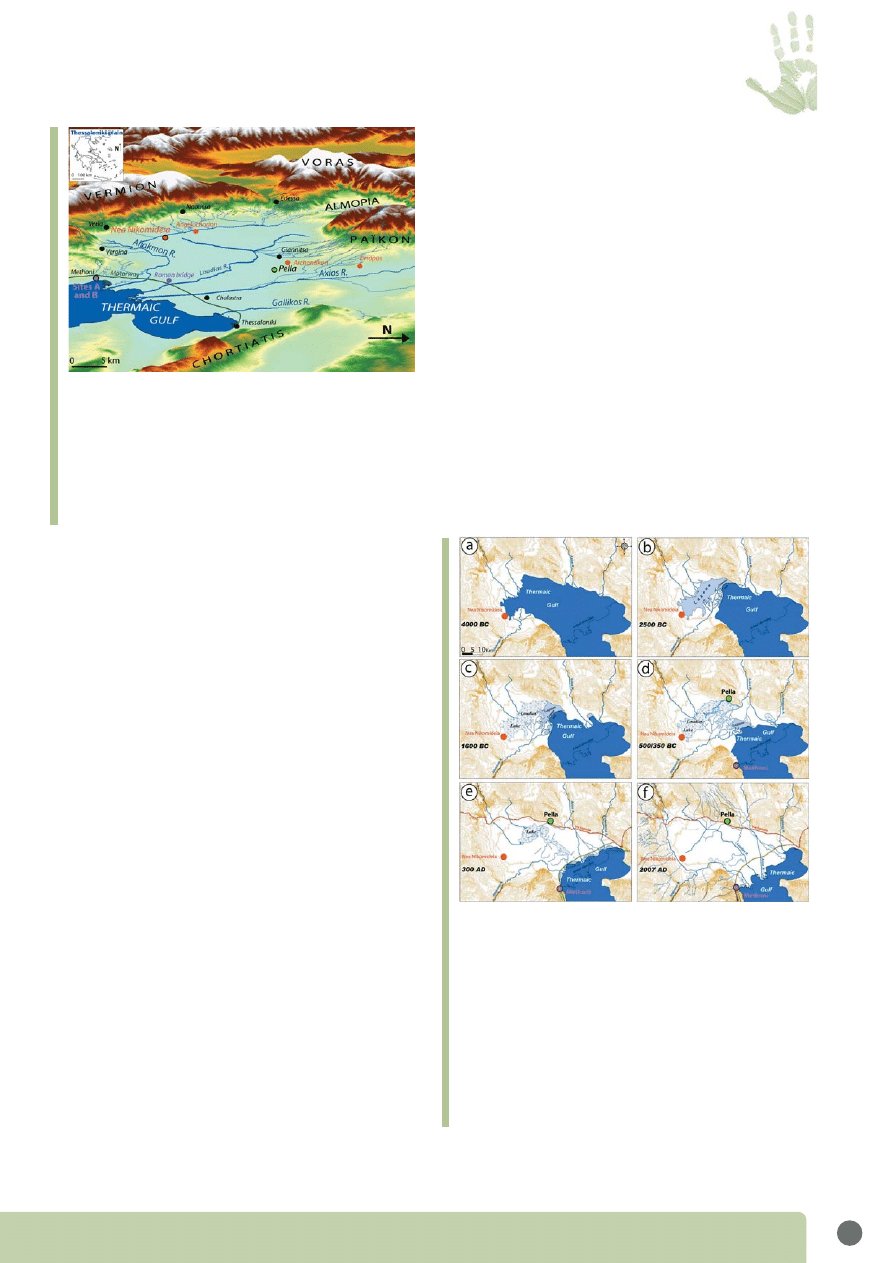
FIGURE 4: Palaeogeographic reconstruction of Thessaloniki Plain from
Neolithic period to the present-day. Panel 4a: the actual plain of
Thessaloniki is occupied by a large marine gulf circa 4000 B.C. This
period corresponds to the maximum shoreline extension during the
last post glacial sea level rise. Panel 4b: in 2500 B.C., the bay starts to
be infilled by terrestrial deposits coming from Aliakmon and Axios rivers
mainly. The rapid growth of their respective deltas created some levee
gradually transformed into natural dams and lagoon—brackish
environments around the margins of the bay. Panel 4c: the novel feature
of the plain is the appearance of a lake, confined to the western part of
the bay, around 1600 B.C. In the area of the Ancient Pella, at these times,
shallow marine conditions appear. Panel 4d: around the 4
th
century B.C.
the Aliakmon and Axios deltas grew. The probable narrowing of the bay
is from this epoch: the junction between the two main rivers draining the
plain is not efficient, but there is a very small strait which permits the
passage of boats until Pella. Panel 4e: gradual silting up of the harbour
of Pella around 300 A.D. and the lacustrine occupation. Panel 4f:
morphology of the plain nowadays.
FIGURE 3: 3D view of Thessaloniki Plain using S.R.T.M. data.
Superimposition of the archaeological settlements and hydrographical
network with the SRTM data. The topography of the Thessaloniki Plain
varies between 0 and 10 meters from the actual shoreline to the north,
close to Ancient Pella (a maximum length of 32 km), and between
0 and 10 meters to the west, close to the Neolithic settlement of Nea
Nikomedia. The city of Methoni is located along the Pierian coast on
the meridional border of the delta (Ghilardi
et al., 2007). Red dots
indicate Neolithic settlements, green dot indicates the capital Pella,
light pink dot indicates the ancient settlement of Methoni (Sites A and
B correspond to the sites identified by Hatzopolous
et al., 1990). The
dots circled in black colour are described in this article.
4 for the D.E.M, we chose a series of topographic maps scaled to 1:5000. The digitalization of points on contour lines required the use of 15144 topography points.
5 1770 bathymetric points have been produced using S.O.N.A.R. The recorded sector, corresponding to the approximate boundaries of the bay, extends from the west of the
Thermaic Gulf, to the meridional sector of the current city of Methoni and to the distal part of the Aliakmon Delta, further east.
M
ATTHIEU
G
HILARDI ET AL
G
EOARCHAEOLOGY
:
WHERE HUMAN
,
SOCIAL AND EARTH SCIENCES MEET WITH TECHNOLOGY
6
harbour even though neither the distance nor the potential
location of the harbour are documented. Using the D.E.M
4
(digitalization of points on contour lines, integration of
bathymetric surveys: the different shape files were integrated
in a GIS) key landforms were identified indicative of the
infrastructure of the ancient harbour (natural bays fossilized by
intense sediment transfers in a deltaic context; Ghilardi, 2007).
In addition to terrestrial data, a D.E.M. in marine environment
was performed to produce an overall topographical view of the
Methoni region both above and below sea level. Bathymetric
data
5
enabled completion of this marine D.E.M. and precised
the topography of the Methoni bay:
The three-dimensional view of landscapes revealed signs of
the intense morphological activity. In the North of the
archaeological settlement, there is a sector in which contour
lines are represented in a concentric manner, representing
a mild and regular gradient. The hypothesis of the presence
of an alluvial fan can be made. On the digital elevation
modelling, slope transfer activity (transfer of sediments
along slopes that have not been transported by river flow) is
visible along the former active cliff of Methoni. Indeed, where
the escarpment meets the low zone (made up of deltaic
sediments), we observe that the contour lines are
“disharmonic”, showing no concentricity. This is a telltale
sign of an impermanent runoff that has been subjected to
irregular phases of material transfer along slopes.
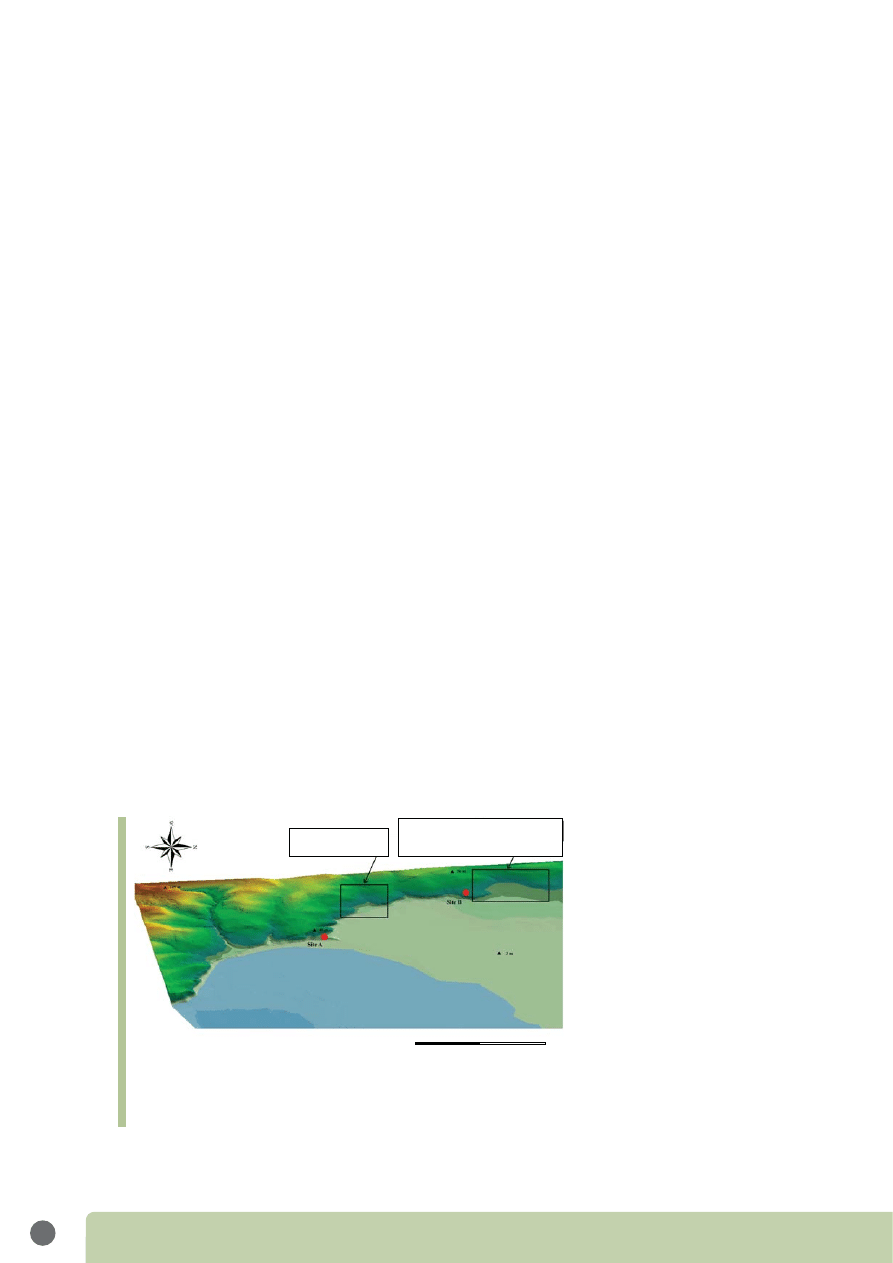
Today, we propose two candidate sites for the ancient harbour
infrastructure away from the city (Fig. 5): two natural bays that
remained unfilled by sediments after the classical period
(Ghilardi, 2007). Further palaeo-environmental investigations,
based on boreholes analysis and chronostratigraphic sequence
could help significantly in reconstructing the sedimentary
history along the Pierian coastline. Archaeological excavations
in the two former bays will provide important results to confirm
or not the presence of these harbour infrastructures.
4. CONCLUSION
Over the last decades, archaeologists and historians have faced
the necessity to reconstruct ancient settlements history not only
through the study of the material excavated, but also with the use
of palaeo-environmental parameters. For this reason,
geographers were invited to collaborate and include their results
in georeferenced maps allowing a spatial interpretation of the
laboratory analyses. This paper describes several powerful
methods to infer the evolution of landscapes in the context of
such multi-disciplinary/geoarchaeological programmes.
GIS is now the main digital support for scientists from various
disciplines to reconstruct landscape around ancient settlements.
The layers created in a digital format can have topics developed in
Human and Social Sciences (Archaeology, Geography, History) as
well as in Earth Sciences (Geology, Geochemistry, etc.). The main
aim is to develop techniques and tools for multidisciplinary
programmes dealing with the historical reconstructions of the
landscape frequented by the Human societies since the last
glacial period (circa 17500 BP).
When combined with Digital Elevation Models, GIS represents an
essential preliminary step for all geoarchaeological research.
Information concerning relief forms provides insight into the
morphological evolution of landscapes and gives a basis for
selecting potential sites for future excavation campaigns. Today,
the three-dimensional reconstruction of environments is the best
available method to produce a common reference. Dynamic and
three-dimensional thematic maps using the Digital Elevation
Model as a reference document must be used in the framework
of multidisciplinary programs. The gain in time and resources is
also substantial.
One of the limits encountered in the geomatic approach for
geoarchaeology is the choice of the geographic scale of study:
archaeologists focus on small structures (walls, etc.) or on simple
pottery shards (sometimes no more than 10 cm
in length) while geographers and specialists of
Earth Sciences (Geology, etc.) employ different
working scales which can be extended to
hundreds of squared kilometres. Therefore, GIS
can be used with difficulties by the different
disciplines and need to be well adapted at a
spatial level. Other problems can be observed
within a discipline: source documents can be
more or less reliable, for example it is still
difficult to georeference maps older than the
beginning of the 20
th
Century, and to adapt
archaeological charts without spatial references
in a GIS.
Perspectives for the use of GIS in geo
-
archaeological studies seem limitless and
encompass: surface microtopography surveys,
mapped surface finds, data from test pits and
FIGURE 5: Proposal of location of two port sites for the city of Methoni (3D view of the
sector). If two sites of occupation have been identified for the ancient city of Methoni—
Sites A (archaic and classical periods) and B (Roman Times) (Hatzopoulos
et al., 1990)—
the locations of the respective harbours are still unknown. Two natural bays that
remained unfilled by sediments during historical times have the potential to be those
ancient harbour sites.
Potential location for
the port of Methoni
Former embayment silted up by the
fast outbuilding of the Thessaloniki
Plain: best location for the harbour
0
500
1000 m

M
ATTHIEU
G
HILARDI ET AL
G
EOARCHAEOLOGY
:
WHERE HUMAN
,
SOCIAL AND EARTH SCIENCES MEET WITH TECHNOLOGY
S
.
A
.
P
.
I
.
EN
.
S
7
excavations, and many multispectral and geophysical remote
sensing data. All applications combined in one place, should yield
tremendous potential for understanding site content, organization
and structure. Multimedia presentations could offer video, sound,
photographs, drawings and animated 3D views. In doing so, free
Internet-based Software, such as
Google Earth© and Geoportail©,
which use 3D views could be implemented with additional data.
Indeed, palaeo-environmental results provided by a large amount
of international scientific programmes could be added and sea
level rise since the last glacial period could be modelled, allowing
not only 3D landscape reconstruction but also 4D modelling that
relates long term evolution of shorelines displacement.
As presented in this article, geoarchaeological studies offer now an
unprecedented level of integration between disciplines to visualize
a shoreline and its displacement. Over the last 20 000 years,
humans had to constantly adapt their lifestyle according to the
displacement of the shoreline. Given the current threats and
uncertainties related to climate change, it is predictable and
desirable that many disciplines will adopt similar integrated
approach to model their favourite object of research. More
generally, GIS offers a tremendous opportunity for scientific
outreach and its international common databases are now ready to
be shared for new purposes and adapted to create new usages
beyond scientific communities.
Acknowledgements are addressed to the CNRS for financial support
through the ECLIPSE project “Variations climatiques et dynamique
des écosystèmes au Sud des Balkans au cours du dernier cycle
climatique”, coordinated by A.M. Lézine and E. Fouache. Special
thanks to the members of the Franco-Albanian cooperative project
including the French School of Athens (Greece) and the
Archaeological Museum of Korçë (Albania). Fruitful remarks from
Theodoros Paraschou (Anafi) and David Psomiadis (University of
Dimokritos, Athens, Greece) were highly appreciated. Finally,
special thanks to the Ecole Pratique des Hautes Etudes (Paris-
France) for technical support.
R
EFERENCES
Anschuetz K. F.
et al. (2001). An Archaeology of Landscapes:
Perspectives and Directions, Journal of Archaeological Research,
9 (2).
Bordon A.
et al. (in press). Pollen-inferred Late-Glacial and
Holocene climate in southern Balkans (lake Maliq), Quaternary
International.
Butzer K.W. (1982). Archaeology as Human Ecology, Cambridge
University Press, 364 p.
Desruelles S. & C. Cosandey (2005). The water resources in the
insular group of Mykonos, Delos and Rhenia (Cyclades, Greece)
and their management in the antique city of Delos, In
Stournaras, G., Pavlopoulos, K., and Bellos, T., Eds., 7
th
Hellenic
hydrogeological conference and 2
nd
Mem Workshop on fissured
rocks hydrology; Vol. II, key lectures, workshop proceedings,
Athens, The Geological society of Greece, 101-104.
Farr T. G.
et al. (2007). The Shuttle Radar Topography Mission,
Rev. Geo-phys., 45. RG2004, doi:10.1029/2005RG000183.
http://www2.jpl.nasa.gov/srtm/srtmBibliography.html
Fletcher R. (2008). Some spatial analyses of Chalcolithic
settlement in Southern Israel, Journal of Archaeological Science,
35, 2048-2058.
Fouache É. (2001). Man and environement around lake Maliq
(southern Albania) during the Late Holocene, Vegetation History
and Archaeobotany, 10, 79-86.
Fouache É. (2006). 10000 ans d’évolution des paysages en
Adriatique et en Méditerranée Orientale. Géomorphologie,
Paléoenvironnements, Histoire, De Boccard éditions, Travaux de
la Maison de l’Orient et de la Méditerranée, 45.
Fouache É., & M. Rasse (2007). Geoarchéologie. Avant-propos,
Bulletin de l'Association des Géographes Français, (1), 115-118.
Fry G.L.
et al. (2004). Locating archaeological sites in the
landscape: a hierarchical approach based on landscape
indicators, Landscape and Urban Planning, 67, 97-107.
Ghilardi M. (2006). Apport et intérêt de la Modélisation
Numérique de Terrain en géomorphologie, étude du site antique
de Méthoni (Piérie—Grèce), Dinard, Mémoire du laboratoire de
géomorphologie et d’environnement littoral de l’Ecole Pratique
des Hautes Etudes, 114 p.
Ghilardi M. (2007). Dynamiques spatiales et reconstitutions
paléogéographiques de la plaine de Thessalonique (Grèce) à
l’Holocène récent. PhD thesis, University of Paris 12, 475 p.
Ghilardi M.
et al. (2007). Localisation de sites portuaires pour la
cité antique de Methoni (Piérie—Grèce) via l’utilisation des
Modèles Numériques de Terrain, Travaux archéologiques en
Macédoine et en Thrace AEMTh, 19, 317-321.
Ghilardi M.
et al. (2008a). Reconstruction of Mid-Holocene
sedimentary environments in the central part of the Thessaloniki
Plain (Greece), based on microfaunal identification, magnetic
susceptibility and grain-size analyses, Geomorphology, 97 (3-4),
617-630.
Ghilardi M.
et al. (2008b). Human occupation and
geomorphological evolution of the Thessaloniki Plain (Greece)
since Mid Holocene, Journal of Archaeological Science, 35 (1),
111-125.
Hatzopoulos M.V. (1990). Deux sites pour Méthone de Macédoine,
Bulletin de Correspondance Hellénique, 114.2, 639-668.

M
ATTHIEU
G
HILARDI ET AL
G
EOARCHAEOLOGY
:
WHERE HUMAN
,
SOCIAL AND EARTH SCIENCES MEET WITH TECHNOLOGY
8
Hubert S. (2001). Modélisation Numérique de Terrain et analyse
spatiale pour une aide à l’évaluation des risques d’inondation
dans la région de Nouakchott (Mauritanie), Mémoire de DESS,
ENSG—Univ. Pierre et Marie Curie, 50.
Katsianis M.
et al. (2008). A 3D digital workflow for archaeological
intra-site, Journal of Archaeological Science, 35, 655-667.
Kvamme K. L. (1999). Recent directions and developments in
geographical information systems, Journal of Archaeological
Research, 7 (2), 164-167.
Li X. (2005). Contribution à la mise en place d’une base de
données à référence spatiale en baie du Mont Saint-Michel,
Mémoire de l’Ecole Pratique des Hautes Etudes.
Marble D. F.
et al. (1984). Basic readings in geographic information
systems, SPAD Systems Ltd., Williamsville, New York.
Mugnier C. (2002). The Hellenic republic—Grids and datums,
Photogrammetric engineering and remote sensing, 1237-1238.
Prendi F. (1966). La civilisation préhistorique de Maliq, Studia
Albanica, 3 (1), 255-280.
Rabus B.
et al. (2003). The shuttle radar topography mission- a
new class of digital elevation models acquired by spaceborne
radar, Photogrammetric Engineering & Remote Sensing, 57,
241-262.
Rapp Jr. G. R. & C.L. Hill (1998). Geoarchaeology: The Earth-
science approach to archaeological interpretation, Yale University
Press, New Haven.
Touchais G., P. Lera & C. Oberweiler. (2005). L'habitat
préhistorique lacustre de Sovjan (Albanie): dix ans de recherches
franco-albanaises (1993-2003), In Della Casa, P., and Trachsel,
M., Eds., WES '04. Wetlands Economies and Societies,
Proceedings of the International Conference, Zurich, 10-13
march 2004, 255-258.
Abbreviations and Acronyms
A.D.: Anno Domini
A.M.S.: Accelerator Mass Spectrometry radiocarbon dating is a
way to obtain radiocarbon dates from samples that are far tinier
than that needed for standard radiocarbon dating. Standard 14C
dates require amounts of between 1 and 10 grams of charcoal;
A.M.S. can use as little as 1-2 milligrams, and under special
circumstances to samples as small as 50-100 micrograms.
B.C.: Before Christ
B.P.: Before Present. Before Present years are a time scale used
in Archaeology, Geology, and other scientific disciplines to specify
when events in the past occurred. Because the “present” time
changes, standard practice is to use 1950 as the arbitrary origin
of the age scale. For example, 1500 B.P. means 1500 years before
1950 (that is in the year 450).
C.A.D.: Computer-Aided Drafting (Design). It is the use of computer
technology to aid in the design and especially the drafting
(technical drawing and engineering drawing) of a part or product,
including entire buildings. It is both a visual (or drawing) and
symbol-based method of communication whose conventions are
particular to a specific technical field.
D.E.M.: Digital Elevation Model. It is a digital representation of
ground surface topography or terrain. It is also widely known as a
digital terrain model (D.T.M.). A D.E.M. can be represented as a
raster (a grid of squares) or as a triangular irregular network.
D.E.Ms. are commonly built using remote sensing techniques;
however, they may also be built from land surveying.
D.G.P.S.: Differential Global Positioning System. It is an
enhancement to Global Positioning System that uses a network
of fixed, ground-based reference stations to broadcast the
difference between the positions indicated by the satellite
systems and the known fixed positions.
E.D.: European Datum
GIS: Geographic Information System. This system integrates
hardware, software, and data for capturing, managing, analyzing
and displaying all forms of geographically referenced
information.
G.P.S.: Global Positioning System, is a system of satellites in
space which are circling the Earth. The system has more than 24
satellites circling the Earth, all of them working together to tell
people where they are.
L.I.D.A.R.: Light Detection And Ranging. It is an optical remote
sensing technology that measures properties of scattered light to
find range and/or other information of a distant target. The
prevalent method to determine distance to an object or surface is
to use laser pulses.
H.M.G.S.: Hellenic Military Geographical Service
H.G.R.S.: Hellenic Geodetic Reference System
S.O.N.A.R.: SOund Navigation And Ranging. It is a technique that
uses sound propagation (usually underwater) to navigate,
communicate or to detect other vessels.
S.R.T.M.: Shuttle Radar Topography Mission: elevation data on a
near-global scale to generate the most complete high-resolution
digital topographic database of Earth.
T.I.N.: Triangular Irregular Network. It is a digital data structure
used in a Geographic Information System (GIS) for the

M
ATTHIEU
G
HILARDI ET AL
G
EOARCHAEOLOGY
:
WHERE HUMAN
,
SOCIAL AND EARTH SCIENCES MEET WITH TECHNOLOGY
S
.
A
.
P
.
I
.
EN
.
S
9
representation of a surface. A T.I.N. is a vector based
representation of the physical land surface or sea bottom, made
up of irregularly distributed nodes and lines with three
dimensional coordinates (x, y, and z) that are arranged in a
network of non-overlapping triangles.
U.T.M.: Universal Transverse Mercator
W.G.S.: World Geodetic System
Wyszukiwarka
Podobne podstrony:
Harrison C White Reconstructing the Social and Behavioral Sciences(1)
Human Relations and Social Responsibility
McDougall G, Promotion and Protection of All Human Rights, Civil, Political, Economic, Social and Cu
Psychology and Cognitive Science A H Maslow A Theory of Human Motivation
Comparison of Human Language and Animal Communication
Optional Protocol to the International Covenant on Economic, Social and Cultural Rights
Human Papillomavirus and Cervical Cancer Knowledge health beliefs and preventive practicies
HUMAN RIGHTS AND THEIR IMPORTANCE goood
13 Interoperability, data discovery and access The e infrastructures for earth sciences resources
Chater N , Oaksford M Human rationality and the psychology of
24 Socialising and networking
Isaac Asimov Foundation 05 Foundation And Earth
Second Language Socialization and Learner Agency Adoptive Family Talk (L W Fogle))
Albanian Women after Socialism and the Balkan War
Terrorism And Development Using Social and Economic Development to Prevent a Resurgence of Terroris
Comparative Analyses of the Bacterial Microbiota of the Human Nostril and Oropharynx
Euthanasia, Human Experiments, and Psychiatry in Nazi Occupied Lithuania, 1941 1944
OLSON The Existential, Social, and Cosmic Significance of the Upanayana Rite
więcej podobnych podstron