
Harman International Industries Inc., 8500 Balboa Blvd., Northridge, CA 91329 (818) 893-8411
1
L
OUDSPEAKERS AND
R
OOMS
- W
ORKING
T
OGETHER
by
Floyd E. Toole, Ph.D.
Vice President Acoustical Engineering, Harman International Industries, Inc.
Stereophonic and multichannel surround sound systems are encode/decode processes in which the
loudspeakers and the listening room are dominant factors. Together, they influence timbre, dynamic range,
and directional and spatial effects - in other words, almost everything that matters to critical listeners. The
sounds arriving at the ears are the only information that the auditory system has to work with. If the sounds
are different in different circumstances, the perceptions will be different.
The only real solution is to control these variations and, ultimately, to standardize the important
factors. Problem is that there are no industry standards for either loudspeakers or rooms. In this paper we
will attempt to make the best of this imperfect system by identifying the major variables in the
loudspeaker/room system, and discussing methods for their measurement and control.
1 THE OBJECTIVES
Normally, we strive for some semblance of “realism”, whatever that may be. The relationship
between the perceived sound qualities in recordings and those in live performances is close, but imperfect.
In a domestic room, practical factors make it very difficult to create truly convincing impressions of being,
for example, in a concert hall.
Some of the difficulty stems from the restrictions of traditional two channel stereo systems. Only
those listeners on the axis of symmetry of the loudspeakers can hear the full benefits of stereo, and the
effects diminish with distance. Conventional stereo recording techniques are the result of trial and error,
attempting to make the best of a system which cannot recreate all of the directional impressions that may
have been a part of an original live performance. The directional diversity of sounds arriving at listeners'
ears is much reduced compared to any live experience.
As a result, strict realism is an impossible objective, so we try to approach it as closely as possible,
within the limitations of our hardware. For the bulk of recorded music, however, realism is an inappropriate
objective. In popular music, for example, the original "performance" occurs in a recording control room at
the time of the final mixdown. Since recording studios are not standardized, unless you happened to be
there, you don’t know what the original was.
Attempting to bring a little more spatial “flavor” to the reproduction process, loudspeakers are
available in directivities ranging from conventional front-firing, through bipole (bidirectional in phase),
dipole (bidirectional out-of-phase), predominantly-reflecting, to omnidirectional. These present listeners
with very different combinations of direct and reflected sounds, and in most of them the room is a major
determinant. Stereo, therefore, is not really a system at all but, rather, a basis for individual
experimentation.
Multichannel systems offer a partial solution in that there are more channels, and therefore more
directions from which sounds can be made to appear. This also brings a certain independence from room
acoustics, since there are more “real”, as opposed to “reflected” sources. Still, multi-directional, including
“dipole”, speakers rely on reflections, so there are instances in which one must attend to the details.
The standardization of at least some of the more obvious variables by the film industry has helped
enormously in achieving some consistency in multichannel film sound tracks. Consequently, what one
hears in a cinema is similar to what was heard in the dubbing stage where the sound track was assembled.
Good engineering practices and the Home THX program attempt to continue that relationship into the
home.
It will be interesting to see how multichannel music develops.

Harman International Industries Inc., 8500 Balboa Blvd., Northridge, CA 91329 (818) 893-8411
2
1.1 Cause and Effect in Loudspeaker/Room Combinations
Accurate sound reproduction from a loudspeaker is largely dependent on the absence of linear
(frequency and phase response) and non-linear (harmonic and intermodulation) distortions, and on
maintaining a constant directivity across the frequency range. In a reflection-free environment, directivity
would be unimportant, as one would listen to the sound radiated along a single axis, preferably the best one.
In real rooms, sounds radiated in most directions from loudspeakers eventually reach the listeners.
The directional properties of the loudspeaker, the physical arrangement and the acoustical
properties of the listening room determine the spectrum, amplitude, directional and temporal factors of the
multitude of sounds arriving at listeners' ears. All of these sounds combine and interact physically, at the
entrance to the ears, and perceptually, in the auditory systems and minds of listeners. As a result, virtually
every perceptual aspect of stereo reproduction can be affected.
Variations in the perceived spatial representation, or imaging:
(a) the size of specific images of voices or instruments are changed by reflected sounds, especially those in
the horizontal plane.
(b) the positions (lateral or in depth) of specific images are changed by reflected sound, and
(c) the sense of spaciousness or envelopment are influenced by reflected sounds, again mainly those
occurring in the horizontal plane.
Variations in sound quality, or timbre caused by:
(d) the acoustical coupling of sound through the standing-wave system (the room resonances or modes that
are related to its dimensions),
(e) listeners positioned on different direct-sound axes from the loudspeakers receiving different initial
sounds,
(f) acoustical interference (comb filtering) occurring when the direct sound and one or more strong early
reflections combine at the listener's ears,
(g) frequency-dependent variations in sound absorption in room boundaries and furnishings modifying the
spectra of reflected sounds, and thereby of the integrated sound field at the listener's ears,
(h) strong reflections of inferior-quality off-axis sound from loudspeakers degrading the spectrum of the
integrated sound field ( a variation of the previous item),
(i) perceptual "amplification" of non-delayed resonances by reflections and reverberation (some sounds
are more audible in a complex sound field), and,
(j) perceptual "attenuation" of delayed sounds by reflections and reverberation (some sounds are less
audible in a complex sound field).
In short, the physical characteristics of loudspeakers and listening rooms can alter virtually all of
the perceived qualities of sound that are held as being fundamental to satisfactory sound reproduction.
2.
THE PHYSICAL VARIABLES
Although there are substantial areas of overlap, as will become clear, for purposes of explanation it
is simpler if we separate the room variables into the following categories:
1. Dimensions and proportions.
2. Loudspeaker and listener positions.
3. Sound absorption and reflection.
2.1 DIMENSIONS AND PROPORTIONS
Rooms have acoustic resonances, or modes. The proportions of a room, length to width to height,
determine the distribution of room modes in the frequency domain, whether there are clusters or gaps in the
distribution. The dimensions themselves determine the frequencies at which the resonances occur, whether
specific musically important frequencies will be reinforced, or not. In perfectly rectangular rooms, with
perfectly flat and perfectly reflecting boundaries, these resonances can be easily calculated, using the well-
known formula:

Harman International Industries Inc., 8500 Balboa Blvd., Northridge, CA 91329 (818) 893-8411
3
where: f = frequency of the nth mode
nx, ny, nz = integers with independently chosen values between 0 and, say, 4.
lx, ly, lz = dimensions of the enclosure (length, width and height) in meters (feet)
c = speed of sound = 345 m/s (1131 feet/s) at room temperature.
To calculate all of the modes of a room it is necessary to work through all possible combinations
on integers (whole numbers) for nx, ny and nz. In practice only the low-frequency modes need to be
calculated; up to n = 4 is usually sufficient.
Individual modes are identified by the integers nx, ny, and nz. For example, (1,0,0) identifies the
first order mode along the x dimension of the room, (0,2,0) identifies the second order mode along the y
dimension of the room, and so on. If two of the three numbers are zeros, the equation reduces to a simple
calculation of the modal frequency for the standing waves set up between a pair of opposing reflecting
surfaces along one of the room dimensions. These are the axial modes of the room, normally the most
energetic of all room resonances, and the easiest to calculate. If you do nothing else, have a look at these
axial modes for each of the length, width and height of the room.
Tangential modes occur when sound is
reflected among four surfaces, traveling parallel to the
remaining two. These modes are calculated by
combining two integers and one zero. For example,
(1,1,0) identifies the first order mode in the x-y plane.
These standing waves involve the four walls and run
parallel to the ceiling and floor.
Oblique modes interact with all room
boundaries. Numerous reflections occur in each
"circuit" of the room, and because some sound energy is
lost at each one, these are the least energetic of all room
modes. They are calculated by combining all possible
combinations of three integers.
2.1.1 THE "IDEAL' ROOM
It has long been assumed that a uniform distribution of room modes in the frequency domain is a
good thing. Concentrations of modes could cause artificial accentuation of certain frequencies, and gaps in
the modal distribution could cause some frequencies to be less audible.
Over the years, there have been suggestions of various room dimension ratios, length-to width-to
height, that offer superior modal distributions [1,2]. These and other studies have not always acknowledged
three problems of real listening spaces that render the predictions unreliable.
•
= First - the calculations assume that the room is perfectly rectangular, and constructed of perfectly flat,
perfectly reflecting surfaces. Reality is rarely so simple, since rooms commonly have irregular shapes,
large surfaces that absorb sound (they vibrate), furnishings, etc. These departures from the theoretical
ideal result in errors in the calculated frequencies.
•
= Second - All of the modes are not equally important. In general, the axial modes are the dominant
factors. Assessments of rooms should, therefore, incorporate a weighting in which the axial, tangential,
and oblique modes are considered in that order of importance
•
= Third - The positions of the sound sources and listeners in practical listening arrangements do not result
in uniform acoustical coupling to the room modes. As a result, the loudspeakers do not supply energy
f =
c
2
n
x
2 n
y
2 n
z
2
L
x
L
y
L
z
Calculating the Axial Modes
•The axial modes are the most powerful
•They are therefore the first consideration
•They are easy to calculate
speed of sound in ft/s 1130
2 x length in feet 40
f
1,0,0
=
=
= 28.25 Hz
other length modes are simple multiples of this:
2x, 3x, 4x, etc.
e.g. the first length mode of a room 20 feet long
can be calculated as follows:
Harman International Industries Inc., 8500 Balboa Blvd., Northridge, CA 91329 (818) 893-8411
4
uniformly to all of the existing modes, and the listeners are not in positions to hear the effects of even
those modes that are energized.
These complications mean that, in practical situations, predictive schemes may be helpful, but not
perfectly satisfying. In-situ measurements may be the only method of determining exactly what is
happening.
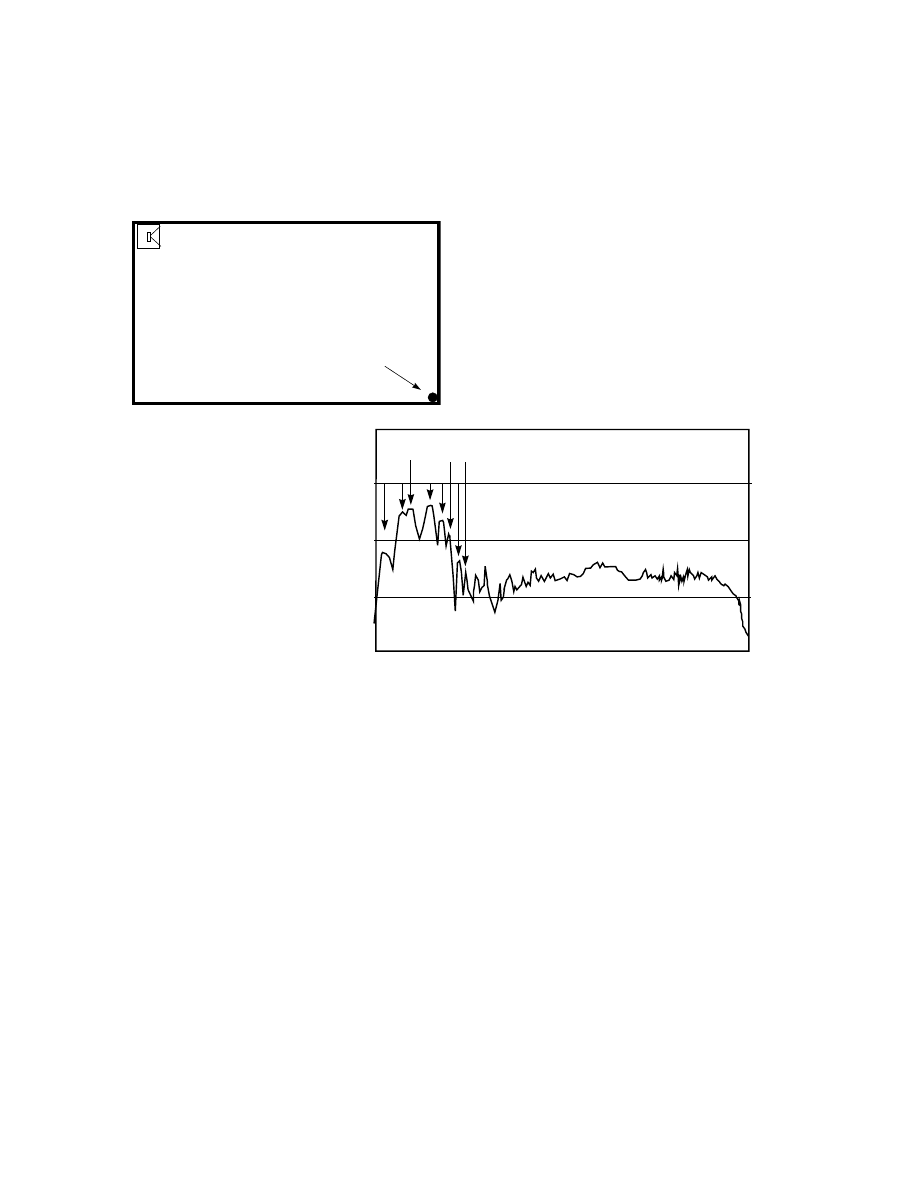
Figure 1 Placing a loudspeaker on the floor in a corner
will ensure that all of the low-order modes are energized
(all modes have a high-pressure region at any intersection
of the three room surfaces - wall, floor and ceiling).
Placing a microphone at an opposite corner (floor or
ceiling) will ensure that it responds to all modes.
Obviously, the loudspeaker must be a closed-box or vented-
box design (a pressure source) and the microphone must be
an omnidirectional design (a pressure detector) with good
low-frequency response.
Figure 2. This plot of sound
pressure vs. frequency is
really only useful for
identifying the frequencies of
the strongest modes in the
room. It is not uncommon to
find that the measured
frequencies are not exactly
the same as those that can be
calculated. This is because
the room is a real one, not an
idealized one. Note the
substantial acoustical “gain”
at the resonant frequencies.
As a means of determining how a room might perform in a realistic stereo or multichannel
application, however, this measurement is useless. Moving the loudspeaker away from the corner will
change the way it energizes the modes and moving the microphone will change the modes it responds to.
However, if the room is basically rectangular, it is still useful to calculate the modal frequencies in
order to avoid obviously troublesome dimensional combinations in new constructions, and to identify the
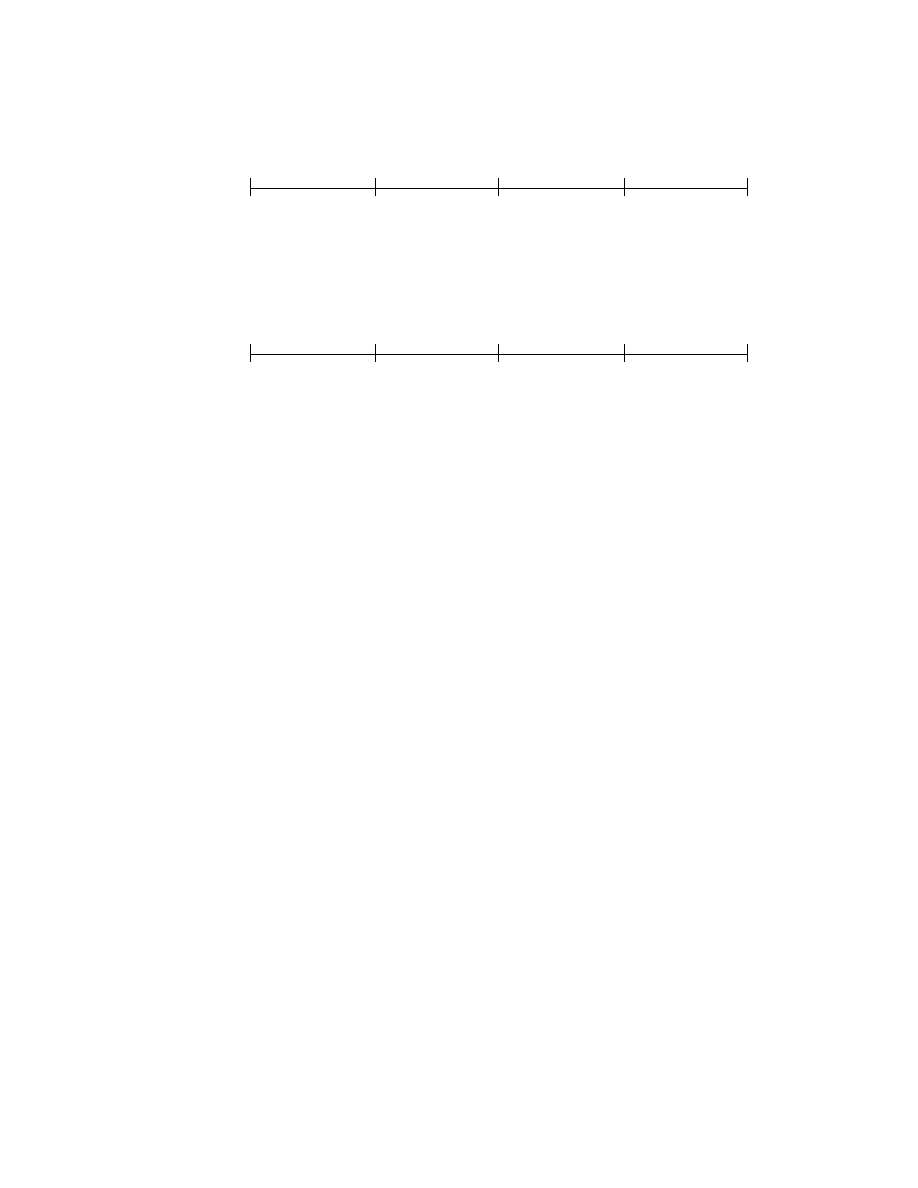
problematic modes in existing rooms. Figure 3 shows the modal distributions for a room that is likely to
present problems, and another one that might be more successful. Notice that, in the "bad" room, there are
really two problems, the frequency distribution of the modes is uneven, and the same combination of modes
appear in repeated patterns. The second room is an improvement in both respects.
These simple “back of an envelope” calculations are an essential beginning to analyzing a room
setup. Of course, if the room is dramatically non-rectangular, this cannot be done, and life just became
much more complicated.
MICROPHONE
20 50 100 500 1K 5K 10K 20K
FREQUENCY (Hz)
dB
20
30
10
0
-10
100
010
200
00
1
300
020
002
THE MOST OBVIOUS MODES
ARE USUALLY AXIAL MODES
Harman International Industries Inc., 8500 Balboa Blvd., Northridge, CA 91329 (818) 893-8411
5
Figure 3 (top) Axial modes calculate for a rectangular room. "L" identifies a length mode, "W" a width mode, and
"H" a height mode. The dimensions are simple multiples of each other and, as a consequence, there are regularly
repeated combinations of the same axial modes, and similarly regular gaps. This room is likely to have some
problems.
Figure 3 (bottom) Axial modes for a room in which the dimensions have been adjusted to produce a more favorable
distribution. Because it is slightly larger, the axial modes begin at a lower frequency and are closely spaced. Because
of the irregular ratio of length-to width-to -height, the modes do not coincide at all at very low frequencies and, at
higher frequencies, they combine in differing combinations.
Some have argued that there are advantages to using non-rectangular rooms. The thinking behind
this is that, by reflecting sounds in directions other that directly back towards a parallel surface, the
development of standing waves will be inhibited, and diffusion will be increased. The reality is that sloping
the room boundaries has a substantial effect on the modal structure, but the modes do not disappear. In fact,
the magnitudes of the variations in sound pressure throughout the room remain much the same, but the
frequencies of the various modes are changed in an unsystematic manner, and the nodal lines are
repositioned in a manner that is not always obvious [3,4]. Simple predictions of the kind just discussed are
no longer possible, and one must resort to finite-element analysis or models in order to predict what might
happen in practice. This is a serious disadvantage in some situations, as will be seen, for example, in
Section 2.2.
In other applications, like reverberation rooms for acoustical measurements, the advantages
outweigh the disadvantages. If the modal mixing generated by non-parallel surfaces is judged to be
desirable, it is interesting to note that it may not be necessary to angle all of the surfaces. There appear to
be substantial gains from the sloping of just one room boundary [4].
2.2 Loudspeaker and Listener Positions
Two factors are involved in determining the effects of loudspeaker and listener positions at low
frequencies:
1. interactions with adjacent room boundaries, and
2. interactions with room modes.
Although such considerations are frequently included in discussions of loudspeaker placement, it is
less common, but just as important, that they be considered in choosing listener locations.
0
100
200
300
400
FRE Q U E N C Y (Hz)
0
100
200
300
400
FRE Q U E N C Y (Hz)
L W L
H
W L
H
W
L
L W L
H
W L
H
W
L
L W L
H
H :W :L = 1:1.5:2
H :W :L = 1:1.5:2.4
L W H LW H
H
W L W L W H L W H L W HLW
Harman International Industries Inc., 8500 Balboa Blvd., Northridge, CA 91329 (818) 893-8411
6
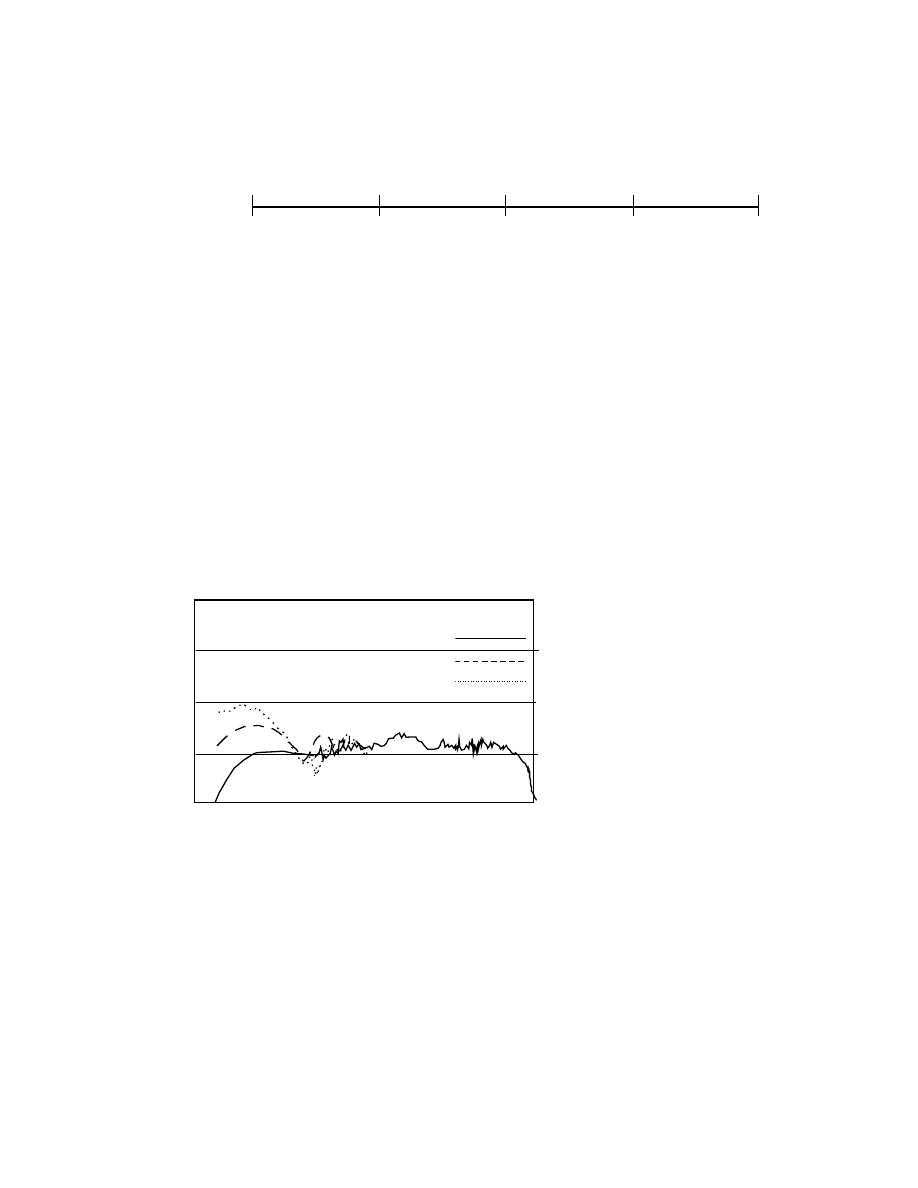
Figure 4 In this diagram the size of the mode identifiers has been adjusted to reflect their audible importance to a
listener in a realistic stereo system setup.
The discussion of the subject is in two parts, but it should be emphasized that they are by no means
independent. Perhaps the simplest way to conceptually distinguish between the two, is to think of "adjacent
boundary" problems as those involving only the direct sound and the first reflections from nearby room
surfaces. Room modes develop as a result of multiple reflections that include these surfaces, as well as
others in the room.
2.2.1 Interactions with Adjacent Room Boundaries
This is a topic that has been carefully examined by Allison [5,6], Waterhouse [7,8] and
Waterhouse and Cook [9]. The effects are a major determinant in the low-frequency performance of
loudspeakers in listening rooms. Allison's papers illustrate well the magnitudes of the effects, as does
Figure 5, in a dramatic fashion.
Figure 5. The bottom curve shows a
loudspeaker measured in a true free
field, with no reflecting surfaces,
such as a very good anechoic
chamber, or outdoors far away from
any large object, including the
ground. In such a situation the
sound radiates into a full sphere
solid angle, identified as 4
π
steradians. Placing the loudspeaker
on a floor reduces the solid angle by
half, and the sound pressure at low
frequencies will be increased by
approximately 6 dB because sound
that would have propagated away
will be reflected back. Leaving it on
the floor and backing it up against a
wall reduces the solid angle by two
factors of two, to
π
steradians, and it can be seen at the left of the curves that the sound pressure is elevated by about
12 dB. Sliding the loudspeaker into a corner reduces the solid angle into which the sound radiates by a further factor
of two, to
π
/2 steradians, and the pressure goes up by another 6 dB for a total low-frequency gain of about 18 dB!
With respect to amplifier power and stress and strain on the loudspeaker, these acoustic gains are absolutely free, so
wise people take advantage of them. In rooms with normally flexible boundaries, the gains will be slightly less, but
still substantial.
An unfortunate side effect is that some irregularity is introduced at upper bass and lower mid
frequencies. If one is using a separate subwoofer, this is not likely to be a problem. However, for free-
standing full-way loudspeakers finding a suitable compromise between good imaging and good bass can be
a frustrating, and frequently impossible, task. There is no solution to this but to experiment with position
[11,12]. This is probably the single most persuasive argument for subwoofers.
0
100
200
300
400
FREQUENCY (Hz)
H:W:L = 1:1.5:2.4
L
W
H
L
W
H
W
L
H
W
L
WH L WH L W HLW
20 50 100 500 1K 5K 10K 20K
FREQUENCY (Hz)
dB
20
30
10
0
-10
4
ππππ
STERADIANS
ππππ
STERADIANS
π/2
π/2
π/2
π/2
STERADIANS
Harman International Industries Inc., 8500 Balboa Blvd., Northridge, CA 91329 (818) 893-8411
7
As a means of reducing the variables, a few manufacturers have integrated the floor and/or rear
wall into the loudspeaker design. This restricts the choice for loudspeaker locations in the room, but it
reduces the chance of a serious degradation of sound quality due to unfortunate placement.
Treatments of this subject have tended to use either sound power or sound pressure level as the
measured dimension. It is correct to use either, of course, and both are useful in different situations. A
good explanation of the relationship between sound power and sound pressure (as well as sound intensity)
can be found in Section 1.4.3 of reference 13. In assessing the audible effects of these quantities, it is most
directly relevant to use sound pressure levels, as the ears respond to sound pressure, and the
psychoacoustical relationships are expressed in those terms.
Reducing by a factor of two the solid angle into which a loudspeaker radiates, can result in an
increase in sound pressure of a factor of two, or 6 dB, measured at a particular location. This is entirely
consistent with the notion of the sound power radiated by the loudspeaker into the reduced solid angle being
increased by a factor of two, or 3 dB.
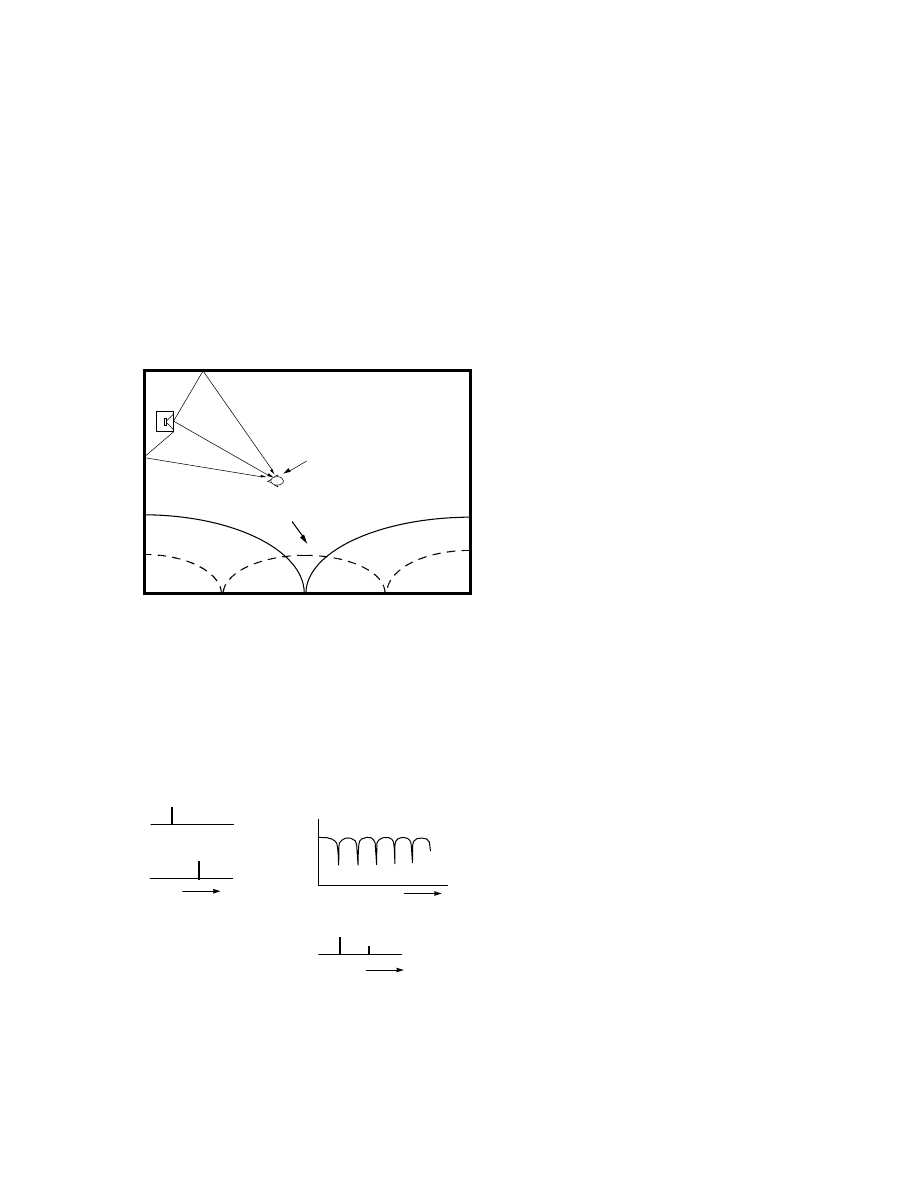
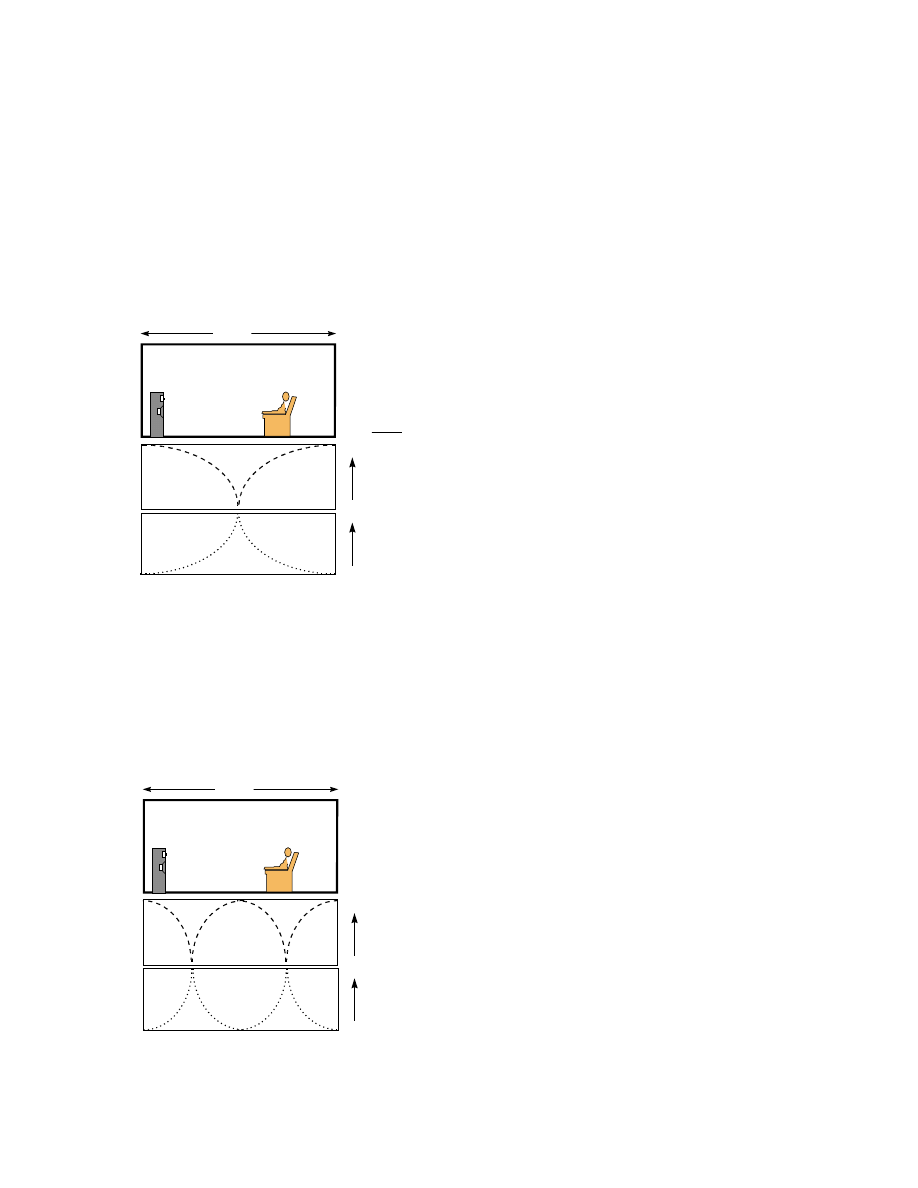
Figure 6. An illustration of “wave effects” - those
phenomena that exist because sound propagates as a
pressure wave. In this simplistic sketch, the upper
illustration shows the direct and early-reflected
sounds arriving at a listener’s ears. The lower
portion of the sketch shows stylized sound pressure
standing waves between the front and back walls of
the room. Mode 1,0,0 has one pressure minimum at
the half-way point along the room, and mode 2,0,0
has two minima.
In the preceding discussion of solid angles, it was shown that at long wavelengths (low
frequencies) sounds reflected from adjacent boundaries added constructively because they arrived at the
measuring/listening point substantially “in step” with each other. At higher frequencies, this will not always
happen and, as a result, there will be frequencies at which the sounds add (constructive interference) and
frequencies at which they subtract (destructive interference), depending on the path lengths involved. In
order for this to happen, of course, both the direct and the reflected sounds must be simultaneously present.
In such situations, we can measure a familiar effect, known as comb filtering, because of the “tooth-like”
regularity of the repeating destructive interference cancellations.
Figure 7. A sequence of two transient acoustical
events, e.g. a direct and reflected sound, viewed
from the perspective of a measuring system which
assumes steady-state conditions, and from the
perspective of the ear, which knows the difference
and, in addition, has the advantage of forward
temporal masking to attenuate the apparent
loudness of the second transient. Perceptually the
events may not be as audibly disturbing as the
rather nasty-looking measurement would indicate.
For long-duration sounds, the combing is, of
course, real, and the perception and the
measurement are more similar.
The standing waves in Figure 6 show
the pressure distributions across the length of the room at those frequencies at which the room is precisely
one-half wavelength (mode 1,0,0) and precisely one wavelength (mode 2,0,0) long. Note that the first
minimum from each wall is always one-quarter wavelength from the reflecting surface. Note also that the
instantaneous pressure on opposite sides of a pressure minimum (null) has the opposite polarity. That
ACOUSTICAL
INTERFERENCE
STANDING WAVES
Wave Effects
+
-
+
+
-
Comb Filtering - a Steady-State Effect
TIME
+ =
FREQUENCY
=
MEASUREMENT
PERCEPTION
TIME
Harman International Industries Inc., 8500 Balboa Blvd., Northridge, CA 91329 (818) 893-8411
8
means that as the pressure on one side is increasing, the pressure on the other side is decreasing.
Remember this, it will be useful.
2.2.2 Interaction with Room Modes
Rooms in homes are usually rectangular. However, that is where the similarity ends in most cases.
Nothing is standardized, and the differences in detailed shape, placement of doors, archways, windows,
large pieces of furniture, etc. ensure that every situation will have its own distinctive problems.
At low frequencies it is frequently possible to be quite accurately analytical about what is happening in a
room, but the standing-wave structure at higher frequencies is usually lost in confusion. The following
simple examples should be helpful.
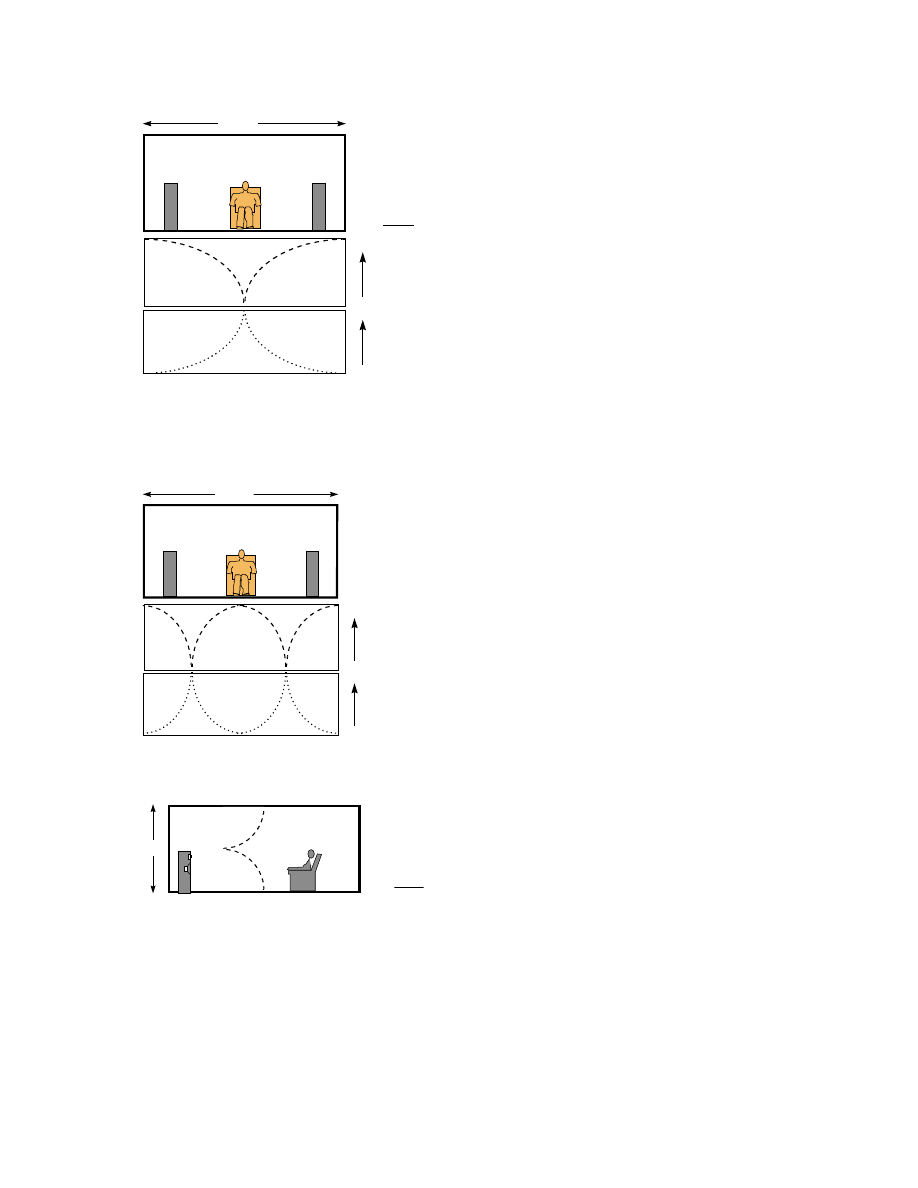
Figure 8. A view of a listening room showing the
distribution of sound pressure and particle velocity for
the first-order mode, 1,0,0, along the length of the
room.
Notice in this figure that the pressure is
highest at the reflecting surfaces - the point at
which the change in direction occurs - and that
the particle velocity is at a minimum at the
reflecting surface - where the air molecules are
literally “up against the wall”. The loudspeaker
shown is a conventional closed or vented box
device, and therefore is a pressure source. Such a
device will acoustically “couple” to a mode when
it is positioned in a high pressure region of the
standing wave pattern. In this figure, the loudspeaker will couple with near maximum effectiveness. The
listener’s ears are also well positioned to hear this mode, but they are not at the highest pressure position,
which is probably a good thing, given the acoustical gain that a resonance provides. If the listener were
moved forward into the pressure minimum (null), the coupling would be minimal, and the listener would
simply not hear this frequency, even though the loudspeaker is functioning properly and there is an
abundance of 16 Hz energy in the room.
As a matter of interest, if the loudspeaker were a dipole design, it would be a velocity source, not a
pressure source, and therefore would couple most effectively to the mode if it were located at the velocity
maximum at the center of the room. This means that any room arrangement that is found to be flattering to
this type of loudspeaker will probably not work at all well for conventional loudspeakers - at least at low
frequencies.
Figure 9. A view of a listening room showing the
distribution of sound pressure and particle velocity
for the second-order mode, 2,0,0, along the length of
the room
At this frequency, the listener is in a
pressure minimum, and therefore will not hear 32
Hz. Obviously, if the customer wants to hear the
rumbling organ pedal note at the beginning of
“2001” (R. Strauss: Also Sprach Zarathustra), he
or she will be seriously disappointed.
Fortunately, a moment of analysis reveals that a
small movement of the chair, forward or back,
can solve the problem. In fact, it is generally a
good idea to calculate and plot out the pressure distributions for the first two or three modes, and locate
chairs to avoid any of the nulls.
SOUND PRESSURE
PARTICLE VELOCITY
AXIAL (LENGTH)
MODE 1,0,0
f = 1130 = 16 Hz
2 x 35.3
35’ 4”
+
-
SOUND PRESSURE
PARTICLE VELOCITY
AXIAL (LENGTH)
MODE 2,0,0
f = f x 2 = 32 Hz
35’ 4”
1,0,0
+
-
+
Harman International Industries Inc., 8500 Balboa Blvd., Northridge, CA 91329 (818) 893-8411
9
Figure 10. A view of a listening room showing the
distribution of sound pressure and particle velocity
for the first-order mode, 0,1,0, across the width of
the room
In this sketch, we can see a problem
and a solution at the same time. The problem
is that the listener is at a null in this, and every
odd-order modal frequency along this room
axis (i.e.28 Hz, 84 Hz, 140 Hz, etc.). The
solution is that the two woofers of the
loudspeakers are each located in a different
lobe of the standing wave pattern.
Now, at low frequencies it is usual for
the signals to be mono (the same in both channels). This is absolutely true of LP’s, where failure to
combine the bass would cause the stylus to be thrown vertically out of the record groove. In general it is
good practice because of mono compatibility issues. In home theater, there is a dedicated subwoofer
channel, so there is no option. In such a case, so long as there is one woofer in each of the left- and right-
hand lobes, this particular mode will not be energized. The reason is that the woofers are operating in-
phase, and the lobes need to be driven out-of-
phase because of their opposite polarity.
Figure 11. A view of a listening room showing the
distribution of sound pressure and particle velocity
for the second-order mode, 0,2,0 across the width of
the room.
Just as we were feeling comfortable,
here comes a situation to spoil our fun. At the
second-order mode frequency, the listener is in a
high pressure region, and the woofers are both in
lobes of the same polarity. This mode will
therefore be very effectively driven and heard. A
solution would be to move the woofers closer
together, towards the nulls. This will, of course
reduce the width of the stereo soundstage, which may not be welcomed. Here is another example where
having separate subwoofer(s) would be advantageous - they can be positioned for best bass, and the
satellites can be positioned for best imaging.
Figure 12. A view of a listening room showing the
distribution of sound pressure for the first-order
mode, 0,0,1, across the height of the room.
In two-channel stereo there is a “stereo
seat”, a “sweet spot” where the soundstage comes into focus. Multichannel systems can entertain several
listeners, meaning that, at least at low frequencies, everyone hears something different because of the way
they couple into the horizontal room modes. However, in the vertical direction, everyone is treated equally.
If there is a choice, it is probably wise to choose a ceiling height that does not place the ears at the half-way
point.
SOUND PRESSURE
PARTICLE VELOCITY
AXIAL (WIDTH)
MODE 0,1,0
f = 1130 = 28 Hz
2 x 20
20’ 0”
+
-
SOUND PRESSURE
PARTICLE VELOCITY
AXIAL (WIDTH)
MODE 0,2,0
f = f x 2 = 56 Hz
20’ 0”
0,1,0
+
-
+
AXIAL (HEIGHT)
MODE 0,0,1
f = 1130 = 56 Hz
2 x 10
10’

Harman International Industries Inc., 8500 Balboa Blvd., Northridge, CA 91329 (818) 893-8411
10
Figure 13 An illustration of how room boundaries
that have some low-frequency absorption, i.e.
flexure, can improve the uniformity of sound
distribution at the modal frequencies. This is
especially useful in home theater applications where
several listeners need to have a similar auditory
experience.
Acoustical absorption by the room
boundaries removes low-frequency energy from the
sound field. As was mentioned in discussions of
solid angles, this loss of energy to room structure,
and thus to adjacent rooms, reduces sound power that is contained in the listening room. While this could
be viewed as a disadvantage, making woofers work harder, it can also be viewed as a benevolent acoustical
factor. This absorption reduces the Q of the room modes, resulting in lower maxima and higher minimal
tones are described by the stylized curves in Figure 13. In rooms, the nulls are not perfect. Absorption also
controls reverberation at low frequencies, providing damping for room "booms". Diaphragmatic, or
membrane absorption in room boundaries is one of the few practical mechanisms acoustical absorption at
very low frequencies. Most popular add-on acoustical devices cease to be effective absorbers at the very
low frequencies where room resonances can be problematic.
2.2.3 Dealing with the Problem
Clearly, preferences in the bass balance of loudspeakers can be influenced by the choice of
listening and loudspeaker positions in the same listening room. Strong timbral variations are also
consequences of these differences. The listening room can even dominate the overall impression [14,15].
Since the basic physical mechanisms can, in many cases, be traced to combinations of room resonances and
adjacent-boundary interactions, some amount of control is possible.
There are few choices:
•
= Modify the acoustical coupling of the loudspeakers to the room boundaries and/or the room modes. i.e.
move the loudspeakers.
•
= Modify the acoustical coupling of the listener to the room boundaries and/or the room modes, i.e. move
the listener.
•
= Move both the loudspeakers and the listener.
•
= Modify the signal on the way to the loudspeakers, in the loudspeakers themselves, i.e. equalize.
•
= Acoustically modify the room, i.e. get out the hammers and saws.
Each of these options has restrictions and negative side effects, visual, acoustical and economical.
2.2.4 A "Real-world" Example
There is nothing more real than one's own personal world and I shall use as an example a serious
problem that I had to deal with in one of my own sound systems.
The example relates to a large living/dining room designed to be a fitting acoustical complement to
mainly classical music (another room was equipped for home theater and rock ’n roll). To that end this
room had a large volume (about 220 m
3
), a high cathedral ceiling, and irregular surfaces for good diffusion.
The loudspeakers were at one end of the room, and the listeners sat about 7.5 m away, close to the other
end. With good symphonic recordings, the effect was not unlike sitting well back in a concert hall. The
listening room seemed to become an extension to the recorded ambiance, without being such a contrast in
scale that it competed with it. With close miked, or multi-track recordings, the room provided much of the
acoustical setting. It was very enjoyable . . . but.
The Damping of Room Modes
Depends mainly on the acoustical absorption of
the major room surfaces: floor, walls, ceiling.
REFLECTING, i.e.
MASSIVE AND RIGID,
WALLS
WALLS WITH SOME
LOW-FREQUENCY
SOUND ABSORPTION,
i.e. FLEXURE
P
P
Harman International Industries Inc., 8500 Balboa Blvd., Northridge, CA 91329 (818) 893-8411
11
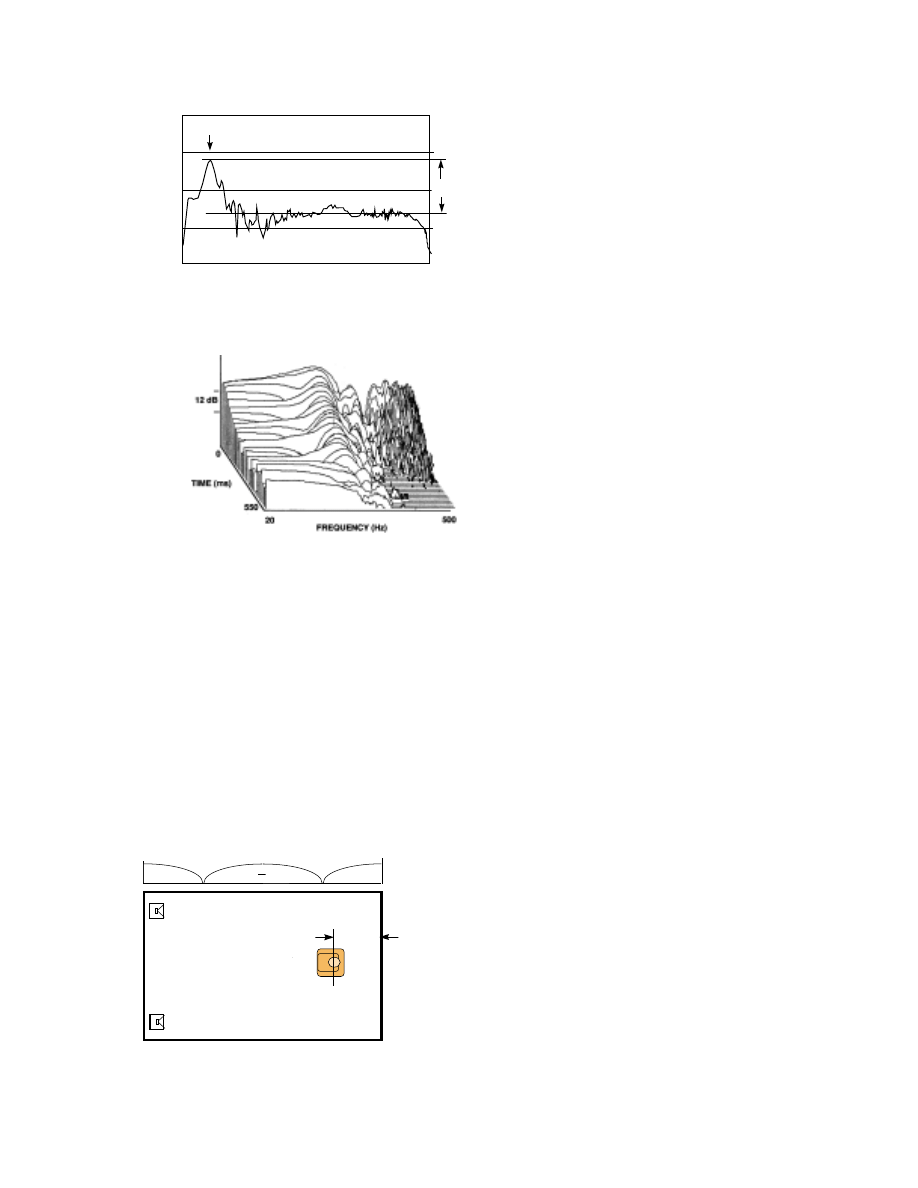
Figure 14. A measurement from loudspeakers to
listening position in a very large listening room.
The problem in the large room was
excessive low bass - too much of a good thing.
The 14 dB excess at 40 Hz had absolutely
nothing to do with the loudspeakers, which were
known to be very well behaved. Subjectively,
the bass was wrong from any point of view.
Sustained organ pedal and bass guitar notes were
truly overwhelming when they moved into the
range of the resonance. Impulsive sounds, like
kick drums, were indistinct and overly resonant.
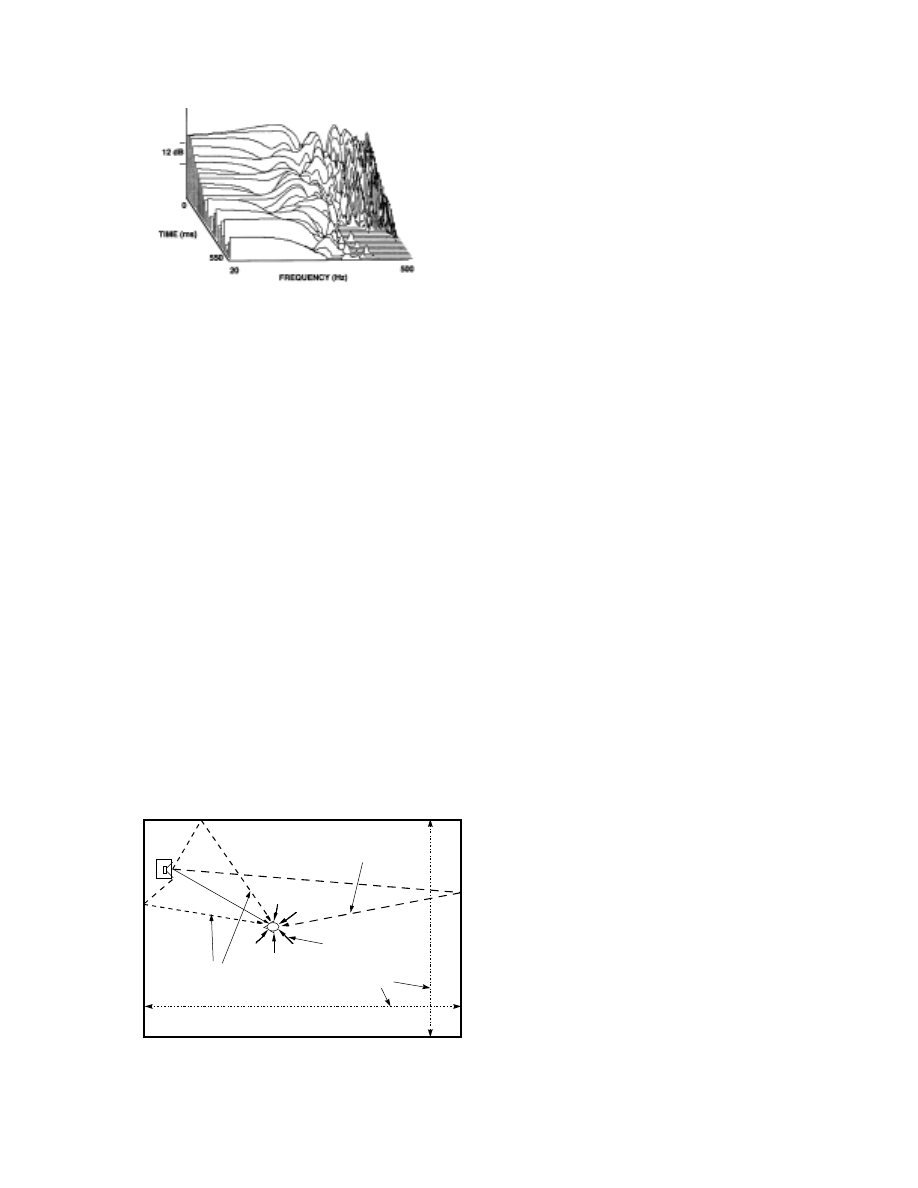
Figure 15. A three-dimensional view of the situation
depicted by Figure 14. In this “waterfall” display
resolution is limited to 25 Hz in the frequency domain
- i.e. each point on each curve represents an average
over a spread of 25 Hz. In the time domain, the
resolution is 40 ms.
The curve of Figure 14 tells us that
there is a powerful resonance around 40 Hz.
The height and width of the bump reveal that it
is a medium-Q resonance, and this means that it
will ring significantly. It is not necessary to look
into the time domain to confirm this. However,
since we can, let’s do it.
Figure 15 shows the very impressive and pretty “waterfall” diagram of amplitude vs. both time and
frequency. This looks only at the low frequencies of Figure 14, and it shows what would be expected: a
resonant peak around 40 Hz and a decaying resonant tail at that frequency. It doesn’t show it in full detail,
because it is a characteristic of such displays that there are compromises in resolution. For example, the
steady-state measurement in Figure 14 shows the amplitude vs. frequency response very accurately. In the
display of Figure 15, the peak shown at the back of the family of curves should be identical but, due to the
limited resolution, the peak is very considerably blunted. Likewise the time sequence of events is blurred.
Nevertheless, the point is made that, if there is evidence of a resonant peak in the frequency response, then
there will be ringing in the time domain. This is a law.
A quick calculation suggested that the problem was an overly active second-order mode along the
length of the room. For practical reasons it was not possible to relocate the loudspeakers, so a change in
listening position was explored. Originally, the listener was about 0.5 m from the back wall. Moving the
listener forward progressively reduced the bass excess until, at about 2 m from the rear wall, the problem
was acceptably subdued. At 2 m the ears are closer to the 1/4 wavelength null in the standing wave pattern
at 40 Hz. The solid angle that the listeners' ears "see" is also increased, and the low bass is correspondingly
attenuated.
Figure 16. A plan view of the room showing the
pressure distribution of the second-order length mode
(2,0,0), and the relocated listening position.
20 50 100 500 1K 5K 10K 20K
FREQUENCY (Hz)
dB
20
30
10
0
-10
14 dB!
0.5 m
MODE 2,0,0
ORIGINAL LISTENER POSITION
RESOLUTION:
25 Hz, 40 ms
+
+
+
+
2.0 m / 80”
Harman International Industries Inc., 8500 Balboa Blvd., Northridge, CA 91329 (818) 893-8411
12
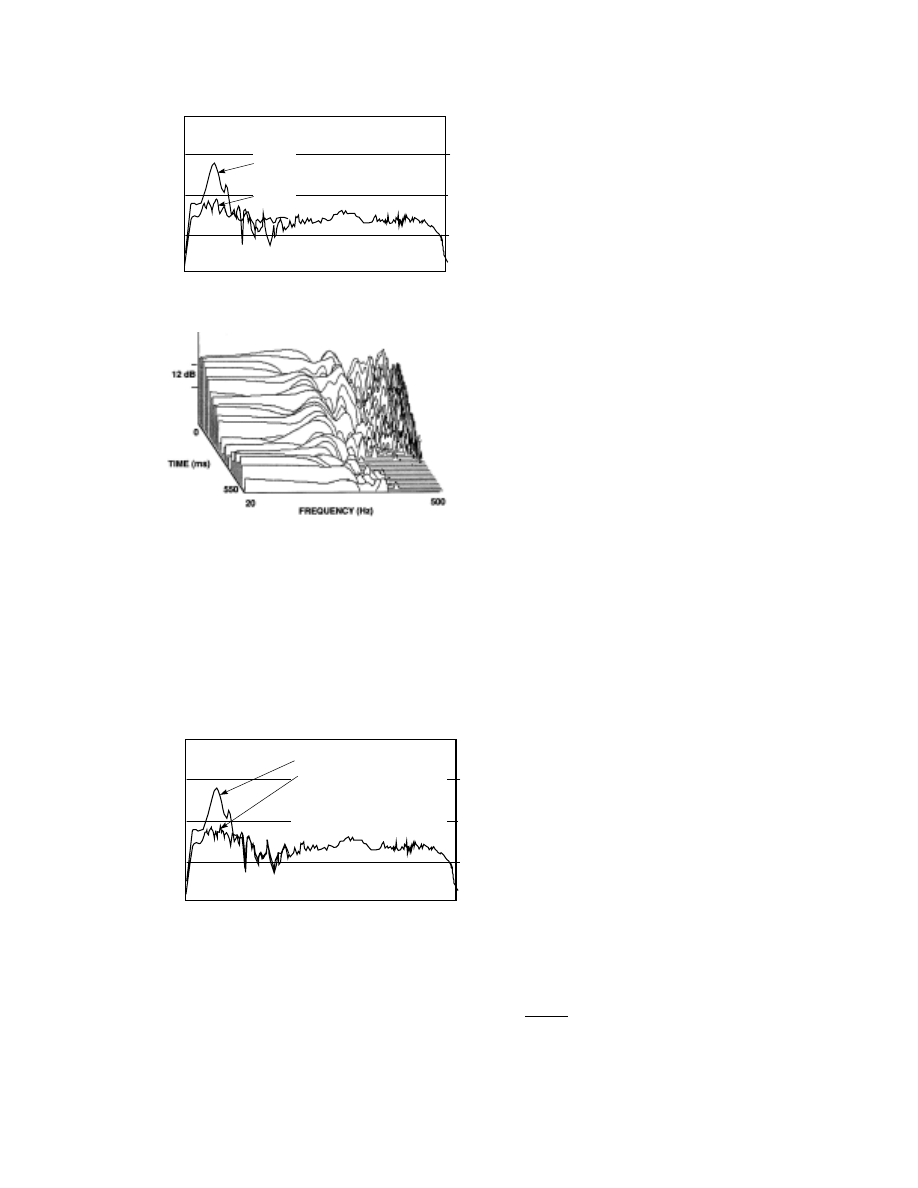
Figure 17. A comparison of before and after
measurements showing the dramatic improvement
resulting from moving the listener out of the powerful
high-pressure region of the second order length mode
in the room.
Figure 18. A “waterfall” plot of the situation after
listener relocation.
In Figure 17 it can clearly be seen that
immediately after TIME=0, moving towards
the front of the diagram, the sound level in the
vicinity of 40 Hz drops by about 12 dB. After
this, the ringing continues as before, but at a
much reduced level. All of this is logical
because, in moving the listener, we have not
eliminated the resonance, but we have reduced
the strength of the acoustical coupling to it.
Subjectively, the improvement was nothing less than dramatic. Organ pedal notes “walking “
down the scale were wonderfully even and powerful. Kick drums were distinct and conveyed dramatic
“punch”. String-bass notes were discrete and tuneful, having been relieved of the “one-note” bias of the
powerful 40 Hz resonance.
All, it seems, was well. However, we live in a practical world, and the constraints of living and
interior decor dictated that the listening chair could not live in the middle of the living room floor. Moving
the loudspeakers would have equally solved the problem, but for similar reasons, that was not an option.
What do we do? We reach for our trusty parametric equalizer, dial in the correct center frequency,
Bandwidth (Q), and attenuation and, behold, the frequency response problem is again fixed.
Figure 19. Measurements of the system with the
listener in the original location, but with one filter
of parametric equalization used to eliminate the
objectionable resonance.
Although this method appears to eliminate the resonance as well as did the listener relocation, it
should be noted that it did nothing else. Relocating the listener to eliminate the problem with one room
mode, put the listener in a different relationship with other modes - compare the previous curves (Figure 17)
in the 80 - 200 Hz region. Thus the two solutions will not sound exactly the same, although there should be
a similar improvement in terms of taming the 40 Hz room resonance. Let us check a waterfall diagram to
confirm this.
20 50 100 500 1K 5K 10K 20K
FREQUENCY (Hz)
dB
20
30
10
0
-10
0.5 m
2.0 m
20 50 100 500 1K 5K 10K 20K
FREQUENCY (Hz)
dB
20
30
10
0
-10
•Original Condition
•After Parametric
Equalization: One
Filter Only
Harman International Industries Inc., 8500 Balboa Blvd., Northridge, CA 91329 (818) 893-8411
13
Figure 20. A “waterfall” plot of the situation after
parametric equalization.
A comparison of the “corrected
frequency responses in Figures 17 and 19, and
those of the “corrected” waterfall plots in Figures
18 and 20, indicate more similarities than
differences. Both methods appear to have
successfully addressed the problem of the run-
away room mode. But . . . how does it sound? Which one wins - natural acoustics (relocation) or
electronics?
After extensive back and forth switching between the listener relocation and equalization cures, the
conclusion was that they both worked, and they worked about equally well. Much of the time it was
difficult to differentiate one from the other. However, there were times when a preference was evident. In
these cases, it was the equalized system that won. Why? Because with the equalizer in circuit the woofer
distortion was reduced. It was, after all, working far less, since the amplifier drive had been reduced by
more that a factor of ten at low frequencies. In general, though, listeners were struck more by similarities
than by differences. This is good, because now we have several ways to solve problems of this kind.
Both of these solutions addressed the specific problem and the changes outside of the frequency
range of interest were either beneficial, or negligible. Other methods could have been used, absorption
being one - damp the offensive mode. The problem with this is that most kinds of acoustical absorbers tend
to operate over quite wide bandwidths and, in addressing a problem in one narrow range of frequencies, the
devices will be removing energy at frequencies where there is no problem. In alleviating one difficulty
there is a risk of creating another.
2.3 ABSORPTION AND REFLECTION OF SOUND
It is impossible to talk about this subject without bringing into the conversation important details
about the loudspeakers themselves, specifically their directivities, and the nature of the system itself,
specifically whether it is a stereo system or a multichannel system, or both. If you are really picky, one can
also take into account the musical tastes of the customer, classical or popular, in designing the listening
experience.
Some of these will come up in the following sections, but for now it is important to understand
some fundamentals about the materials and devices that are used in our business. A good book on the
basics of this subject is Alton Everest’s “The Master Handbook of Acoustics” 3
rd
Edition [16].
Figure 27. Reflected sound in a room can be divided
into three general classes based on how long it takes to
arrive at the listener after a single reflection (early and
late reflections), and the spatial and temporal pattern of
arrival after multiple reflections (reverberation).
Flutter echo is a special case in which sounds reflect
back and forth between two parallel opposing surfaces.
With transient sounds this causes a “fluttering” sound
.
EARLY REFLECTIONS
REVERBERATION
LATE REFLECTIONS
FLUTTER

Harman International Industries Inc., 8500 Balboa Blvd., Northridge, CA 91329 (818) 893-8411
14
2.3.1 RESISTIVE ABSORPTION
Resistive absorbers remove energy from sound by making it do work in moving the air molecules
back and forth between and among the closely-spaced fibers of fabrics and fiberglass, or through the
openings of open-cell acoustic foam. Fabrics that you cannot blow air through (e.g. good cotton sheeting)
are useless, as are those (e.g. polyester double-knit, often used as grille cloth) that are so open that you can
easily see through them. Rigid fiberglass board is an excellent absorber, until the surface is closed by
painting or covering with the wrong kind of fabric. Thus we arrive at the fundamental concept of “flow
resistance”: to maximize the acoustic absorption, there is an optimum resistance to air flow.
The resistive material must also be in the right location. Since the mechanism is flow resistance,
these materials will obviously be most effective when located where molecular motion is at a maximum.
The Figures in Section 2.2.2 show sound pressure and particle velocity distributions for standing waves in
rooms. Suppose we wanted to try to damp an overly energetic axial mode using a resistive absorber. Using
the example shown in Figure 8, where would you place a 2-inch thick fiberglass panel to be most effective?
Attaching it to the wall would be useless, because the particle velocity - i.e. molecular motion - is
minimal. Nothing is moving much so nothing much happens. Moving it away from the wall improves
things, until we get to the middle of the room, and some serious damping occurs. Looking at the other low-
order / low-frequency modes in these figures lead to similar conclusions. At low frequencies it is simply not
practical to use resistive absorbers. As wavelengths get shorter, the regions of maximum particle velocity
get sufficiently close to the reflecting surfaces that materials of practical thickness, or drapes hung at normal
distances, will work. Thus we come to a rule that resistive absorbers are the devices of choice for absorbing
mid- and high-frequency sounds.
2.3.2 DIAPHRAGMATIC or MEMBRANE ABSORPTION
The most common membrane absorbers we encounter are the walls, floors and ceilings in rooms.
The proof that they are absorbers is that they vibrate in response to bass sounds; acoustical energy is
converted into mechanical energy. As luck would have it, conventional home construction, gypsum board
on 2” x 4” studs, is an effective low-frequency absorber - play some loud music and feel the walls. Double-
glazed windows are quite similar in their absorption properties, so we are off to a good start. The worst
possible rooms are those built in basements, with concrete floor and walls. Such rooms need to have false
walls built inside them. To improve on normal construction, I suggest two layers of gypsum board on some
(not necessarily all) surfaces, possibly with a layer of 1/2-inch “sound board” between (glue the three layers
together, using nails or screws only to hold while the adhesive sets).
Concrete floors are a problem for two reasons. First, they don’t absorb sound. Second, because
they don’t absorb sound, they don’t vibrate and supply the tactile sensation of bass through the soles of the
feet. In these cases, a false floor is a useful addition. Oh yes, leather upholstered furniture is also a
membrane absorber, and also provides vibratory sensations to stimulate the audience. H-m-m-m.
Obviously, it is possible to construct customized absorbers to address problems at specific
frequencies. Reference 16 has design aids for diaphragmatic absorbers (p.172). Remember to place them
at high-pressure points for the mode that is being damped.
2.3.3 DIFFUSORS, DIFFUSION AND CONFUSION
Diffusion refers to the degree of randomness in the directions of arrival of sounds at a point in
space. Diffusion in the sound field surrounding a listener in a concert hall is an absolutely essential
requirement. It is of some use in home theater rooms. It is of little use in stereo rooms.
In a concert hall, diffusion helps communicate all of the sound from all of the instruments on stage,
to all of the listeners in the audience. If there were total diffusion, listeners would not know where the
sounds are coming from, so there must be a balance among direct, reflected and diffuse sounds.

Harman International Industries Inc., 8500 Balboa Blvd., Northridge, CA 91329 (818) 893-8411
15
In a surround sound application, Dolby ProLogic requires low correlation in the sounds arriving at
the ears from the surround channel speakers in order to generate a sense of ambiguous spaciousness. In
THX systems, electronic decorrelation in the signals sent to the left and right surrounds helps, and
bidirectional out-of-phase “dipole” surround speakers can be of further assistance. The latter is an attempt
to increase the diffusion in the sound field. Acoustically “dead” rooms work against that effort, and
irregular reflective surfaces and objects in the room work with it. Unfortunately, the front channels really
need to “see” a relatively dead room, which creates a dilemma that has not been satisfactorily solved.
Dolby Digital / AC-3 and DTS multichannel music call for five identical channels and loudspeakers, thus
presumably calling for a relatively dead room. On the other hand, multichannel music might well be better
in a normally live room. Then there are systems like Logic-7 (found in Lexicon, JBL Synthesis and Harman
Kardon products) and Citation’s 6-axis that go directly to the core issue - five channels are not enough.
They add channels in the rear of the room. And so it goes. This issue is not settled yet.
Conventional two-channel stereo is another real dilemma. Here loudspeakers range from highly
unidirectional through multidirectional to omnidirectional. Each category requires different room treatment
and positions. Listener preferences cannot be ignored. Some like a large spacious illusion (a relatively live
room), others like pinpoint imaging (a relatively dead room).
A common compromise is to avoid the decision of whether to absorb or to reflect, and opt to
diffuse the sound with any one of the several available irregular reflecting devices. A diffuser is an
elaborate reflector, in that it sends any incoming sound off in many different directions. This is not a bad
idea, and diffusers have an important place in the repertoire of acoustical devices. Just remember that they
are still reflectors, and the sound energy is merely redirected. Stereo is a system in which fragile phantom
images are an essential part of the illusion. I have been in rooms where many dollars were spent on
diffusers which did little more than destroy the stereo image that every other device in the signal path
attempted to preserve. One can have too much of a good thing.
A simple test is to reproduce monophonic pink noise at equal levels through the stereo left and
right loudspeakers. For a listener on the axis of symmetry, the result should be a compact auditory image
midway between the loudspeakers. Moving the head slightly to the left and right should reveal a
symmetrical brightening, as the acoustical-cross talk interference is changed, and the stereo axis should
"lock in" with great precision.
3 LOUDSPEAKERS
Obviously the design of a state-of-the-art audio system must include the listening room and the
manner in which it is set up. The loudspeaker is an essential part of that “equation” and it is a part that is
frequently misunderstood. In the discussions up to this point we have focused on low frequency
communication between the loudspeakers and listeners. At middle and high frequencies loudspeakers and
rooms interact in different ways, and these need to be understood. Choosing the right loudspeaker can
make life a lot easier when it comes to positioning it and treating the interior of the room. Understanding
some key facts about loudspeakers in general makes mistakes much less likely.
3.1 WHAT IS GOOD?
LOUDSPEAKERS / REFLECTIONS / EQUALIZATION
Subjective evaluation is a massive subject in itself. Fortunately a lot of research work has been
done and published, much of it by the author [17,18,19]. Let me start by stating simply that, when listening
evaluations are done under controlled circumstances - i.e. identities concealed, loudness levels equalized,
room, listening arrangements, and program material known and constant - strong differences of opinion
among people tend to disappear. Most people, most of the time tell us that they like the same sounds, and
dislike the same sounds, for mostly the same reasons.
Obviously, there are some individual differences. The most serious is that those listeners with
hearing abnormalities are not good listeners. Hearing loss results in inconsistent and aberrant opinions.
Fortunately, at least 80 % of the population has hearing that is essentially normal, in this context.
Otherwise the main differentiating factor is experience. People who have never listened critically have
problems knowing what to listen for, and they may bring with them a lot of miscellaneous opinions - the
“baggage” of having listened to little else than mediocre televisions, boom boxes and car radios. Given
Harman International Industries Inc., 8500 Balboa Blvd., Northridge, CA 91329 (818) 893-8411
16
this, it is amazing how little practice these people require, in a reasonable context, before they settle down
to having opinions that make sense. Knowing this, nowadays we try to work with listeners we have trained,
who are practiced in knowing what to listen for and how to evaluate and comment on what they hear [20].
Wine tasters train themselves to recognize tastes and smells, and rely on blind tasting to form trustworthy
opinions. Why should audio be different?
An important confirmation of why this is a reasonable thing to do comes from studies in which
listener opinions have been correlated with physical measurements. The relationships make sense.
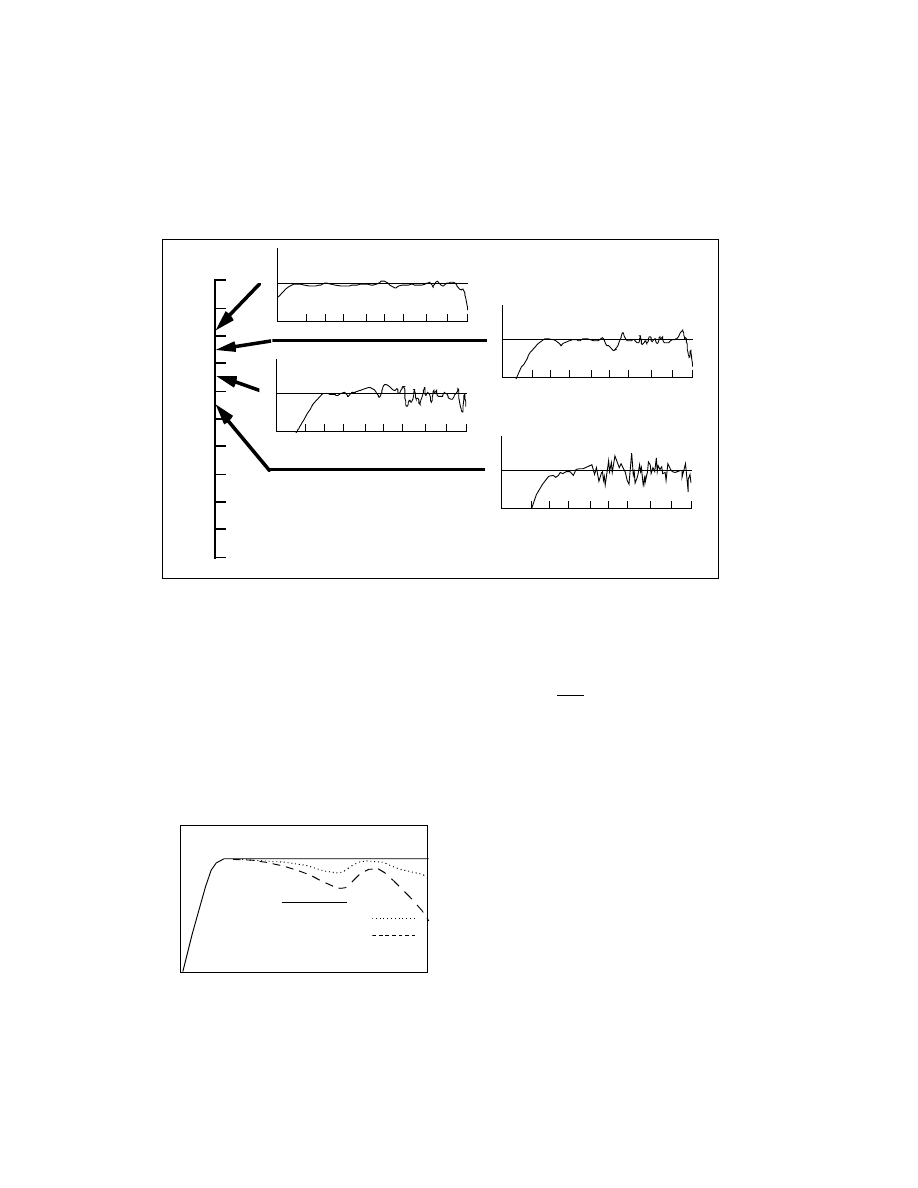
Figure 21. Representative on-axis frequency response measurements of loudspeakers that received different “fidelity
ratings” in scientifically-controlled listening tests.
The implications of this kind of result are enormous. Firstly, large numbers of people agree on
what they like. Secondly, the loudspeakers they like are the ones that have the most “ideal” , i.e. smooth
and flat on-axis frequency response. However, there is more. Having only a good axial response is not
enough. That this should be so, should not be surprising, because we do not listen in anechoic chambers.
Real rooms have reflecting boundaries and furnishings, which redirect off-axis sound radiated from
loudspeakers back towards the listener, sometimes after several reflections. Since the total amount of
energy arriving at the ears is dominated by these reflected and reverberant sounds, it is reasonable that they
should be timbrally similar to the direct (axial) sound. This means that the loudspeaker must also have
smooth off-axis behavior; in other words the loudspeaker should have constant directivity.
Figure 22. Stylized on- and off-axis measurements on an
8-inch two-way loudspeaker
In Figure 22 it can be seen that the 8-inch
woofer becomes quite directional before it is crossed over to the 1-inch tweeter in the region of 2-3 kHz
which, in turn, becomes directional at high frequencies. The directivity of the loudspeaker is not constant
meaning that, even when the loudspeaker is aimed directly at the listener, the “perfect” performance on the
10
9
8
7
5
4
3
2
1
0
6
FIDE
LITY
20 50 100 200 500 1K 2K 5K 10K 20K
FREQUENCY (HZ)
dB
+10
-10
20 50 100 200 500 1K 2K 5K 10K 20K
FREQUENCY (HZ)
dB
+10
-10
20 50 100 200 500 1K 2K 5K 10K 20K
FREQUENCY (HZ)
dB
+10
-10
20 50 100 200 500 1K 2K 5K 10K 20K
FREQUENCY (HZ)
dB
+10
-10
20 50 100 500 1K 5K 10K 20K
FREQUENCY (Hz)
dB
0
10
-10
-20
ON AXIS
30 DEGREES OFF AXIS
60 DEGREES OFF AXIS
8” woofer, 1” tweeter
Harman International Industries Inc., 8500 Balboa Blvd., Northridge, CA 91329 (818) 893-8411
17
design axis will be diluted by the timbrally colored off-axis sounds heard after reflection within the room.
This configuration is fundamentally flawed. It can never be as good as well-designed systems employing a
dedicated mid-range driver.
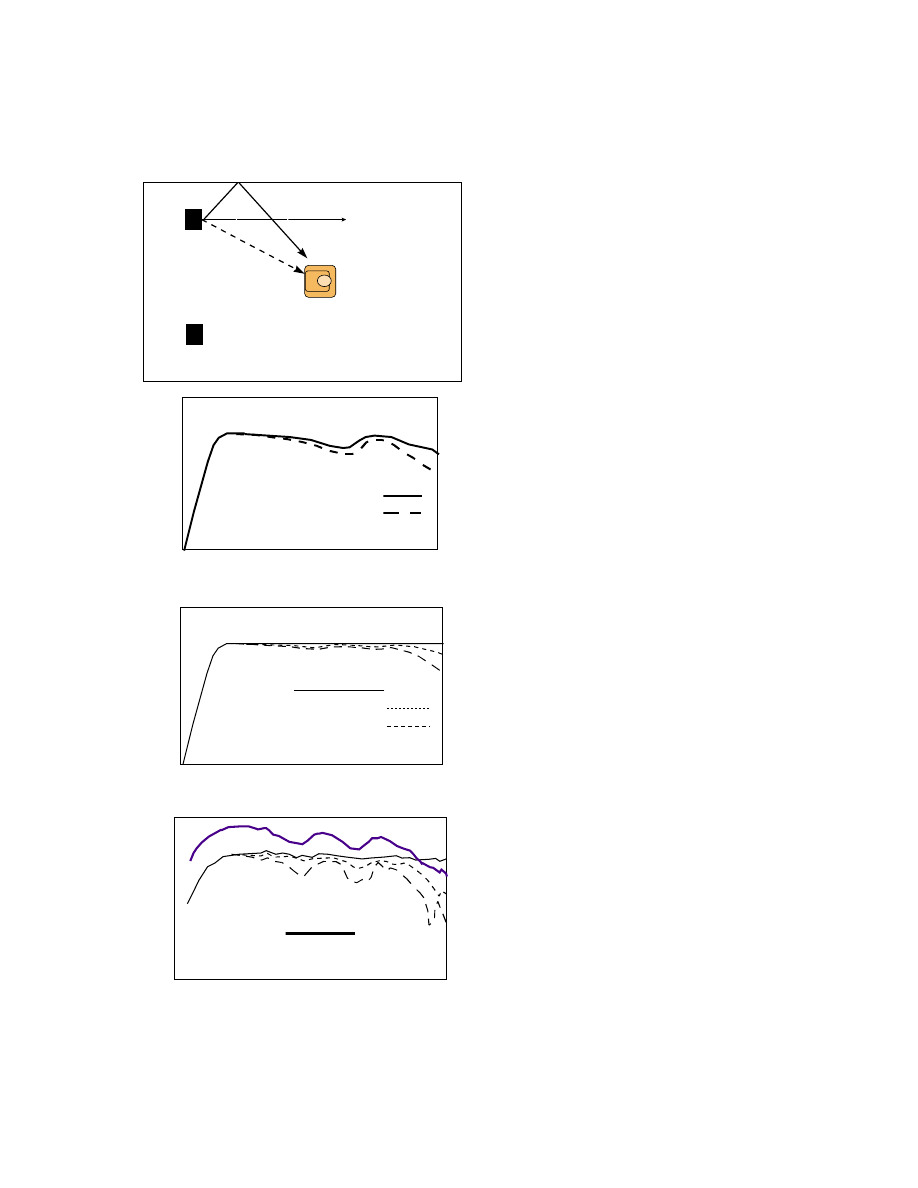
Figure 23. A room layout in which the loudspeakers
are facing directly forward, as happens in many home
stereos and custom installations. In this case the “best”
sound component misses the listener completely and is
lost in the general reverberant sound field in the room.
If the loudspeaker does not have constant directivity, the
system will take on a coloration related to how the
loudspeakers misbehave off axis.
Figure 24. Two of the first sounds to arrive at a
listener from the loudspeaker described in Figure 23.
Knowing this, we can conclude that most of the
remaining reflected sounds, arriving later, will be even
less good. This is a loudspeaker which cannot sound
neutral in a normal room, and which will take on
different timbral personalities, depending on position
and the acoustics of the listening space.
Figure 25. The design objective for a room friendly
loudspeaker. Practical examples can come remarkably
close to these targets.
Figure 26. An expensive three-way loudspeaker that
does not meet the design objective. Obviously a lot of
effort went into obtaining a smooth and almost flat
on-axis response. However, it is equally evident that
the designers thought little about off axis behavior.
The heavy curve at the top is a room curve, measured
at the listening location in a typical room. It is
obviously dominated by the off-axis misbehavior of
the loudspeaker. The loudspeaker sounds moderately
colored.
With respect to Figure 26, the question arises: “can we smooth out this room curve with an
equalizer and end up with better sound.?”
The answer is “Probably not”. For the reason, we must look
45 DEG. LEFT
30 DEG. RIGHT
DESIGN AXIS
20 50 100 500 1K 5K 10K 20K
FREQUENCY (Hz)
dB
0
10
-10
-20
30 DEGREES OFF AXIS
45 DEGREES OFF AXIS
8” woofer, 1” tweeter - parallel with rear wall
20 50 100 500 1K 5K 10K 20K
FREQUENCY (Hz)
dB
0
10
-10
-20
ON AXIS
30 DEGREES OFF AXIS
60 DEGREES OFF AXIS
10” woofer, 3” midrange, 0.5” tweeter
20 50 100 500 1K 5K 10K 20K
FREQUENCY (Hz)
dB
0
10
-10
-20
ROOM CURVE
Harman International Industries Inc., 8500 Balboa Blvd., Northridge, CA 91329 (818) 893-8411
18
back at Figure 21, showing the on-axis responses favored by listeners - they were all quite definitely in the
direction of smooth and flat. If we equalize the loudspeaker in Figure 26, we will have destroyed the only
good attribute it had - a smooth and flatish on-axis response. The cure, regrettably for owners of these
products, is a better loudspeaker.
3.2 SOME NOTES ABOUT MEASUREMENTS AND EQUALIZATION
The example in Figure 26 tells us that, without some key information about the loudspeaker,
equalization at middle and high frequencies is a high-risk venture. Sadly, the information one needs is not
commonly available. In fact, some manufacturers don’t even have it themselves and can’t measure it
accurately. If the loudspeaker is from a reputable source, it may simply be best to assume that they did their
job properly, and to avoid any form of equalization at frequencies above a few hundred Hz.
In fact, if the loudspeaker manufacturer has done a really competent job, there is nothing that can
be measured in the listening room that will enable any improvements to be made at middle and high
frequencies. To some this may appear to be a bold assertion, now that clever time-gated measurement
systems (like MLSSA and TEF) the are now available. To them I offer this small example.
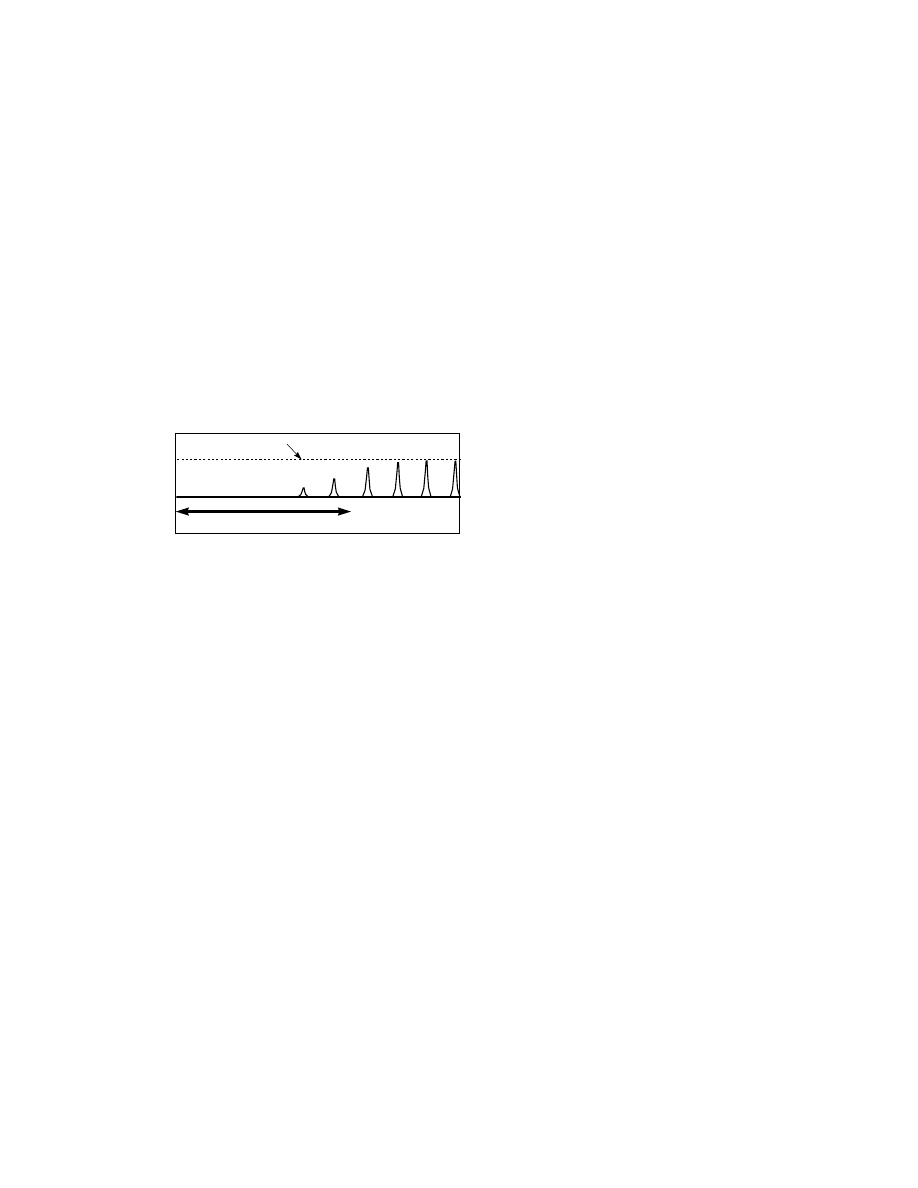
Figure 27. Measurements made in a very large
room with the loudspeaker and microphone
suspended close to the middle of the space, giving
an “anechoic” interval of 17 ms before the first
reflection. Given the need to measure at a
distance of at least 6 feet, such a large interval is
not likely to be possible in any domestic room.
This time window translates into a frequency
resolution of about 60 Hz, and this in turn results
in the inability of the measuring system to reveal
the presence of audible high-Q problems at
frequencies below about 3 kHz. In the test, the
high-Q resonance was present at intervals all the way down to 20 Hz, but the measurement system cannot see them all.
Many manufacturers and most product reviewers function with measurements less capable than this. This is one
reason why anechoic chambers are not obsolete.
At low frequencies we know that we can, and sometimes must, equalize and, since we are looking
for steady-state measurements, time windowing is not necessary. In fact we want a long measurement
interval. The tale told in Section 2.2.4 indicates clearly that equalization can work very well. However,
there are some cautions. Attenuation of excessive levels appears to be very safe, but avoid trying to fill
deep holes. A narrow dip is probably caused by a null in a standing wave or interference pattern. As such it
is the acoustical equivalent of a bottomless pit - it cannot be filled. Narrow dips are difficult to hear in any
event, and all that will happen if you dial in a lot of gain is that the amplifiers will have reduced headroom,
and the loudspeakers will be working harder to no avail. The result will be increased distortion.
Obviously, measurements should be made using proper instrumentation. This does not mean the
“classic” fixed-frequency 1/3-octave real-time analyzer with dancing lights and overlapping (i.e. cheap)
filters. These things may be entertaining, but they are not useful measuring instruments in this context.
Nowadays there are several computer-based alternatives, such as MLSSA, LMS, JBL SMAART, TEF
which can do remarkably better things. Even the inexpensive systems are quite adequate.
At the basis of this is the need to be able to measure what we are able to hear. Studies show that
listeners are very sensitive to resonances - in loudspeakers themselves as well as in rooms [21]. It is
therefore important to be able to identify the presence and significance of resonances of all kinds. Since we
are able to hear high-Q (narrow bandwidth) resonances, measurements must have adequate resolution or
they will not be revealed. It can be said, flatly, that 1/3-octave resolution is not enough.
Make sure that it is possible to do spatial averaging, wherein you can make measurements at a
number of locations, say four or five, within the listening area and then average the results. This useful
method helps to identify the resonances, and to avoid being misled by the effects of acoustical interference.
20 50 100 500 1K 5K 10K 20K
FREQUENCY (Hz)
dB
0
10
True Level
Measurement of a Q=50 resonance at the threshold of
audibility using a time window of 17 ms (60Hz)
CANNOT MEASURE WHAT WE HEAR

Harman International Industries Inc., 8500 Balboa Blvd., Northridge, CA 91329 (818) 893-8411
19
It also gets rid of a lot of the “grass” one sees in high-resolution room measurements. If you want to smooth
the curve, do so, carefully, after the measurements are made and averaged - not before.
3.4 SUBWOOFERS AND CROSSOVERS
Conventional woofers are either closed-box or vented-box (bass reflex or coupled-cavity) designs,
and they can safely be assumed to be omnidirectional at frequencies below about 100 Hz. This means that
they can be pointed in any direction, and the sound will reach the listeners equally well, but it does not
mean that their position cannot be localized by listeners. It is really annoying to be aware of the bass
frequencies coming from a location that is disassociated from the rest of the sound.
Fortunately, this is easily avoided. The easy way is to place the subwoofer(s) in the same plane as,
and close to the front loudspeakers. If the subwoofers must be located far away from the front
loudspeakers, it will be necessary to ensure that the sound output above 70 to 80 Hz is attenuated very
rapidly. If not, our keen ears will zero in on the location of the woofer. This will require an electronic
crossover with steep slopes (18 to 24 dB/octave).
The first requirement is to have enough bass. This will determine the number and size of
subwoofers. The second requirement is to see that all of the key listeners hear similarly good bass. Play
repeating loops of various kinds of bass instrumentation and pink noise, and move around the listening area.
Listen for hot spots and gaps in the coverage. Since the performance is so intimately bound up with room
acoustics this is a situation demanding experimentation.
Always start with the subs as close to the corners as possible to take advantage of solid-angle
gains. If you get too much bass and you have an equalizer, make the necessary measurements and dial in
some attenuation. The result will be lower distortion and higher reliability. If the excessive bass is at one
or more discrete frequencies, then it might be necessary to consider dealing with room modes. And then the
serious fun begins.
4 CONCLUSION
This paper was inspired by, and partly based on, one that I wrote in 1990 called “Loudspeakers
and Rooms for Stereophonic Sound Reproduction” [22]. All of that paper is still valid, and it is probably
worth a read for the content that is not included here. Still, it is interesting to reflect on what has changed in
our industry since then. Digital multichannel audio is a reality, and there is even a choice of systems.
Storage devices, like DVD, are revolutionizing our view of data storage and recovery. High resolution
video sources and computer “convergence” are looming. It is remarkable.
Still, the big problems in getting good sound then are still the same now - loudspeakers and rooms.
Our tools are better though. There are really powerful, affordable, computer-based measuring systems
allowing us to more easily identify problems in the field. This is true back in the lab too and, as a result,
loudspeakers are getting better. DSP chips can generate time delays and complex filters that can address
residual problems in the loudspeakers themselves, as well as in the room after they are installed.
We have more scientific knowledge about the relationships between what we measure and what we
hear so that more of our effort can be focused on getting results than on guessing what the target might be.
The dream of the psychoacoustically optimized adaptive system is just over the horizon.
Yes, there has been progress. But, we are not quite there yet. To be continued.
April 1997. Rev.03/05/00.
5 REFERENCES
[1] M. M. Louden, “Dimension-Ratios of Rectangular Rooms with Good Distribution of Eigentones”,
Acustica, vol. 24, pp. 101-104 (1971).

Harman International Industries Inc., 8500 Balboa Blvd., Northridge, CA 91329 (818) 893-8411
20
[2] O. J. Bonello, “A New Criterion for the Distribution of Normal Room Modes”, J. Audio Eng. Soc.,
vol. 19, pp. 597-606 (1981 September).
[3] J. M. van Nieuwland, “Eigenmoes in Non-Rectangular Reverberation Rooms”, Noise Control
Engineering, vol. 13, pp. 112-121 (1979 November/December).
[4] E. R. Geddes, “An Analysis of the Low Frequency Sound Field in Non-Rectangular Enclosures Using
the Finite Element Method”, Ph.D. Thesis, Pennsylvania State University (1982).
[5] R. F. Allison, “The Influence of Room Boundaries on Loudspeaker Power Output”, J. Audio Eng.
Soc., vol. 22, pp. 314-319 (1974 June).
[6] R. F. Allison, “The Sound Field in Home Listening Rooms, II”, J. Audio Eng. Soc., vol. 24, pp. 14-19
(1976 January/February).
[7] R. V. Waterhouse, “Output of a Sound Source in a Reverberant Sound Fields”, J. Acoust. Soc. Am.,
vol. 27, pp. 247-258 (1958 March).
[8] R. V. Waterhouse, “Output of a Sound Source in a Reverberation Chamber and other Reflecting
Environments”, J. Acoust. Soc. Am., vol. 30, (1958 January).
[9] R. V. Waterhouse and R. K. Cook, “Interference Patterns in Reverberant Sound Fields II’, J. Acoust.
Soc. Am., vol. 37, pp. 424-428 (1965 March).
[10] F. E. Toole, “Listening Tests, Turning Opinion Into Fact”, J. Audio Eng. Soc., vol. 30, pp. 431-445,
(1982 June).
[11] K. O. Ballagh, “Optimum Loudspeaker Placement Near Reflecting Planes”, J. Audio Eng. Soc., vol.
31, pp. 931-935 (1983 December). See also Letters to the Editor, J. Audio Eng. Soc., vol. 31, p. 677 (1984
September).
[12] A. R. Groh, “High-Fidelity Sound System Equalization by Analysis of Standing Waves”, J. Audio
Eng. Soc., vol. 22, pp. 795-799 (1974 December).
[13] F.E. Toole, “Principles of Sound and Hearing”, in K. B. Benson, ed. “Audio Engineering Handbook”,
chap. 1 (McGraw-Hill, New York 1988).
[14] P. L. Schuck, S. Olive, J. Ryan, F. E. Toole, S Sally, M. Bonneville, E. Verreault, Kathy Momtahan,
"Perception of Reproduced Sound in Rooms: Some Results from the Athena Project", pp.49-73,
Proceedings of the 12th International Conference, Audio Eng. Soc. (1993 June).
[15] S.E. Olive, P. Schuck, S. Sally, M. Bonneville, “The Effects of Loudspeaker Placement on Listener
Preference Ratings”, J. Audio Eng. Soc., Vol. 42, pp. 651-669 (1994 September).
[16] F. Alton Everest, “The Master Handbook of Acoustics” 3
rd
Edition (TAB Books/McGraw-Hill Inc.,
1994).
[17] F. E. Toole, “Loudspeaker Measurements and Their Relationship to Listener Preferences”, J. Audio
Eng. Soc., vol. 34, pt. 1, pp. 227-235 (1986 April), pt. 2, pp. 323-348 (1986 May).
[18] F. E. Toole, “Subjective Evaluation”, in J. Borwick, ed. “Loudspeaker and Headphone Handbook”,
Second Edition, chapter 11, Focal Press, Oxford (1994).
[19] F.E. Toole and S.E. Olive, "Hearing is Believing vs. Believing is Hearing: Blind vs. Sighted Listening
Tests and Other Interesting Things", 97th Convention, Audio Eng. Soc., Preprint No. 3894 (1994 Nov.).
[20] S. E. Olive, "A Method for Training of Listeners and Selecting Program Material for Listening Tests",
97th Convention, Audio Eng. Soc., Preprint No. 3893 (1994 November).
[21] F. E. Toole and S. E. Olive, “The Modification of Timbre by Resonances: Perception and
Measurement”, J. Audio Eng. Soc., vol. 36, pp. 122-142 (1988 March).
[22] F. E. Toole, “Loudspeakers and Rooms for Stereophonic Sound Reproduction”, Proceedings of the
Audio Eng. Soc. 8
th
International Conference, “The Sound of Audio”, pp. 71-91 (1990 May).
Document Outline
- 1 THE OBJECTIVES
- 1.1 Cause and Effect in Loudspeaker/Room Combinations
- 2.1 DIMENSIONS AND PROPORTIONS
- 2.1.1 THE "IDEAL' ROOM
- 2.2 Loudspeaker and Listener Positions
- 2.2.1 Interactions with Adjacent Room Boundaries
- 2.2.2 Interaction with Room Modes
- 2.2.3 Dealing with the Problem
- 2.2.4 A "Real-world" Example
- 2.3 ABSORPTION AND REFLECTION OF SOUND
- 2.3.1 RESISTIVE ABSORPTION
- 2.3.2 DIAPHRAGMATIC or MEMBRANE ABSORPTION
- 2.3.3 DIFFUSORS, DIFFUSION AND CONFUSION
- 3 LOUDSPEAKERS
- 3.2 SOME NOTES ABOUT MEASUREMENTS AND EQUALIZATION
- 3.4 SUBWOOFERS AND CROSSOVERS
- 4 CONCLUSION
- 5 REFERENCES
Wyszukiwarka
Podobne podstrony:
Loudspeaker And Listener Positions For Optimal Low Frequency Spatial Reproduction In Listening Rooms
Taking it apart and getting it together
Unit 1 Principles SAFE, HYGIENIC AND SECURE WORKING ENVIRONMENTS IN HOSPITALITY
Skin and brain age together
Lynge Odeon A Design Tool For Auditorium Acoustics, Noise Control And Loudspeaker Systems
Loudspeaker Installation Methodes And Connection Techniques
Healing Together How to Bring Peace into Your Life and the World
Working Women and?mily Life
davenport lyons and kornmeier monetary and working correspondence
Cosmic Workings In?rth and Man
20090202 01 Together?ghan National Police and Coalition Forces rescue a?ptive in Khowst
Latour Visualisation and Cognition Drawing Things Together
Working in Norwegian Agriculture and with seasonal work april 2015
I van Baalen Male And Female Language Growing Together
AES Recommended Practice Specification Of Loudspeaker Components Used In Professional Audio And Soun
Loudspeaker Handbook And Lexicon (Winslow Burhoe)
więcej podobnych podstron