
Journal of Sound and <ibration (2000) 232(1), 79}100
doi:10.1006/jsvi.1999.2686, available online at http://www.idealibrary.com on
MEASURED EARLY LATERAL ENERGY FRACTIONS
IN CONCERT HALLS AND OPERA HOUSES
M. B
ARRON
Department of Architecture and Civil Engineering, ;niversity of Bath,
Bath BA2 7A>, England
(Accepted 30 June 1999)
In the 30 years since early lateral re#ections were "rst suggested as important for
concert halls, spatial impression and source broadening have become almost
universally accepted as essential characteristics of halls with good acoustics. Two
objective measures of source broadening have been proposed. Measured values of
the best de"ned of these measures, the early lateral energy fraction (¸F), are
considered here. Results from two independent measurement surveys are discussed.
Comparisons of ¸F values by hall show a signi"cant link between hall mean ¸F
and hall width. There is however considerable overlap between measured ¸F
values in di!erent halls so the relevance of describing halls by their mean early
lateral energy fraction values is questionable. The behaviour of ¸F values within
auditoria is discussed for di!erent concert hall plan forms and within opera houses.
A measure of source broadening including sound level is proposed and results
considered in the context of auditorium design.
2000 Academic Press
1. INTRODUCTION
During the 1960s, several acousticians felt that design form was of only
minor importance for concert hall acoustics and that most shapes could be made
to work well acoustically. Marshall [1] contested this view with the suggestion
that some design forms worked better than others and that the secret lay in early
lateral re#ections. Experiments using simulation apparatus in an anechoic
chamber [2] showed that the e!ect, labelled &&spatial impression'' at the time,
was related to the proportion of early sound energy arriving from the side. The
objective measure "nally proposed [3] was the early lateral energy fraction
(¸F), which was also thought to be linearly related to the subjective e!ect. It was
de"ned by
¸
FA"
p
(t) cos dt
p
(t) dt,
(1)
where p(t) is received acoustic pressure and t is the arrival time after the direct
sound. The listener is assumed to be facing the source and
is the angle of incident
sound to the axis passing through the listener's ears.
0022-460X/00/160079#22 $35.00/0
2000 Academic Press

Figure 1. Microphone directivities and orientation for measurement of the lateral fraction.
As indicated in equation (1), subjective experiment showed the directional
sensitivity for energy to be proportional to cos
. To measure the fraction,
a microphone with variable directivity with both an omni-directional and
"gure-of-eight characteristic is generally used. The null of the "gure-of-eight is
pointed towards the source; see Figure 1. However, a "gure-of-eight microphone
has a directional characteristic with pressure proportional to cos
, so that for
a measured lateral fraction
¸
F"
p
(t) cos dt
p
(t) dt
"
Early energy from figure-of-eight microphone from 5 to 80 ms
Early omni-directional energy from 0 to 80 ms
.
(2)
For the lateral fraction at a seat position, the mean of values in octave bands at
125, 250, 500 and 1000 Hz is used. To distinguish the subjective from the measured
lateral fraction, the former has the su$x c. The values for each measure in a di!use
"eld are: ¸F
A
"
0)50 and ¸F"0)33. Reference to the di!use "eld o!ers the simplest
solution for conversion from one type of lateral fraction to another:
¸
FA"1)5;¸F.
80
M. BARRON

Since Marshall's original suggestion, spatial impression has become almost
universally accepted as a characteristic of good concert halls. More recently, it has
been suggested that spatial impression encompasses two spatial e!ects: source
broadening and envelopment (see section 1.2). An alternative objective measure for
spatial impression based on cross-correlation has also been used by many (see
section 1.3).
This paper considers lateral fraction measurements made in 17 British music
spaces and 13 North American halls. Details of the British halls are given in Table 1;
plans and sections, photographs and discussion of their acoustics can be found in
reference [4]. The data for North American halls came from a report by Bradley
[5], which contains all the measured data on #oppy disk. Details of the halls
measured are listed in Table 2; several halls are described in reference [6].
1.1.
SPATIAL IMPRESSION, SOURCE BROADENING AND ENVELOPMENT
As already mentioned, the spatial e!ect of lateral re#ections was initially called
&&spatial impression''. This was generally considered to be associated with early
re#ections though it was clear that later reverberant sound also created a spatial
e!ect that was di!erent in character from that associated with early re#ections. The
term &&envelopment'' was also used and considered synonymous with spatial
impression.
In 1993, Morimoto and Iida [7] proposed that envelopment might be linked to
the front/back energy ratio (further elaborated in reference [8]). Two years later,
Bradley and Soulodre [9] suggested that there were two distinct spatial e!ects. The
early sound produced the sense that the source size increased while the later sound
alone was able to provide the sense of being surrounded by sound. In other
words, spatial impression encompassed two sensations: source broadening and
envelopment. Source broadening can be quanti"ed in terms of an apparent source
width (ASW); the corresponding acronym for envelopment is LEV, for listener
envelopment. Bradley and Soulodre used a temporal cut-o! between ASW and
LEV as 80 ms after the direct sound and have proposed the late lateral sound level
as a measure for listener envelopment [10].
In the literature before 1990, spatial impression generally refers to what we now
call source broadening. The discussion in this paper will be limited to source
broadening produced by early re#ections. The term spatial impression will be used
here only when spatial e!ects in general are being considered.
1.2.
EARLY LATERAL ENERGY FRACTION VERSUS INTERAURAL CROSS-CORRELATION
From the beginning there have been two objective measures which are
considered relevant to source broadening: the early lateral energy fraction and
cross-correlation
measures
Regarding
the
latter,
the
interaural
cross-correlation coe$cient (ICC) is most commonly used nowadays. Both
measures have their advocates who defend the superiority of their preferred
measure, see e.g., reference [12]. Both measures are de"ned in the 1997 ISO
EARLY LATERAL ENERGY FRACTIONS IN MUSIC AUDITORIA
81

T
ABLE
1
Basic details of the 17 British concert spaces; the second number under 00Seating capacity11 refers to choir seating
Hall
Label
Year of
Seating
Volume
Mean width
Plan form
completion
capacity
(m
)
(m)
Royal Festival Hall, London
F
1951
2645#256
21950
32
Parallel-sided
Royal Albert Hall, London
A
1871
4670#419
86650
47
Queen Elizabeth Hall, London
Q
1967
1106
9600
23
Parallel-sided
Barbican Concert Hall, London
R
1982
2026
17750
34
Wigmore Hall, London
G
1901
544
2900
13
Parallel-sided
Fair"eld Hall, Croydon
C
1962
1539#250
15400
26
Wessex Hall, Poole
P
1978
1473#120
12430
30
Parallel-sided
Colston Hall, Bristol
B
1951
1940#182
13450
22
Parallel-sided
St. David's Hall, Cardi!
D
1982
1687#270
22000
34
Assembly Hall, Watford
W
1940
1586
11600
22
Music School Auditorium, Cambridge
S
1977
496
4100
20
Parallel-sided
Royal Concert Hall, Nottingham
N
1982
2315#196
17510
26
Free Trade Hall, Manchester
M
1951
2529
15400
22
Philharmonic Hall, Liverpool
L
1939
1767#184
13560
27
Parallel-sided
Usher Hall, Edinburgh
E
1914
2217#333
16000
29
Conference Centre, Wembley
Y
1976
2511
24000
50
Fan-shape
Butterworth Hall, Warwick University
K
1981
1152#177
12100
30
Parallel-sided
82
M.
BARRON

T
ABLE
2
Basic details of the 13 North American halls surveyed by Bradley [5]
Hall
Label
Year of
Seating
Volume
Mean width
Plan form
completion
capacity
(m
)
(m)
EJ Thomas Performing Arts Hall,
a
1973
2969
19 800
42
Fan-shape
Akron, OH, U.S.A.
Joseph Meyerho! Symphony Hall,
m
1982
2465
21 500
31
Baltimore, MD, U.S.A.
Boston Symphony Hall, Boston,
b
1900
2631
18 740
24
Parallel-sided
MA, U.S.A.
Kleinhans Music Hall, Bu!alo, NY,
k
1940
2839
18 220
43
Fan-shape
U.S.A.
W. Manitoba Centennial Auditorium,
r
1969
867
12 390
28
Fan-shape
Brandon, Manitoba, Canada
Severence Hall, Cleveland, OH, U.S.A.
c
1931
1890
15 700
28
Orchestra Hall, Detroit, MI, U.S.A.
d
1919
2022
15 700
27
Tanglewood Music Shed, Lenox,
l
1938
5121
42 450
57
Fan-shape
MA, U.S.A.
Academy of Music, Philadelphia,
p
1857
2984
15 720
27
PA, U.S.A.
Troy Music Hall, Troy, NY, U.S.A.
t
1875
1255
11 320
30
Parallel-sided
Kennedy Center Concert Hall,
s
1971
2759
19 300
28
Parallel-sided
Washington, DC, U.S.A.
Manitoba Centennial Auditorium
g
1966
2304
28 750
31
Fan-shape
Winnipeg, Manitoba, Canada
Mechanics Hall, Worcester,
w
1857
1400
10 760
25
Parallel-sided
MA, U.S.A.
EARLY
LATERAL
ENERGY
FRACTIONS
IN
MUSIC
AUDITORIA
83

Standard 3382. The early lateral energy fraction was proposed as a practical
measure for use in music auditoria. Yet it is clear that spatial impression is caused
by diferences between the signals at the two ears; a situation with identical
re#ections from each side has a lateral fraction but produces no spatial e!ect. In this
respect the ICC is superior, but identical signals at the two ears are not signi"cant
in practice and can be avoided in measurements in symmetrical halls by not having
both the source and receiver on the line of symmetry.
The interaural cross-correlation coe$cient is the maximum value of the
normalized cross-correlation function in the time interval $1 ms. But whereas the
early lateral energy fraction was de"ned from the start in terms of octave-band
measurements and microphones with particular directivities, there has been no
such unanimity regarding measurement of ICC. Many researchers have used
a single measurement with a broadband signal, Ando [13] for example. Some apply
A-weighting, some do not. Some measure with dummy heads at the ear drum, some
at the entrance to the ear canal. Some measure in octave bands and average the
results.
Theoretical analysis [14] suggests that ¸FA and ICC are related by:
¸
FA"(1!ICC)/k,
(3)
where k is determined by the autocorrelation function of the source signal.
Analysis also shows that the autocorrelation function is linked to the variation
of the ICC with re#ection direction. This suggests that most broadband
measurements are unlikely to represent the correct directional sensitivity for lateral
re#ections.
Blauert [15] and colleagues have proposed a model for our hearing system to
extract source broadening. This works with many frequency bands being processed
in parallel. Thus measurements of ICC in several frequency bands, such as octave
bands, looks preferable to broadband measurements. But there is the problem that
at low frequencies the ICC hardly varies, whereas these frequencies seem important
for source broadening (see section 3.3).
Bradley [16] has made parallel measurements in 14 halls of both ¸F and ICC,
each measured in octave bands. He found support for a relationship such as
equation (3) when mean hall data is used. However the scatter with individual
position measurements was high.
2. MEASUREMENT PROCEDURES
Both measurement surveys used omni-directional loudspeakers at a central
position close to the front of the stage and with microphones of variable directivity
placed at ear height. The 17 unoccupied British halls were measured with an
average of 11 microphone positions per hall. The source was placed 3 m from
the stage front. The British survey used single-cycle sine pulses as signals
with the impulse responses being recorded on analogue tape. The microphone
used was an AKG C414EB; careful calibration of the relative sensitivities of
the two directivities is needed with this sort of microphone. The responses were
84
M. BARRON

T
ABLE
3
Measured early lateral energy fraction and measurement data
British concert halls
American concert halls
Di!use
Mean ¸F
0)19
0)15
0)33
Standard deviation
0)085
0)056
*
Number of halls tested
17
13
*
Number of results
189
138
*
Number of fan-shaped halls
1
5
*
analyzed by computer to produce results in the four octaves between 125 and
1000 Hz. Further details about the measurement procedure are given in
reference [17].
Bradley's measurement technique in 13 American halls [5] used maximum
length sequence signals processed by fast Hadamard transform. Bradley measured
with three source positions on stage, but for the results reported here only values
for the central source have been used. The central source position was
approximately 2 m from the stage front. For compatibility, values for the octaves
125}1000 Hz alone were used.
3. COMPARISON OF LATERAL FRACTIONS IN THE TWO CONCERT
HALL DATA SETS
3.1.
MEAN ¸F VALUES
The mean values of the early lateral energy fractions are shown in Table 3 as 0)19
for the British halls and 0)15 for the American data. Both these values are
signi"cantly less than the theoretical value for a di!use sound "eld of 0)33. The
presence of the direct sound is a major reason for the mean being below the di!use
value.
Values in British halls are slightly higher on average. With only 17 British halls
and 13 American halls, a lack of complete randomness in the range of hall shapes
tested is to be expected. The average age of the American halls is greater: with an
average year of completion of 1929 compared with 1953. One obvious di!erence is
the number of fan-shaped plan halls; these halls tend to have low values of the
lateral fraction. Whereas there was one fan-shaped plan among the British halls,
there were "ve in the American survey. In addition, two halls in Britain had
particularly high lateral fractions (Usher Hall, Edinburgh, and the Free Trade Hall,
Manchester).
There are further di!erences between British and American halls associated with
the stage arrangements. Many of the American halls, namely six out of 13, are
multi-purpose to the extent that they have #ytowers and use an orchestral
enclosure for concerts. At the stage end this introduces a fan shape in both plan and
section. On the other hand, none of the British halls have #ytowers or orchestral
enclosures. Ten of the 17 British halls have choir seating behind the orchestra
EARLY LATERAL ENERGY FRACTIONS IN MUSIC AUDITORIA
85
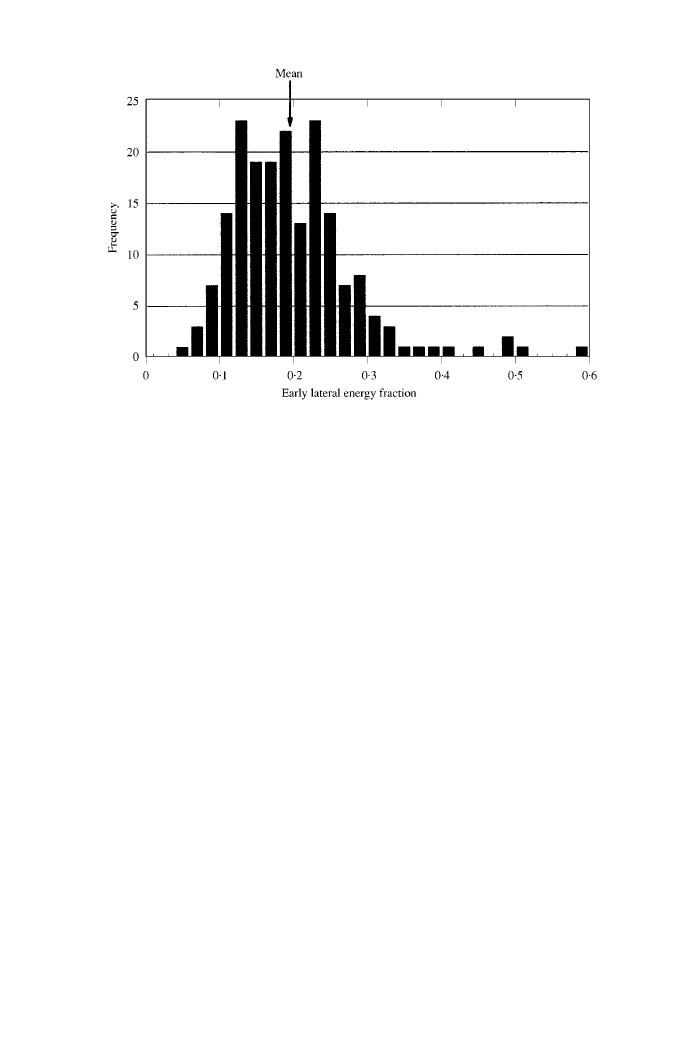
Figure 2. Distribution of measured early lateral energy fraction values in British concert halls.
platform, which is a feature not found in the American halls. Thus, the American
stage platforms are more enclosed whereas the norm in British halls is to have
a more open-stage arrangement. One might reasonably expect these design
di!erences to contribute to the lower early lateral fractions to be found in the
American halls.
An alternative cause of di!erences between the mean values of the two data sets
could be calibration di!erences. In the light of the above discussion regarding the
character of the halls in the two surveys, any calibration di!erences are likely to be
small.
3.2.
DISTRIBUTION OF MEASURED EARLY LATERAL ENERGY FRACTIONS
The distribution of measured values of the early lateral energy fraction has been
analyzed for the British data. Measured ¸F values range from 0)04 to 0)60; Figure 2
indicates the frequency of individual values. A test on the statistical normality of the
data using the
s test shows it to be
&&almost
certainly not normal'' with
a con"dence limit of over 0)1%. Pelorson et al. [18] applied more sophisticated
statistical analysis and also found non-normal distributions for the early lateral
energy fraction.
3.3.
EARLY LATERAL ENERGY FRACTIONS BY FREQUENCY
The importance of low frequencies to spatial impression was realized early [19]
and has subsequently been con"rmed [3, 20]. Further evidence of subtle spatial
86
M. BARRON

Figure 3. Mean ¸F values by frequency for the British and American concert hall data sets.
variations as a function of frequency have been reported by Blauert and
Lindemann [21]. Attenuation at grazing incidence, the seat-dip e!ect, was also
discovered in the 1960s and the possible in#uence of this low-frequency attenuation
on spatial hearing was investigated by Marshall [19]. Does attenuation at grazing
incidence in#uence ¸F values in general?
Figure 3 shows the mean values of the lateral fraction by frequency for the two
data sets. For the British data and the mean value is constant, whereas the American
data shows a minimum value at 500 Hz. The reason for the small variation with
frequency in the American data is not obvious. But what these two data sets show is
that whereas due to attenuation at grazing incidence we might expect lower lateral
fractions at 125 Hz, the measured data shows no such trend on average.
The constancy of the lateral fraction with frequency may not be so surprising
since both the direct sound and re#ections from side walls are a!ected by grazing
incidence attenuation. Grazing incidence certainly appears to in#uence the early
sound level [22]. At individual positions, variations of the lateral fraction with
frequency do of course occur. For good source broadening, re#ection on paths
remote from the audience are desirable. Individual surfaces should also be large
enough to re#ect low frequencies. This last point may be important in halls
following the vineyard terrace concept; in these halls surfaces dividing seating
blocks should preferably be su$ciently high for this reason.
4. EARLY LATERAL ENERGY FRACTIONS BY HALL
When the early lateral energy fraction is averaged within halls, the hall mean
values range from 0)10 to 0)30; see Figure 4. A typical range of ¸F within a hall is
0)20 so there is considerable overlap between halls. (The average standard deviation
EARLY LATERAL ENERGY FRACTIONS IN MUSIC AUDITORIA
87

Figure 4. Means and spread ($one standard deviation) of measured early lateral energy fractions
in 17 British concert halls. Hall labels according to Table 1.
of values within halls is 0)06.) The considerable overlap between halls raises the
question of the value of a single number to describe source broadening in a hall. In
many halls, there are regions with high and low values which can be attributed to
design details particular to the di!erent seating areas ([4], see for example St.
David's Hall, Cardi! ).
The British hall with the largest mean value as well as the largest spread of values
is the Usher Hall, Edinburgh (label: E). This proves to be a rather special case [4]
with a lack of early frontal sound. The Free Trade Hall, Manchester (label: M)
has some reverse-splay pro"les in plan; the Wigmore Hall (label: G) is a small
hall which is the narrowest of the halls tested here. At the opposite extreme,
Wembley Conference Centre (label: Y) has the smallest mean value; the plan form
of this hall is semi-circular which is an extreme example of a fan shape. Again the
reason for the low proportion of lateral sound with this plan form is discussed in
reference [4].
4.1.
HALL MEAN LATERAL FRACTIONS AND HALL WIDTH
The idea that early lateral re#ections might be important started from the
perception that the concert hall cross-section might be signi"cant [23, 1].
Architectural drawings summarising a hall design usually comprise plans
and a long section; the cross-section is generally omitted. West [23] had
access to the data from Beranek's 1962 survey [24] and found a good correlation
88
M. BARRON
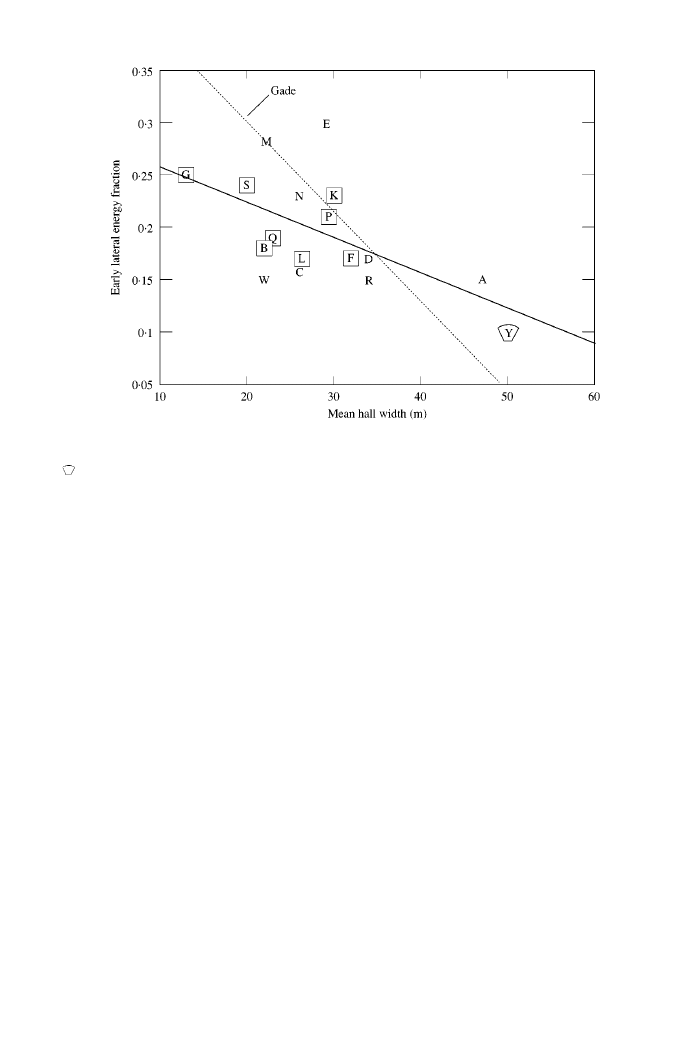
Figure 5. Mean hall early lateral energy fractions as a function of mean hall width in 17 British
concert halls. Solid line is line of best "t. Hall labels according to Table 1.
䊐, parallel-sided halls,
, fan-shaped halls.
(r"0)71) between the subjective categories and the cross-section ratio
("height/width).
The rectangular (shoebox) hall is eminently simple to model by using an image
model. All room surfaces are made re#ecting with the exception of the #oor which is
made fully absorbing. Re#ections are calculated within 80 ms of the direct sound
and the early lateral energy fraction is calculated from the impulse response.
Analysis of the lateral fraction [25, 26] keeping the plan form constant but varying
the height showed that ceiling height has virtually no in#uence on the early lateral
fraction. This is not in fact surprising when one realizes that the images of the
source lie in just two horizontal planes: the plane of the source and the re#ection of
this plane in the ceiling. The proportion of lateral sound in each image plane is
basically the same.
The simple image model does however indicate a correlation between mean
lateral fraction and hall width. Several authors, such as Gade [27] using data
measured in 32 European halls, have found relationships between width and
measured early lateral fractions.
Figures 5 and 6 show the relationship between mean hall width and mean hall
lateral fraction for British and North American halls. In each "gure, parallel-sided
halls are indicated by squares and fan-shape halls by simple fan shapes. The slopes
of lines of best "t and correlation coe$cients are listed in Table 4. In the case of the
British halls, the equation for the line of best "t is
Mean ¸F"0)29!0)0033
;mean hall width.
EARLY LATERAL ENERGY FRACTIONS IN MUSIC AUDITORIA
89

Figure 6. Mean hall early lateral energy fractions as a function of mean hall width in 13 American
concert halls. Lines are best "t regression lines. Hall labels according to Table 2.
䊐 , parallel-sided
halls,
, fan-shaped halls.
T
ABLE
4
Regressions between mean hall early lateral fractions and mean hall width
Data set
Slope: change in ¸F for
Correlation
10 m change in hall width
coe$cient, r
17 British halls
0)033
!
0)59
13 North American halls
0)026
!
0)65
8 British parallel-sided halls
0)027
!
0)54
The slopes of the lines of best "t for the British and American data are similar with
a modest slope. This slope implies a change of only 0)03 in the lateral fraction for
the substantial change of 10 m in the width of a hall. Gade's line is considerably
steeper, but the reason for this is not obvious. Perhaps the predominance of smaller
spaces among Gade's halls is signi"cant.
One notes in Figures 5 and 6 that fan shapes have the lowest values in both
surveys, though one fan-shaped hall (label: r in Figure 6) behaves well. A surprise
though is that the mean ¸F values in fan-shape plans conform to the general trend
regarding width for all hall shapes; again there is an exception, one American hall
(label: g) performs badly.
Thus, most fan-shape plans perform according to their mean width, which
happens to be large and so is responsible for small values of the lateral fraction.
90
M. BARRON

Figure 7. Computed early lateral energy fractions (¸FA) in the seating area of a rectangular
room according to a simple image model. Bottom scale is lateral distance from the axis of
symmetry, right-hand scale is longitudinal distance from the source:
䊏, 0)4
}0)5;
, 0)3}0)4;
, 0)2}0)3;
, 0)1}0)2.
Parallel-sided halls tend to perform well regarding ¸F but again not signi"cantly
better than other shapes. The slope of the regression line for British parallel-sided
halls is similar to that for all halls in both surveys. (Note that two British halls have
parallel side walls but have not been so designated in Figure 5; the Fair"eld Hall,
Croydon (label: C) has "ns on the side walls which block lateral re#ections and in
Watford Town Hall (label: W) there are absorbing curtains over portions of the
side walls producing the same e!ect.)
To summarize the in#uence of hall width: though parallel-sided halls are
associated with higher lateral fractions and fan-shaped plans with lower lateral
fractions, both plan forms conform to a general relationship between mean hall
lateral fraction and hall width. The relationship with hall width is however rather
weak. Design details, such as those already mentioned in section 4.1 in the Usher
Hall, Edinburgh and the Free Trade Hall, Manchester, can in#uence lateral
fractions independent of the hall width.
5. EARLY LATERAL ENERGY FRACTIONS WITHIN HALLS
Results from the simple image model discussed in section 4.2 above can provide
a feel for the variation of lateral fraction in a simple plan form such as the
rectangular plan. Figure 7 shows contours for the calculated lateral fractions in
a hall of dimensions 45
;32;17 m high. (In this case the early lateral fraction is the
subjectively more accurate ¸FA.) Figure 7 indicates that the lateral fraction is
reasonably constant throughout the audience space except close to the source
where it decreases markedly. The in#uence of the direct sound on the early energy
fraction is obvious from its de"nition.
EARLY LATERAL ENERGY FRACTIONS IN MUSIC AUDITORIA
91

Figure 8. Measured early lateral energy fractions plotted against theoretical values for
source}receiver distances between 9 and 15 m in British concert halls. Solid line is line of best "t;
dashed line represents perfect agreement.
To test whether the direct sound is also signi"cant for measured values of the
early lateral fraction, measured values of the fraction in British halls have been
compared with predictions based on a simple theoretical model of early sound
energy. The theory (see the Appendix A) is based on the traditional expression for
the direct sound and revised theory [17] for the early sound energy. To calculate
the early lateral energy, the rather gross assumption is made that the directional
distribution of the early re#ections is similar to a di!use distribution.
This theoretical model is of little use for larger source-receiver distances;
design di!erences matter too much for these. However for positions close to the
stage the simple theoretical model just described goes some way to explaining
behaviour of the lateral fraction. Figure 8 compares measured and predicted early
lateral energy fractions for measurements in all 17 British halls for source}receiver
distances between 9 and 15 m. For the 40 results, the correlation coe$cient is
r"0)53.
A further comment should be made about the situation close to the source. In
practice, when listening from a seat near the stage to a performance with a reason-
able size orchestra, the physical size of the orchestra compensates for the small
source broadening found at these positions.
Away from the source, the variation of ¸F is strongly in#uenced by auditorium
form. In only one of the 17 British halls is source}receiver distance a signi"cant
92
M. BARRON
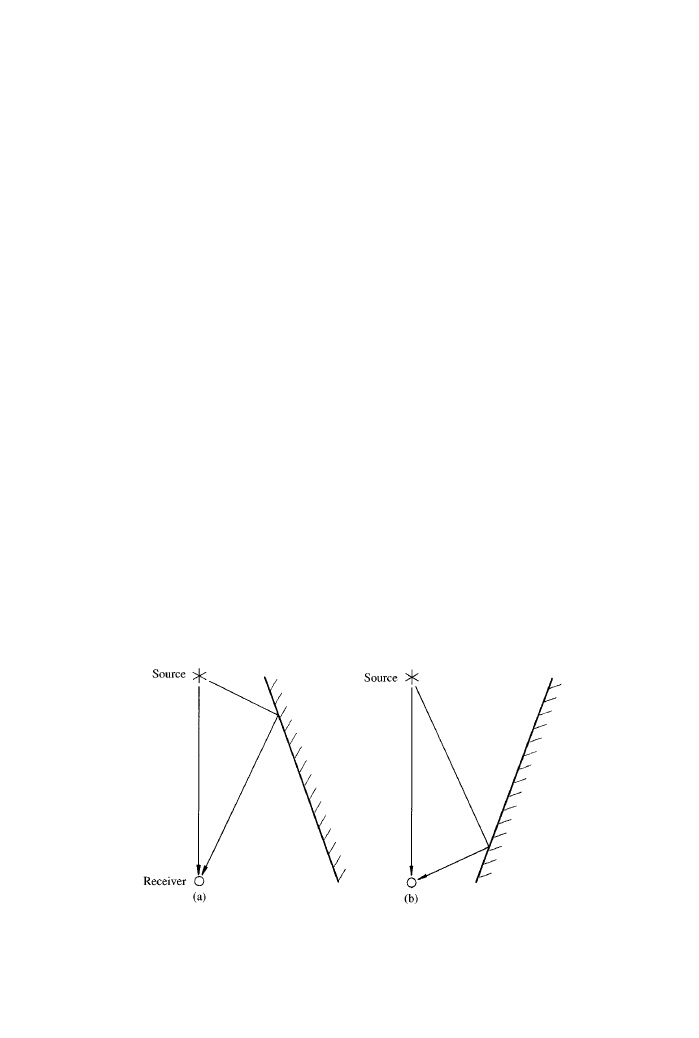
Figure 9. The lateral re#ection path in (a) a fan-shape plan and (b) a reverse splay plan (after
Marshall [19]).
determinant of ¸F within the hall: in the Barbican Concert Hall, London,
the lateral fraction increases with distance from the source. Generalizing from
behaviour in this unusual design is not warranted.
One general characteristic can be observed in Figure 5: that halls with larger
mean values of ¸F tend to have a wider spread of values. This occurs because local
design features within the halls enhance the lateral fraction only locally. The
presence of a balcony above the measurement position normally has only a small
in#uence on ¸F, since both ceiling and cornice re#ections are blocked by the
balcony overhang.
Regarding ¸F behaviour within halls, three plan forms deserve discussion:
parallel-sided, fan-shape and reverse splay.
Of the seven British parallel-sided halls, there is in three of them a consistent
increase in lateral fraction as one moves away from the central axis of symmetry. In
general however away from the source in these halls, the ¸F is reasonably constant.
For the combined British and American data sets, the "ve lowest mean ¸Fs are
found in fan-shaped plan halls. This plan form is obviously unsuitable for good
spatial impression. As far as variation of the lateral fraction within fan-shaped halls
is concerned, there is a modest trend for smaller ¸F values to occur towards the
rear of the hall. In just one fan-shaped hall (Akron, label: a) there is a signi"cant
progressive decrease of ¸F with distance from the source.
The reverse splay has the virtues which are vices for its design opposite,
the fan-shape plan. Figure 9 shows the bene"t for the reverse splay for a
single re#ection, but there are further contributions to lateral fractions due to
interre#ection between the walls; these multiple re#ections also maintain sound
level in a reverse splay situation.
But the reverse splay plan cannot be used for the whole of a concert hall because
the width becomes too large at the platform end. Reverse splays can be included in
halls where seating is subdivided, such as in terraced concert halls (e.g., the
Philharmonie, Berlin). Three halls with reverse splay plans have been measured: the
EARLY LATERAL ENERGY FRACTIONS IN MUSIC AUDITORIA
93

Figure 10. Mean and spread ($one standard deviation) of measured early lateral energy fractions
in four British opera houses plotted by auditorium volume.
Free Trade Hall, Manchester (label: M), the Royal Concert Hall, Glasgow [6] and
Segerstrom Hall, Orange County Performing Arts Center, California [4, 6]. Each
exhibits high values of the lateral fraction.
6. EARLY LATERAL FRACTIONS IN OPERA HOUSES
One of the major di!erences between opera and concert halls is that for opera
there are two sound sources: the singers on stage and the orchestra in the pit. With
their comparatively low sound power, it is questionable whether sound from
singers produces audible source broadening. The discussion here is limited to the
situation for the orchestral sound alone. Measurements have been made in four
British houses of conventional design with audience capacities between 950 and
2350; the houses were all built prior to 1910.
Analysis of the measured results soon reveals that values measured in the
Stalls are generally higher than elsewhere in the house. For this reason, results in
Figure 10 are divided in each house between those measured in the Stalls and those
measured at higher seating levels. The reason for the higher lateral fractions in the
Stalls is simply that the direct sound from the pit to the audience in the Stalls is
obscured by the pit rail. But though the pit rail is signi"cant, balcony overhangs
have no particular e!ect on lateral fractions.
One observes in Figure 10 that smaller volume auditoria have slightly higher
mean values associated with them. One di!erence with concert halls is the large
94
M. BARRON

spread of lateral fractions within some houses, which could no doubt be attributed
to design details. The mean house values ranged between 0)18 and 0)25.
7. COMBINING LATERAL FRACTION WITH SOUND LEVEL
Ever since Keet [11] made the initial suggestion, sound level has been considered
to contribute to spatial impression. Source broadening increases during loud
passages of a performance and can disappear during quiet passages with few
instruments playing. This leaves the question of how the lateral fraction and sound
level should be combined.
The simplest technique, as used by Bradley [28], is to consider the early lateral
sound level:
Early lateral sound level"Early level#10 log(¸F).
(4)
The non-logarithmic version, the early lateral energy, is an alternative:
Early lateral energy"Early energy
;¸F.
(5)
Selection or rejection of either of these depends on whether they are linearly related
to the subjective e!ect. The early lateral energy fraction was selected, as opposed to
such measures as the ratio of lateral to non-lateral sound in decibels, because it was
linearly related to the subjective e!ect. In Keet's simple experiment, the apparent
source width was measured in degrees and found to be roughly linearly related to
sound level.
This suggests the following means of combining the spatial measure with level:
Degree of source broadening (DSB)"¸F#(Early level)/
i,
(6)
where
i is a constant. Extrapolating from Keet
's experiment and the experiments
which led to the proposal for the early lateral energy fraction [3], a value for
i of 98
is derived (from equation (9) in reference [3],
i"14)5;4)5;1)5, the
"nal 1)5 being
due to the directivity of a "gure-of-eight microphone). In this author's subjective
questionnaire survey of British symphony concert halls [29], values of
i between 20
and 60 were tried in order to optimize the correlation with responses on a scale
relating to spatial impression. It turned out that the sensitivity to di!erent values
was small but the value for
i which gave the best correlation was 30. Yet for the
results of that subjective survey, the correlation was almost as good when the early
lateral energy was used as the objective measure.
Recent work by Morimoto and Iida [30] using simulation apparatus rea$rmed
Keet's result that the measured apparent source width is linearly related to level
and by interpretation, AS= is also linearly related to ¸F. From this work a value
for
i of 60 can be derived, though this is tentative at this stage. The value i"60 has
been used below.
7.1.
MEASURED DEGRESS OF SOURCE BROADENING
The early lateral energy fraction data based on the simple image model as used
for Figure 7 was multiplied by the relevant values for the early energy to give a plot
EARLY LATERAL ENERGY FRACTIONS IN MUSIC AUDITORIA
95

Figure 11. Computed early lateral energies in the seating area of a rectangular room according to
a simple image model. Bottom scale is lateral distance from the axis of symmetry, right-hand scale is
longitudinal distance from the source:
, 0)3}0)4;
, 0)2}0)3;
䊏, 0)1
}0)2.
of the early lateral energy in a rectangular plan hall. This is plotted in Figure 11
which shows that the dip in the lateral fraction near the source is compensated by
the higher sound levels close to the source. The greatest source broadening is to be
expected near the side walls.
Sound level is more important to the early lateral energy than it is to the
proposed degree of source broadening, equation (6) with
i"60. The degree of
source broadening according to equation (6) with
i"60 has been calculated for
the 189 positions in the British data set; the frequency mean values (125}1000 Hz)
for ¸F and early level were used in the equation. The mean and spread of values by
hall are presented in Figure 12.
Conveniently the mean value of the early level in British halls is numerically
small at !0)2 dB, so the overall mean values of ¸F and DSB are the same (for level,
0 dB is the level of the direct sound at 10 m). This allows direct comparison between
Figures 4 and 12; if a hall has moved from its position in Figure 4 then the mean
early level in the hall is greater or less than average. One observes that inclusion of
level in the degree of source broadening increases the di!erences between halls.
In Figure 12, the two halls with the highest mean DSB values are small halls with
seating capacities close to 500. These halls have high sound levels for a given
source power because of their small total acoustic absorption. But is this a fair
comparison? These two halls are basically recital halls and in the case of Wigmore
Hall, London (label: G) the stage has an area of only 33 m
, certainly too small for
even a chamber orchestra. The size of the orchestral forces is a further determinant
of the spatial e!ect, so comparisons of the degree of source broadening are only
really valid between similar hall types.
To return to Figure 12, many of the halls with intermediate lateral fraction
positions are una!ected by inclusion of sound level. But in the cases of
96
M. BARRON

Figure 12. Means and spread ($one standard deviation) of measured source broadening
("¸F#(Early level)/60) in 17 British concert halls. Hall labels according to Table 1.
the Royal Albert Hall, London (label: A) and Wembley Conference Centre
(label: Y), inclusion of level pushes them to the extreme low values. The case of
Wembley Conference Centre, a semi-circular hall, can be taken as an example of
a fan-shape plan: both the poor lateral re#ection situation and the low levels found
in fan-shape halls combine to give low degrees of source broadening with this plan
form.
8. CONCLUSIONS
The idea that early re#ections were important in concert halls orginated 30 years
ago. At the time the subjective e!ect was referred to by many as spatial impression.
Recent developments suggest that at least two spatial e!ects are present: source
broadening and envelopment, with the former linked to early re#ections and the
latter to later reverberant sound.
Concern for spatial impression or rather source broadening has had a major
in#uence on design. From casual attitudes in the 1960s to appropriate concert hall
form, we now have just a few design shapes that are considered acceptable. For
some, only parallel-sided halls have good acoustics, though source broadening
is not thought to be the only reason for the quality of their sound. At least two
design forms owe their development to early lateral re#ections: the lateral directed
EARLY LATERAL ENERGY FRACTIONS IN MUSIC AUDITORIA
97

re#ection sequence hall (such as the Town Hall, Christchurch, New Zealand) and
halls with the upper side walls tilted down (such as Pikes Peak Center, Colorado
Springs, USA). The vineyard terrace hall can with care be designed so that the
surfaces, which divide seating blocks, supply lateral re#ections.
In this paper, two sets of early lateral energy fraction (¸F) data measured in British
and American concern halls have been analyzed; they have mean values of 0)19 and
0)15, which is roughly half the value of a di!use sound "eld. The di!erence between
two means can probably as ascribed to design di!erences for the two sets of halls
measured. When data for individual halls are compared, it is clear that there is
considerable overlap between halls. There is however a signi"cant correlation between
hall mean ¸Fs and hall width for all hall shapes, though a substantial change of 10 m in
hall width corresponds to a change of only 0)03 in the mean lateral fraction.
Parallel-sided halls have higher mean ¸Fs because they are relatively narrow,
whereas fan-shaped halls have low mean ¸Fs due to their being relatively wide.
Within halls it is clear that the direct sound dominates the situation near the
source and depresses ¸F values. In symphony concerts this may not matter because
when one is sitting close to the stage the physical extent of the orchestral source will
compensate. At positions away from the stage, behaviour varies with plan form. In
parallel-sided halls the highest ¸F values are close to the side walls. In fan-shaped
halls, ¸F values tend to decrease as one moves towards the rear of the hall. The
reverse splay plan is the preferred form for good source broadening.
The signi"cance of sound level has also been acknowledged for spatial
impression since the start 30 years ago. How ¸F and level should be combined has
not been agreed, but subjective experiments suggest adding ¸F to the early level
divided by a constant. The degree of source broadening (DSB) was de"ned here as
(¸F#E/60), where E is the level of the early sound.
For many of the British halls, inclusion of level has little in#uence. Most obvious
shifts in rank ordering occur for halls at the extremes: small halls tend to have
a large DSB, large halls a small DSB. The fan-shaped hall performs badly both with
regard to ¸F and level.
In practice, perceived source broadening is also in#uenced by the size of the
musical forces. A symphony orchestra in a small hall is the optimum combination
for high source broadening. Hall geometry and surface acoustic character alone
determine the early lateral energy fraction. For this reason, it seems worth retaining
¸
F as an important parameter for concert halls rather than always subsuming ¸F
in a source broadening measure that includes level.
Modern concert hall designs are tending to become progressively more com-
plex, for which simple descriptions of plan form are often no longer adequate.
In such halls, provision of large source broadening can often be seen as a
local problem for di!erent seating areas in the hall. Source broadening throughout
for all listeners depends on there being surfaces near enough to all areas of
audience; it is not possible to provide high source broadening with large expanses
of undivided audience seating. Cornice re#ections involving side walls and so$ts
also deserve consideration. Perhaps we can look forward to more ingenuity in
concert hall design to accommodate early lateral re#ections for all audience
members.
98
M. BARRON

ACKNOWLEDGMENTS
Firstly, a special word of thanks to John Bradley for making his objective results
available to the wider community. John also helped with additional incidental
information. I am grateful to the managements of the various halls for allowing
us access to make measurements in their halls. The measurement work was
undertaken while the author was the Martin Centre for Architectural and Urban
Studies, Cambridge with the assistance of Lee-Jong Lee. The measurement
programme was supported by the Science and Engineering Research Council.
REFERENCES
1. A. H. M
ARSHALL
1967 Journal of Sound and <ibration 5, 100}112. A note on the
importance of room cross-section in concert halls.
2. M. B
ARRON
1971 Journal of Sound and <ibration 15, 475}494. The subjective e!ects of
"rst re#ections in concert halls*the need for lateral re#ections.
3. M. B
ARRON
and A. H. M
ARSHALL
1981 Journal of Sound and <ibration 77, 211}232.
Spatial impression due to early lateral re#ections in concert halls: the derivation of
physical measure.
4. M. B
ARRON
1993 Auditorium Acoustics and Architectural Design. London: Chapman
& Hall/Routledge.
5. J. S. B
RADLEY
1994 Internal Report No. 668, National Research Council Canada, Institute
for Research in Construction. Data from 13 North American concert halls.
6. L. L. B
ERANEK
1996 Concert and Opera Halls: How they Sound. New York: Acoustical
Society of America.
7. M. M
ORIMOTO
and K. I
IDA
1993 Journal of the Acoustical Society of America 93, 2282.
A new physical measure for psychological evaluation of a sound "led: front/back energy
ratio as a measure for envelopment.
8. M. M
ORIMOTO
, K. I
IDA
and K. S
AKAGAMI
2000 Applied Acoustics. The role of re#ections
from behind the listener in spatial impression.
9. J. S. B
RADLEY
and G. A. S
OULODRE
1995 Journal of the Acoustical Society of America 97,
2263}2271. The in#uence of late arriving energy on spatial impression.
10. J. S. B
RADLEY
and G. A. S
OULODRE
1995 Journal of the Acoustical Society of America 98,
2590}2597. Objective measures of listener envelopment.
11. W.
DE
V. K
EET
1968 Proceedings of the 6th International Congress on Acoustics, ¹okyo,
Paper E-2-4. The in#uence of early lateral re#ections on the spatial impression.
12. T. O
KANO
, L. L. B
ERANEK
and T. H
IDAKA
1998 Journal of the Acoustical Society
of America 104, 255}265. Relations among interaural cross-correlation co-e$cient
(IACC#), lateral fraction (¸F#) and apparent source width (AS=) in concert halls.
13. Y. A
NDO
1985 Concert Hall Acoustics. Berlin: Springer-Verlag.
14. M. B
ARRON
1983 Proceedings of the 11th International Congress on Acoustics, Paris, Vol.
7, 105}108. Objective measures of spatial impression in concert halls.
15. J. B
LAUERT
1983 Spatial Hearing. Cambridge, Massachusetts: MIT Press.
16. J. S. B
RADLEY
1994 Journal of the Acoustical Society of America 96, 3525}3535.
Comparison of concert hall measurements of spatial impression.
17. M. B
ARRON
and L.-J. L
EE
1988 Journal of the Acoustical Society of America 84, 618}628.
Energy relations in concert auditoriums, I.
18. X. P
ELORSON
, J.-P. V
IAN
and J.-D. P
OLACK
Applied Acoustics 37, 175}198. On the
variability of room acoustical parameters: reproducibility and statistical validity.
19. A. H. M
ARSHALL
1968 Journal of Sound and <ibration 7, 116}118. Levels of re#ection
masking in concert halls.
20. M. M
ORIMOTO
and Z. M
AEKAWA
1988 Acustica 66, 190}196. E!ects of low frequency
components on auditory spaciousness.
EARLY LATERAL ENERGY FRACTIONS IN MUSIC AUDITORIA
99

21. J. B
LAUERT
and W. L
INDEMANN
1986 Journal of the Acoustical Society of America 80,
533}542. Auditory spaciousness: some further psychoacoustic analyses.
22. M. B
ARRON
1995 Journal of the Acoustical Society of America 97, 1088}1098. Bass sound
in concert auditoria.
23. J. E. W
EST
1966 Journal of the Acoustical Society of America 40, 1245. Possible subjective
signi"cance of the ratio of height to width of concert halls.
24. L. L. B
ERANEK
1962 Music, Acoustics and Architecture. New York: Wiley.
25. M. B
ARRON
1974 Ph.D. ¹hesis, Southampton ;niversity. The e!ects of early re#ections
on subjective acoustic quality in concert halls.
26. M. B
ARRON
1974 Proceedings of the 8th International Congress on Acoustics, ¸ondon,
Vol. II, 602. Early lateral re#ections and cross-section ratio in concert halls.
27. A.-C. G
ADE
1989 Acoustics ¸aboratory, ¹echnical ;niversity of Denmark. Report 44,
Acoustical survey of 11 European concert halls.
28. J. S. B
RADLEY
1989 Proceedings of the 13th International Congress on Acoustics,
Belgrade, Vol. 2, 199}202. Hall average characteristics of 10 halls.
29. M. B
ARRON
1988 Acustica 66, 1}14. Subjective study of British symphony concert halls.
30. M. M
ORIMOTO
and K. I
IDA
1995 Journal of the Acoustical Society of Japan (E) 16, 59}69.
A practical evaluation method of auditory source width in concert halls.
APPENDIX A: THEORETICAL MODEL FOR THE EARLY LATERAL
FRACTION NEAR THE SOURCE
Energies are expressed relative to the direct sound at 10 m from the omni-
directional source. The expression for the direct sound energy, d, is the traditional
one. That for the early re#ected sound within 80 ms of the direct sound, eP, is taken
from revised theory for sound in auditoria [17]:
d"100/r
, eP"(31200¹/<)e
!
0)04r/¹
)
(1!e
!
1)11/¹
).
Here < is the auditorium volume, ¹ the reverberation time and r the distance from
the source. For a di!use sound "eld, the lateral energy measured by a "gure-of-
eight microphone"eP/3.
Hence, the theoretical early lateral energy fraction (¸F)"(eP/3)/(d#eP).
100
M. BARRON
Document Outline
- 1. INTRODUCTION
- 2. MEASUREMENT PROCEDURES
- 3. COMPARISON OF LATERAL FRACTIONS IN THE TWO CONCERT HALL DATA SETS
- 4. EARLY LATERAL ENERGY FRACTIONS BY
- 5. EARLY LATERAL ENERGY FRACTIONS WITHIN HALLS
- 6. EARLY LATERAL FRACTIONS IN OPERA HOUSES
- 7. COMBINING LATERAL FRACTION WITH SOUND LEVEL
- 8. CONCLUSIONS
- ACKNOWLEDGMENTS
- REFERENCES
- APPENDIX A: THEORETICAL MODEL FOR THE EARLY LATERAL FRACTION NEAR THE SOURCE
Wyszukiwarka
Podobne podstrony:
Barron Late lateral energy fractions and the envelopment question in concert halls
Bradley Using ISO 3382 measures, and their extensions, to evaluate acoustical conditions in concert
2001 Starch and Fiber Fractions in Selected Food and Feed Ingredients Affect Their Small Intestinal
Ouellette J Science and Art Converge in Concert Hall Acoustics
2012 vol 07 Geopolitics and energy security in the Caspian region
Angelo Farina Acoustic Measurements In Opera Houses Comparsion
SINATRA IN CONCERT partytura
Rueda Electromagnetic Zero Point Field as Active Energy Source in the Intergalactic Medium (1999)
Ouellette J Science and Art Converge in Concert Hall Acoustics
Beatles in concert Tenor Saxophone
Energy flows in biogas plants analysis and implications for plant design Niemcy 2013 (jest trochę o
William Weber From miscellany to homogenity in Concert Programming
In Concert Michael Swanwick(1)
Model for energy conversion in renewable energy system with hydrogen storage
Raiswell, Dendle, Demon possession in anglo saxon and early modern england
więcej podobnych podstron