
495
American Journal of Epidemiology
Copyright © 2001 by the Johns Hopkins University Bloomberg School of Public Health
All rights reserved
Vol. 154, No. 6
Printed in U.S.A.
Does Tea Affect Cardiovascular Disease? Peters et al.
ORIGINAL CONTRIBUTIONS
Does Tea Affect Cardiovascular Disease? A Meta-Analysis
Ulrike Peters,
1,2
Charles Poole,
1
and Lenore Arab
1
This meta-analysis of tea consumption in relation to stroke, myocardial infarction, and all coronary heart
disease is based on 10 cohort studies and seven case-control studies. The study-specific effect estimates for
stroke and coronary heart disease were too heterogeneous to be summarized (homogeneity p < 0.02 for stroke,
p < 0.001 for coronary heart disease). Only the relative risk estimates for myocardial infarction (seven studies)
appeared reasonably homogeneous (homogeneity p = 0.20). The incidence rate of myocardial infarction is
estimated to decrease by 11% with an increase in tea consumption of 3 cups per day (fixed-effects relative risk
estimate = 0.89, 95% confidence interval: 0.79, 1.01) (1 cup = 237 ml). However, evidence of bias toward
preferential publication of smaller studies that suggest protective effects urges caution in interpreting this result.
The geographic region where the studies were conducted appeared to explain much of the heterogeneity among
coronary heart disease, myocardial infarction, and probably stroke results. With increasing tea consumption, the
risk increased for coronary heart disease in the United Kingdom and for stroke in Australia, whereas the risk
decreased in other regions, particularly in continental Europe. Am J Epidemiol 2001;154:495–503.
cardiovascular diseases; cerebrovascular accident; coronary disease; meta-analysis; myocardial infarction; tea
Received for publication March 27, 2000, and accepted for publi-
cation February 14, 2001.
1
Department of Epidemiology, University of North Carolina
School of Public Health, Chapel Hill, NC.
2
Division of Cancer Epidemiology and Genetics, National Cancer
Institute, Bethesda, MD.
Correspondence to Dr. Lenore Arab, Department of Epidemiology
(CB 7400), University of North Carolina School of Public Health,
Chapel Hill, NC 27599-7400 (e-mail: Lenore@unc.edu).
Tea is the second most common drink in the world.
Because of the high consumption of tea, even small effects
in persons could have a large impact on public health. The
polyphenolic flavonoids in tea are thought to have a protec-
tive effect on cardiovascular disease. Oxidized low density
lipoproteins occur in atherosclerotic plaques in the vascular
system and heart (1). Flavonoids have antioxidative proper-
ties that prevent oxidation of low density lipoproteins in
vitro and, as recently shown, in vivo as well (2–6). High
concentrations of autoantibodies against oxidized low den-
sity lipoproteins have been found in patients with athero-
sclerosis (7, 8). Nevertheless, the relevance of these labora-
tory findings for a hypothetically protective effect of tea on
cardiovascular disease remains unknown. Therefore, the
goal of the present study was to analyze the estimated effect
of tea consumption on cardiovascular disease in all pub-
lished epidemiologic studies.
MATERIALS AND METHODS
To search for observational studies of tea consumption in
relation to cardiovascular disease, we conducted a literature
search in MEDLINE for papers published from January 1,
1966, to October 14, 2000. The keywords for the search
were tea, coffee, caffeine, or flavonoids together with one of
the following outcomes: cardiovascular disease, coronary
heart disease, stroke, myocardial infarction, ischemic heart
disease, cerebrovascular disease, or cardiovascular risk. We
included references listed in the recovered articles as well as
in review articles. We examined all observational studies
directly, because some studies did not report results for tea
and cardiovascular disease as the main result and did not
mention these results in the abstracts of the articles.
Four reports on three early case-control studies (9–11)
were excluded because they did not include sufficient infor-
mation to compute an estimate of relative risk or its standard
error. (Throughout this paper, the term “relative risk” is used
for incidence rate ratios estimated directly in cohort studies
and by the exposure odds ratio in case-control studies.) In
addition, two cross-sectional studies that measured serum
levels and included undiagnosed cases (12, 13) were
excluded. However, data from the latter cohort (13) were
included as drawn from a separate publication (14). A report
by Klatsky et al. (15) was replaced by a more recent analy-
sis of the same cohort (16). In the report by Sato et al. (17),
results from the prospective part of the study were used. We
contacted the authors of 11 studies (14, 16–25) for informa-
tion not included in their papers, such as variance estimates,
numbers of subjects in categories of tea consumption, and
typical tea cup sizes in specific locales. Nine authors
responded to our request (see Acknowledgments).
The studies addressed a diversity of cardiovascular dis-
eases (International Classification of Diseases, Ninth
at Uniwersytet Przyrodniczy we Wrocławiu (WROCŁAW UNIVERSITY OF ENVI on December 18, 2011
http://aje.oxfordjournals.org/
Downloaded from

496
Peters et al.
Am J Epidemiol
Vol. 154, No. 6, 2001
Revision, codes 390–459), which were combined in differ-
ent ways (appendix table 1). We included the three outcome
categories (myocardial infarction, stroke, and the broader
category of coronary heart disease), which were examined
in at least three studies. If a study provided more than one
effect estimate for a single outcome category (14, 16), only
one estimate was used.
The following paragraphs in this section pertain to statis-
tical methods. The statistical analyses included 1) extracting
or computing a common, comparable relative risk estimate
from each study; 2) searching for evidence of publication
bias; 3) analyzing interstudy variation; and 4) computing
summary effect estimates as indicated. Evidence of publica-
tion bias and heterogeneity was taken to contraindicate
reliance on overall summaries (23). In the presence of het-
erogeneity of effect, the main purpose of the meta-analysis
became the identification of sources of interstudy variation.
We attempted to place the studies on a common footing by
estimating the relative risk of a 3 cups per day increase in tea
consumption (e.g., from no tea consumption to 3 cups per
day) (1 cup
237 ml). For studies reporting relative risk
estimates in categories of tea consumption, we used inverse
variance-weighted categorical regression to estimate linear
exposure-response curves. These analyses were conducted
on the incidence rate scale for cohort studies and on the logit
scale for case-control studies. We used the covariance-cor-
rected method of Greenland and Longnecker (26) for studies
that provided the relative risk of tea consumption for more
than two categories of tea consumption and provided the per-
son-time per number of all subjects and cases per category of
tea consumption (18, 20, 21, 25, 27–30). For other studies
(14, 17, 19, 22, 23, 33, 34), we used the method described by
Berlin et al. (31) and Greeland (32) or the relative risk for tea
consumption as continuous (16, 24).
We assigned exposure values, in cups per day, to the tea
consumption categories in the original studies as follows.
For case-control studies, we used the tea consumption of the
control groups. The various measures of tea consumption
(cups, grams, milliliters) were transformed to a common
measure of cups per day (1 cup
8 ounces 237 ml).
When category medians (14, 20) or means (29, 33) were
available, they were used. Category midranges were applied
for the remaining closed-ended categories if they were no
broader than 2 cups per day. If the highest, open-ended cat-
egory included no more than 20 percent of the study sub-
jects, we assigned that category a value equal to 1.2 times its
lower boundary (18, 21–23, 25, 27). For the study by
Stensvold et al. (19), more detailed data from an earlier
report (35) on the same cohort were used to assign values to
the tea consumption categories. Some of the closed-ended
categories were wider than 2 cups per day in the studies by
Rosenberg et al. (30), Jick et al. (34), and the Boston
Collaborative Drug Surveillance Program (28). For these
studies, we assigned category medians from the National
Health and Nutrition Examination Survey I Epidemiologic
Followup Study (36). In the Japanese study by Sato et al.
(17), 41 percent of the subjects were in the highest, open-
ended category. For this study, we used category midranges
for the closed-ended categories. We used the factor 1.4 times
the lower boundary of 7 cups per day for the highest, open-
ended category instead of 1.2, because we expected the dis-
tribution to be skewed to the right, given the large propor-
tion of people in the highest category.
The log-rank test of Begg and Mazumdar (37) was used
for evidence of publication bias, with low p values suggest-
ing the presence of bias. In addition, funnel graphs in which
the study-specific effect estimates are displayed in relation
to the reciprocals of their estimated variances were created
(38). In the absence of publication bias, these graphs resem-
ble a funnel with the estimates from the larger studies in the
center, flanked symmetrically on either side by the less pre-
cise estimates.
To explore sources of heterogeneity among the studies,
we performed stratified and meta-regression analyses (32,
39). The meta-regressions were fit using inverse variance-
weighted, linear regression. The dependent variable was the
log relative risk, and the independent variables were the
study characteristics suspected of being sources of hetero-
geneity. After transformation back to the original ratio scale,
the meta-regressions estimate the ratio of the average rela-
tive risk estimates reported by studies with one characteris-
tic to the average estimates reported by studies with another
characteristic. In this way, these models quantify the degree
to which characteristics of the studies are associated with
their results. The fit of the meta-regression models was
checked by calculating the residual sum of squares (32).
We examined the following study characteristics in the
stratified and meta-regression analyses: study design (cohort,
case-control); mortality or morbidity data; geographic region
(United States, United Kingdom, continental Europe, Asia,
Australia); gender; adjustment for potential confounders by
modeling, restriction, or stratification (sex and/or age, socio-
economic status, smoking, other nondietary risk factors for
cardiovascular disease including alcohol, dietary factors);
publication year (before or during 1980, 1981–1990, during
or after 1991); age of subjects (<50 years,
≥50 years, all ages);
participation rate (among the controls in case-control studies
if separately reported); frequency of tea drinking in the study
population (<50 percent,
≥50 percent drinking ≥1cup per
day); and years of follow-up (cohort studies only). We were
not able to investigate whether differences in dietary assess-
ment methods accounted for heterogeneity because of the
lack of description of the dietary assessment methods applied.
Study characteristics were initially examined one by one,
because of the lack of power to run them jointly due to the
small number of studies. An attempt was made to examine
jointly those characteristics that appeared in these analyses to
be appreciably associated with the study-specific effect esti-
mates.
To examine the effect of differences in the strength of tea
in different regions quantitatively, we multiplied the
assigned categorical dose by 0.5 and recalculated the sum-
marized risk estimate for studies conducted in the United
States on coronary heat disease or myocardial infarction.
According to this calculation, we assume that the tea in the
United States is half as strong as that in Europe. All analy-
ses were conducted with Statistical Analysis System (SAS)
software (40).
at Uniwersytet Przyrodniczy we Wrocławiu (WROCŁAW UNIVERSITY OF ENVI on December 18, 2011
http://aje.oxfordjournals.org/
Downloaded from

Does Tea Affect Cardiovascular Disease?
497
Am J Epidemiol
Vol. 154, No. 6, 2001
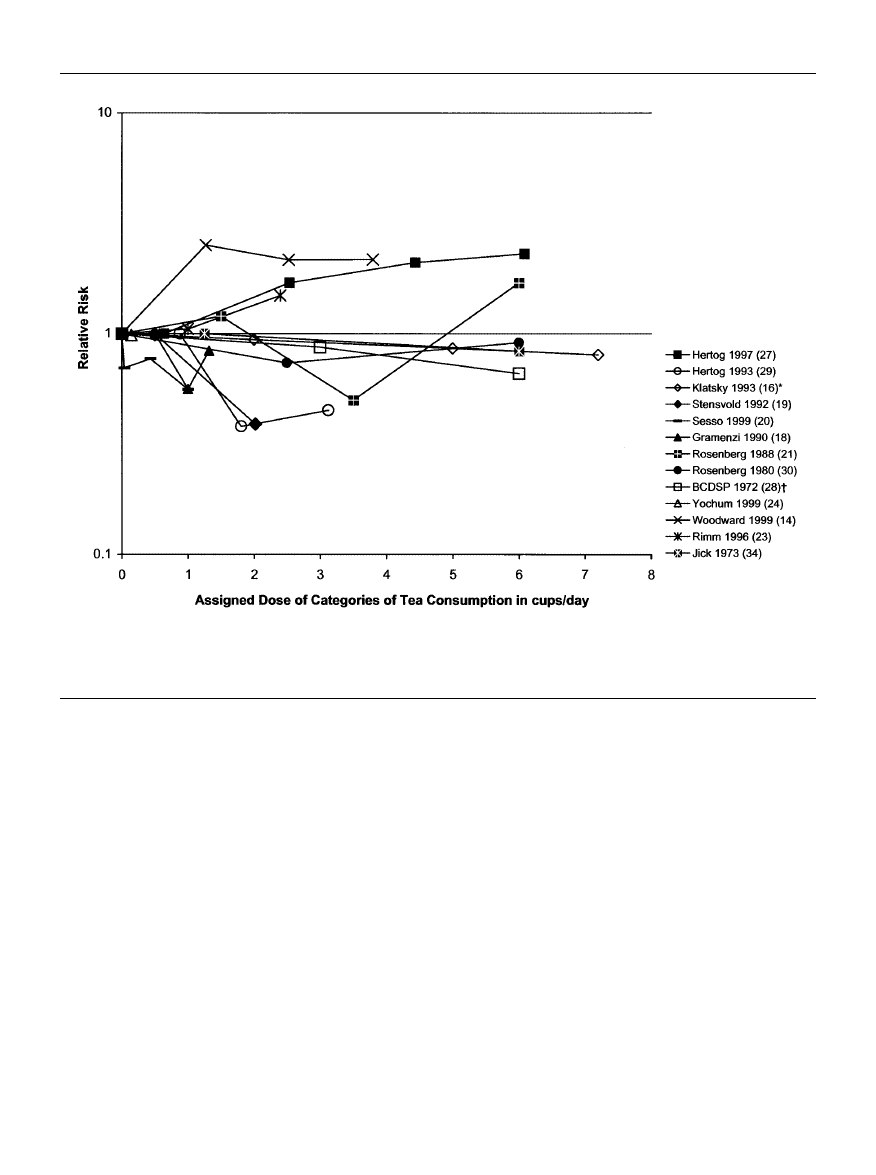
RESULTS
We identified and included 10 cohort studies and seven
case-control studies (table 1, Appendix). Most studies sug-
gested a decrease in the rate of cardiovascular disease out-
comes with increasing tea consumption. Results from coro-
nary heart disease or myocardial infarction are shown in
figure 1. Two studies from the United Kingdom (14, 27) and
two studies from the United States (21, 23) indicated an
increased risk with increasing tea consumption, whereas the
other studies indicated a decrease in risk. In table 1, the risk
estimates were standardized for measuring the effects per 3
cups of tea per day. In the four studies showing an increased
risk of coronary heart disease or myocardial infarction, the
risk increased by 4–126 percent with each 3 cups/day (14,
21, 23, 27). In the other studies on coronary heart disease or
myocardial infarction, the risk decreased between 1 and 75
percent per each 3 cups/day. For stroke, one of six studies
showed an increased risk of 51 percent with each 3 cups/day
(25), whereas the other studies indicated a decrease in risk
of 26–66 percent with each increment of 3 cups per day.
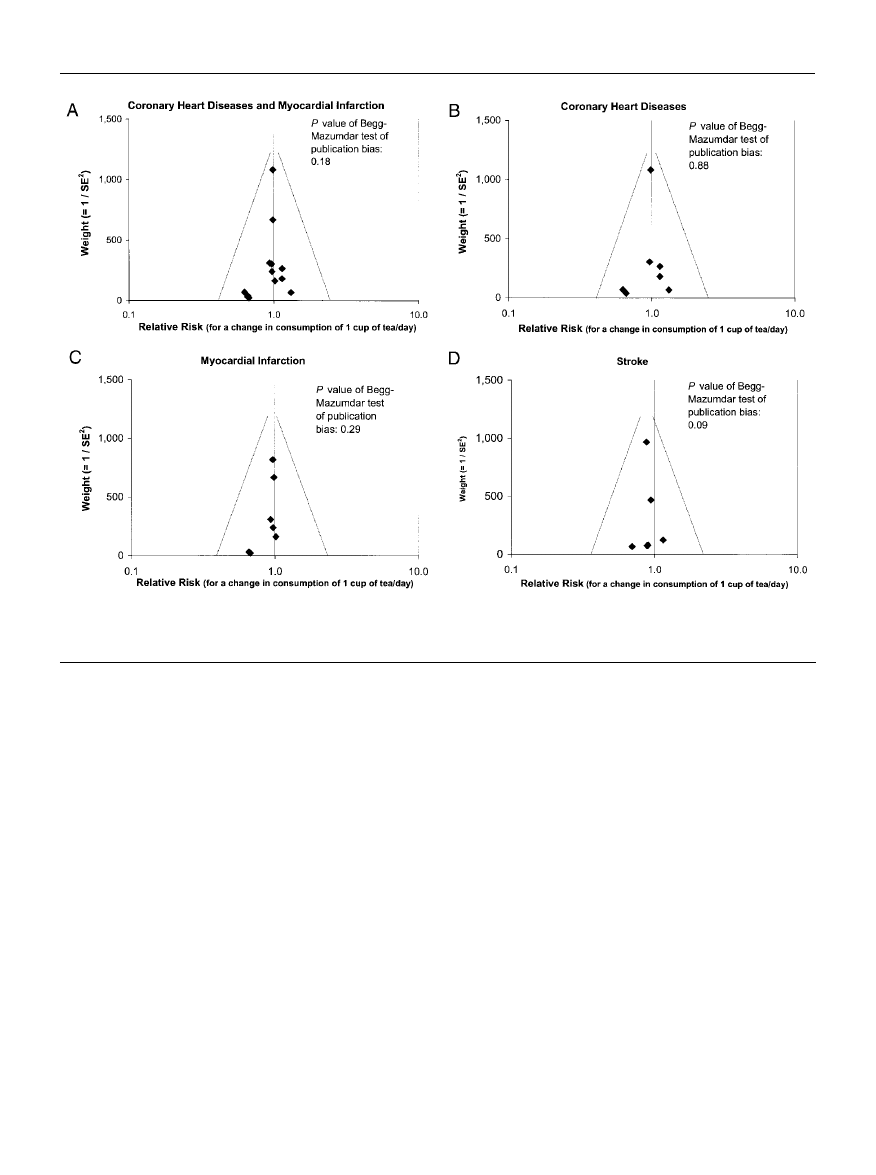
The analyses of publication bias are summarized in figure
2. The small numbers of studies limit the interpretation, but
the funnel graphs and the Begg-Mazumdar test both suggest
the presence of publication bias for myocardial infarction
and particularly for stroke. Specifically, it appears that
smaller studies producing results inconsistent with the
hypothesis of a preventive effect for myocardial infarction
may have a very low probability of becoming published.
The results for cardiovascular disease categories were
very heterogeneous (p < 0.02). The characteristic most
strongly associated with the study-specific effect estimates
was geographic region (table 2). Studies on coronary heart
disease and myocardial infarction conducted in continental
Europe reported much stronger inverse associations than did
studies conducted elsewhere. On average, the relative risk
estimates from continental Europe were about one third to
one fourth of the magnitude of the estimates from the United
States, with the exception of the two studies (14, 27) in the
United Kingdom that reported a moderately strong positive
association between tea intake and coronary heart disease.
Neither the basic study design nor any other characteristic of
the studies mentioned appeared to explain the heterogeneity
of their results for coronary heart disease or myocardial
infarction to any appreciable degree.
For studies on stroke, the follow-up time in cohort studies
appeared to explain the heterogeneity among the studies.
With each year of follow-up time the risk estimates
decreased by 5 percent. In addition, the geographic region or
study design explained heterogeneity. Because the one study
from Australia showing a very different effect (increasing
risk with increasing tea consumption) from the other studies
from other geographic regions is also the only case-control
study, it is not possible to determine if the geographic region
or the study design explained heterogeneity.
The test for heterogeneity of the effect of tea on myocar-
dial infarction showed no strong evidence of heterogeneity
(p
0.20) (table 3). The fixed-effects summary suggests a
TABLE 1.
Overview and reanalysis of 17 observational epidemiologic studies of the effect of tea consumption on
cardiovascular diseases
Cohort study
Hirvonen et al., 2000 (22)¶
Yochum et al., 1999 (24)
Woodward and Tunstall-Pedoe,
1999 (14)
Hertog et al., 1997 (27)
Rimm et al., 1996 (23)
Keli et al., 1996 (33)
Hertog et al., 1993 (29)
Klatsky et al., 1993 (16)
Stensvold et al., 1992 (19)
Sato et al., 1989 (17)
Case-control study
Sesso et al., 1999 (20)
Thrift et al., 1996 (25)
Gramenzi et al., 1990 (18)
Rosenberg et al., 1988 (21)
Rosenberg, et al., 1980 (30)
Jick et al., 1973 (34)
BCDSP,* 1972 (28)
Study
Country
Follow-
up
(years)
Finland
United States
United Kingdom
United Kingdom
United States
Netherlands
Netherlands
United States
Norway
Japan
United States
Australia
italy
United States
United States
United States
United States
Stroke
CHD*
Stroke
CHD
CHD
CHD
Stroke
CHD
CHD
MI*
Stroke
CHD
Stroke
MI
Stroke
MI
MI
MI
MI
MI
0.69
0.90
0.73
2.26
1.48
1.47
0.34
0.29
0.95
0.91
0.84
0.25
0.68
0.31
1.51
0.29
1.04
0.96
0.91
0.81
* RR, rate ratio; CI, confidence interval; SE
2
, standard error squared; CHD, coronary heart disease; MI, myocardial infarction; BCDSP, Boston
Collaborative Drug Surveillance Program, which also included subjects from Canada, New Zealand, and Israel.
† One cup = 237 ml.
‡ Rate ratio for drinking 3 cups/day vs. drinking no tea.
§ Percentage of subjects who drink at least the given number of cups per day (in case-control study only for control subjects).
¶ Numbers in parentheses, reference citations.
Outcome
RR* for 3
cups/day†,‡
95% CI*
0.35, 1.36
0.64, 1.26
0.38, 1.41
1.10, 4.64
1.03, 2.12
0.95, 2.28
0.17, 0.69
0.11, 0.74
0.80, 1.14
0.74, 1.11
0.64, 1.10
0.12, 0.50
0.56, 0.82
0.09, 1.02
0.89, 2.56
0.10, 0.81
0.66, 1.66
0.76, 1.20
0.63, 1.33
0.58, 1.13
6
10
10
8
14
6
15
5
8
12
4
26,415
34,492
34,492
11,567
1,900
44,303
552
805
12,893
12,893
12,893
20,089
14,360
680
662
936
351
1,423
12,759
1,380
736
438
131
206
131
279
42
43
539
433
275
159
174
340
331
287
146
472
440
276
75.77
303.14
79.26
66.82
265.79
181.37
68.58
39.15
1,082.06
821.01
468.51
69.61
968.45
23.76
124.66
31.87
163.11
668.96
240.77
311.12
All
subjects
(no.)
Cases
(no.)
Weights
(1/SE
2
*)
%
≥ the following
no. of
cups/day§
17.7
25.0
66.6
85.8
91.2
75.7
66.7
19.4
25.9
81.9
32.0
67.1
23.3
39.0
40.9
1.9
60.8
≥ 0.7 cup/day
≥ 0.7 cup/day
≥ 1.3 cups/day
≥ 1.3 cups/day
≥ 2 cups/day
≥ 1.4 cups/day
≥ 1.1 cups/day
≥ 1 cup/day
≥ 1 cup/day
≥ 1 cup/day
≥ 1 cup/day
≥ 1 cup/day
≥ 1 cup/day
≥ 1 cup/day
≥ 1 cup/day
≥ 5 cups/day
≥ 1 cup/day
at Uniwersytet Przyrodniczy we Wrocławiu (WROCŁAW UNIVERSITY OF ENVI on December 18, 2011
http://aje.oxfordjournals.org/
Downloaded from
498
Peters et al.
Am J Epidemiol
Vol. 154, No. 6, 2001
FIGURE 1.
Relative risks of myocardial infarction or coronary heart disease with tea consumption as a categorical variable in observational
epidemiologic studies (categorical values are shown as provided in the studies). One cup = 237 ml. *, the categorical risk estimates calculated
from the continuous variable provided. †, BCDSP, Boston Collaborative Drug Surveillance Program, which also included subjects from Canada,
New Zealand, and Israel.
decrease in incidence of myocardial infarction of 11 percent
associated with an increment of 3 cups of tea per day (sum-
mary relative risk
0.89, 95 percent confidence interval:
0.79, 1.01) (table 3). The evidence of publication bias, how-
ever, urges caution in interpreting this result.
Results stratified by region and study design are shown
in table 3. For the broader outcome in which myocardial
infarction is considered together with coronary heart dis-
ease, the results from the three studies in continental
Europe are homogeneous (p
0.95) and suggest that drink-
ing an additional 3 cups of tea per day can reduce incidence
by two thirds, an immense preventive effect. The eight
studies conducted in the United States were less homo-
geneous (p
0. 30) with a beneficial effect, if any, being a
reduction in incidence of only about 5 percent for each 3
cups/day. An increasing risk with increasing tea consump-
tion was indicated for the two studies from the United
Kingdom on coronary heart disease. These estimates also
did not indicate strong evidence of heterogeneity (p
0.30) with an increase in risk of 62 percent with each incre-
ment of 3 cups/day.
Additionally, we calculated the summarized risk estimate
for studies conducted in the United States on coronary heart
disease or myocardial infarction, assuming that tea in the
United States is half as strong as that in Europe. In this case,
the summarized risk estimate for studies conducted in the
United States for coronary heart disease or myocardial infarc-
tion is 0.90 (95 percent confidence interval: 0.81, 1.01) with
each increment of 3 cups/day rather than 0.95 (table 3).
The geographic stratified risk estimates of coronary heart
disease alone were fairly similar to the risk estimates of
coronary heart disease or myocardial infarction combined,
although the results of the three studies from the United
States were too heterogeneous (p
0.16) to be summarized.
For myocardial infarction, the effect estimates from stud-
ies in the United States were reasonably homogeneous and
suggested little or no effect. The fixed-effects summary
from these six studies from the United States was almost
identical to the estimate from the one study from Italy that
was included (relative risk
0.89 vs. relative risk 0.91).
For stroke, the only case-control study conducted in
Australia indicated a nonsignificant increased risk of 51 per-
at Uniwersytet Przyrodniczy we Wrocławiu (WROCŁAW UNIVERSITY OF ENVI on December 18, 2011
http://aje.oxfordjournals.org/
Downloaded from
Does Tea Affect Cardiovascular Disease?
499
Am J Epidemiol
Vol. 154, No. 6, 2001
FIGURE 2.
Funnel graphs of the relative risk for each cup of tea per day (beta coefficients) by the fixed-effects weights of a total of 17 obser-
vational epidemiologic studies of different cardiovascular diseases including myocardial infarction, coronary heart disease, or stroke. SE, stan-
dard error; 1 cup = 237 ml.
cent with each 3 cups/day (25). Cohort studies conducted in
the United States, continental Europe, or Asia did not indi-
cate strong evidence of heterogeneity (p
0.21) with a sig-
nificant reduction in stroke incidence of 12 percent per 3
cups of tea/day. The protective effect of tea on stroke
increased in cohort studies by 5 percent with each year of
follow-up (4–15 years).
DISCUSSION
The main purpose of this study was to examine the pub-
lished literature on tea consumption and cardiovascular dis-
ease for evidence of publication bias and heterogeneity of
effect and to summarize the effect estimates as indicated.
Evidence of publication bias in the literature was apparent
for myocardial infarction and particularly for stroke. The
relative risk estimates for studies of myocardial infarction
appeared homogeneous overall, although publication bias
urges caution in interpreting this result. For coronary heart
disease or myocardial infarction other than geographic
region, no characteristic of the studies appeared to explain
the heterogeneity or to be strongly associated with the
study-specific results. Three studies from continental
Europe were consistent in suggesting a strong preventive
effect, whereas eight studies from the United States were
consistent in suggesting little or no effect for coronary heart
disease or myocardial infarction. Heterogeneity of risk esti-
mates for stroke could be explained by length of follow-up
together with study design and/or geographic region. Cohort
studies not conducted in Australia indicated a decreased risk
of stroke with increasing tea consumption. However, evi-
dence of publication bias suggests extreme caution in inter-
pretation of these data.
The small number of published studies for any specific
cardiovascular disease outcome severely limited the ability
to detect publication bias or heterogeneity. Tests of homo-
geneity are well known to have low power. Begg and
Mazumdar (37) stated that their test for publication bias has
moderate power with 25 studies and high power with 75
studies. It is impressive, therefore, that the p values from the
tests for heterogeneity and publication bias were so low for
stroke, despite the small number of studies in the published
literature on the topic at hand. It would be of considerable
interest to learn if epidemiologic researchers have examined
results for tea and myocardial infarction and stroke and
refrained from publishing them because they were not
indicative of pronounced preventive effects. Only one of
many possibilities is that publication bias on this question
at Uniwersytet Przyrodniczy we Wrocławiu (WROCŁAW UNIVERSITY OF ENVI on December 18, 2011
http://aje.oxfordjournals.org/
Downloaded from

500
Peters et al.
Am J Epidemiol
Vol. 154, No. 6, 2001
has been stronger in Europe, where more people drink tea,
than in the United States.
If studies with positive associations have not been pub-
lished, as suggested by the tests of publication bias and fun-
nel graphs, the central tendency would be closer to the null
value. One cannot predict what the stratified and meta-
regression analysis of study characteristics would show if a
sizable number of unpublished studies were brought to light.
The evidence of publication bias did not disprove the
hypothesis of a protective effect, but it tempered the
strengths of the conclusion regarding preventive potential.
The outcomes investigated in the studies had different
definitions and were combined in more or less broad cate-
gories. If tea has different effects on different aspects of
cardiovascular diseases, a combined estimate from various
outcomes may minimize a tea effect. The results of the pres-
ent meta-analysis suggest this possibility because the study
results were less heterogeneous for myocardial infarction
alone than for any less specific outcome. These results sug-
gest that a more precise definition of the outcome might
improve the homogeneity among studies and the precision
in the effect estimate.
Case-control studies tend to have a higher potential for
recall and selection bias. Nevertheless, we saw little or no
difference in results between cohort studies and case-control
studies for coronary heart disease or myocardial infarction.
For stroke, it remains unclear if the differences were due to
regional differences or differences in study design. The low
number of studies limited the power to detect differences
among the studies. If we expected the differences to be
small, as possibly for differences in adjustment for con-
founding, we have limited ability to detect small differences
in the meta-analysis.
For cohort studies on stroke, we found an increased pro-
tective effect with increasing length of follow-up between 4
and 15 years, which might indicate the importance of early
prevention.
The findings from the United Kingdom and Australia of a
positive association were unique. One possible explanation
involves the polyphenolic antioxidant flavonoids hypothe-
sized to be one mechanism by which tea might reduce car-
diovascular disease incidence (1–7). In the United
Kingdom, milk commonly is added to tea. Hertog et al. (27)
reported that more than 99 percent of tea drinkers added
milk and argued that this difference might explain why they
did not find evidence of a protective effect of tea. Hasalam
(41) showed that flavonoids are bound to protein. Further,
indirect evidence suggested by Serafini et al. (42) showed
that adding milk to tea abolished its in vivo plasma antioxi-
dant potential. In contrast to these findings, however,
Hollman et al. (43) and van het Hof et al. (44) did not find
different flavonoid plasma concentrations in subjects given
tea with or without milk. The hypothesis has been stated for
the findings from the United Kingdom studies on coronary
heart disease. This is also a possible explanation for the
findings for stroke in Australia, a population that is strongly
influenced by immigrants from the United Kingdom. In any
event, the hypothesis of Hertog et al. (27) and Hasalam (41)
might explain why an inverse association would not be seen
in the United Kingdom and Australia, but that hypothesis
would not explain why a positive association was seen. The
amount of fat in the milk that is added to the tea would seem
woefully insufficient to increase cardiovascular disease risk.
Sesso et al. (20) suggested that higher tea consumption
might be a surrogate for a healthier lifestyle. Weak inverse
associations of tea consumption with smoking, body mass
index, and dietary risk factors have been reported (16, 19,
29). Residual confounding and lack of control for lifestyle
factors might explain why some studies appear to suggest a
protective effect of tea on cardiovascular disease. These
problems may also explain regional differences. In the
United Kingdom and in continental Europe, tea consump-
tion is very common and therefore may not be restricted to
people with healthier behaviors. Perhaps residual confound-
ing and lack of control for lifestyle factors are especially
pronounced in the United States, where fewer people drink
tea and where weaker associations between tea and cardio-
vascular disease have been reported.
An important limitation of the studies was imprecision of
the exposure measurement. Only the study from Japan
investigated green tea. All other studies referred simply to
TABLE 2.
Estimated effect of the covariates’ region and
study design on the risk estimates of tea consumption on
cardiovascular diseases in observational epidemiologic
studies (results of a multiple linear meta-regression)
MI* or CHD*
Europe (without United
Kingdom) vs. United
States
United Kingdom vs. United
States
CHD
Europe (without United
Kingdom) vs. United
States
United Kingdom vs. United
States
MI
Europe vs. United States
Stroke
Follow-up per each year
Australia vs. United States,
Europe, Asia = case-
control study vs. cohort
study
Covariates
Ratio of
RR
*
for
3 cups/
day†,‡
0.27
1.73
0.26
1.76
0.29
0.95
1.51
0.14, 0.50
0.97, 3.08
0.11, 0.62
0.85, 3.63
0.09, 0.92
0.91, 0.98
0.73, 3.15
0.96
0.52
0.77
* RR, rate ratio; CI, confidence interval; MI, myocardial infarc-
tion; CHD, coronary heart disease.
† One cup = 237 ml.
‡ Estimated ratio comparing the relative risk (drinking 3
cups/day vs. drinking no tea) of a region or study design with the
relative risk (drinking 3 cups/day vs. drinking no tea) of a reference
region (United States) or reference study design (cohort study),
computed as exp(3
β).
95% CI*
p value
of
model
fit
at Uniwersytet Przyrodniczy we Wrocławiu (WROCŁAW UNIVERSITY OF ENVI on December 18, 2011
http://aje.oxfordjournals.org/
Downloaded from

Does Tea Affect Cardiovascular Disease?
501
Am J Epidemiol
Vol. 154, No. 6, 2001
tea. Some studies mention that the subjects were asked only
about the frequency of tea consumption without any more
detailed questions about the kind or preparation of tea. Tea
comprises a heterogeneous group of beverages, including
fermented black tea, half fermented oolongs, unfermented
green tea, and sweetened or unsweetened ice tea, and it
might even be understood to include fruit tea or herbal teas.
It is to be expected that study subjects give a summary
answer for any kind of tea if they are asked only about their
tea consumption without more detailed questions. Different
kinds of tea differ in the kind and quantity of substances
and, even within the same kind of tea, differences exist.
According to the analysis of Prior and Cao (45), the phenol
content and antioxidant capacity of black, green, and herbal
or berry teas can vary more than twofold. The mean total
phenol content of black tea is 129.3 mg/g, of green tea, 71.7
mg/g, and of herbal/berry tea, 51.7 mg/g. In addition, the
method of preparation affects the content of tea.
The information available was insufficient for us to address
the kinds of tea, the methods of preparation, or the differences
in tea strength. These factors might help to explain the
regional differences we found, however. For instance, it might
be expected that the kind of tea, method of preparation, and
preference of tea strength differ among the regions and that
there might be more similarity within a region than between
regions. It is likely that the varying characteristics of tea have
different effects on cardiovascular disease. If, for instance,
Europeans tend to drink stronger tea than North Americans
do, the effect per cup of tea could be higher in the European
studies. We examined this hypothesis by recalculating the
summarized risk estimate for coronary heart disease or
myocardial infarction in the way that the tea in the United
States is assumed to be only half as strong as that in Europe.
In this case, the risk estimate for studies conducted in the
United States decreased only from 0.95 to 0.90 with each 3
cups/day and is still very different from the summarized risk
estimate in continental Europe of 0.27. It appears, therefore,
that differences in tea strength may explain only a small frac-
tion of the regional differences.
Because of the high consumption and distribution of tea
worldwide, hypothetical health effects of tea are important
public health issues. It appears worthwhile to address the
regional differences in future research, while improving con-
trol for potential confounders and measurement of the many
characteristics of tea and its preparation and consumption. Of
greatest and most immediate importance would be for all
investigators who have unpublished results on tea and car-
diovascular disease to bring those results forward.
ACKNOWLEDGMENTS
The authors thank Dr. Arthur L. Klatsky, Mary A.
Armstrong, Dr. Howard D. Sesso, Dr. C. La Vecchia, Dr. I.
Stensvold, Dr. Eric Rimm, Dr. Aaron Folsom, Dr. Amanda
Thrift, and Dr. Mark Woodward for giving us information
TABLE 3.
Stratified effect estimates of tea consumption on cardiovascular diseases in observational
epidemiologic studies
MI* or CHD*
Europe (without United Kingdom)
Continental Europe and United States
United Kingdom
Continental Europe
United States
CHD
Europe (without United Kingdom)
Continental Europe and United States
United Kingdom
Continental Europe
United States
MI
Continental Europe and United States
Continental Europe (Italy)
United States
Stroke
Australia or case-control study
Europe, Asia, United States, or cohort study
Outcome stratified for
No. of
studies
<0.001
<0.001
0.30
0.95
0.30
<0.001
0.22
0.30
0.79
0.16
0.20
0.53
0.21
1.62
0.27
0.95
0.77
1.62
0.26
0.89
0.29
0.91
1.51
0.88
1.15, 2.30
0.16, 0.44
0.84, 1.08
0.54, 1.10
1.15, 2.30
0.15, 0.46
0.79, 1.01
0.10, 0.81
0.80, 1.03
0.89, 2.56
0.82, 0.95
* RR, rate ratio; CI, confidence interval; MI, myocardial infarction; CHD, coronary heart disease.
† One cup = 237 ml.
‡ RR is the rate ratio for drinking 3 cups/day vs. drinking no tea.
Homogeneity
p value
RR
*
for
3 cups/day†,‡
5
11
2
3
8
4
5
2
2
3
7
1
6
1
5
95% CI*
at Uniwersytet Przyrodniczy we Wrocławiu (WROCŁAW UNIVERSITY OF ENVI on December 18, 2011
http://aje.oxfordjournals.org/
Downloaded from

502
Peters et al.
Am J Epidemiol
Vol. 154, No. 6, 2001
about their studies in addition to their published papers.
Further, they want to thank Dr. Cande Ananth from Robert
Wood Johnson Medical School, New Brunswick, New
Jersey, as well as Dr. Pietro Ferrari from the International
Agency for Research on Cancer, Lyon, France, for offering
them a Statistical Analysis System macro to accomplish the
covariance-corrected categorical regression method of
Greenland and Longnecker (26).
REFERENCES
1. Shaikh M, Martini S, Quiney JR, et al. Modified plasma-derived
lipoproteins in human atherosclerotic plaques. Atherosclerosis
1988;69:165–72.
2. de Whalley CV, Rankin SM, Hoult JR, et al. Flavonoids inhibit
the oxidative modification of low density lipoproteins by
macrophages. Biochem Pharmacol 1990;39:1743–50.
3. Negre-Salvayre A, Salvayre R. Quercetin prevents the cyto-
toxicity of oxidized LDL on lymphoid cell lines. Free Radic
Biol Med 1992;12:101–6.
4. Rice-Evans CA, Miller NJ, Paganga G. Structure-antioxidant
activity relationships of flavonoids and phenolic acids. Free
Radic Biol Med 1996;20:933–56.
5. Wu TW, Fung KP, Wu J, et al. Morin hydrate inhibits azo-
initiator induced oxidation of human low density lipoprotein.
Life Sci 1996;58:PL 17–22.
6. Yoshida H, Ishikawa T, Hosoai H, et al. Inhibitory effect of tea
flavonoids on the ability of cells to oxidize low density lipo-
protein. Biochem Pharmacol 1999;58:1695–703.
7. Salonen JT, Yla-Herttuala S, Yamamoto R, et al. Autoantibody
against oxidised LDL and progression of carotid atherosclero-
sis. Lancet 1992;339:883–7.
8. Bergmark C, Wu R, de Faire U, et al. Patients with early-onset
peripheral vascular disease have increased levels of autoanti-
bodies against oxidized LDL. Arterioscler Thromb Vasc Biol
1995;15:441–5.
9. Yudin J, Morland J. Sugar intake and myocardial infarction.
Am J Clin Nutr 1967;20:503–6.
10. Little J, Shanoff H, Csima A, et al. Diet and serum lipids in
male survivors of myocardial infarction. Lancet 1965;1:933–5.
11. Howell RW, Wilson DG. Dietary sugar and ischaemic heart
disease. Br Med J 1969;3:145–8.
12. Imai K, Nakachi K. Cross sectional study of effects of drink-
ing green tea on cardiovascular and liver diseases. BMJ 1995;
310:693–6.
13. Brown CA, Bolton-Smith C, Woodward M, et al. Coffee and
tea consumption and the prevalence of coronary heart disease
in men and women: results from the Scottish Heart Health
Study. J Epidemiol Community Health 1993;47:171–5.
14. Woodward M, Tunstall-Pedoe H. Coffee and tea consumption in
the Scottish Heart Health Study follow up: conflicting relations
with coronary risk factors, coronary disease, and all cause mor-
tality. J Epidemiol Community Health 1999;53:481–7.
15. Klatsky AL, Friedman GD, Armstrong MA. Coffee use prior to
myocardial infarction restudied: heavier intake may increase
the risk. Am J Epidemiol 1990;132:479–88.
16. Klatsky AL, Armstrong MA, Friedman GD. Coffee, tea, and
mortality. Ann Epidemiol 1993;3:375–81.
17. Sato Y, Nakatsuka H, Watanabe T, et al. Possible contribution
of green tea drinking habits to the prevention of stroke. Tohoku
J Exp Med 1989;157:337–43.
18. Gramenzi A, Gentile A, Fasoli M, et al. Association between
certain foods and risk of acute myocardial infarction in
women. BMJ 1990;300:771–3.
19. Stensvold I, Tverdal A, Solvoll K, et al. Tea consumption: rela-
tionship to cholesterol, blood pressure, and coronary and total
mortality. Prev Med 1992;21:546–53.
20. Sesso HD, Gaziano JM, Buring JE, et al. Coffee and tea intake
and the risk of myocardial infarction. Am J Epidemiol 1999;
149:162–7.
21. Rosenberg L, Palmer JR, Kelly JP, et al. Coffee drinking and
nonfatal myocardial infarction in men under 55 years of age.
Am J Epidemiol 1988;128:570–8.
22. Hirvonen T, Virtamo J, Korhonen P, et al. Intake of flavonoids,
carotenoids, vitamins C and E, and risk of stroke in male
smokers. Stroke 2000;31:2301–6.
23. Rimm EB, Katan MB, Ascherio A, et al. Relation between
intake of flavonoids and risk for coronary heart disease in male
health professionals. Ann Intern Med 1996;125:384–9.
24. Yochum L, Kushi LH, Meyer K, et al. Dietary flavonoid intake
and risk of cardiovascular disease in postmenopausal women.
Am J Epidemiol 1999;149:943–9.
25. Thrift AG, McNeil JJ, Forbes A, et al. Risk factors for cerebral
hemorrhage in the era of well-controlled hypertension.
Melbourne Risk Factor Study (MERFS) Group. Stroke 1996;
27:2020–5.
26. Greenland S, Longnecker MP. Methods for trend estimation
from summarized dose-response data, with applications to
meta-analysis. Am J Epidemiol 1992;135:1301–9.
27. Hertog MG, Sweetnam PM, Fehily AM, et al. Antioxidant
flavonols and ischemic heart disease in a Welsh population of
men: the Caerphilly Study. Am J Clin Nutr 1997;65:1489–94.
28. Coffee drinking and acute myocardial infarction. Report from
the Boston Collaborative Drug Surveillance Program. Lancet
1972;2:1278–81.
29. Hertog MG, Feskens EJ, Hollman PC, et al. Dietary antioxi-
dant flavonoids and risk of coronary heart disease: the Zutphen
Elderly Study. Lancet 1993;342:1007–11.
30. Rosenberg L, Slone D, Shapiro S, et al. Coffee drinking and
myocardial infarction in young women. Am J Epidemiol 1980;
111:675–81.
31. Berlin JA, Longnecker MP, Greenland S. Meta-analysis of epi-
demiologic dose-response data. Epidemiology 1993;4:218–28.
32. Greenland S. Meta-analysis. 1998;2:643–74.
33. Keli SO, Hertog MG, Feskens EJ, et al. Dietary flavonoids,
antioxidant vitamins, and incidence of stroke: the Zutphen
Study. Arch Intern Med 1996;156:637–42.
34. Jick H, Miettinen OS, Neff RK, et al. Coffee and myocardial
infarction. N Engl J Med 1973;289:63–7.
35. Solvoll K, Selmer R, Loken EB, et al. Coffee, dietary habits,
and serum cholesterol among men and women 35–49 years of
age. Am J Epidemiol 1989;129:1277–88.
36. US Department of Health and Nutrition (DHHS). Second
National Health and Nutrition Examination Survey I
Epidemiologic Followup Study, 1982–1984. Hyattsville, MD:
National Center for Health Statistics, 1992.
37. Begg CB, Mazumdar M. Operating characteristics of a rank cor-
relation test for publication bias. Biometrics 1994;50:1088–101.
38. Light R, Mazumdar M. Summing up: the science of reviewing
research. Cambridge, MA: Harvard University Press, 1984:
63–72.
39. Wallenstein S, Bodian C. Epidemiologic programs for com-
puters and calculators. Inferences on odds ratios, relative risks,
and risk differences based on standard regression programs.
Am J Epidemiol 1987;126:346–55.
40. SAS Institute, Inc. SAS v8.0. Cary, NC: SAS Institute, Inc,
1999.
41. Hasalam E. Plant phenols: vegetable tannins revisited.
Cambridge, United Kingdom: Cambrige University Press,
1989:154–219.
42. Serafini M, Ghiselli A, Ferro-Luzzi A. In vivo antioxidant effect
of green and black tea in man. Eur J Clin Nutr 1996;50:28–32.
43. Hollman PC, Feskens EJ, Katan MB. Tea flavonols in cardio-
vascular disease and cancer epidemiology. Proc Soc Exp Biol
Med 1999;220:198–202.
44. van het Hof KH, Wiseman SA, Yang CS, et al. Plasma and
lipoprotein levels of tea catechins following repeated tea con-
sumption. Proc Soc Exp Biol Med 1999;220:203–9.
45. Prior RL, Cao G. Antioxidant capacity and polyphenolic com-
ponents of teas: implications for altering in vivo antioxidant
status. Proc Soc Exp Biol Med 1999;220:255–61.
at Uniwersytet Przyrodniczy we Wrocławiu (WROCŁAW UNIVERSITY OF ENVI on December 18, 2011
http://aje.oxfordjournals.org/
Downloaded from

Does Tea Affect Cardiovascular Disease?
503
Am J Epidemiol
Vol. 154, No. 6, 2001
APPENDIX TABLE 1.
Summary of adjustment of potential confounder and description of the outcome as used in 17
observational epidemiologic studies of the effect of tea consumption on cardiovascular diseases
Hirvonen et al., 2000 (22)‡
Yochum et al., 1999 (24)
Woodward and Tunstall-Pedoe,
1999 (14)
Hertog et al., 1997 (27)
Rimm et al., 1996 (23)
Keli et al., 1996 (33)
Hertog et al., 1993 (29)
Klatsky et al., 1993 (16)
Stensvold et al., 1992 (19)
Sato et al., 1989 (17)
Sesso et al., 1999 (20)
Thrift et al., 1996 (25)
Gramenzi et al., 1990 (18)
Rosenberg et al., 1988 (21)
Rosenberg et al., 1980 (30)
Jick et al., 1973 (34)
BCDSP,* 1972 (28)
Study
Outcome in
meta-analysis
Stroke
CHD*
Stroke
CHD
CHD
CHD
Stroke
CHD
CHD
MI*
Stroke
CHD
Stroke
MI
Stroke
MI
MI
MI
MI
MI
Fatal and nonfatal stroke
incidence
Mortality from CHD
Mortality from stroke
Mortality from CHD
Mortality IHD*
Mortality from CHD
Fatal and nonfatal stroke
incidence
Mortality from CHD
Mortality from CHD
Mortality from acute MI
Mortality from stroke
Mortality from CHD
Mortality from stroke
Nonfatal MI
Nonfatal cerebral
hemorrhage
Nonfatal MI
Nonfatal MI
Nonfatal MI
Nonfatal MI
Nonfatal MI
430–431, 433–434
410–414, 429.2
430–438
ICD code not specified
ICD code not specified
ICD code not specified
430–438
410–414
ICD code not specified,
chronic coronary
ICD code not specified
430–434
410–413, 414.0–414.1,
414.9, 798.1–798.2
430–438
ICD code not specified,
confirmed by evidence
of creatine kinase
ICD code not specified,
based on discharge
diagnosis
ICD code not specified
ICD code not specified,
based on discharge
diagnosis
ICD code not specified,
based on discharge
diagnosis
ICD code not specified,
based on discharge
diagnosis
ICD code not specified,
based on discharge
diagnosis
* ICD-9, International Classification of Diseases, Ninth Revision; CHD, coronary heart disease; IHD, ischemic heart disease; MI, myocar-
dial infarction; BCDSP, Boston Collaborative Drug Surveillance Program.
† 1, age; 2, gender; 3, education/profession; 4, race; 5, poverty index/social class; 6, marital status; 7, religion; 8, Framingham type A per-
sonality score/Bortner personality score; 9, year of interview; 10, geographic area; 11, smoking; 12, body mass index; 13, physical activity;
14, aspirin use; 15, history of myocardial infarction, coronary heart disease, hypertension; 16, other baseline disease; 17, diabetes; 18, fam-
ily history of myocardial infarction or coronary heart disease; 19, family history of diabetes; 20, number of visits of physician in the previous
year; 21, systolic and/or diastolic blood pressure; 22, serum cholesterol; 23, serum high density lipoprotein; 24, alcohol; 25, calories/energy;
26, fat; 27, saturated fat; 28, cholesterol; 29, dietary fiber/whole grain; 30, vitamin C; 31, vitamin E; 32, beta-carotene; 33, antioxidant vitamins;
34, salt intake; 35, calcium; 36, fish; 37, coffee.
‡ Numbers in parentheses, reference citation.
Disease
outcome
Description of outcome
(ICD-9* code)
Adjustment for potential
confounder†
1, 2, 3, 11, 12, 15, 17, 21, 22,
23, 24
1, 2, 3, 6, 11, 12, 13, 15, 17,
23, 24, 25, 27, 28, 29, 31
1, 2, 5, 8, 11, 12, 13, 21, 22,
23, 24, 30, 37
1, 5, 11, 12, 15, 21, 22, 24,
25, 26, 30, 31, 32
1, 2, 3, 11, 12, 16, 17, 18, 22,
24, 27, 29, 31
1, 11, 21, 22, 24, 25, 33, 36
1, 11, 12, 13, 15, 21, 22, 23,
24, 25, 27, 28, 29, 30, 31,
32, 37
1, 2, 3, 4, 6, 11, 12, 24
1, 11, 21, 22
1, 2, 10, 11, 24, 34
1, 2, 8, 11, 12, 13, 14, 15, 18,
19, 24, 25, 27
1, 2, 5, 7, 11, 12, 15, 22, 24
1
1, 2, 3, 7, 8, 9, 10, 11, 12, 13,
15, 17, 18, 20, 22, 24, 37
1, 2
APPENDIX
at Uniwersytet Przyrodniczy we Wrocławiu (WROCŁAW UNIVERSITY OF ENVI on December 18, 2011
http://aje.oxfordjournals.org/
Downloaded from
Wyszukiwarka
Podobne podstrony:
Consumption of cocoa, tea and coffee and risk of cardiovascular disease
guiso sapienza zingales 2006 Does culture affect economic outcomes
cardiovascular disease and exercise
Cardiovascular Disease Classification Chart
Does the number of rescuers affect the survival rate from out-of-hospital cardiac arrests, MEDYCYNA,
Does the number of rescuers affect the survival rate from out-of-hospital cardiac arrests, MEDYCYNA,
Targeting Multiple Neurodegeneratevie Diseases Etiologies with Multimodal Acting Green Tea Catechins
The Benefits of Frequent Positive Affect Does Happiness Lead to Success EBSCOhost
Tea consumption and cardiovascular risk in the SU VI MAX study Are life style factors important
Osteochondritis dissecans in association with legg calve perthes disease
affect reading1
japanese tea ceremony
Interruption of the blood supply of femoral head an experimental study on the pathogenesis of Legg C
ABC Of Arterial and Venous Disease
nOTATKI, L7 ' English Disease'
Dietary Patterns Associated with Alzheimer’s Disease
Perthes Disease
więcej podobnych podstron