
Copyright © NetIQ Corporation 2001.
1
Contents
Measuring Call Quality
Objectively................................... 2
Testing VoIP Call Quality .......... 5
Getting your Data Network
Ready for VoIP............................ 6
Summary ................................... 12
Copyright Information ............. 13
A Handbook for
Successful VoIP
Deployment: Network
Testing, QoS, and More
by John Q. Walker, NetIQ Corporation
Deploying Voice over IP (VoIP) successfully in a data network
has some unexpected pitfalls. In previous papers, we’ve
explored how to do a Voice Readiness Assessment [1] and
looked at focused planning and design tips [2,3]. This paper
describes changes you can make to improve how a data network
handles VoIP traffic – that is, how you can reduce one-way
delay, jitter, and data loss for VoIP traffic, while retaining the
performance of your other business-critical network
applications.

Copyright © NetIQ Corporation 2001.
2
Data networks haven’t traditionally been re-
ported on using a single metric, since there are
many factors to consider. Yet, in the
telephony world, a single number is typically
given to rate voice call quality. Voice over IP
(VoIP) is a data network application; the
quality of VoIP conversations needs a single
metric upon which to benchmark, trend, and
tune.
Call quality measurement has traditionally
been subjective: picking up a telephone and
listening to the quality of the voice. The
leading subjective measurement of voice
quality is the MOS (mean opinion score) as
described in the ITU (International Telecom-
munications Union) recommendation P.800
[4]. MOS comes from the telephony world
and is the widely accepted criterion for call
quality
In using MOS with human listeners, a group
of people listen to audio and give their opin-
ion of the call quality. This certainly works
well, but asking people to listen to calls over
and over can be difficult and expensive to set
up and execute. You can also guess that it’s
inconvenient to have a bunch of people
standing around each time you make a tuning
adjustment. The good news is that the human
behavioral patterns have been heavily
researched and recorded. The ITU P.800 stan-
dard describes how humans react – what score
they would give – as they hear audio with
different aspects of delay or datagram loss.
Measuring Call Quality
Objectively
Considerable progress has been made in es-
tablishing objective measurements of call
quality. Various standards have been
developed:
•
PSQM (ITU P.861) / PSQM+: Perceptual
Speech Quality Measure
•
MNB (ITU P.861): Measuring Normalized
Blocks
•
PESQ (ITU P.862): Perceptual Evaluation
of Speech Quality
•
PAMS (British Telecom): Perceptual
Analysis Measurement System
•
The E-model (ITU G.107)
PSQM, PSQM+, MNB, and PESQ are part of a
succession of algorithm modifications starting
in ITU standard P.861. British Telecom
developed PAMS, which is similar to PSQM.
The PSQM and PAMS measurements send a
reference signal through the telephony net-
work and then compare the reference signal
with the signal that’s received on the other
end of the network, by means of digital signal
processing algorithms. Several traditional
voice measurement tools have implemented
PSQM and PAMS measurements.
These measurements are good in test labs for
analyzing the clarity of individual devices; for
example, it makes sense to use PSQM to de-
scribe the quality of a telephone handset.
Vendors that implement these scoring algo-
rithms all map their scores to MOS.
However, these approaches are not really well
suited to assessing call quality on a data net-
work in an enterprise. They’re based in the
older telephony world, so the data network is
treated as a big analog black box. They re-
quire invasive hardware probes, which you
need to purchase and deploy before beginning
VoIP measurements. The models used are not
based on data network issues, so they can’t
map back to the network issues of delay, jitter,
and datagram loss. Their output doesn’t
direct the network staff how to tune. Also,
they aren’t suited to the two-way
simultaneous flows of a real phone conversa-
tion, and they don’t scale to let you evaluate
the quality of hundreds or thousands of
simultaneous calls.
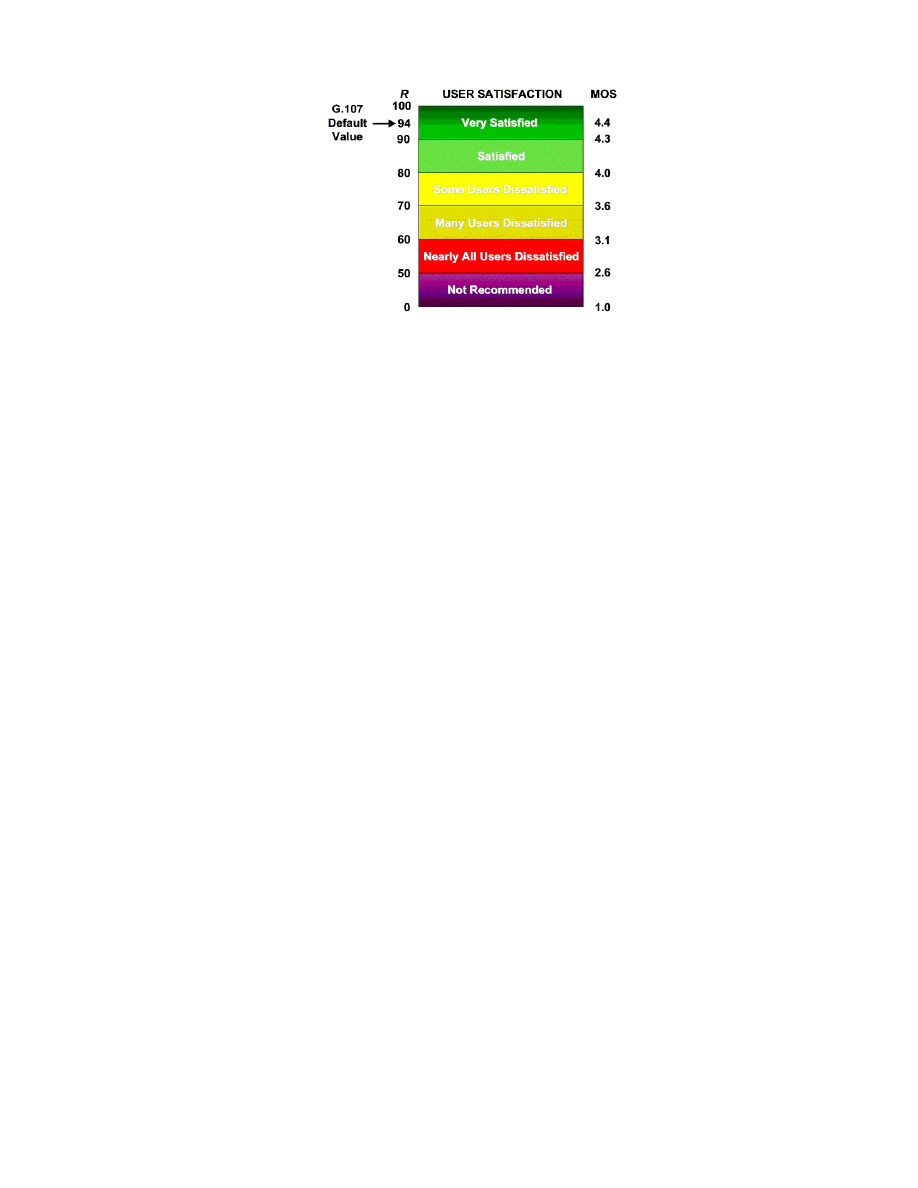
ITU recommendation G.107 [5] defines the “E-
model.” The E-model is a complex formula;
the output of an E-model calculation is a sin-
gle score, called an “R factor,” derived from
delays and equipment impairment factors.
Once an R factor is obtained, it can be mapped
to an estimated MOS. R factor values range
from 100 (excellent) down to 0 (poor); a MOS
can range from 5 down to 1. An estimated
MOS can be directly calculated from the E-
model’s R factor.
Copyright © NetIQ Corporation 2001.
3
Figure 1. R factor values from the E-model are shown on the left, with their corresponding MOS values on the
right. The likely satisfaction level of human listeners is shown in the middle.
Software, like NetIQ’s Chariot, test call quality
by generating real-time transport protocol
(RTP) streams that mimic VoIP traffic. The
RTP traffic flows between two endpoints in a
data network. Each time a test is run,
measurements are collected for the one-way
delay time, the number of datagrams lost, the
number of consecutive datagrams lost, and the
amount of variability in the arrival time of the
datagrams (known as jitter). These measure-
ments capture in a MOS what’s important for
voice quality: how the two people at the two
telephones perceive the quality of their con-
versation.
We recommend using the E-model for doing
voice-readiness testing of a data network. The
E-model provides a powerful and repeatable
way to assess whether a data network is ready
to carry VoIP calls well. The E-model shows
us that there are two ways that a digitized
voice signal is impaired as it passes through a
data network. It is impaired by delay and it is
impaired by the equipment that sits between
the talker and the listener. For VoIP, this
equipment is the codecs at the two ends and
everything in the data network that sits be-
tween them. To improve voice quality, we
need to reduce the impairments that occur.
Let’s look at each kind of impairment sepa-
rately: delay impairment and equipment im-
pairment.
Delay Impairments
Four components comprise the total one-way
delay between a talker and a listener:
Propagation Delay
The physical distance between the two
ends of the data network determines how
long it takes to propagate a signal between
them. This delay is proportional to the
speed of light, that is, the time needed by
the physical signal as it passes through
copper, optical, or wireless media. There’s
much more propagation delay between
New York City and Sydney than there is
between New York City and Boston.
Transport Delay
Every networking device between the
talker and listener introduces some delay.
It takes time to get through every router,
firewall, traffic shaper, and other device
on the route. For some devices, like hubs,
this delay is relatively constant. For other
devices, particularly routers, the delay can
increase as the amount of other traffic and
congestion increase in a network.
Packetization Delay
Codecs take time to convert analog signals
to digital packets and vice versa. A high-
speed codec like G.711 does this packeti-
zation quickly, in about one millisecond.
Low-speed codecs take much longer, since
they do compression to reduce the packet
size. Codecs in the G.723 family introduce
67.5 milliseconds of delay as they convert
from analog signals to digital packets.

Copyright © NetIQ Corporation 2001.
4
Codec
Nominal
Data Rate
(kbps)
Packetization
Delay (ms)
G.711
64.0 1.0
G.729
8.0 25.0
G.723.1m
6.3 67.5
G.723.1a
5.3 67.5
Figure 2. Common voice codecs and the one-way
delay they introduce.
Jitter Buffer Delay
When there’s a lot of variation in the arri-
val time of VoIP datagrams, a jitter buffer
is introduced to smooth the playback.
Rather than converting VoIP packets di-
rectly back to analog as they arrive, one or
two packets are held in memory at the
listener’s side. The codec there retrieves
its next packet to convert from the jitter
buffer, so it is always one or two packets
“behind.” When some delay occurs, the
codec can be playing from the current
packet in memory, not waiting for a
packet to arrive. When excessive delay
occurs, however, packets may need to be
simply discarded, to make way for the
next arriving packet.
Packetization and jitter buffer delay; they are
decided at the time you deploy your VoIP
equipment. You decide on which codec to use
and you decide the size of the jitter buffer.
The other two delay components can be
tuned, to some degree, to reduce the one-way
delay. Although you can’t decrease the abso-
lute propagation time between New York City
and Sydney, there may be detours in the route
between them. You might see that the VoIP
datagrams are not taking a direct route
between the two locations – and tune the
network for a more direct route. Transport
delay is the most variable delay component,
and one most amenable to tuning. You can
readily determine the latency at each hop
under low-load conditions and see where the
most time is being spent. You can also look at
the latency under heavy-load, high-stress
conditions, and tune the amount of delay
introduced by congestion and other traffic.
Equipment Impairments
Many test tools are available in the telephony
marketplace to determine how the quality of
analog audio signals are impaired. These are
useful when working with the analog portion
of the signal path, for example, how good the
handset sounds.
Our focus here, though, is on the data net-
work. Impairment of the digitized signal in a
data network occurs in just two ways. It can
occur in the codecs, when the A-to-D and D-
to-A conversions occur, and it can occur be-
cause of lost datagrams in the data network.
Everything between one codec and the other is
treated as one big, analog black box that de-
grades the audio signal to some degree.
Codec Impairment
Low speed codecs impair the quality of
the audio signal much more than high-
speed codecs, because they compress the
signal. Fewer bits are sent, so the receiv-
ing side does its best to approximate what
the original signal sounded like. The
following table shows how much the
codec impairment subtracts directly from
the R factor, which starts at 100 and can go
down to 0.
Codec
Nominal
Data Rate
(kbps)
Amount
subtracted from
the R factor
G.711
64.0 0
G.729
8.0 11
G.723.1m
6.3 15
G.723.1a
5.3 19
Figure 3. Common voice codecs and their how they
directly impair audio quality.
Data Loss Impairment
VoIP packets are sent using RTP, the real-
time transport protocol. Although every
RTP datagram contains a sequence num-
ber, there isn’t enough time to retransmit
lost datagrams. Any lost datagram im-
pairs the quality of the audio signal.
There are two primary reasons why RTP
datagrams are lost in a data network:

Copyright © NetIQ Corporation 2001.
5
1) there’s too much traffic, so datagrams
are discarded during congestion
2) there’s too much delay variation, so
datagrams are discarded because they
arrive at the listener’s jitter buffer too
late or too early
There are a couple of patterns to datagram
loss. The simplest is when there’s a more-
or-less random loss. There’s general, con-
sistent congestion in the network, so one
or two datagrams are lost occasionally.
The other pattern is when packets are lost
in bursts, say five or more at a time.
Humans perceive that bursts of loss im-
pair signal quality much more than the
random loss of a packet or two.
So, the issues in improving voice quality come
down to three:
• reducing total one-way delay in each
direction,
• reducing delay variation (which leads to
excess jitter, and hence packet loss), and
• reducing overall packet loss (especially
bursts of loss).
Testing VoIP Call
Quality
The process of examining a data network to
see if it’s ready to support good-quality voice
signals is called doing a ”VoIP Readiness
Assessment.” A VoIP Readiness Assessment
is usually done in stages, starting with a sim-
ple test and getting more advanced:
1. One call: determine the voice quality of a
single call, in two directions
2. Many calls: determine the voice quality of
each call, during peak call volume
3. Many calls on a busy network: determine
the voice quality of each call, during peak
call volume with heavy background traffic
In assessing your network’s readiness for
voice, the first step is to determine how well
the network handles one VoIP conversation.
If the MOS estimate indicates low voice
quality, it’s time to stop and consider your
next steps. Your data network needs to
change before you can deploy VoIP success-
fully. Do you want to do the network equip-
ment upgrades and tuning necessary to carry
the VoIP traffic well?
If the VoIP assessment indicates the network’s
ready now, you’ll want to understand its
capacity to see how many calls can be sup-
ported. Ask your local PBX management
team for details on the peak number telephone
calls, when these occur, and what the call du-
ration is. Use these details to create a more
complex assessment. Replicate the test setup
created for doing a single call. Run the test for
a one-minute period, a few times during the
day where your research shows heavy activ-
ity. Test five conversations at a time for a
minute; what happens to the MOS estimates?
Next try ten, then twenty concurrent
conversations. Plot the results on a graph; you
should start to see the point where, as the
number of calls increases, the quality de-
creases. Don’t kill your data network during
prime time by stress testing its capacity.
However, start to form the graphs showing
how many conversations can be supported
with good quality.
Understand the results at each of the three
stages of VoIP Readiness Assessment before
moving on to the next. What’s the quality of
each concurrent VoIP conversation? If the
quality is low, what underlying network
attribute contributes most to the reduced
quality: one-way delay, jitter, random packet
loss, and/or bursts of packet loss?
If, after completing the third stage –
examining the peak number of calls during
heavy network usage – the assessment indi-
cates the voice quality will be acceptable,
you’re ready to proceed with your VoIP
deployment.
However, in our experience, it’s likely your
data network won’t deliver the call quality
you would like. In fact, a recent estimate pre-
dicted that 85% of today’s router-based data
networks are not ready for toll-quality VoIP
calls. The rest of this paper describes the steps
needs to consider for upgrading and tuning
the network.

Copyright © NetIQ Corporation 2001.
6
Getting your Data
Network Ready for VoIP
If the call quality you determined in your
VoIP Readiness Assessment is not okay, de-
termine what the problems are and where
they’re located. What’s the biggest cause of
the poor call quality: one-way delay, jitter,
packet loss, or a combination of all three?
Where are the most likely bottlenecks?
There are a variety of improvements that can
be made to an existing data network to im-
prove the call quality. Choices include adding
more bandwidth, upgrading or replacing
existing network equipment, laying out your
network architecture in an improved manner,
reconfiguring or tuning the network for QoS,
or a combination of these.
Bandwidth
Bandwidth consumption by VoIP calls is
higher that it appears at first. The G.729
codec, for example, has a data payload rate of
8 kbps. Its actual bandwidth usage is higher
than this, though. When sent at 30ms inter-
vals, its payload size is 30 bytes per datagram.
To this add the 40 bytes of RTP header (yes,
the header is bigger than the payload) and any
additional layer 2 headers. For example,
Ethernet adds 18 more bytes. Also, there are
two concurrent G.729 RTP flows (one in each
direction), so double the bandwidth con-
sumption you’ve calculated so far. Here’s a
table showing a truer picture of actual band-
width usage for four common codecs.
Codec
Nominal
Data
Rate
(kbps)
Data
Bytes per
30ms
packet
Total
Data-gram
Size
(bytes)
Combined
bandwidth for
2 flows (kbps)
G.711
64.0 240 298
158.93
G.729
8.0 30 88
46.93
G.723.1m
6.3 24 82
43.73
G.723.1a
5.3 20 78
41.60
Figure 4. Common voice codecs and the LAN bandwidth requirements for a two-way VoIP conversation. Total
datagram size includes a 40-byte IP/UDP/RTP header and an 18-byte Ethernet header.
You can see quickly a good rule of thumb:
estimate 160 kbps bandwidth usage for each
VoIP conversation using the G.711; estimate
about 50 kbps when using one of the low-
speed codecs.
Use the peak number of calls to determine raw
bandwidth requirements for concurrent VoIP
calls. If you want to support 10 concurrent
VoIP calls using the G.711 codec with no si-
lence suppression, you’ll need about 1.6 Mbps
of bandwidth to support these calls on a given
network segment (10 x 158.93kbps – the total
bandwidth consumption of the two RTP
flows). Add this additional bandwidth re-
quirement to the existing bandwidth usage of
the network to set the new base requirement.
There are four tuning techniques worth ex-
ploring to conserve and ration bandwidth:
compressed RTP, silence suppression, frame
packing, and call admission control.
Compressed RTP headers save bandwidth by
reducing the number of bytes in RTP data-
grams. VoIP traffic uses RTP to encapsulate
the speech frames. RTP header compression
(called “cRTP”) is used among routers in the
network backbone. It can reduce the 40-byte
RTP headers to a tenth of their original size,
halving the bandwidth consumed when using
low-speed codec. In streaming video, in con-
trast, the payload is often ten times the size of
the header, so compression may not be
noticeable. Enable it when there’s a link on
the route bandwidth lower than 500 kbps. So,
why not always use cRTP? It adds latency,
increasing the transport delay component of
the one-way delay.
Silence suppression saves bandwidth by
making the payload smaller. In most tele-
phone conversations, there are times when
one speaker or the other (or both) are silent.

Copyright © NetIQ Corporation 2001.
7
During silence, it’s not necessary to send full
packets; a much smaller packet can be sent,
indicating that is silence during the period. By
enabling silence suppression at each end of
the conversation, 50% of the payloads can
typically small.
Frame packetization can save bandwidth by
putting multiple packets of audio information
into one datagram. This means that only one
IP/UDP/RTP header is necessary, instead of
one for each audio packet. Delay is increased,
though, since the datagram can’t be sent until
multiple packets have been generated. Also,
the loss of a single datagram can mean the loss
of multiple audio packets, further eroding the
call quality.
Using call admission control lets you avoid
having too many concurrent VoIP conversa-
tions. If your WAN bandwidth only supports
two VoIP calls well, you want to avoid a third
call. Call manager software can limit the
number of concurrent conversations to a pre-
defined number, to avoid overloading slow
links.
These four techniques may help, but it may
ultimately come down to the fact that you
need to have bigger pipes. Look for the slow-
est links or the links where there is the most
contention for bandwidth. Many delay and
data loss problems can be solved by having
lots of available bandwidth, to accommodate
the VoIP conversations and the other
concurrent network transactions effortlessly.
Equipment Upgrades
Upgrading or replacing your local network
equipment may give you the boost you need,
without buying additional bandwidth from
your service provider. The latest, fastest
equipment often can increase bandwidth, de-
crease latency, and increase capacity. Here are
some upgrades to consider:
Hubs can often be bottlenecks in a heavily-
used LAN. Consider replacing hubs with
modern high-speed switches. Recent switches
are also much better at handling IP multicast
traffic than those of a few years ago; be sure to
see if the combination of old switches and IP
multicast could be massively throttling your
available LAN capacity.
Routers operate using queues for the arriving
and departing traffic. Routers always seem to
function better with lots of RAM. Doubling or
tripling a router’s RAM may be a cost-effective
upgrade.
Modern hardware-based firewalls have much
higher capacities than some older, software-
based models. Firewalls are often bottlenecks,
greatly increasing transport delay as they
reach their limits.
Network backbones can become the bottle-
necks over time. Is the backbone now the
place where traffic slows down during peak
usage periods? Is it time to consider the new
optical switches and routers?
Network Architecture
Will laying out the network and the users
differently help improve the key VoIP
measurements? This is obviously a big step.
Consider changing the layout of your data
network for situations like these:
Could shorter, more direct routes be taken by
VoIP conversations, reducing their propaga-
tion and transport delays? For example, do
you have traffic going from New York City
through San Diego back to Florida?
Fewer hops can reduce the accumulated
transport delay. VoIP traffic is much more
sensitive to the number hops than traditional
TCP transactions. Do you have VoIP flows
taking 30 or 40 hops from end to end? Could
the number of hops be reduced by some re-
engineering of the network?
Clustering of traffic patterns means finding
out what users are using what network appli-
cations, and where they’re located. Is there
unnecessary data traffic flowing on the same
links as critical VoIP traffic? Could servers be
positioned closer to clients, reducing backbone
traffic? Could firewalls be placed differently?
QoS and Tuning
Network devices and applications have
powerful techniques available for dealing with
the sharing of network resources, collectively
referred to as Quality of Service (QoS). QoS
techniques work by handling traffic in differ-
ent classes differently. Two things have to
occur to make QoS work:

Copyright © NetIQ Corporation 2001.
8
• Classify - “What kind of traffic is this?”
• Handle - “How should this traffic be
treated?”
Networks with no QoS handle all traffic as
“best-effort” – the network devices do their
best to deliver frames from senders to their
receivers. But, all traffic is not created equal.
When congestion occurs in a network, should
some traffic be given premium treatment – for
example, should the payroll data be treated
better than VoIP audio traffic?
Also, what is the handling treatment the pre-
mium traffic should receive – guaranteed
bandwidth, a guaranteed route, or higher
priority during congestion? For each class of
traffic, what should occur as it traverses a
network? Should it be given high priority or
low priority? Should it get a guaranteed
amount of bandwidth or guaranteed latency?
During congestion, should it be treated as less
likely to be discarded? Does it require a
guaranteed route across the network?
Configuration changes to enable the handling
are made to network devices at the edges and
in the middle of a network. However, the
results of the configuration changes are seen
by the end users of the applications. This
wide separation of cause (configuration
changes) and effect (end-to-end behavior) is
one of the challenges of setting up QoS
successfully.
Classifying is usually done at the edge of a
network; handling is usually done in the mid-
dle. Decisions about classifying and handling
traffic are the important business decisions
involved with deploying QoS. Let’s look at
these a bit more.
Deciding How to Classify
Traffic
Network traffic needs to be identified in some
way to classify it. For example, some net-
worked applications can be readily identified
because they use a unique port number; in
contrast, applications which use dynamic
ports are hard to identify solely by looking at
port numbers. Here are seven ways IP traffic
can be classified:
DiffServ/TOS bits
Give marked traffic a certain priority to
the edge and middle of the network?
RSVP signaling
Reserve resources for a long-running
connection?
Port numbers and addresses
Give applications identified by the port
numbers or network addresses better
handling?
RTP header information
Treat audio better than video?
Data content
Treat binary data like GIF files better than
text strings?
Data rate
Treat low volume traffic better than high
volume?
Buffer size
Give small frames higher priority than
larger frames?
We’ll examine each of these in detail in this
section.
Traffic classification can be done at the edge of
a network, in the middle of a network, or at
the networked applications themselves.
• Devices that classify at the network edge
are common today. Edge devices, such as
traffic shapers, bandwidth managers, or
firewalls, provide central points of ad-
ministration. You can secure the edge
devices and apply a consistent set of
traffic rules at the places where most
traffic passes.
• Traffic classification in the middle of the
network is also common, but the devices
usually have less knowledge about the
traffic. Routers, for example, may classify
traffic based on flow rates per connection,
queuing conditions, and packet sizes.
• End users and applications themselves
rarely are trusted to classify traffic. If
they’re given a choice, most users want
their traffic to receive premium handling.
Sophisticated billing methods, that is,
ways to charge a premium for traffic given
premium handling, are needed for all net-
work users. Thus, applications generally
classify their own traffic only when the
applications know how to make the right
settings, their users are trusted in the
applications they use, and all network
devices on the route honor the application
settings.

Copyright © NetIQ Corporation 2001.
9
DiffServ/TOS Bits in IP Frames
The second byte in the header of every IP
frame can be used to mark priority. This byte
is known by two different names:
• In early TCP/IP specs, it is called the
Type of Service (TOS) byte, described in
RFC 791.
• In more recent TCP/IP specs, it is referred
to as the Differentiated Services (DS)
field, described in RFC 2474.
Both terms, TOS byte and DS field, refer to the
same eight bits. In both definitions, the last
two bits of this byte are reserved, so it’s only
the first six bits that are interesting. In the
TOS definition, these six bits are separated
into two three-bit fields. In the DiffServ (DS)
definition of this byte, the first six bits are
treated as a codepoint. Three of the sixty-four
possible bit settings have been defined to date.
Although only three codepoints are defined
today in the RFC, you can set any of the 64
possible values.
DS Field
DS Codepoint name
Description
000000
Best Effort
The default setting for most IP
traffic today.
011000
Assured Flow (AF), or
Controlled Load
Intended to classify streaming
traffic.
101000
Expedited Flow (EF), or
Guaranteed
Intended to classify high priority
traffic. Used by VoIP gateways to
mark VoIP traffic.
Figure 5. Codepoint definitions of the DiffServ field. Microsoft’s term “Controlled Load” is the same as the IETF
term “Assured Flow”; Microsoft’s term “Guaranteed” is the same as the term “Expedited Flow.”
The TOS/DiffServ bits are used in various
ways to classify network traffic; here are some
examples:
• To signal to edge devices
For example, traffic shapers can identify a
particular type of incoming traffic by its
port number, then set the DiffServ bits in
each datagram as it passes the traffic
along.
• To explicitly affect the DiffServ priority
handling in routers
DiffServ’s Assured Flow and Expedited
Flow codepoints can be used to mark
streaming and high priority traffic,
respectively.
• To signal precedence to routers
In the router technique known as
Weighted Fair Queuing (WFQ), the value
of the precedence bits is multiplied by the
effective bit rate, to increase the priority of
the marked frames.
Cisco’s Voice over IP (VoIP) devices set
the DS field to EF. This is probably the
one consensus recommendation of QoS
and VoIP – the VoIP traffic should have
the DS field set to 101000 in every data-
gram – and the network devices should be
configured to handle this setting with
higher priority.
RSVP Signaling
The Resource Reservation Protocol (RSVP)
reserves resources to meet requirements for
bandwidth, jitter, and delay on a particular
connection through a series of routers.
RSVP adds new IP control flows from end-to-
end. These IP frames instruct intermediate
routers to reserve a portion of their resources
(bandwidth, queues, and so on). Applications
use RSVP by making additional calls to their
underlying TCP/IP stacks. The TCP/IP stacks
communicate with the first router on their
route, which, in turn, communicate with the
other routers on the route. It takes a while to
set up the separate control flow, which itself
creates extra network traffic.
RSVP is best used within buildings, on a cam-
pus, or with a privately-owned WAN. It
works well when network connections are
long in duration (like streaming video) and
when only a few connections at a time require
reserved resources.

Copyright © NetIQ Corporation 2001.
10
RSVP setup is complex at the API and at the
devices in the network. Microsoft offers
applications a way to make RSVP
reservations, via its generalized quality of
service (GQOS) API. GQOS [7] is available on
Windows 98, Me, and 2000; it exposes about
10 parameters to be used in building a
resource reservation.
Port Numbers and Addresses
DiffServ and RSVP are new contenders in the
rollout of IP QoS techniques. In contrast, a
simpler technique is simply to look at the port
numbers and addresses in a frame to decide
how it should be classified. Many network
devices, particularly those at the edge of the
network, already use some form of inspection
of port number and addresses.
The destination port number is what’s used in
most classification decisions. Traffic
classification can also be done based on the
source or destination address in a frame.
• Inspect the source address when you want
to classify all the traffic coming from a
certain computer. For example, you can
use the source address of the sender of
multicast streaming traffic to classify its
traffic.
• Use the destination address to classify the
traffic going to a certain server, for
example.
RTP Header Information
The real-time transport protocol (RTP) is used
to send data in one direction with no
acknowledgment. The 12-byte RTP header,
which sits inside a UDP datagram, contains a
timestamp—so the receiver can reconstruct
the timing of the original data—and a
sequence number—so the receiver can deal
with missing, duplicate, or out-of-order
datagrams. RTP is frequently used for
sending streaming audio and video, whether
to one receiver (unicast) or to multiple
receivers (multicast).
The protocol handles the real-time
characteristics of multimedia applications
well. Streaming applications differ from
traditional data applications in the re-
quirements they place on the sender, the
receiver, and the network. When streaming
audio or video, it’s okay to lose some data—
but you don’t want large gaps (losing data,
however, is unacceptable for your payroll data
application).
Multimedia applications set the values in the
header of each RTP datagram. One of those
values is the “RTP Payload Type.” Network
devices use the RTP Payload Type to classify
RTP traffic and hence to handle it differently.
For example, you might configure a router to
give audio traffic (value MPA, which stands
for “MPEG audio”) smoother handling than
video traffic (value MPV, which stands for
MPEG video). There are RTP payload type
values defined for each of the codecs we’ve
discussed: PCMU for G.711 in the USA,
PCMA for G.711 in Europe, G729 for the
G.729 codec, and G723 for the G.723 family of
codecs.
Data Content
Some modern network devices can look deep
into the data content of frames to decide how
it should be classified. They often examine
URLs, to decide how to classify Web traffic.
Data Rate
A simple way to classify traffic is by its data
rate. For example, a common handling
technique known as Weighted Fair Queuing
(WFQ) avoids starvation of low-volume traffic
by boosting its priority compared to high-
volume traffic.
Applications themselves can control how fast
data is sent at two levels of granularity: on
each individual API Send call, or on each
connection.
Buffer Size
Traffic can be classified by the size of the
buffers used in the data transfer. For example,
devices in the middle of a network can be
configured to give small frames improved
handling over large frames. This technique is
based on the assumption that small frames are
part of short transactions – where response
time is important – whereas large frames are
used in file transfers where response time is
less important.
Applications can control the buffer size on
each API Send and Receive call. However, the
buffer size on an API Receive call command
does not influence the network traffic; it only

Copyright © NetIQ Corporation 2001.
11
influences how many Receive calls are made
to the protocol stack.
The default buffer size corresponds to the
default size most frequently used with the
protocol stack on each operating system. For
TCP, it’s generally around 32K bytes; for UDP,
it’s around 8K bytes.
Deciding How to Handle Each
Class of Traffic
After deciding how the network traffic is to be
classified, you need next to decide how each
class of traffic is to be handled. Is a given class
of traffic of traffic to be given higher priority
or lower priority? Should one class be less
likely to be discarded than another class?
Should classes of traffic get guaranteed
amounts of bandwidth or guaranteed latency?
The techniques for handling traffic fall into
three categories, based on queuing, flow rate,
or paths:
Queue-based
The routers on the path manipulate their
queues of outgoing traffic to
accommodate classes of traffic differently.
Examples include RSVP (resource
reservation protocol), WFQ (weighted fair
queuing), LFI (link fragmentation and
interleaving), LLQ (low latency queuing),
RED (random early detection), and WRED
(weighted random early detection).
Rate-based
Rate-based handling is generally done by
traffic shapers or bandwidth managers at
the edge of a network. They assure
certain classes of traffic flow at a certain
rate. They’re often used to limit traffic to
consume “no more” than a specified
amount of bandwidth. For example, you
might limit Web traffic (classified by
seeing port number 80) to less than 500
kbps of throughput on a given link.
Path-based
Some classes of traffic take preferred paths
through an IP network, compared to other
traffic that just takes the “best effort” path.
The most common technique is MPLS
(multi-protocol label switching), where
traffic is identified at the edge of a
network and forwarded on different paths
depending on its classification.
Setting up QoS in a Network
It’s surprisingly difficult to get QoS set up to
function well in a network. Let’s look at some
of the reasons:
• Deciding which traffic is in each class is
often a political decision.
• Network IT staff lack of knowledge and
experience.
Much of QoS is new technology and there
aren’t many good tips and techniques
broadly available.
• Many QoS schemes and parameters exist
today.
Each QoS scheme has its own terminology
and tuning peculiarities, which are new to
most network personnel.
• There are lots of device interconnections
and interactions.
Many network devices and applications
are potentially involved. Mismatches in
device setup can occur at any of them.
The large “cross-product” of potential
problems makes setup particularly error-
prone. See some of Cisco’s manuals on
VoIP and QoS [8] for more details.
• QoS handling is imperceptible under light
load.
QoS effects can generally only be observed
against heavy traffic – that is, under stress
conditions. QoS testing requires a
congested network
• to detect its behavior,
• to see if it’s configured right,
• to show some classes getting im-
proved handling,
• to see if it still works right after
making any change, and
• to see if you’re getting the premium
handling you paid for.
Configuring network devices one-at-a-time,
by hand, is so error-prone it is essentially out
of the question for most large networks.
Fortunately, a new set of tools – policy-based
network management software – offers the
usability needed to make QoS tenable.

Copyright © NetIQ Corporation 2001.
12
Summary
The process of getting VoIP deployed
successfully on your data network can become
a straightforward decision tree.
Run a VoIP Readiness Assessment. Look
carefully at call quality, from one call to the
maximum number of expected calls at peak
network usage across a range of locations.
If the call quality is okay and the other traffic
is relatively unaffected, great – it avoids lots of
complexity. Start your VoIP deployment.
If the call quality is not okay, determine what
the problems are and where they’re located.
What is most influencing the poor quality:
one-way delay, jitter, packet loss, or a
combination of all three? Can a simple change
in the VoIP configuration options, such as the
choice of codec, improve the call quality
sufficiently? Where are the most likely
bottlenecks?
Now, look at the costs of making the required
network improvements. Choices include
adding more bandwidth, upgrading or
replacing your existing equipment, laying out
your network architecture in an improved
manner, reconfiguring or tuning the network
for QoS, or a combination of these.
This is a just the start of a decision tree for a
network administrator, because the costs of
these different choices are not equal. Adding
more bandwidth may be a recurring expense,
upgrading the hardware may be a capital
expense, and QoS may appear to be free, but it
usually has a high cost in personnel time.
Look at the costs in as much depth as you can
and decide whether you want to proceed with
making the network changes. It’s an iterative
process of making the most cost effective
improvements a step at a time, then repeating
the VoIP Readiness Assessment to see if
you’re reaching your goal in terms of call
quality.
If your estimate of the costs to make the data
network ready for VoIP appear too high, this
is a good time to look at your VoIP
deployment plan again. You should have a
good understanding of what it will take, so
you have some choices:
• you can decide how to budget its cost
intelligently at the right time in the future,
• you can increase your current budget and
proceed – considering this a suitable long-
term investment, or
• you might approach the VoIP deployment
in a stepwise manner, doing some parts
now and some parts later.
About the Author
John Q. Walker II is the director of network
development at NetIQ Corporation. He was a
founder of Ganymede Software Inc., which be-
came part of NetIQ in spring 2000. He can be
reached at
Acknowledgments
Gracious thanks to the readers who helped
improve this paper: Aimee Doyle, Conley
Smith, and Carl Sommer.
For More Information
1. Using Chariot to Evaluate Data Network for VoIP Readiness, John Q. Walker and Jeff Hicks, NetIQ
Corporation, Spring 2001,
http://www.netiq.com/products/chr/whitepapers.asp
2. Checklist of VoIP Network Design Tips, John Q. Walker, NetIQ Corporation, April 2001,
http://www.netiq.com/products/chr/whitepapers.asp
3. What You Need to Know Before You Deploy VoIP, Scott Hamilton and Charles Bruno, Tolly
Research, April 2, 2001,
http://www.netiq.com/products/chr/whitepapers.asp
4. ITU-T Recommendation P.800, “Methods for subjective determination of transmission quality.”
5. ITU-T Recommendation G.107, “The E-model, a computational model for use in transmission
planning.”
6. Differentiated Services (DS) field, RFC 2474,

Copyright © NetIQ Corporation 2001.
13
7. Microsoft’s Generic Quality of Service (GQOS) spec,
http://msdn.microsoft.com/library/default.asp?ShowPane=false&URL=/library/psdk/gqos/q
osstart_2cdh.htm
8. Cisco IP Telephony QoS Design Guide, Cisco Systems,
http://www.cisco.com/univercd/cc/td/doc/product/voice/ip_tele/avvidqos/avvid.pdf
Copyright Information
NetIQ Corporation provides this document “as is” without warranty of any kind, either express or implied, including,
but not limited to, the implied warranties of merchantability or fitness for a particular purpose. Some states do not
allow disclaimers of express or implied warranties in certain transactions; therefore, this statement may not apply to
you. This document and the software described in this document are furnished under a license agreement or a non-
disclosure agreement and may be used only in accordance with the terms of the agreement. This document may not
be lent, sold, or given away without the written permission of NetIQ Corporation. No part of this publication may be
reproduced, stored in a retrieval system, or transmitted in any form or by any means, electronic, mechanical, or
otherwise, with the prior written consent of NetIQ Corporation. Companies, names, and data used in this document
are fictitious unless otherwise noted. This document could include technical inaccuracies or typographical errors.
Changes are periodically made to the information herein. These changes may be incorporated in new editions of the
document. NetIQ Corporation may make improvements in and/or changes to the products described in this
document at any time.
© 1995-2001 NetIQ Corporation, all rights reserved.
U.S. Government Restricted Rights: Use, duplication, or disclosure by the Government is subject to the restrictions as
set forth in subparagraph (c)(1)(ii) of the Rights in Technical Data and Computer Software clause of the DFARs
252.227-7013 and FAR 52.227-29(c) and any successor rules or regulations. AppManager, the AppManager logo,
AppAnalyzer, Knowledge Scripts, Work Smarter, NetIQ Partner Network, the NetIQ Partner Network logo, Chariot,
End2End, Pegasus, Qcheck, OnePoint, the OnePoint logo, OnePoint Directory Administrator, OnePoint Resource
Administrator, OnePoint Exchange Administrator, OnePoint Domain Migration Administrator, OnePoint Operations
Manager, OnePoint File Administrator, OnePoint Event Manager, Enterprise Administrator, Knowledge Pack,
ActiveKnowledge, ActiveAgent, ActiveEngine, Mission Critical Software, the Mission Critical Software logo,
Ganymede, Ganymede Software, the Ganymede logo, NetIQ, and the NetIQ logo are trademarks or registered
trademarks of NetIQ Corporation or its subsidiaries in the United States and other jurisdictions. All other company
and product names mentioned are used only for identification purposes and may be trademarks or registered
trademarks of their respective companies.
Document Outline
- Measuring Call Quality Objectively
- Testing VoIP Call Quality
- Getting your Data Network Ready for VoIP
- Summary
- Copyright Information
Wyszukiwarka
Podobne podstrony:
Forex Online Manual For Successful Trading
Handbook for Radiological Monitors
Formula for Success
B M Knight Marketing Action Plan for Success in Private Practice
Forex Online Manual For Successful Trading
Handbook for Resistance Spot Welding
Ultimate Handbook for Beginners
Sailing Introductory Handbook For Sailing Boats
11 Cramming for success study and academic work
B M Knight Marketing Action Plan for Success in Private Practice
Your Workbook For Success Thomas Robarge
Handbook for Radiological Monitors
94 Recepta na sukces Recipe for success, Jay Friedman, May 12, 2010
10 Tips For Successful Public Speaking
Handbook for the New Paradigm by George Green
Babauta Leo Zen Habits Handbook for Life
Handbook for Working with Defendants and Offenders with Mental Disorders Third Edition
Pager Handbook for the Radio Amateur
commanders handbook for antiterrorism readiness
więcej podobnych podstron