Copyright
Table of Contents
Index
Full Description
About the Author
Reviews
Colophon
Examples
Reader reviews
Errata
Oracle8i Internal Services for Waits, Latches, Locks,
and Memory
Steve Adams
Publisher: O'Reilly
First Edition October 1999
ISBN: 1-56592-598-X, 132 pages
Buy Print Version
Based on Oracle8i, release 8.1, this concise book contains
detailed, hard-to-find information about Oracle internals
(data structures, algorithms, hidden parameters, and
undocumented system statistics). Main topics include waits,
latches, locks (including instance locks used in parallel
server environments), and memory use and management.
Aimed especially at readers doing advanced performance
tuning.

Oracle8i Internal Services for Waits, Latches, Locks, and Memory
Copyright © 1999 O'Reilly & Associates, Inc. All rights
reserved.
Printed in the United States of America.
Published by O'Reilly & Associates, Inc., 101 Morris Street,
Sebastopol, CA 95472.
Oracle® and all Oracle-based trademarks and logos are
trademarks
or
registered
trademarks
of
Oracle
Corporation, Inc. in the United States and other countries.
O'Reilly & Associates, Inc. is independent of Oracle
Corporation.
The O'Reilly logo is a registered trademark of O'Reilly &
Associates, Inc. Many of the designations used by
manufacturers and sellers to distinguish their products are
claimed as trademarks. Where those designations appear
in this book, and O'Reilly & Associates, Inc. was aware of a
trademark claim, the designations have been printed in
caps or initial caps. The use of the bumblebee image in
association with Oracle8i internal services is a trademark
of O'Reilly & Associates, Inc.
While every precaution has been taken in the preparation
of this book, the publisher assumes no responsibility for
errors or omissions, or for damages resulting from the use
of the information contained herein.

Oracle8i Internal Services for Waits, Latches, Locks, and
Memory
Preface
Why This Book?
Warnings
Audience for This Book
About the APT Scripts
Conventions Used in This Book
Comments and Questions
Acknowledgments
1. Introduction
1.1 The Oracle Kernel Layers
1.2 The Kernel Services
2. Waits
2.1 Semaphores
2.2 Wait Statistics
2.3 Reference
3. Latches
3.1 Latches and Locks
3.2 Parent and Child Latches
3.3 Latch Gets
3.4 Advanced Latching Control
3.5 Reference
4. Locks
4.1 Lock Usage
4.2 Lock Modes
4.3 Enqueue Locks
4.4 Row Cache Enqueues
4.5 Library Cache Locks and Pins
4.6 DML Locks
4.7 Buffer Locks
4.8 Sort Locks
4.9 Reference
5. Instance Locks
5.1 The Lock Manager
5.2 Global Locks
5.3 PCM Instance Locks
5.4 Other Instance Locks
5.5 Reference
6. Memory
6.1 The SGA
6.2 The Shared Pool
6.3 Process Memory
6.4 Reference
Colophon

Preface
A few years ago, I set my heart on researching and writing a truly advanced
Oracle performance-tuning book. Soon, I had a detailed outline running to more
than thirty pages. But when I started to write, I began to realize how much I had
yet to learn about Oracle. Each chapter was going to require considerably more
research than I had at first imagined. In particular, I began to realize that an
understanding of some aspects of Oracle internals would be vital to my quest. So
I began to learn what I could of Oracle internals, starting with the X$ tables.
If I had known then what I know now, about how vast an undertaking I was
commencing, I would probably never have attempted it. And many times I would
have given up in despair, except for the encouragement of my friends. They
always believed that I could comprehend the incomprehensible and construct a
coherent understanding of how Oracle works and should be tuned. It has been
somewhat like trying to determine the exact shape of an iceberg by walking all
over it and taking careful measurements of subsurface vibrations.
Why This Book?
My advanced Oracle performance-tuning book is still a dream. This little book is
something else: an introduction to Oracle internals. It builds the foundation
necessary for advanced performance tuning by explaining some of the basic
aspects of Oracle internals in detail.
Here you will find many of the undocumented system statistics explained. You
will learn how to gather additional statistics from the X$ tables. Your
understanding of how Oracle works will be deepened with clear explanations of
many of Oracle's internal data structures and algorithms. You will be alerted to
potential performance problems that are not mentioned in the documentation.
And you will expand your repertoire of tuning solutions and troubleshooting
techniques by learning how to use numerous hidden parameters and other
undocumented features.
Warnings
The kind of Oracle internals information I've included in this book is not readily
available to customers. Because I
have
never been an Oracle insider, the material
in this book has had to be compiled the hard way. I began by studying the

structure and contents of the X$ tables, and poring over trace files. I then
formulated hypotheses and tested them. Because of this approach, it is likely that
some of my conclusions about how things work are wrong, and that some of my
suggestions are misguided, or applicable only under limited conditions. So, the
onus is on you to test everything for yourself. If you find any errors, please email
me so that they can be corrected (see "Comments and Questions").
You should also note that this book goes boldly where Oracle Support fears to tread.
I explain and at times recommend the use of various undocumented features that I
find essential to advanced performance tuning. However, Oracle has chosen to leave
those same features undocumented—presumably with valid reasons. So please don't
expect Oracle to assist you in their use. Try them by all means, but if you have a
problem, quit. Don't bother Oracle Support about it.
Finally,
please
note that this book is oriented towards Oracle8i, release 8.1.
Although most of the material is applicable to earlier releases as well, some of it is
not. In particular, there have been major changes in Oracle Parallel Server in
both the 8.0 and 8.1 releases, and a number of the parameters have been hidden
in release 8.1.
Audience for This Book
This book is intended for Oracle database administrators (DBAs) and developers
who need to understand Oracle performance in detail. Although the information
is advanced, the presentation is easy to
follow
. Anyone who is familiar with the
basics of the Oracle architecture and has an aptitude for performance tuning will
be able to appreciate everything in this book. However, seasoned veterans will no
doubt appreciate it the most.
About the APT Scripts
This book makes a number of references to APT scripts. APT stands for Advanced
Performance Tuning. It is merely my personal toolkit of Oracle performance
tuning scripts. The scripts referred to in this book can be obtained from O'Reilly's
web site or from my own (see "Comments and Questions"). APT is not a
commercial product, and I do not warrant that the scripts are error-free. But you
are free to use them, or glean from them what you may.
Conventions Used in This Book
The following conventions are used in this book:

Italic
Used for the names of files, scripts, latches, statistics, and wait events; also
used for emphasis and for new terms
Constant width
Used for examples and literals
UPPERCASE
Used for Oracle SQL keywords, initialization parameters, and the names of
tables, views, columns, packages, and procedures
Comments and Questions
Please address comments and questions concerning this book to the publisher:
O'Reilly & Associates, Inc.
101 Morris Street
Sebastopol, CA 95472
800-998-9938 (in the U.S. or Canada)
707-829-0515 (international or local)
707-829-0104 (fax)
You can also send us messages electronically (
booktech@oreilly.com
). For
corrections and amplifications to this book, as well as for copies of the APT scripts
referred to in the book, check out O'Reilly & Associates' online catalog at:
http://www.oreilly.com/catalog/orinternals/
The APT scripts can also be obtained from my web site at:
http://www.ixora.com.au/
You can also contact me directly at:
steve.adams@ixora.com.au
See the advertisements at the end of the book for information about all of O'Reilly &
Associates' online services.
Acknowledgments
My partner in this project, as in all things, is my wife, Alison Adams. If you
appreciate this book, then it is to Alison that your thanks are due. Much as I have
tried to limit the impact of researching and writing this book on my family, this
project
has deprived Alison and our young children, Jennifer, Stephanie, and
David of much time that would otherwise have been spent with them.
I would also like to thank Guy Harrison, who first got me interested in Oracle
performance, Jonathan Lewis, from whom I have learned the most, Dave Ensor,
who corrected my understanding of immediate gets, and Jared Still, who has
always been willing to run tests to check my ideas. Thank you, friends, for your
help with reviewing the first draft of each chapter, and for your constant
encouragement. Thanks also to the many people with whom I have interacted on
the Internet mailing lists and discussion forums over the years. You have

provided a wealth of vicarious experience and sustained encouragement in my
quest to understand Oracle.
Thanks to the team at O'Reilly & Associates for agreeing to publish this book, and
for their work in preparing it, and thanks to the team of final reviewers: Jonathan
Gennick, Amjad Daoud, and Anjo Kolk.

Chapter 1. Introduction
Why are people so intensely interested in Oracle internals? Partly because
internals information can be useful for tuning and troubleshooting. But also
because Oracle Corporation has kept most of the internals secret, while revealing
just enough to tantalize.
In fact, Oracle internals information is needed only for advanced performance
tuning. It's true that basic application tuning is the kind of tuning that's most
often needed, and the kind that has the biggest impact. Nevertheless, there are
times when advanced performance tuning is necessary, and that is when you
need a deep understanding of how Oracle works. This book provides some of the
foundations for that understanding.
To appreciate the contribution that this book makes, and to put it in context, you
need to have a basic understanding of the layers of the Oracle kernel.
1.1 The Oracle Kernel Layers
The Oracle kernel is comprised of layers; the main layers are shown in
Figure
1.1
. Each layer depends upon the services of the layers below it, and may call any
of them directly, in any order. However, control is never passed up the stack,
except when returning from a call.
The one apparent exception to this rule is that the data layer and the transaction
layer sometimes need to perform recursive transactions for tasks such as index
block splits or extent space management, and recursive calls are needed for tasks
such as trigger execution or SQL statement execution from within stored
program units. However, instead of calling back to the kernel execution or
compilation layer from within the same session or call context, a separate context
is established and the stack is reentered from the top layer.
Figure 1.1. The Oracle kernel layers
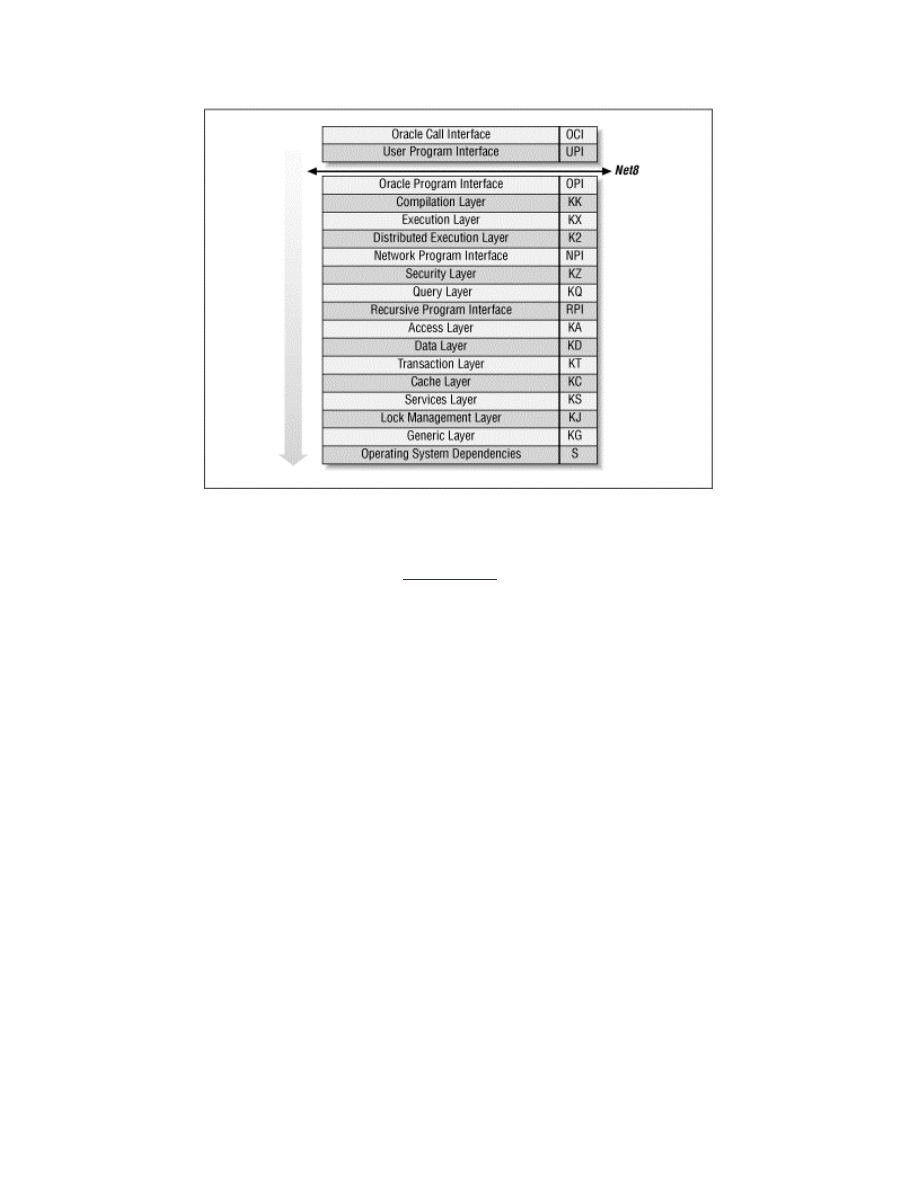
Each layer has a short name, or abbreviation, that is used as a prefix to the names
of its modules. For example, KC is the short name for the kernel cache layer.
These short names are shown in
Figure 1.1
and in the following list. Similarly,
each of the modules that comprise the layers has a short name too. For example,
KCR is the redo management module within the cache layer. These module
names are prefixed to the names of their data structures and function calls. For
example, KCRFAL is the redo allocation latch. This naming convention makes
Oracle's names seem rather cryptic and formidable at first, but they soon become
surprisingly easy to recognize and a great aid to understanding. Nevertheless, you
will be pleased to know that this book uses the verbose names in preference to
their somewhat cryptic alternatives.
The Oracle call interface (OCI)
The Oracle call interface is the lowest level at which client programs are
intended to interact with Oracle. This interface is well documented and
provides access to most of the functionality of Oracle, including advanced
features such as object navigation, and sophisticated transaction and
session control. Applications with advanced requirements have to use OCI
directly, in order to access the features that are not available in Oracle's
other development tools.
The user program interface (UPI)
OCI is based on the user program interface. There are some UPI facilities
that are not yet available via OCI, and so some of the Oracle tools actually

call this interface directly. Precompiler programs also call the user
program interface, but indirectly via the SQLLIB library, which is an
undocumented alternative to OCI.
The Oracle program interface (OPI)
The user program interface is the lowest layer of the client-side call stack,
and the Oracle program interface is the highest layer of the server-side call
stack. In most configurations, Net8 bridges the gap between UPI and OPI.
However, in single-task executables there is no gap, and the UPI calls
correspond directly to OPI calls.
The compilation layer (KK)
This is the top layer of the Oracle kernel proper. This layer is responsible
for the parsing and optimization of SQL statements and for the
compilation of PL/SQL program units.
The execution layer (KX)
This layer handles the binding and execution of SQL statements and
PL/SQL program units. It is also responsible for the execution of recursive
calls for trigger execution, and for the execution of SQL statements within
PL/SQL program units.
The distributed execution layer (K2)
The distributed execution layer establishes the transaction branches for
distributed transactions, and handles the management of the two-phase
commit protocol.
The network program interface (NPI)
When remote objects are referenced in a SQL statement, the network
program interface sends the decomposed statement components to the
remote database instances and receives the data in return.
The security layer (KZ)
This layer is called by the compilation and execution layers to validate the
required object and system privileges.
The query layer (KQ)
This layer provides rows to the higher layers. In particular, the query layer
is responsible for caching rows from the data dictionary, for use by the
security and compilation layers.
The recursive program interface (RPI)
The recursive program interface is used to populate the dictionary cache
from the data dictionary. Row cache recursive SQL statements are
executed in a separate call context, but are not parsed and optimized in the
compilation layer.
The access layer (KA)

The access layer is responsible for access to database segments. This is the
first layer of the lower half of the kernel.
The data layer (KD)
This layer is responsible for the management and interpretation of data
within the blocks of database segments such as tables, clusters, and
indexes.
The transaction layer (KT)
This layer is responsible for the allocation of transactions to rollback
segments, interested transaction list changes within data blocks, changes
to rollback segment blocks for undo generation, transaction control
facilities such as savepoints, and read consistency. The transaction layer is
also responsible for space management, both at the level of segment free
lists and at the level of tablespace extent allocation.
The cache layer (KC)
The cache layer manages the database buffer cache. It uses operating
system dependent facilities for data file I/O, provides concurrency control
facilities for local access to the cache buffers, and provides parallel cache
management (PCM) instance locking facilities for Oracle parallel server.
The other main responsibility of the cache layer is the control of redo
generation into the log buffer, and the writing of redo to the log files. The
cache layer also caches control file information.
The services layer (KS)
The services layer provides low-level services that are used by all the
higher layers, such as error handling, debugging, and tracing facilities, as
well as parameter control and memory services. In particular, the service
layer is responsible for generic concurrency control facilities such as
latches, event waits, enqueue locks, and instance locks. This layer is also
responsible for the management of the data structures for background and
user processes and sessions, as well as state objects, inter-process
messages, and system statistics.
The lock management layer (KJ)
This layer is responsible for the locking used for synchronization and
communication between the instances of a parallel server database.
The generic layer (KG)
The generic layer provides management for the generic data structures
that are used by the higher layers, such as linked lists. Of particular
interest are the library cache and the memory allocation heaps used for the
shared pool and session memory.
The operating system dependencies (S)

Oracle uses operating system facilities for I/O, process scheduling,
memory management, and other operations. The implementation details
are operating system dependent, and so these details are isolated into a
separate layer.
1.2 The Kernel Services
This book covers the kernel services for waits, latches, locks, and memory.
Although there is relatively little you can do to tune these services themselves,
you will need to understand them when you tune any other part of
Oracle
.
Chapter 2
The wait statistics are the most important Oracle statistics for advanced
performance tuning. This chapter explains how to gather and use these statistics.
Chapter 3
Oracle makes extensive use of latches, and advanced performance tuning often
involves the prevention of latch contention. This chapter provides a foundation
for such tuning by explaining how latches are used.
Chapter 4
Oracle uses many types of locks. This chapter explains how locks are used, and
how to diagnose locking problems.
Chapter 5
Oracle parallel server technology adds an extra dimension to Oracle tuning. This
chapter explains how parallel server locking is implemented, and what the
statistics mean.
Chapter 6
This chapter explains how Oracle's internal memory management works. I pay
particular attention to the inner workings of the shared pool, and to assessing
whether it is sized correctly.
Although there is much more to Oracle internals than this small book covers,
these chapters provide the foundation that you need for advanced performance
tuning.

Chapter 2. Waits
In an Oracle instance many processes (or threads of a single process) work
together. To work together, they must communicate, and one of main ways that
they communicate is via semaphores. A semaphore is a signal. It is somewhat like
a railway signal that tells trains whether to stop and wait, and when to go. Oracle
server processes often need to stop and wait:
??
Sometimes because a resource is not available
??
Sometimes because they have no work to do
??
Sometimes because they need to wait for another server process to
perform a prerequisite task
Semaphores allow
Oracle
server processes to stop and wait, and then to be notified
when they should resume processing.
2.1 Semaphores
There is a semaphore for every Oracle server process. Processes wait on their
semaphore when they need to wait for a resource, or need work to do, or need
work to be done. When the resource has been freed, or when there is work to do,
or when the prerequisite work has been done, then their semaphore is posted as a
signal to stop waiting.
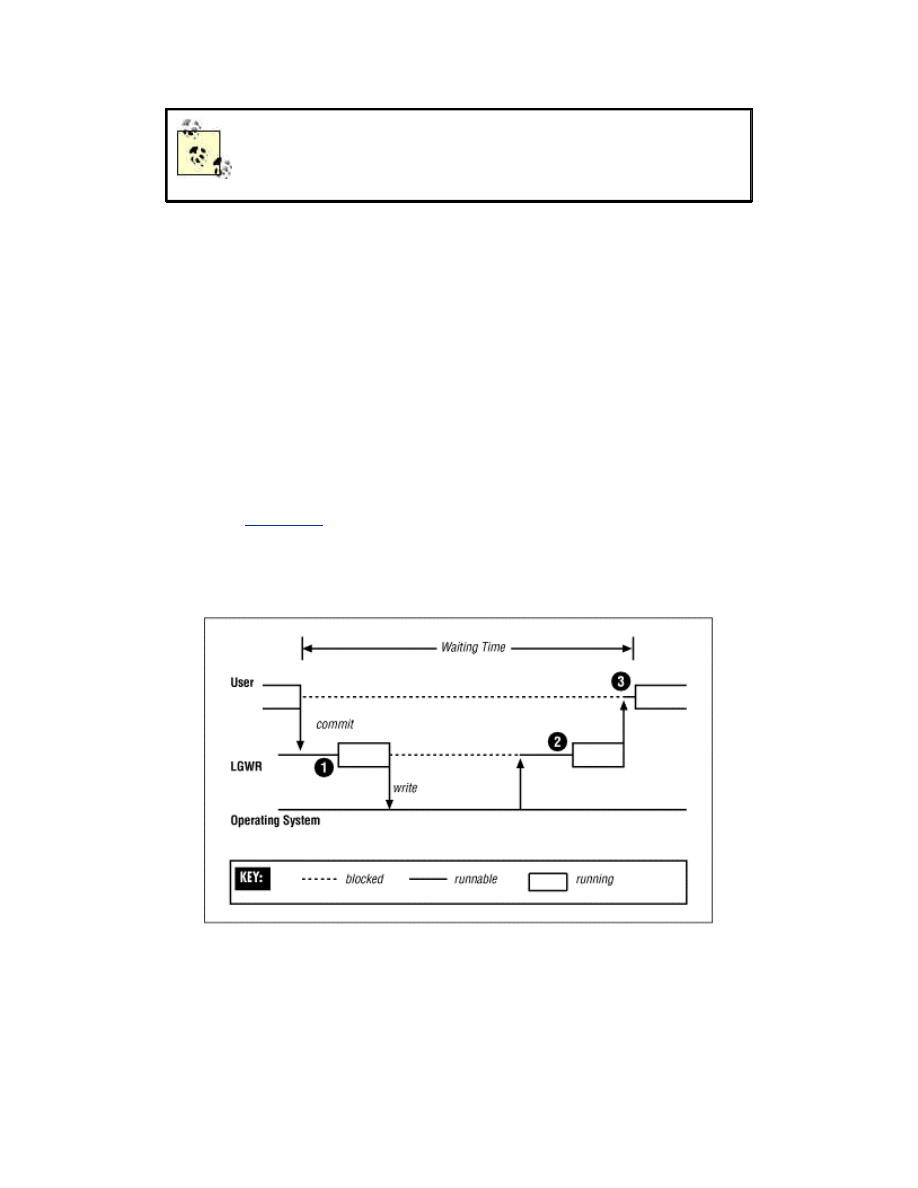
For example, LGWR (the Log Writer process) may be waiting on its semaphore
for work to do, while a user process may be copying redo information into the
redo log buffer. When the user commits, LGWR must write the redo and commit
marker to the log file while the user waits. To achieve this, the user process posts
LGWR's semaphore to signal that it can stop waiting for work to do, as some
work is now available. The user process then waits on its own semaphore. When
the log file I/O has completed, LGWR posts the semaphore of the user process to
signal that it can now begin its next transaction, because the commit operation
has completed. LGWR then waits on its own semaphore again, because it has no
more work to do.
For another example, process A may need to update a row, but find that process
B has not yet committed an earlier update to the same row. Process A must wait
for process B to commit. To achieve this, process A will wait on its semaphore.
When process B commits, it will post process A's semaphore to signal that it can
now proceed with its update.

2.1.1 Semaphore Facilities
Semaphores are an operating system facility. When an Oracle process is waiting
on its semaphore, the operating system will not schedule it to run on a CPU. In
operating system terms, it is blocked, not runnable. When the semaphore is
posted, the operating system status of the process is changed from blocked to
runnable, and the process will be scheduled to run as soon as possible.
Some operating systems support more than one type of semaphore. System V
semaphores are the most common. The semaphore data structures for System V
semaphores form a fixed array in kernel memory sized by the SEMMNS kernel
parameter. To post a semaphore or wait on a semaphore, processes must use the
semop( ) system
call
. Because they are implemented in the operating system
kernel, System V semaphores suffer from unnecessarily high system call context
switch overheads and poor scalability due to serialization requirements for access
to the kernel data structures.
For better performance and scalability, an alternative set of semaphore
operations is supported on several
operating
systems. These are implemented in a
pseudo device driver, called a post-wait driver. The data structures for these
semaphores reside in user memory, rather than kernel memory, and can
therefore be manipulated by the pseudo device driver running in user context.
This reduces the number of system call context switches, and improves
scalability, but it is operating system specific.
The POSIX real-time extensions subcommittee has identified the need for a
standards-compliant user memory semaphore facility. The POSIX.1b standard
(formerly POSIX.4) defines both the interface and implementation requirements
for such a semaphore facility that is elegant and efficient, not to mention
portable. POSIX.1b semaphores are now available on many operating systems.
Which semaphore facility Oracle
uses
is operating system and release specific. If
your Oracle installation guide has instructions about setting the SEMMNS kernel
parameter, that means System V semaphores will be used by default.
Unfortunately, this is still the case on a large number of operating systems.
Incidentally, the prevalent recommendation to set SEMMNS to 200, without
regard for the projected number of Oracle processes, or the requirements of other
system and application software, is ill-conceived. You must allow one semaphore
for each Oracle server process, in addition to other requirements, as explained
more fully in
Table 2.1
.

You should also be aware that on some platforms each Oracle instance requires
its semaphores to be allocated in a single semaphore set. So the SEMMNI
parameter need only allow one semaphore identifier per instance, and SEMMSL
(if defined) must be no less than the largest PROCESSES parameter that might be
required for any instance. This is necessary to enable vector posts. Vector posts
may be used, mainly by the key background processes, LGWR and DBWn, to post
multiple waiting processes in a single semaphore operation. The use of vector
posts is dependent on the setting of the _USE_VECTOR_POSTS parameter.
Hidden Parameters
Parameters that begin with an underscore, such as
_USE_VECTOR_POSTS, are hidden parameters. You will not find
them in V$PARAMETER, or see them with the SHOW PARAMETERS
command, because they are hidden. You certainly will not find them
explained in the Oracle documentation, because they are
undocumented. You can, however, get their descriptions with the APT
script hidden_parameters.sql and check their values with the script
all_parameters.sql .
Some hidden parameters are operating system specific. Some are
needed only in unusual recovery situations. Some are used to disable
or enable new features. And many are related to obscure performance
issues. As with all undocumented features, hidden parameters may
disappear or change in a future release. You should therefore use them
as a last resort, and only after checking with Oracle Support, and
documenting the issues fully for your successor.
Further, if the SEMMNU kernel parameter is defined for your operating system,
it should be greater than the projected number of concurrent semaphore
operations system-wide. For systems with many semaphore client processes, the
default may be inadequate. If so, semaphore operations will fail intermittently at
periods of peak activity and return the ORA-7264 or ORA-7265 errors. To avoid
this, the SEMMNU parameter must be at least equal to the number of CPUs plus
the peak length of the CPU run queues.
Table 2.1. System V Semaphore Parameters
Parameter
Description
SEMMNS
The number of semaphores in the system. In addition to the

requirements of the operating system and other software, you should
allow at least one semaphore for each Oracle server process—that is,
the sum of the setting of the PROCESSES parameter for all instances
on the system. If the semaphore clients are not always shut down and
started up in strict sequence, then an extra allowance at least equal to
the largest single requirement is recommended.
Further, the kernel parameter controlling the maximum number of
simultaneous processes owned by a single named user (often MAXUP)
should be at least equal to the SEMMNS setting, with an allowance for
other administrative processes owned by the "oracle" user that do not
require semaphores. However, this parameter should not be so large
as to allow the risk of another user creating so many processes that the
kernel process table would be completely filled. Therefore, the kernel
parameter controlling the maximum number of simultaneous
processes for all users (often NPROC) should be at least three times
the value of SEMMNS.
SEMMSL
The size limit for a single semaphore set. This parameter is not defined
on some operating systems. Where it is defined, and where Oracle
requires all the semaphores for an instance to be allocated in a single
semaphore set, this parameter must be at least equal to the largest
PROCESSES parameter required for any instance.
SEMMNI
The number of semaphore set identifiers in the system. In addition to
the requirements of the operating system and other software, you
should allow one identifier per instance, or more if the SEMMSL
parameter is set such that multiple semaphore sets will be required for
any instance.
SEMMNU
The number of semaphore undo structures in the system. Undo
structures are used to recover the kernel semaphore data structures in
the event of the unexpected death of a process during a semaphore
operation. SEMMNU should be greater than the peak number of
running and runnable processes.
If Oracle uses System V semaphores on your operating system by default, but also
supports the use of a post-wait driver, then you should use the post-wait driver
instead. This normally
involves
setting the USE_POST_WAIT_DRIVER
parameter to TRUE, and it is sometimes necessary to set the
POST_WAIT_DEVICE parameter as well. Please consult your Oracle installation
guide, because the instructions are operating system and release dependent.
The semaphore parameters are operating system kernel
parameters and cannot be set in the Oracle initialization
parameter file (INIT.ORA).
If your installation guide makes no mention of setting kernel semaphore
parameters or of a post-wait driver, the selection and configuration of the
semaphore facility for your operating system is
automatic
.
2.1.2 Scheduling Latencies
When a process is posted, its operating system status is changed from blocked to
runnable. However, that does not mean it will be scheduled to run on a CPU
immediately. It must wait at least until the operating system's process scheduler
is next run, and possibly longer if there are higher priority processes waiting to
run. The delay from when a process is posted until it begins running is called the
scheduling latency. Scheduling latencies contribute to Oracle response times, as
illustrated in
Figure 2.1
, and so minimizing scheduling latencies is an important
part of performance tuning.
Figure 2.1. The three scheduling latencies for a commit
Many operating system scheduling algorithms adjust the execution priority of
processes in proportion to the amount of CPU time that they have consumed
recently. In very busy Oracle
environments
, this has the unfortunate effect of
degrading the execution priority of key background processes, such as LGWR,
DBWn, LCKn, and LMDn. This causes an increase in scheduling latencies for

those processes, and can in the extreme make the entire instance bottleneck on
the services of the affected background processes.
Some operating
systems
support multiple scheduling algorithms. Where possible,
you should choose a scheduling algorithm that does not degrade the execution
priority of processes in this way. Failing that, your operating system may provide
a priority fixing facility. If the execution priority of a process is fixed, it will not
degrade. In some cases, priority fixing is available to all users, and Oracle uses it
automatically. In other cases, it is only available to the system administrator, and
specially privileged users. If so, the "oracle" user must be granted this privilege,
or the system administrator must start the Oracle instance from a fixed priority
command shell, so that all Oracle processes will run with fixed priority.
Where priority fixing is not available, you may be able to obtain equivalent relief
from the priority degradation mechanism by artificially raising the execution
priority of the key background processes, or even running them in the real-time
priority class. You may feel reluctant to do this, on the basis that Oracle has often
recommended that all Oracle processes should run at the same priority. The
rationale for this recommendation is to prevent the possibility of a low-priority
process holding a critical resource but being unable to free it because of CPU
starvation, while other high-priority processes try repeatedly to obtain that
resource. However, this rationale scarcely applies to raising the priority of the
background processes. These processes will soon sleep if the resources they
require are not available, and beyond that will only consume CPU time in
proportion to the amount of work being done by the rest of the instance. So, there
is no risk of CPU starvation for other Oracle processes.
2.1.3 Timeouts
Oracle server processes are never willing to wait indefinitely, lest they never be
posted and wait forever. Fortunately, semaphore waits can be interrupted. So
before an Oracle process begins to wait on its semaphore, it arranges for its sleep
to be interrupted by setting an alarm clock, or timeout. If the process is posted, it
switches the alarm clock off and then continues processing. However, if the
timeout expires, the wait is interrupted by a SIGALRM signal. The process then
has the opportunity to reassess the situation and decide whether it wants to
continue to wait.
For example, a process waiting for an enqueue lock may perform deadlock
detection when its wait times out. If a deadlock is discovered, the statement will

be rolled back and an exception will be raised, but if not, the process will set a
new timeout and will begin to wait on its semaphore again.
It sometimes happens that a process is posted very shortly before its timeout is
due to expire, and the
alarm
goes off just as the process is trying to switch it off. In
this case, the Oracle process concerned will write a message to its trace file:
Ignoring SIGALRM
If you find some
trace
files with this message, it is nothing to be alarmed about. It
merely tells you that waiting processes are sometimes not being posted as quickly
as you might wish, and that is something you ought to be aware of anyway from
the wait statistics.
2.2 Wait Statistics
The Oracle wait statistics are pure gold—but not to be overvalued. Many types of
performance problems are easy to identify from the wait statistics. If Oracle is
waiting extensively for resources such as latches, free cache buffers, enqueue
locks, and so on, then the wait statistics can both identify and quantify the
problem. With experience, you may also
be
able to use the wait statistics to
identify network and disk performance problems. The wait statistics also provide
valuable feedback on attempts to resolve such problems.
But if your application is doing more parsing, or more disk I/O than necessary for
its workload, then the wait statistics cannot help you. They will appear to give
your instance a clean bill of health, and rightly so. The wait statistics are only able
to reveal inefficiencies at the database server level and below. So they are silent
about application-level
performance
problems that increase the load on the
database server but do not cause it to work inefficiently.
However, you should already have addressed all the application performance
issues before
considering
database server tuning in detail. If so, the wait statistics
can have full value for database server tuning. But they can only have full value if
the waits are timed.
2.2.1 Timed Statistics
Waits are timed if and only if the TIMED_STATISTICS parameter is set to TRUE.
Let me endorse what
others
have said before, that the overhead of timed statistics
is negligible. If you need to convince yourself, use the SET TIMING ON command

in SQL*Plus to measure the elapsed time of a benchmark query. Use an otherwise
idle system and take ten or more measurements with and without timed
statistics. You will be hard pressed to discern any significant difference.
Without timed statistics, Oracle records the reason for each wait before it begins
to wait, and when the wait is over, it records whether it timed out. But with timed
statistics enabled, Oracle checks the time just before and after each wait, and also
records the time waited. The time waited is recorded in hundredths of a second—
that is, centiseconds.
2.2.2 Wait Types
V$SYSTEM_EVENT shows the total number of waits and timeouts, and the total
waiting time recorded for each type of event, accumulated for all processes over
the life of the instance. It is
normal
to order the events waited for in descending
order of the total time waited, as an indicator of the potential severity of each
type of wait.
However, the total time waited is really only meaningful for those that indicate
waiting for resources. If processes have been waiting because they have no work
to do, then the time
waited
is immaterial. If they have been waiting for routine
operations, such as disk I/O, then the total time waited will depend on the
workload. In such cases, the average time waited is much more interesting than
the total time waited.
This classification of wait types into idle waits, routine waits, and resource waits
is vital to a correct understanding of the wait statistics. Accordingly, APT has
separate scripts for resource waits and routine waits, and ignores idle waits
altogether. The routine_waits.sql script shows only the average time waited for
each type of routine wait. The resource_waits.sql script (see
Example 2.1
) shows
the types of resources waited for in descending order of the total time waited, but
also shows the average time waited.
Example 2.1. Sample Output from resource_waits.sql
SQL> @resource_waits
---------------------------------------- ----------- ------------
write complete waits 3816218 212.02
buffer busy waits 1395921 21.79
enqueue 503217 529.15
log file switch completion 144263 90.11
latch free 31173 0.61
free buffer waits 19352 302.38

row cache lock 876 73.00
library cache pin 131 18.71
library cache load lock 29 2.64
non-routine log file syncs 0 2.32
The average time waited reported by resource_waits.sql is not what you might
expect. Because of timeouts, a single logical wait for a resource may be reported
as a series of distinct waits, each of which would have timed out, except the last.
The number of logical waits is approximately the number of times the waiting
process was posted to end its wait—that is, the number of distinct waits, minus
the number of waits that timed out. The average time waited for each logical wait
is a better indication of the time taken to resolve resource waits, than the average
time for each component wait. Therefore, that is what this script reports for all
resource waits except latch free waits. It is normal for latch free waits to time out,
because latch wait posting is the exception, not the rule. Also, apart from latch
contention, it is normal for the latch to be obtained after a timeout. So the
average time waited for each distinct wait is a better indication of the duration of
latch free waits.
2.2.3 Session Waits
V$SESSION_EVENT shows the wait statistics for each live session. Although
waits affect processes rather than sessions, they are recorded against sessions
because sessions can
migrate
between processes (as in Multi-Threaded Server
configurations). The cumulative session wait statistics have two main uses.
First, if a particular user reports an episode of poor performance, then the wait
statistics for that session can be examined to diagnose that user's problem. The
APT script called session_times.sql (see
Example 2.2
) shows the waiting time
accumulated by
the
session for each type of event waited for, together with the
amount of CPU time consumed by that session. This makes it easy to see whether
the session has been working or waiting, and if it has been waiting, what it has
been waiting for.
Example 2.2. Sample Output from session_times.sql
SQL> @session_times
Enter SID: 29
EVENT
TIME_WAITED
---------------------------------------------------------------- ------
-----
SQL*Net message from client
2954196

CPU used by this session
1657275
db file sequential read
246759
write complete waits
139698
buffer busy waits
61832
log file sync
32601
enqueue
9576
log file switch completion
3530
SQL*Net message to client
2214
db file scattered read
1879
SQL*Net more data to client
952
SQL*Net more data from client
908
latch free
840
free buffer waits
100
buffer deadlock
57
row cache lock
1
SQL*Net break/reset to client
0
Second, if there has been extensive waiting for a particular type of resource, then
the
session wait statistics can be used to determine which of the sessions that are
still connected have contributed to or been affected by the problem. The APT
script for this job is called resource_waiters.sql . It shows the breakdown by
session of the waiting time for the resource type in question. The total waiting
time for sessions that are no longer active is also shown. For example, if there
have been a large number of buffer busy waits, then looking at the session wait
statistics may reveal whether the problem has been widespread, or confined to
just a few sessions.
2.2.4 Wait Parameters
The wait statistics are very useful because they tell you which sessions have been
waiting, and which types of resources they have been waiting for. They may have
been waiting
for
latches, database blocks, enqueue locks, or other resource types.
Knowing which type can direct your tuning efforts. But the wait parameters are
even more valuable than the wait statistics. They can tell you exactly which

resource—which latch, which database block, or which enqueue lock—is being
waited for. The wait statistics merely put you in the right neighborhood, but the
wait parameters can focus your attention on the right spot.
Unfortunately, the wait parameters are hard to catch. They can be seen fleetingly
in V$SESSION_WAIT . This view shows the wait parameters for the current or
most recent wait for each session, as well as the duration of the wait, if known.
However, querying V$SESSION_WAIT takes a long time relative to the length of
most waits. If you query this view twice in quick succession and look at the SEQ#
column, which is incremented for each distinct wait, it is not uncommon to notice
that many event waits have been missed in each active session between the two
queries. It is also rather expensive to query V$SESSION_WAIT repeatedly in
quick succession, and so it is of limited usefulness for watching wait parameters.
Fortunately, the wait parameters can also be seen in trace files produced by the
new DBMS_SUPPORT
package
, or by the underlying event 10046. This trace is
the same as that produced by the SQL_TRACE facility but also includes a line for
each wait, including the wait parameters.
For example, if there appears to be a problem with buffer busy waits, then you
can enable this trace for a while in the most heavily affected sessions with the
APT script trace_waits.sql . It is then just a matter of extracting the buffer busy
wait lines from the trace files, and examining the wait parameters to find the file
and block numbers of the blocks being waited for. In the case of buffer busy
waits, the file and block numbers are parameters p1 and p2. This is illustrated in
Example 2.3
.
Example 2.3. Sample Dialog from trace_waits.sql
SQL> @trace_waits
the top N sessions affected by waits for a particular resource.
Select sessions waiting for: buffer busy waits
Number of sessions to trace: 5
Seconds to leave tracing on: 900
Tracing ... Please wait ...
PL/SQL procedure successfully completed.
SQL> exit
$ cd udump
$ grep 'buffer busy waits' ora_*.trc |
> sed -e 's/.*p1=/ file /' -e 's/ p2=/ block /' -e 's/ p3.*//' |
> sort |

> uniq -c |
> sort -nr |
> head -5
42 file 2 block 1036
12 file 24 block 3
10 file 2 block 1252
7 file 2 block 112
6 file 7 block 5122
$
The meaning of the wait parameters for each type of wait event is visible in
V$EVENT_NAME and is documented in an appendix to the Oracle8i Reference
guide. However, this is a particularly weak section of the Oracle documentation.
Much of the information is enigmatic, out-of-date, or inaccurate. Because the
wait parameters are so vital to advanced performance tuning, this book explains
the meaning of the wait parameters for each wait event discussed.
2.3 Reference
This section contains a quick reference to the parameters, events, statistics, and
APT scripts mentioned in Chapter 2.
2.3.1 Parameters
Parameter
Description
_USE_VECTOR_POSTS
Vector posts enable multiple waiting processes to be posted
in a single semaphore operation.
POST_WAIT_DEVICE
The post-wait driver is a pseudo device driver. Its functions
are invoked when operations are performed against a device
special file of that device type. Where this parameter is used,
it specifies the path to the device file for the post-wait driver.
TIMED_STATISTICS
Should be set to TRUE whenever timing information may be
required for tuning purposes, which is always.
USE_POST_WAIT_DRIVER
If this parameter exists, it should be set to TRUE in order to
use the post-wait driver, instead of regular semaphore
operations.
2.3.2 Events
Event
Description
10046
This is the event used to implement the DBMS_SUPPORT trace, which is a
superset of Oracle's SQL_TRACE facility. At level 4, bind calls are included in the
trace output; at level 8, wait events are included, which is the default level for

DBMS_SUPPORT; and at level 12, both binds and waits are included. See the
excellent Oracle Note 39817.1 for a detailed explanation of the raw information in
the trace file.
2.3.3 Statistics
Statistic
Source
Description
total_waits
V$SYSTEM_EVENT
V$SYSTEM_EVENT
The number of distinct waits.
total_timeouts
V$SYSTEM_EVENT
V$SESSION_EVENT
The number of waits that timed out instead
of being posted.
logical_waits
total_waits
-
total_timeouts
A logical wait is a series of distinct waits for
the same event. Each component wait times
out,
except
the last, which is posted.
time_waited
V$SESSION_EVENT
V$SESSION_EVENT
The total
time
waited.
average_wait
V$SYSTEM_EVENT
V$SESSION_EVENT
The average time for each distinct wait.
average_logical
time_waited /
logical_waits
The
average
time for each logical wait.
max_wait
V$SESSION_EVENT
The longest component wait by the session
for the event.
2.3.4 APT Scripts
Script
Description
resource_waiters.sql
Shows which sessions have waited for a particular resource
type, and for how long.
resource_waits.sql
Shows all the resources waited for, and the total waiting time,
over the life of
the
instance, in order of severity.
routine_waits.sql
Reports the average time waited for each routine wait.
session_times.sql
Shows how much time a particular session has used working
or waiting, and what is has been waiting for.
trace_waits.sql
Enables the
DBMS
_SUPPORT trace (event 10046, level 8) for
a period in the sessions most affected by a particular type of

resource wait. Used to sample the wait parameters, in order
to diagnose performance problems.

Chapter 3. Latches
There are numerous data structures in Oracle's System Global Area (SGA) that need to be
accessed concurrently by many different database processes. It is essential that only one
process be able to modify any particular data structure at one time, and that the data
structure cannot be modified while it is being inspected. Oracle makes sure this does not
happen by protecting all SGA data structures with either locks or latches. (See
Chapter 6
,
for a description of the contents of the SGA and other memory areas.)
3.1 Latches and Locks
Latches are the more restrictive mechanism, because they do not allow multiple
processes to inspect the protected data structure at the same time—they provide
for exclusive access only.
[1]
Locks allow for better concurrency, because they may
be held in a shared mode when the data structure is simply being inspected.
[1]
This is a simplification. The redo copy latches can be shared, but this is hardware
dependent.
Another significant difference between locks and latches is request queuing.
Requests for locks are queued if
necessary
and serviced in order, whereas latches
do not support request queuing. If a request to get a latch fails because the latch
is busy, the process just continues to retry until it succeeds. So latch requests are
not necessarily serviced in order.
Because a latch can only be held by one process at a time, and because there is no
inherent concept of queuing, the
latch
data structure itself is very simple—
essentially just a single location in memory representing the state of the latch.
And because the latch data structure is so simple, the functions to get and release
a latch have very little work to do. By contrast, the data structures for locks are
much more sophisticated because of their support for queuing and concurrency.
So the functions to get, convert, and release locks have correspondingly more
work to do.
Of course, it is necessary for Oracle to ensure that only one process at a time can
modify the latch and lock
data
structures themselves. For latches this is easy.
Because each latch is just a single location in memory, Oracle is able to use the
TEST AND SET, LOAD AND CLEAR, or COMPARE AND SWAP instructions of
the underlying hardware's instruction set for its latch get operations. Because

these are simple machine instructions that are guaranteed to be atomic, no other
locking mechanism is needed. This simplicity makes latch gets very efficient.
Oracle's lock data structures, on the other hand, have several parts, and therefore
cannot be modified
atomically
. For this reason, Oracle actually protects operations
on locks with latches. The type of latch used varies depending on the type of lock.
For example, the cache buffer locks are indirectly protected by the cache buffers
chains latches, and the row cache enqueue locks are protected by the row cache
objects latch.
Because latches are
efficient
, Oracle often uses a latch, rather than a lock and latch
combination, to protect data structures that are expected to be accessed only
briefly and intermittently.
3.2 Parent and Child Latches
Most internal Oracle data structures that are protected by latches are protected
by only one latch. However, in some cases more than one latch may be used. For
example, there may be a
number
of library cache latches protecting different
groups of objects in the library cache, and separate cache buffers chains latches
are used to protect each of the database buffer cache hash chains.
Whenever a number of latches may be used to protect different parts of a
structure, or different equivalent structures, these latches are called child latches.
For each set of child latches of the same type there is one parent latch. In general,
both the parent and child latches may be taken. In practice, however, the library
cache parent latch is the only parent latch you are likely to see being taken, and
even then this is a relatively rare occurrence by
comparison
with the activity against
its child latches.
Somewhat confusingly, Oracle also refers to solitary latches that have no children
as parent latches. So the V$LATCH_PARENT view contains one row for each of
the solitary latches, as well as one row for each of the genuine parent latches.
V$LATCH_CHILDREN has a row for each child latch. Thus, the union of these
two views represents all latches.
The types of latches used by Oracle, and whether they are solitary latches or
parent and child sets, varies with different releases of Oracle and operating
system ports. The APT script latch_types.sql can be used to see what latch types
are in use in your database, whether they are
parent
and child sets, and if so, how

many child latches there are.
Example 3.1
shows an extract of the output of this
script.
Example 3.1. Sample Output from latch_types.sql
SQL> @latch_types
------ ------------------------------ ------ -------
0 latch wait list 1 1
1 process allocation 1
2 session allocation 1
3 session switching 1
4 session idle bit 1 1
...
APT Scripts and X$ Tables
A number of the APT scripts referred to in this book, like latch_types.sql,
are based directly on the X$ tables, rather than the V$ views. This is often
necessary because the V$ views do not contain the required information, or
because querying the V$ views would impose an unsatisfactory load on the
instance.
Because the X$ tables are only visible to the SYS schema, and because it
would be bad practice to do anything as SYS unnecessarily, APT requires
that you create a set of views that expose the X$ tables to other DBA
schemata. This can be done with the create_xviews.sql script, which of
course must be run as SYS. Unless these views exist, all APT scripts that are
dependent on the X$ tables will fail.
Note that the X$ tables change from release to release, and so these APT
scripts are often release specific. Make sure that you use the right scripts for
your release of Oracle.
The V$LATCH view contains summary latch statistics grouped by latch type.
V$LATCH should be your first point of reference when investigating a suspected
latching problem. If the problem relates to a set of latches of the same type, you
should consult V$
LATCH
_CHILDREN to investigate whether the distribution of
activity across the child latches is even, and possibly V$LATCH_PARENT also to
determine whether there has been any activity against the parent latch.
3.3 Latch Gets

When an Oracle
process
needs to access a data structure protected by a latch, it
can request to get the latch in one of two modes—willing-to-wait mode or no-wait
mode (also called immediate mode).
3.3.1 Willing-to-Wait Mode
Oracle expects latches to be held briefly and intermittently. So if a process
attempts to get a latch in willing-to-wait mode and finds that the latch is not
available, it will spin briefly and then
try
again. When a process spins, it executes
a simple series of instructions a number of times, as a way of waiting before
trying again. This is sometimes called an active wait because from the operating
system's perspective, the process is still actively consuming CPU cycles, although
it is really just waiting a while.
The amount of CPU time that a process will burn before trying to get the latch
once again is very small and fixed (although it was tunable in Oracle7 using the
_LATCH_SPIN_
COUNT
parameter). If the next attempt to get the latch fails
again, the procedure will be repeated up to the number of times specified by the
_SPIN_COUNT parameter. This parameter normally defaults to 2000 iterations
in multi-processor environments.
3.3.1.1 Why spin?
The idea of spinning is that another process executing on another CPU may
release the latch, thereby allowing the spinning process to proceed. Of course, it
makes no sense to spin on a machine with just one CPU, and so Oracle does not.
The alternative to spinning is to relinquish the CPU and allow another process to
use it. At first glance, this may seem like a good idea. However, for a CPU to stop
executing one process and begin executing another, it must perform a context
switch . That is, it must save the context of the first process, determine which
process to schedule next, and then resume the context of the next process. The
context of a process is essentially a set of CPU register values that describes the
exact state of the process.
The implementation of context switches is highly machine dependent. In fact, it
is typically written in assembly language. System vendors make every effort to
minimize the size of the context data and optimize context switching by using
tricks such as remapping memory addresses rather than copying data.
Nevertheless, context switching remains an expensive operation because various
kernel data structures have to be searched and updated. Access to these

structures is protected by spinlocks, which are the equivalent of latches for the
operating system. On a large and busy system, context switching normally
consumes between 1% and 3% of CPU time. So if a context switch can be avoided
by spinning briefly, then some CPU time can be saved, and the waiting time to
obtain the latch can be minimized. For this reason, spinning briefly is normally
preferable to relinquishing the CPU immediately.
3.3.1.2 Understanding the spin statistics
The latch statistics in the V$LATCH family of views record a get whenever a
process acquires a latch in willing-to-wait mode. If the process fails to get the
latch without spinning, a miss is recorded. If the latch is obtained after one or
more spin iterations, a spin get is recorded. If the latch cannot be obtained while
spinning, the process relinquishes the CPU and enters a sleep. No matter how
many times the process subsequently wakes up, spins, and sleeps again, no
further gets or misses will be recorded, and neither will a spin get be recorded if
the latch is finally obtained while spinning. So, the number of times that a latch
was obtained without spinning at all is gets - misses. I call these simple gets. The
APT script latch_gets.sql shows the breakdown of gets into simple gets, spin
gets, and gets that slept, called sleep gets.
Example 3.2
shows some sample
output.
Example 3.2. Sample Output from latch_gets.sql
SQL> @latch_gets
------------------------------ ------------------ -------------- ------
--------
archive control 228 100.00% 0 0.00%
0 0.00%
cache buffer handles 67399 100.00% 0 0.00%
0 0.00%
cache buffers chains 2948282897 100.00% 11811 0.00%
35999 0.00%
cache buffers lru chain 56863812 99.60% 44364 0.08%
182480 0.32%
dml lock allocation 2047579 99.99% 36 0.00%
199 0.01%
enqueue hash chains 14960087 99.95% 1139 0.01%
6603 0.04%
enqueues 24759299 100.00% 165 0.00%
861 0.00%
...
Perhaps more interestingly, the APT script latch_spins.sql shows the
effectiveness of spinning for each latch type, as illustrated in
Example 3.3
.

Example 3.3. Sample Output from latch_spins.sql
SQL> @latch_spins
LATCH TYPE SPIN GETS SLEEP GETS SPIN HIT RATE
_________________________________________________________________
cache buffers lru chain 44752 182595 19.68%
redo allocation 29218 66781 30.44%
library cache 18997 43535 30.38%
cache buffers chains 11812 36001 24.70%
redo copy 606 18245 3.21%
messages 3968 8315 32.30%
enqueue hash chains 1139 6603 14.71%
system commit number 2312 5548 29.41%
undo global data 252 1327 15.96%
session idle bit 256 1198 17.61%
enqueues 165 861 16.08%
transaction allocation 80 535 13.01%
list of block allocation 47 353 11.75%
shared pool 272 295 47.97%
dml lock allocation 36 199 15.32%
global tx hash mapping 36 184 16.36%
latch wait list 27 95 22.13%
session allocation 13 78 14.29%
row cache objects 89 76 53.94%
ALL LATCHES 114080 372833 23.43%
3.3.1.3 Tuning the spin count
Clearly, increasing the _SPIN_COUNT parameter has the potential to improve
the effectiveness of spinning, at the cost of using more CPU time on unsuccessful
spins. Alternately, if many spins are unsuccessful, reducing the spin count will
reduce the amount of CPU time spent spinning. In general, tuning the spin count
is a matter of balancing the CPU time used spinning against the CPU time and
elapsed time saved by avoiding context switches. A workable rule of thumb is to
attempt to minimize the value of the following:
_SPIN_COUNT * sleeps / misses
which serves as an approximation of the cost of spinning. If in doubt, err in favor
of a higher spin count rather than a lower one. In database instances with mild
latching problems, it may be beneficial to increase the _SPIN_COUNT parameter
significantly from its default value. This is particularly true if the number of
active processes is of the same order of magnitude as the number of CPUs. In
instances experiencing severe latch contention the optimum spin count is
normally much less than the default, but more than one.

The APT script tune_spin_count.sql can be used to try out alternate values for
the _SPIN_COUNT parameter. It notes the spin statistics, then uses the ALTER
SYSTEM SET "_SPIN_COUNT" command to change the spin count. After
waiting for the specified period, it checks the spin statistics again and computes
the effect of the new spin count over the interval. A sample dialog from this script
is shown in
Example 3.4
. Be warned that no allowance is made for variations in
load, so some variability in results is to be expected. Note also that trying a very
high value for _SPIN_COUNT could upset your users!
Example 3.4. Sample Dialog from tune_spin_count.sql
SQL> @tune_spin_count
SPIN_COUNT
__________
2000
SPIN HIT RATE SPIN COST
------------- ----------
93.53% 6
Enter new _spin_count value to try: 4000
Enter time to wait (in seconds): 900
SPIN HIT RATE SPIN COST
------------- ----------
96.27% 4
SQL>
Of course, tuning the spin count should be the very last thing you do in response
to latch contention. You should first identify which latches are subject to
contention, and then attempt to understand why. You should then make every
possible effort to prevent the contention. Only when you have completely run out
of ideas should you attempt to minimize the effect of the contention by tuning the
spin count.
3.3.2 Sleeps
If a willing-to-wait request fails, then before the process goes to sleep, it must
arrange for itself to be woken up again. As described in
Chapter 2
, there are two
mechanisms for a process that is sleeping to be woken up again. The normal
mechanism for latch sleeps is a simple timeout. A process sleeping for a latch
waits on its semaphore, but before it does so, it sets an alarm that will cause it to
be signaled by the operating system at the end of a specified interval. The interval
specified is variable. Initially the process will sleep for just one centisecond. If

after waking up, the process again fails to obtain the latch, then the length of the
second and any subsequent sleeps will be doubled under what is called the
exponential backoff algorithm. The maximum sleep under the exponential
backoff algorithm is set by the _MAX_EXPONENTIAL_SLEEP parameter, which
defaults to 2 seconds in Oracle8. However, if the process is already holding other
latches, then the maximum sleep time is reduced to the value of the
_MAX_SLEEP_HOLDING_LATCH parameter, which defaults to 4 centiseconds,
and possibly further, in proportion with the number of other latches already
being held.
Another task that the process performs before it goes to sleep is to update the
session wait information visible in the V$SESSION_WAIT view to indicate that
the process is waiting on a latch free wait . The wait parameters are shown in
Table 3.1
.
Table 3.1. Wait Parameters (latch free waits)
Parameter
Description
p1
The SGA address of the latch required; corresponds to the ADDR column
of the V$LATCH_PARENT and V$LATCH_CHILDREN views (but not
V$LATCH itself)
p2
The type of the latch; corresponds to the LATCH# column of the
V$LATCH family of views
p3
The number of times that the process has slept during this attempt to
acquire the latch
When the process wakes up again, it will update the session wait information to
indicate that the wait is over, and if timed statistics are enabled, it will record the
time for which it slept. The cumulative statistics for latch free waits that are
visible in the V$SESSION_EVENT and V$SYSTEM_EVENT views are also
updated at this time. Note that consecutive sleeps during a single attempt to
acquire a latch are recorded as separate waits. However, the latching statistics
visible in the V$LATCH family of views are only updated once the latch has been
acquired.
If a process fails to obtain a latch in either willing-to-wait or no-wait mode, then
it updates the latch miss statistics which are visible in the V$LATCH_MISSES
view. This update is not protected by a latch, and so these statistics may not tally
with those in V$LATCH . Each row in V$LATCH_MISSES represents a location
in the Oracle server code from which a latch may be held. The NWFAIL_COUNT
and SLEEP_COUNT columns record the number of no-wait get failures and

sleeps, respectively, that occurred while the latch was being held from that
particular location in the code. Unfortunately, considerable familiarity with the
Oracle server code is required to be able to interpret the significance of these
statistics. For what it's worth, the APT script latch_where.sql shows the
distribution of sleeps against code locations.
3.3.3 Latch Wait Posting
The second mechanism whereby a process sleeping on a latch may be woken up is
called latch wait posting. In this case, the next process to free the required latch
will wake up the sleeping process. The waiting process must request latch wait
posting before it goes to sleep. It does this by putting itself on a list of processes
waiting to be posted, known as the latch wait list. When a process frees a latch, it
checks the latch wait list, and if there is a process waiting for that latch, it posts
the semaphore of the waiting process, which acts as a signal to the operating
system to schedule the waiting process to run.
The benefit of latch wait posting is that there is a high probability of the waiting
process obtaining the latch almost as soon as the latch is freed. Of course, there is
also a significant cost to latch wait posting, namely maintaining the latch wait list
data structure. This data structure is implemented as a set of singly linked lists
through the process table in the SGA (visible as X$KSUPR. KSLLALAQ ). Of
course, as with any other data structure, the lists have to be protected by latches.
Where latch wait posting is used extensively, the latch wait lists can become
relatively long, with the result that the latch wait list latches are held longer and
more frequently than otherwise. Indeed, it is not uncommon to see secondary
contention on one of the latch wait list latches, when there is severe contention
for some other latch for which latch wait posting is enabled.
By default, latch wait posting is enabled only for the library cache and shared
pool latches. It can be disabled entirely by setting the _LATCH_WAIT_POSTING
parameter to (the default is 1), or it can be enabled for all latches by setting the
parameter to 2. Changes to latch wait posting need to be carefully benchmarked.
Disabling latch wait posting can be beneficial where contention on the library
cache latch is severe, and enabling it for all latches can improve performance in
cases of moderate contention for other latches. Even when enabled for all latches,
latch wait posting will not always be requested for sleeps on the cache buffers
chains latches.

The WAITERS_WOKEN column in the V$LATCH family of views shows the
number of times that a waiter has been woken via the latch wait posting
mechanism. This statistic can actually be greater than the number of misses,
because it is possible for a process to be posted and yet fail to obtain the latch
because some other process has taken it in the interim.
3.3.4 Latch Contention
We have already observed that Oracle expects latches to be held only briefly and
intermittently. If the use of any latch is either not brief, or not intermittent, then
contention for that latch is likely. An episode of latch contention begins when the
latch is being held by one process and is required by two or more other processes.
Until the backlog of demand is cleared, waiting processes must contend for the
latch. This results in CPU time being ineffectively used, and in the extreme can
have a disastrous effect on performance.
The severity of contention for a particular latch may be characterized in terms of
the frequency, duration, and intensity of latch contention episodes. This can be
assessed using the histogram of sleep counts contained in the SLEEP1 to SLEEP4
columns of V$LATCH. Note that no statistics are kept for sleep cycles longer than
four iterations—the columns SLEEP5 to SLEEP11 are retained for compatibility
with releases of Oracle prior to 7.3.
The histogram of sleep counts can also be used to determine the effectiveness (or
otherwise) of attempts to reduce contention for the latch. However, the ratio of
sleeps to gets serves as a better indicator of the effectiveness of latch tuning,
because it accounts for simple gets as well as misses. I call this ratio, expressed as
a percentage, the sleep rate. The sleep rate is calculated by the APT script
latch_sleeps.sql . See
Example 3.5
for sample output.
Example 3.5. Sample Output from latch_sleeps.sql
SQL> @latch_sleeps
LATCH TYPE IMPACT SLEEP RATE WAITS HOLDING LEVEL
-----------------------------------------------------------------------
library cache 11224 0.03% 256 5
cache buffers chains 1295 0.00% 0 1
redo allocation 713 0.01% 9613 7
system commit number 373 0.00% 66 8
enqueue hash chains 221 0.00% 3 4
redo copy 210 22.30% 0 6
shared pool 166 0.01% 1434 7
cache buffers lru chain 146 0.01% 336 3

messages 135 0.01% 0 8
session allocation 113 0.02% 0 5
row cache objects 86 0.00% 0 4
enqueues 75 0.00% 624 5
latch wait list 48 0.08% 1 9
session idle bit 47 0.00% 0 1
undo global data 14 0.00% 0 5
multiblock read objects 13 0.00% 8 3
sequence cache 11 0.00% 0 8
dml lock allocation 10 0.00% 0 3
transaction allocation 10 0.00% 0 8
list of block allocation 4 0.00% 0 3
modify parameter values 2 0.03% 0 0
process allocation 1 0.02% 0 0
Note that there is an important difference between the sleep rate and the impact
of a particular type of latch on overall performance. For example, in
Example 3.5
the sleep rate for the redo copy latches is high (as is normal). However, because
there are very few willing-to-wait gets on these latches, the impact of these sleeps
is not the highest. The impact shown is based on the number of sleeps. However,
not all sleeps are equal because of the exponential backoff algorithm. So the
number of sleeps per sleep get is used as an indicator of the average length of
sleeps against each latch, and this is multiplied by the number of sleeps to
estimate the impact.
3.3.5 Latch Levels
It is very common for an Oracle process to need to hold a number of latches
concurrently. Therefore, there might be a possibility of latching deadlocks
occurring—namely, one process holding latch A and another process holding
latch B, and both processes spinning and waiting for the alternate latch. Oracle
ensures that this cannot happen by ensuring that latches are always taken in a
defined order, when more than one latch is required. To support this, every latch
in Oracle has a level between and 15, and a 2-byte bitmap is maintained for every
process representing the levels of the latches that the process is currently holding.
When a process attempts to get a latch in willing-to-wait mode, a check is made
to ensure that it is not already holding a latch at the same level or at a higher
level. In general, if this rule is broken, an ORA-600 [504] internal error is
raised.
[2]
[2]
However, this latch level rule is sometimes relaxed to allow two library cache child latches
to be held simultaneously.
Contention for a high-level latch such as the redo allocation latch (level 6) can
easily exacerbate contention for lower-level latches such as the cache buffers

chains latches (level 1 in Oracle 8.1). This happens because processes needing the
higher-level latch have to sleep while holding a lower-level latch. So the lower-
level latches are held for much longer than normal. An indication of this factor is
available in the WAITS_HOLDING_LATCH column of the V$LATCH family of
views. That statistic represents the number of times that a process waited while
holding this latch. Those waits include, but are not limited to, waits for a higher-
level latch. For example, the waits holding latch statistic for the cache buffers
chains latches could include sleeps while trying acquire the redo allocation latch.
However, it could also include other waits such as log buffer space waits. If waits
holding a latch appear to be a significant factor in contention for that latch, those
waits should be addressed first. For that reason, it is generally wise to address
latch contention issues in descending order of latch level, rather than merely in
descending order of apparent impact, particularly if there are waits while holding
a low-level latch.
3.3.6 No-Wait Mode
No-wait mode is used when Oracle is already holding one latch and needs to
acquire another latch at the same level or at a lower level. A willing-to-wait
request cannot be used in this case because of the deadlock prevention
requirement. In this case, Oracle can request the latch in no-wait mode, as long
as no more than one pair of latches would be held at the same level. If the no-wait
request succeeds, there is no risk of deadlock and so all is well. However, if the
request fails, there would be a risk of deadlock were the process to persist in its
attempt to acquire the latch. Instead, the process releases all the higher-level
latches that it holds, yields the CPU, and then immediately attempts to acquire
them again in the correct order of level.
The redo copy latches are a slightly special case. No-wait mode is used for most
gets against these latches, because Oracle can use any one of them to protect the
copy into the log buffer. If the request for one copy latch fails, Oracle can perform
the copy on another latch instead. Willing-to-wait mode is only used to get the
last copy latch if no-wait gets against all the other copy latches have failed. This is
normally a symptom of waits while holding the copy latches, such as contention
for a higher-level latch, and so increasing the number of copy latches with the
_LOG_SIMULTANEOUS_COPIES parameter does not normally help.
Other than the redo copy latches, there are only a few types of latches that Oracle
sometimes attempts to get in no-wait mode. For all other types of latches, the

IMMEDIATE_GETS and IMMEDIATE_MISSES columns in the V$LATCH
family of views are always zero.
From a performance point of view, immediate misses are not necessarily a
problem. If the relinquished latches are reclaimed cheaply after the willing-to-
wait get is satisfied, then the cost of the immediate miss is not inordinate.
However, if there is a degree of contention for those other latches, then
immediate misses exacerbate the problem by increasing the workload on those
latches. Therefore, when tuning any latch you should attempt to eliminate
immediate misses as well as sleeps. However, don't lose too much sleep over
immediate misses unless you are sleeping too much on higher-level latches.
3.3.7 Latch Cleanups
It is a fact of life that Oracle processes sometimes die unexpectedly, and can die
when holding a latch. It is the task of the Oracle PMON process to detect the
unexpected death of user processes and perform cleanup actions. Among the
cleanup actions that PMON performs first is latch cleanup. Latch cleanup is
completed for all newly deceased processes, before any work is begun to roll back
uncommitted transactions.
Latch cleanup is not merely a matter of freeing the latch. Latches are taken to
manipulate data structures, and if a process dies holding a latch, there is every
chance that the data structure protected by the latch may have been left in an
inconsistent state. To support latch recovery, processes holding a latch in order to
manipulate a structure write a record of their intended operation into the latch
recovery area for that latch, prior to performing the operation. PMON's task is
not just to free the latch, but first to recover the protected data structure. A latch
is said to be in flux if latch recovery is necessary or in progress.
However, because PMON normally wakes up only every 3 seconds, Oracle has
another way of initiating latch cleanup. If a process has repeatedly failed to
acquire a latch, it will perform a latch activity test to check whether latch cleanup
may be necessary. If there is no activity on the latch for 5 centiseconds, the
process will post PMON, and PMON will check whether the process holding the
latch has died and needs to be cleaned up.
When a process is performing a latch activity test, or waiting for PMON to check
the process holding the latch, the V$SESSION_WAIT view shows that the

process is waiting on a latch activity wait . The wait parameters are as shown in
Table 3.2
.
Table 3.2. Wait Parameters (latch activity waits)
Parameter
Description
p1
The SGA address of the latch required.
p2
The type of the latch.
p3
0 for the latch activity test. Otherwise, the process number of the
possibly deceased latch holder being checked by PMON.
If latch contention is accompanied by numerous latch activity waits, the cause of
both symptoms could be an operating system scheduling problem that is
preventing the latch holder from releasing the latch quickly enough.
3.3.8 DLM Latches
Instance locks are used for inter-instance locking and communication between
the instances of an Oracle parallel server database. A separate part of the SGA
contains the structures needed for instance locks. A set of latches is used to
protect these structures. In release 8.0, the latching statistics for these latches
were reported separately in V$DLM_LATCH . From release 8.1, the Distributed
Lock Manager (DLM) latching statistics have been merged into V$LATCH.
LMON performs latch cleanup for DLM latches in cooperation with PMON.
3.4 Advanced Latching Control
Some operating systems support a facility called multi-processing control. This
enables an authorized user process to influence its CPU scheduling in a variety of
ways. Where available, Oracle can use certain multi-processing control features.
The following features affect the latching mechanism.
3.4.1 Preemption Control
Preemption control enables Oracle to suspend the operation of the normal
operating system process preemption mechanism during performance-critical
operations—in particular, when holding a latch. This means that the Oracle
process can continue to run on its CPU until it explicitly enables preemption
again, or until it blocks on an operating system event such as an I/O request,
semaphore operation, or page fault. The process will not be pre-empted at the

end of its time-slice by a higher priority process of the time-sharing priority class.
This means that operations protected by latches complete as quickly as possible,
and so the risk of latch contention is greatly reduced. If preemption control is
available to Oracle, it is used by default unless disabled using the
_NO_PREEMPT parameter.
3.4.2 CPU Yielding
CPU yielding enables Oracle processes to offer to yield the CPU during a spin. If
there is another runnable process of higher priority able to use the CPU, that
process is scheduled, and the yielding process is placed at the end of its run
queue, but it remains runnable. Otherwise, if there are no other higher-priority
processes able to use the CPU, then the process will continue to spin for its latch.
The frequency with which Oracle will offer to yield the CPU while spinning is
controlled by the _SPIN_YIELD_CPU_FREQ parameter, which defaults to the
default value of the _SPIN_COUNT parameter. If CPU yielding is available, and
if these two parameters have the same value, the effect is that the process will
begin a new spin without sleeping if there is no other process available to use the
CPU. Thus, CPU yielding enables Oracle processes to obtain latches as quickly as
possible without consuming otherwise usable CPU time.
3.4.3 Affinity Control
Affinity control enables Oracle processes to disable and re-enable the normal
operating system affinity mechanism which attempts to weakly bind a process to
the last CPU it ran on. If a process runs on the same CPU as before, many of the
memory address and value pairs (cache lines) required for its execution may still
be available in that CPU's cache. This can result in greatly reduced memory
access by that CPU, and thus much faster execution. However, faster execution is
not necessary when all the process is doing is spinning for a latch, and faster
execution is less important than earlier execution when the process has been
sleeping holding a latch that other processes may need. Where it is available,
Oracle uses affinity control to optimize latching automatically. Incidentally, it is
not recommended to use explicit processor binding for Oracle processes.
Otherwise, runnable processes will not be migrated to idle CPUs.
Oracle can use multi-processing control features to improve the performance of
large, highly active instances significantly, and the biggest impact is in the area of
latching. However, under many operating systems some or all of these features
are not available, or are not available to the processes of ordinary users such as

"oracle." Where these features are available, the "oracle" user must be specifically
authorized to use them. In some cases, such authorizations are not persistent,
and so the authorization commands must be placed in the system startup scripts
to ensure that Oracle will always be able to use these features. Check your
operating system documentation for an mpctl ( ) system call and related entries
to determine whether your operating system supports multi-processing control
features for ordinary user processes, and if so, how to enable them.
3.5 Reference
This section contains a quick reference to the parameters, statistics, waits, and
APT scripts mentioned in Chapter 3.
3.5.1 Parameters
Parameter
Description
_LATCH_WAIT_POSTING
Latch wait posting is a mechanism whereby a
process can be woken (posted) when the latch that
it requires becomes available.
If this parameter is set to 0, latch wait posting is
disabled. If this parameter is set to 1 (the default),
latch wait posting is enabled for the library cache
and shared pool latches only. Any other setting
results in latch wait posting being enabled for all
latches.
_MAX_EXPONENTIAL_SLEEP
Consecutive sleeps during a single attempt to
acquire a latch become progressively longer, under
an exponential backoff algorithm, up to the limit
specified by this parameter. Defaults to 200
centiseconds in Oracle8.
_MAX_SLEEP_HOLDING_LATCH
The maximum sleep allowed under the
exponential backoff algorithm when the sleeping
process is holding another latch. Defaults to 4
centiseconds.
_NO_PREEMPT
If this parameter is set to TRUE (the default)
Oracle will use the operating system's preemption
control mechanism, if available, to minimize the
risk of processes sleeping while holding a latch.

_SPIN_COUNT
The number of iterations to perform before
sleeping when spinning to acquire a latch. Defaults
to 1 on single CPU systems, and 2000 on multi-
processor machines.
_SPIN_YIELD_CPU_FREQ
This parameter controls the frequency with which
an Oracle process will offer to yield the CPU if
possible during a spin. If a higher-priority process
is runnable, it will be scheduled, and the yielding
process will be placed at the end of the run queue
without sleeping. Defaults to the default value of
_SPIN_COUNT. If _SPIN_COUNT is tuned, this
parameter should normally be tuned as well.
3.5.2 Statistics
Statistic
Source
Description
immediate
gets
V$LATCH family
Successful latch get requests in no-wait mode
immediate
misses
V$LATCH family
Latch get requests in no-wait mode that failed
gets
V$LATCH family
Completed willing-to-wait latch acquisitions
misses
V$LATCH family
Gets that waited because the latch was in use
simple gets
gets - misses
Gets completed without waiting at all
spin gets
V$LATCH family
Gets that obtained the latch by spinning, but
did not sleep
sleep gets
misses - spin gets
Gets that required one or more sleeps
spin get rate
100 * spin gets /
misses
A measure of the effectiveness of spinning
spin cost
_SPIN_COUNT
*
sleeps / misses
A measure of the cost of spinning
sleeps
V$LATCH family
Total number of times that processes slept
while waiting for the latch
sleep1
V$LATCH family
Gets that slept once
sleep2
V$LATCH family
Gets that slept twice
sleep3
V$LATCH family
Gets that slept three times
sleep4
V$LATCH family
Gets that slept four times
sleep rate
100 * sleeps / gets
A measure of the severity of contention for the
latch
sleep impact sleeps
2
/ sleep gets
An estimate of the relative impact of latch

sleeps on overall performance
waiters woken V$LATCH family
The number of times that waiters were posted
due to latch wait posting
waits holding
latch
V$LATCH family
The number of times that a process waited on
any event wait while holding the latch
3.5.3 Waits
Event
Description
latch activity
A process that has repeatedly failed to acquire a latch will
perform a latch activity test to check whether latch
cleanup may be necessary. This wait occurs both during
the activity test and while waiting for latch cleanup if
necessary.
latch free
Latch free waits are just sleeps by another name.
wait for DLM latch
This wait corresponds to latch free waits, but for DLM
latches.
wait for influx DLM latch The DLM latch needed latch recovery.
3.5.4 APT Scripts
Script
Description
create_xviews.sql
Some APT scripts are based on the X$ tables. Before those
scripts can be used, this script must be run as SYS to create the
required views on the X$ tables.
latch_gets.sql
Shows the breakdown of willing-to-wait gets into simple gets,
spin gets, and sleep gets.
latch_levels.sql
Like latch_types.sql, but shows the level for each latch type.
latch_sleeps.sql
Shows the sleep rate and impact for latch sleeps. Used to
determine the priority of latch tuning issues.
latch_spins.sql
Shows the number of spin gets and sleep gets and calculates
the spin hit rate for each latch and for all latches.
latch_types.sql
Shows all latch types ordered by number, whether they are
solitary latches or parent/child sets, and how many children
there are. For elegance and performance, this script is based
directly on X$KSLLT.
latch_where.sql
Shows where in the Oracle server code latch gets have been
failing. This code is based directly on the X$ tables in order to
access a column not projected by the V$LATCH_MISSES view.
tune_spin_count.sql Used to alter the spin count and then monitor spin statistics for

an interval to determine whether there has been an
improvement.

Chapter 4. Locks
Oracle uses latches to protect data structures that are accessed briefly and intermittently.
However, latches are not suitable for protecting resources that may be needed for a
relatively long time, such as database tables. In such cases, a lock must be used instead.
Locks allow sessions to join a queue for a resource that is not immediately available. This
avoids spinning. Locks also allow multiple sessions to share a resource if their activities
are compatible.
4.1 Lock Usage
Oracle uses locks for many different purposes. The following are the most
important ones to understand for performance tuning.
4.1.1 Transaction Locks and Row-Level Locks
Oracle's much vaunted row-level locks are subtle. When a transaction modifies a
row, its transaction identifier is recorded in an entry in the interested transaction
list (ITL) in the header of the data block itself, and the row header is modified to
point to that ITL entry. Once these changes have been made, no lock is retained.
The ITL entry for the uncommitted transaction, together with the row header that
references it, constitutes an implicit lock on the row.
When another transaction wants to modify the same row, and sees that an
uncommitted transaction has modified that row, that transaction waits, not on a
row-level lock, but on the transaction lock for the blocking transaction.
When the blocking transaction commits or rolls back, its transaction lock will be
released. Its implicit row-level locks are thereby released, and so the blocked
transaction can then proceed. Note that rolling back to a savepoint does not free
previously blocked transactions that were waiting for a row-level lock.
4.1.2 Buffer Locks
Row-level locks protect data integrity at the lowest feasible level of granularity,
and remain in force for the duration of a transaction. However, Oracle also needs
short-term block-level locks to be in force while accessing or modifying blocks in
its cache.

Buffer locks are used to provide simple read/write locking for blocks in the
database buffer cache. Although they are often taken for granted and seldom
mentioned, buffer locks are essential to data integrity, and can feature
prominently in certain performance tuning scenarios.
4.1.3 Data Dictionary Locks
The definitions of database objects in the data dictionary must be protected while
they are being referenced. This is necessary to prevent those objects from being
dropped, and to prevent their definitions from being changed, while they are
being used. Dictionary locks must be held while dependent SQL statements are
being parsed or executed, and must be retained for the duration of dependent
transactions.
Several types of locks are used for dictionary locking. All of these are covered in
some detail later in this chapter. The data dictionary rows themselves are locked
with row cache enqueue locks. Dependent SQL statements are protected with
library cache pins, and dependent transactions hold DML (Data Manipulation
Language) locks. Logically, both DML locks and library cache pins are dependent
on the corresponding row cache enqueue locks. However, this dependency is
implicit in the code, rather than explicit in the structures.
4.2 Lock Modes
Locks are applied to both compound and simple objects. The classic example of a
compound object and its component parts is a table and its rows. A cache buffer
is an example of a simple object. Simple objects may only be locked in the
following modes:
Exclusive
If a session needs to modify a simple object, then an exclusive lock is
required on the resource to prevent any concurrent access.
Shared
If a session needs to inspect a simple object, then a shared lock on the
resource is sufficient to ensure that the data structure will not be modified by
another session, while allowing concurrent shared access.
Null
If a session has some information cached about an object, then a null mode
lock may be held as a placeholder, even when the resource is not actively
being used. A null mode lock does not inhibit any concurrent access, but if the
resource is invalidated, the null mode lock acts as a trigger for the session to

invalidate its private cached information. There is an important difference
between holding a null mode lock, and not holding a lock at all.
In addition to the modes above, compound objects may also be locked in the
following modes:
Sub-shared
If a session needs shared access to part of a compound object, then a shared
lock on the entire compound resource would be unduly restrictive, because it
would prevent exclusive access to other parts of the compound resource. In
such cases, a sub-shared lock is used instead.
Sub-exclusive
If a session needs exclusive access to part of a compound resource, then a
sub-exclusive lock is sufficiently restrictive.
Shared-sub-exclusive
This lock mode is used when a session needs exclusive access to part of a
compound resource and shared access to the entire compound resource at the
same time.
These lock modes apply both to local locks and to the instance locks that are used
between parallel server instances. However, different terminology is used for
instance locks.
Table 4.1
shows the corresponding lock mode names together with
the symbolic and numeric representations used in dumps and wait parameter
values.
Local Lock Modes
Instance Lock
Modes
Name
Symbo
l
Numbe
r
Name
Symbo
l
Number
(No lock)
NLCK 0
Null
N
1
Null
NL
0
Sub-Shared
SS
2
Concurrent
Read
CR
1
Sub-Exclusive
SX
3
Concurrent
Write
CW
2
Shared
S
4
Protected Read PR
3
Shared-Sub-
Exclusive
SSX
5
Protected Write PW
4
Exclusive
X
6
Exclusive
EX
5
It is important to understand which lock modes are compatible with one another.
Table 4.2
shows the complete lock mode compatibility matrix.
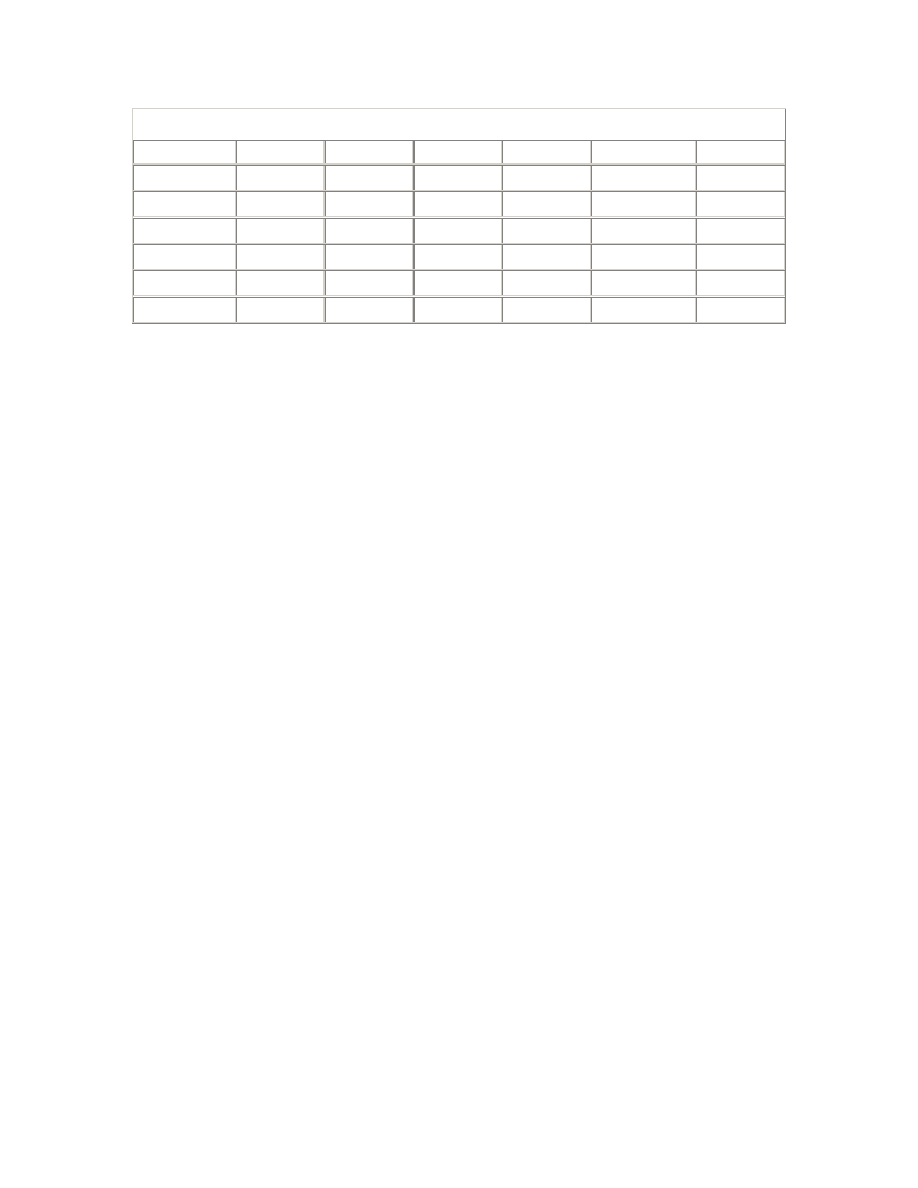
Table 4.2. Lock Mode Compatibility
N
SS
SX
S
SSX
X
N
Yes
Yes
Yes
Yes
Yes
Yes
SS
Yes
Yes
Yes
Yes
Yes
No
SX
Yes
Yes
Yes
No
No
No
S
Yes
Yes
No
Yes
No
No
SSX
Yes
Yes
No
No
No
No
X
Yes
No
No
No
No
No
4.3 Enqueue Locks
Many of Oracle's locks are called enqueue locks. To enqueue a lock request is to
place that request on the queue for its resource. So although the word "enqueue"
is strictly speaking a verb, it is used adjectivally in the term enqueue lock. It is
also used as a noun when referring to a particular enqueue resource, such as the
CF (control file) enqueue.
Oracle uses two classes of local locks—those for which the lock and resource data
structures are dynamically allocated in the shared pool, and those that use fixed
arrays for the lock and resource data structures. Although almost all types of lock
requests may be enqueued, the term enqueue should be taken to refer exclusively
to those locks that use the fixed arrays for the lock and resource data structures,
unless otherwise qualified.
4.3.1 Enqueue Resources
The fixed array for enqueue resources is sized by the ENQUEUE_RESOURCES
parameter. The number of slots in this array that are in use varies from time to
time, and these can be seen in V$RESOURCE . Each row in V$RESOURCE
represents a resource that is currently locked in any mode by one or more
sessions. These resources are not persistent in that they are no longer defined
once all locks on the resource have been released.
Rows in V$RESOURCE are identified by a two-character code representing the
type of resource, and two numeric fields used to encode either the resource
identity or the activities protected by locks on the resource, depending on the
resource type. For example, resources of type TX represent entries in the
transaction table of a rollback segment. The high-order two bytes of the first
identifier contain the rollback segment number, and the low-order two bytes

contain the transaction table slot number, while the second identifier contains
the rollback segment wrap or sequence number.
All enqueue operations access the enqueue resource structure via a hash table.
The hash value is based on the resource type and the numeric identifiers. The
length of the enqueue hash table is set by the _ENQUEUE_HASH parameter.
The default value of this parameter is derived directly from the PROCESSES
parameter, as follows:
45 + 2 * ( PROCESSES + PROCESSES/10 )
Because _ENQUEUE_HASH is derived directly from PROCESSES rather than
from ENQUEUE_RESOURCES, it may be necessary to tune _ENQUEUE_HASH
explicitly if ENQUEUE_RESOURCES has been raised significantly from its
default value. Otherwise lengthy enqueue hash chains may develop. As with all
hash tables, if you have cause to tune the number of buckets, you should make it
a prime number (see
Hash Tables and Prime Numbers
).
The enqueue hash chains are accessed under the protection of the enqueue hash
chains latches. The number of child enqueue hash chains latches is set by the
_ENQUEUE_HASH_CHAIN_LATCHES parameter, which defaults to the
CPU_COUNT. In a high concurrency environment, sleeps may be recorded
against the enqueue hash chains latches if the hash chains are allowed to become
unduly long. However, sleeps against these latches should normally be regarded
as a secondary result of contention for a higher-level latch, rather than attributed
to long hash chains.
Hash Tables and Prime Numbers
Oracle uses hash tables internally so that objects can be located
efficiently. For example, a hash table is used to locate database blocks in
the buffer cache, and another hash table is used to locate named objects
in the library cache.
To locate an object via a hash table, Oracle uses an algorithm to convert
the object's name or identifier into a number. That number may be
much larger than the size of the hash table, so it is converted to an index
into the hash table using a simple modulus function.

Multiple objects may map to the same hash table entry. This is called a
hash collision. Oracle normally resolves hash collisions using collision
chains. This means that objects that map to the same hash table entry
are linked together using a chain of pointers. These objects are said to
fall into the same hash bucket.
The performance of hash-based access is sensitive to the length of the
hash chains because they must be searched linearly. Therefore hash
tables must be large enough to ensure that the average hash chain
length remains short.
Long hash chains can also develop if the distribution of objects to hash
buckets is uneven. This happens if there is any pattern in the names of
the objects being hashed that the hash function is not able to randomize.
This is surprisingly common.
By making the number of hash buckets a prime number, you can greatly
reduce the risk of any pattern in the hash values resulting in hash
collisions once the modulus function has been applied.
4.3.2 Enqueue Locking
In addition to the enqueue resources, a second fixed array is used for enqueue
locking—namely, the enqueue locks themselves. The size of the enqueue locks
fixed array is set by the _ENQUEUE_LOCKS parameter, and the active rows can
be seen in V$ENQUEUE_LOCK .
An enqueue lock structure is used by each session waiting for or holding a lock on
a resource. If one or more sessions are waiting for locks on a resource, then their
enqueue lock structures are linked together into a two-way linked list, with the
enqueue resource structure as the list header. This linked list is maintained and
serviced in the order in which the locks were requested. For example, if a lock is
held in shared mode, and the first waiter requires access to the resource in
exclusive mode, then other sessions that require shared access must queue for the
resource behind the first waiter, despite the fact that their requests are
compatible with the mode in which the resource is currently locked.
Similar two-way linked lists are used to link together the enqueue lock structures
for sessions holding a lock on the resource, and for sessions waiting to change the
mode of the lock that they are holding.

The operation of changing the mode of a lock is called an enqueue conversion.
For example, if a transaction holds a lock on a particular table in sub-share mode,
and needs to update a row of that table, then the enqueue lock must be converted
to sub-exclusive mode. However, if the resource is currently locked in an
incompatible mode by another session, then the conversion cannot proceed
immediately and the enqueue lock structure is placed in the conversion queue.
Enqueue conversions are serviced in order before new enqueue requests.
During enqueue operations, modifications to the enqueue resources and enqueue
locks fixed array free lists (see the sidebar, "Fixed Array Free Lists") are made
under the protection of the enqueues latch. There is only one enqueues latch, and
it is often taken and released twice during the course of a single enqueue
operation. However, the relevant enqueue hash chains latch is held for the
duration of the operation.
4.3.3 Enqueue Waits
An enqueue wait occurs whenever an enqueue request or enqueue conversion
cannot be granted immediately because another session is holding a lock on the
resource in an incompatible mode. The blocked process records an enqueue wait.
The wait parameters are shown in
Table 4.3
.
Table 4.3. Wait Parameters (enqueue waits)
Parameter
Description
p1
The high-order 2 bytes contain the ASCII codes for the resource type.
The low-order 2 bytes contain the mode in which a lock is required.
p2
The id1 identifier for the resource.
p3
The id2 identifier for the resource.
Whenever a session releases an enqueue lock, it examines the lock request and
conversion queues for the resource and, if appropriate, posts the next process
that will be able to acquire a lock on the resource.
Processes waiting in an enqueue wait also set an alarm before they begin to wait.
The timeout duration is dependent on the type of resource. For most enqueues,
the enqueue wait timeout is 3 seconds.
Consecutive waits during a single attempt to acquire an enqueue lock are
recorded as separate waits in the session and system wait statistics. However, the
enqueue waits statistic in V$SYSSTAT is only incremented by one, after the lock

has been acquired, as are the enqueue requests and enqueue conversions
statistics. Note also that the enqueue timeouts statistic in V$SYSSTAT does not
represent the number of enqueue wait timeouts. Rather, this statistic is
incremented when an enqueue request or enqueue conversion is aborted entirely.
This can be due to a distributed transaction timeout, but usually relates to locks
requested in no-wait mode.
Fixed Array Free Lists
The free slots in each of Oracle's fixed arrays are maintained on a free list.
For each of these arrays, there is a free list header pointer that points to
one of the free slots in the array. That slot, in turn, holds a pointer to the
next free slot in the free list, and so on.
Free slots are always taken from the head of the free list, and are always
returned to the head of the free list. This means that the tail of the free list
normally remains unused, and the high-water mark is only advanced
when necessary. This fact was used by the APT script
fixed_table_hwms.sql under Oracle7 to extract the maximum usage of
each fixed array from the corresponding X$ tables. This script is
redundant in Oracle8, because the same functionality is now provided by
the V$RESOURCE_LIMIT view.
The free list for each fixed array must be protected by a latch. For
example, the process allocation latch protects the free list for the array of
processes, and the session allocation latch protects the free list for the
array of sessions.
If V$SYSSTAT shows a significant number of enqueue waits, then a breakdown of
the resource types for which these waits have been sustained can be obtained
from X$KSQST , or from the APT script enqueue_stats.sql . Unfortunately,
X$KSQST does not contains any indication of the duration of the waits, so care is
needed when interpreting these figures.
It is sometimes suggested that ENQUEUE_RESOURCES should be increased to
combat enqueue waits. But please note that there is absolutely no substance to
this suggestion. Oracle will return an ORA-52 or ORA-53 error if it fails to find a
free slot in the enqueue resources or enqueue locks fixed arrays respectively.
Beyond that, the setting of the ENQUEUE_RESOURCES and
_ENQUEUE_LOCKS parameters is unimportant.

The V$RESOURCE_LIMIT view should be used to adjust your settings for the
ENQUEUE_RESOURCES and _ENQUEUE_LOCKS parameters to ensure that
you will not run out of slots in these arrays. You can afford to be generous,
because slots in these arrays only take on the order of 72 bytes and 60 bytes
respectively. I like to maintain headroom of at least 20% above the maximum
utilization ever recorded.
4.3.4 Deadlock Detection
Oracle performs automatic deadlock detection for enqueue locking deadlocks.
Deadlock detection is initiated whenever an enqueue wait times out, if the
resource type required is regarded as deadlock sensitive, and if the lock state for
the resource has not changed. If any session that is holding a lock on the required
resource in an incompatible mode is waiting directly or indirectly for a resource
that is held by the current session in an incompatible mode, then a deadlock
exists.
If a deadlock is detected, the session that was unlucky enough to find it aborts its
lock request and rolls back its current statement in order to break the deadlock.
Note that this is a rollback of the current statement only, not necessarily the
entire transaction. Oracle places an implicit savepoint at the beginning of each
statement, called the default savepoint, and it is to this savepoint that the
transaction is rolled back in the first case. This is enough to resolve the technical
deadlock. However, the interacting sessions may well remain blocked.
An ORA-60 error is returned to the session that found the deadlock, and if this
exception is not handled, then depending on the rules of the application
development tool, the entire transaction is normally rolled back, and a deadlock
state dump written to the user dump destination directory. This, of course,
resolves the deadlock entirely. The enqueue deadlocks statistic in V$SYSSTAT
records the number of times that an enqueue deadlock has been detected.
Application developers can eliminate all risk of enqueue deadlocks by ensuring
that transactions requiring multiple resources always lock them in the same
order. However, in complex applications, this is easier said than done,
particularly if an ad hoc query tool is used. To be safe, you should adopt a strict
locking order, but you must also handle the ORA-60 exception appropriately. In
some cases it may be sufficient to pause for three seconds, and then retry the
statement. However, in general, it is safest to roll back the transaction entirely,
before pausing and retrying.

4.3.5 Blocking Locks
Oracle resolves true enqueue deadlocks so quickly that overall system activity is
scarcely affected. However, blocking locks can bring application processing to a
standstill. For example, if a long-running transaction takes a shared mode lock on
a key application table, then all updates to that table must wait.
There are numerous ways of attempting to diagnose blocking lock situations,
normally with the intention of killing the offending session. I will mention just a
few.
Blocking locks are almost always TX (transaction) locks or TM (table) locks .
When a session waits on a TX lock, it is waiting for that transaction to either
commit or roll back. The reason for waiting is that the transaction has modified a
data block, and the waiting session needs to modify the same part of that block.
In such cases, the row wait columns of V$SESSION can be useful in identifying
the database object, file, and block numbers concerned, and even the row number
in the case of row locks. V$LOCKED_OBJECT can then be used to obtain session
information for the sessions holding DML locks on the crucial database object.
This is based on the fact that sessions with blocking TX enqueue locks always
hold a DML lock as well, unless DML locks have been disabled.
It may not be adequate, however, to identify a single blocking session, because it
may, in turn, be blocked by another session. To address this requirement,
Oracle's utllockt.sql script gives a tree-structured report showing the relationship
between blocking and waiting sessions. Some DBAs are loath to use this script
because it creates a temporary table, which will block if another space
management transaction is caught behind the blocking lock. Although this is
extremely unlikely, the same information can be obtained from the
DBA_WAITERS view if necessary. The DBA_WAITERS view is created by
Oracle's catblock.sql script.
Some application developers attempt to evade blocking locks by preceding all
updates with a SELECT FOR UPDATE NOWAIT statement. However, if they
allow user interaction between taking a sub-exclusive lock in this way and
releasing it, then a more subtle blocking lock situation can still occur. If a user
goes out to lunch while holding a sub-exclusive lock on a table, then any shared
lock request on the whole table will block at the head of the request queue, and all
other lock requests will queue behind it.

Diagnosing such situations and working out which session to kill is not easy,
because the diagnosis depends on the order of the waiters. Most blocking lock
detection utilities do not show the request order, and do not consider that a
waiter can block other sessions even when it is not actually holding any locks. The
APT script enqueue_locks.sql shows the locks held and wanted for each resource
in order, together with the number of seconds that the lock has been held or
wanted. This is intended to supplement other blocking lock detection utilities,
such as Oracle's utllockt.sql.
Application developers can greatly reduce the risk of blocking lock problems by
adopting an optimistic locking strategy (see the sidebar, "Optimistic Locking"),
and by cultivating an aversion to coarse granularity locking and so designing
their applications to run without DML locks.
4.3.6 Distributed Transactions
For distributed transactions, Oracle is unable to distinguish blocking locks and
deadlocks, because not all of the lock information is available locally. To prevent
distributed transaction deadlocks, Oracle times out any call in a distributed
transaction if it has not received any response within the number of seconds
specified by the _DISTRIBUTED_LOCK_TIMEOUT parameter. This timeout
defaults to 60 seconds. If a distributed transaction times out, an ORA-2049 error
is returned to the controlling session. Robust applications should handle this
exception in the same way as local enqueue deadlocks.
Similarly, under release 8.0, parallel transactions, which consist of multiple
sibling transaction branches, could deadlock undetectably with other simple
transactions. If a simple transaction was blocked by one branch of a global
transaction, and was blocking another, then Oracle's normal deadlock detection
mechanism in release 8.0 would fail to detect the deadlock. To prevent this,
Oracle timed out any enqueue lock acquisition or conversion request in a branch
of a parallel transaction as though it were a distributed transaction, and an
ORA-99 error was returned. The
PARALLEL_TRANSACTION_RESOURCE_TIMEOUT parameter, which
defaulted to 300 seconds, was used to control this timeout. In release 8.1, the
deadlock detection algorithm has been improved to detect these deadlocks, and
so this timeout is no longer required.

Optimistic Locking
Consider an airline seat reservation application. Two different customers may
simultaneously ask two different operators whether a seat is available on a
particular flight. What should the application do?
The application can use SELECT FOR UPDATE NOWAIT to retrieve the
information. This guarantees that if a seat appears to be available, then it has
already been locked, and a booking for that seat will be able to be successfully
taken. This is called early locking, or pessimistic locking.
The alternative is to defer the taking of a lock until the customer resolves to make
a booking. This is called late locking, or optimistic locking.
The choice of either pessimistic or optimistic locking affects the design of both
business and application processes. So careful thought is needed. Pessimistic
locking should be avoided where possible, despite being slightly easier to
implement, because it increases the risk of blocking locks.
4.3.7 ITL Entry Shortages
There is an interested transaction list (ITL) in the variable header of each Oracle
data block. When a new block is formatted for a segment, the initial number of
entries in the ITL is set by the INITRANS parameter for the segment. Free space
permitting, the ITL can grow dynamically if required, up to the limit imposed by
the database block size, or the MAXTRANS parameter for the segment,
whichever is less.
Every transaction that modifies a data block must record its transaction identifier
and the rollback segment address for its changes to that block in an ITL entry.
(However, for discrete transactions, there is no rollback segment address for the
changes.) Oracle searches the ITL for a reusable or free entry. If all the entries in
the ITL are occupied by uncommitted transactions, then a new entry will be
dynamically created, if possible.
If the block does not have enough internal free space (24 bytes) to dynamically
create an additional ITL entry, then the transaction must wait for a transaction
using one of the existing ITL entries to either commit or roll back. The blocked
transaction waits in shared mode on the TX enqueue for one of the existing
transactions, chosen pseudo-randomly. The row wait columns in V$SESSION

show the object, file, and block numbers of the target block. However, the
ROW_WAIT_ROW# column remains unset, indicating that the transaction is
not waiting on a row-level lock, but is probably waiting for a free ITL entry.
The most common cause of ITL entry shortages is a zero PCTFREE setting. Think
twice before setting PCTFREE to zero on a segment that might be subject to
multiple concurrent updates to a single block, even though those updates may not
increase the total row length. The degree of concurrency that a block can support
is dependent on the size of its ITL, and failing that, the amount of internal free
space. Do not, however, let this warning scare you into using unnecessarily large
INITRANS or PCTFREE settings. Large PCTFREE settings compromise data
density and degrade table scan performance, and non-default INITRANS settings
are seldom warranted.
One case in which a non-default INITRANS setting is warranted is for segments
subject to parallel DML. If a child transaction of a PDML transaction encounters
an ITL entry shortage, it will check whether the other ITL entries in the block are
all occupied by its sibling transactions and, if so, the transaction will roll back
with an ORA-12829 error, in order to avoid self-deadlock. The solution in this
case is to be content with a lower degree of parallelism, or to rebuild the segment
with a higher INITRANS setting. A higher INITRANS value is also needed if
multiple serializable transactions may have concurrent interest in any one block.
4.4 Row Cache Enqueues
A cache of rows from the data dictionary is kept in the shared pool. This cache
serves not only to reduce physical access to the data dictionary tables in the
SYSTEM tablespace, but also enables fine-grained locking of individual data
dictionary rows. The need for data dictionary locking was introduced at the start
of this chapter (see
Section 4.1.3
).
The locks on the data dictionary rows themselves are called row cache enqueue
locks. These locks are implemented in much the same way as general enqueue
locks. The cached data dictionary row acts as the resource structure, and enqueue
lock structures are dynamically allocated from the shared pool as required. Locks
can be requested, converted, and released, and requests can wait and time out,
just like the general enqueue locks. However, row cache enqueue locks are not
included in V$LOCK. In fact, they are not visible anywhere except in system and
process state dumps.

Depending on the operation, some row cache enqueue locks are requested in no-
wait mode and an ORA-54 error is returned if the lock is not immediately
available. Otherwise, row cache lock requests are enqueued if necessary, and the
process waits on a row cache lock wait. The parameters for this wait are shown in
Table 4.4
.
Table 4.4. Wait Parameters (row cache lock waits)
Parameter
Description
p1
A number corresponding to the CACHE# column of V$ROWCACHE
representing the data dictionary table for which a row lock is needed
p2
The mode in which the lock is already held
p3
The mode in which the lock is needed
The numeric codes used for the lock modes in the parameters for this wait are
those for instance locks, rather than local locks, even when running single-
instance Oracle. However, this wait is relatively rare in single-instance Oracle,
resulting only from resource conflicts, whereas it is routine in parallel server
because new lock requests must be socialized via the distributed lock manager.
Oracle does not expect row cache enqueue lock acquisitions and conversions to
block for more than a few seconds. Therefore, row cache lock waits time out
every 3 seconds, and if the lock has still not been acquired after 100 timeouts (5
minutes), an internal deadlock is assumed, and the operation is aborted. A
message is written to the alert log saying that a process "WAITED TOO LONG
FOR A ROW CACHE ENQUEUE LOCK," and a process state dump is written to a
trace file. Except for DDL against a long-running, in-use function, procedure, or
package, this error should be treated as an Oracle bug and reported to Oracle
Support.
4.5 Library Cache Locks and Pins
The library cache is not one cache, but many. It contains the pseudo code for
PL/SQL program units. It contains parse trees and execution plans for shareable
SQL statements. It also contains abstract representations in a form called DIANA
of the database objects referenced by the SQL statements. The information is
needed in this form for PL/SQL program unit compilation and SQL statement
parsing and execution, despite the fact that the dictionary cache contains the
same information in a different form. The library cache also contains control

structures such as synonym translations, dependency tracking information, and
library cache locks and pins.
Library cache locks are referred to as breakable parse locks in the Oracle
documentation. They are applied to the library cache objects for SQL statements
and PL/SQL program units, and recursively to the library cache objects for the
database objects on which they depend. Library cache locks are held in shared
mode during parse operations and are converted to null mode thereafter. If a
DDL statement later modifies the definition of a database object, then the library
cache information for that database object and all dependent library cache
objects is invalidated by breaking the library cache locks.
Library cache locks can only be broken, however, when the library cache object is
not also pinned. A pin is applied to the library cache object for a PL/SQL program
unit or SQL statement while it is being compiled, parsed, or executed. Pins are
normally held in shared mode, but are also held in exclusive mode while the
library cache information for the object is being changed. The library cache
objects for pipes and sequences are most subject to change. When a library cache
object is pinned, pins are applied to all referenced objects in turn. When a pin is
applied to the library cache object for a database object, then a corresponding
row cache enqueue lock is acquired on the underlying data dictionary row,
thereby preventing conflicting DDL.
Every object in the library cache has a handle that acts as the resource structure
for library cache locks and pins. The handle, lock, and pin structures are all
dynamically allocated within the shared pool. The handle implements two-way
linked lists of locks held, locks waited for, pins held, and pins waited for. Sessions
waiting for a lock or pin report a library cache lock or library cache pin wait
respectively. The parameters for these waits are shown in
Table 4.5
.
Table 4.5. Wait Parameters (library cache lock and library cache pin waits)
Parameter
Description
p1
The address in memory of the library cache handle.
p2
The memory address of the lock or pin structure.
p3
The mode of lock or pin required, and the namespace of the object,
encoded as 10 * mode + namespace. In this case, the modes are:
2 shared
3 exclusive
The namespaces are:
0 cursor

1 table, procedure, and others
2 package body
3 trigger
4 index
5 cluster
6 object
7 pipe
If there are multiple readers of a single pipe, then library cache pin waits on the
library cache object for that pipe will be routine, but brief. Other than that,
library cache waits are relatively rare, although much more likely to be prolonged.
These waits time out after three seconds and, if they do time out, deadlock
detection is performed. If a deadlock is found, the lock or pin request is aborted
and an ORA-4020 error is returned. This error is normally caused by ad hoc
DDL. It should not be necessary to code your applications to handle this error.
4.6 DML Locks
Library cache pins and the associated row cache enqueue locks protect object
definitions for the duration of parse and execute calls. However, for transactions
that consist of a series of statements, equivalent locks need to be held for the
duration of the transaction.
More than that, the lock mode may need to be raised partway through the
transaction. For example, a table may first be queried, and then updated. This, of
course, is why lock conversions are necessary. If the existing lock were to be
released, even momentarily, it would be possible for the referenced object to be
dropped or changed, and the transaction would then be unable to either proceed
or roll back.
The possibility of rollback, particularly rollback to a savepoint, adds another
dimension of complexity to dictionary locking. Namely, if a transaction is rolled
back beyond the point at which a lock was upgraded, then the lock must be
downgraded correspondingly, as part of the rollback operation, in order to reduce
the risk of artificial deadlocks.
The requirements of dictionary locking for transactions and, in particular, the
maintenance of a history of lock conversions, is provided by DML locks in
conjunction with TM enqueues. Every transaction holding a DML lock also holds
a TM enqueue lock. The basic locking functionality is provided by the enqueue,
and the DML lock adds the maintenance of the conversion history.

The fixed array of DML lock structures is sized by the DML_LOCKS parameter.
Its free list is protected by the dml lock allocation latch , and the active slots are
visible in V$LOCKED_OBJECT . As with enqueue resources and locks, the
number of slots in the DML locks fixed array is unimportant to performance, as
long as you don't run out of free slots and get an ORA-55 error. Once again,
V$RESOURCE_LIMIT can be used to adjust your setting for DML_LOCKS to
ensure that this does not happen. Each slot only takes on the order of 116 bytes,
so having a generous number of slots is not a problem.
4.6.1 Disabling DML Locks
DML locks and the associated TM enqueue locks can be disabled, either entirely,
or just for certain tables. To disable these locks entirely, the DML_LOCKS
parameter must be set to zero. In a parallel server database, it must be set to zero
in all instances. To disable such locks against a particular table, the DISABLE
TABLE LOCKS clause of the ALTER TABLE statement must be used.
If locks are disabled for a table, then DML statements can still modify the table's
blocks, and row-level locks are still held. However, the sub-shared mode table
locks normally associated with queries, and the sub-exclusive mode table locks
normally associated with DML, are not taken. Instead, transactions against the
table are protected from conflicting DDL by simply prohibiting all attempts to
take a lock on the entire table, and thus all DDL against the table.
There are two reasons for disabling DML locks and table locks. The first is to
avoid the lock acquisition overhead. This is particularly important in parallel
server databases where the transactions are short. In such cases, it may take
longer to acquire the TM instance lock than to complete the rest of the
transaction.
In single-instance Oracle, the lock acquisition overhead is relatively trivial.
However, the disabling of table locks should still be considered to efficiently
prevent blocking lock problems. A large class of blocking lock problems is caused
by attempts to lock an entire table, sometimes for ad hoc DDL such as creating an
index, but often for ad hoc DML against a referenced table where the relationship
is not supported by a foreign key index.
Foreign keys referring to tiny reference tables are often indexed to prevent such
problems. However, the presence of such indexes adds a significant overhead to
DML against the main table. It is better to do without these indexes, and prevent

blocking locks by disabling table locks. Of course, table locks will need to be
enabled temporarily for maintenance tasks such as updating the reference data or
rebuilding indexes. However, that is no hardship, as such operations are
normally performed during a special maintenance window.
Of course, it is preferable to disable table locks on each table individually, rather
than to disable them entirely by setting the DML_LOCKS parameter to zero. If
DML_LOCKS is zero, you can create temporary tables but never drop them, and
you have to shut down and start up the system twice for maintenance operations
such as rebuilding indexes.
4.7 Buffer Locks
A form of enqueue locking is used to protect cached database blocks. For each
buffer in the database buffer cache, there is a buffer header. The buffer headers
constitute a fixed array in the permanent memory part of the shared pool. These
buffer headers act as the resource structures for buffer locks. Sessions manipulate
buffer headers, and thus buffers, via dynamically allocated structures known as
buffer handles. The buffer handles act as the lock structures for buffer locks.
Buffer locks are taken only in shared and exclusive modes.
[1]
The buffer headers
implement a two-way linked list of the buffer handles for sessions that are using
the buffer, and another for the buffer handles of sessions waiting for the buffer.
Sessions waiting for a buffer lock report either buffer busy waits, or buffer busy
due to global cache waits, or write complete waits. The parameters for buffer
busy waits are shown in
Table 4.6
.
[1]
This is a simplification, but adequate for our purpose here.
Table 4.6. Wait Parameters (buffer busy waits)
Parameter
Description
p1
The file number of the database block.
p2
The block number of the database block in its file.
p3
The reason for the wait. A or 1014 indicates that the buffer is locked
exclusively by a session that is busy reading a block from disk into the
buffer, and that the read has not yet completed. A reason of is used for
consistent gets, whereas 1014 is used for current mode block gets. Any
other number indicates that the buffer is locked exclusively for
modification by another session.

The timeout for buffer busy waits backs off from 1 to 3 seconds. If a buffer lock
for a block that is in cache cannot be acquired within a certain number of
timeouts, and if the session is holding buffer locks on one or more other buffers,
then a buffer lock deadlock is assumed. The number of timeouts to wait before a
buffer lock deadlock is assumed is dependent on the operation being attempted,
and whether it is part of a discrete transaction. Because discrete transactions do
not hold transaction locks, and thus row-level locks, they must acquire all the
buffer locks they need before any modifications can be made, and hold them all
until the transaction is ready to make its changes and commit. This means that
discrete transactions hold more buffer locks than normal transactions, and hold
them for much longer.
If a buffer lock deadlock is suspected, the session that timed out trying to acquire
a buffer lock releases the buffer locks that it is holding on other buffers, and
immediately enqueues them again, thereby falling to the end of the queue of
waiting sessions. It also posts the first process that was waiting for a lock on each
of the buffers concerned, and then yields the CPU. Although yielding the CPU
does not really constitute a wait, a buffer deadlock wait is recorded and the
exchange deadlocks statistic is incremented. Assumed buffer lock deadlocks
signal event 370, which can be caught to investigate such problems.
In parallel server databases, buffers can be locked for global cache operations
such as writes in response to ping requests, and consistent reads for direct
memory transfers by the block server process. If a request for a buffer lock cannot
proceed because the buffer is locked for a global cache operation, then a buffer
busy due to global cache wait is recorded.
Similarly, when buffer lock requests cannot proceed because the buffers are
locked by DBWn as part of a batch of blocks to be written, then write complete
waits are recorded . The timeout for these waits is 1 second, and the parameters
are as shown in
Table 4.7
.
Table 4.7. Wait Parameters (write complete waits)
Parameter
Description
p1
The file number of the database block.
p2
The block number of the database block in its file.
p3
The reason for the wait. The normal reason code is 1029; however, other
values are seen at times.

4.8 Sort Locks
Sort locks apply to the disk space being used for disk sort operations. There are
two types of sort locks: temporary table locks and sort segment locks. These
correspond to temporary segments in PERMANENT tablespaces and
TEMPORARY tablespaces respectively. There are fixed arrays in the SGA for each
type of sort lock. Both arrays are sized by the SESSIONS parameter, which allows
for the maximum possible usage of sort locks.
Sort locks are used merely to track disk sort space usage, and do not suffer from
lock conflicts, waits, or deadlocks. However, you should not confuse sort locks
with the ST (space transaction) enqueue , which is extremely prone to lock
conflicts, waits, and even deadlocks. Contention for the ST enqueue is often
associated with disk sorts, because it is needed for the creation, extension, and
deallocation of temporary segments.
4.9 Reference
This section contains a quick reference to the parameters, events, statistics, waits,
and APT scripts mentioned in Chapter 4.
4.9.1 Parameters
Parameter
Description
_DISTRIBUTED_LOCK_TIMEOUT
Timeout for assumed deadlocks on
distributed transactions. Defaults to
60 seconds.
_ENQUEUE_HASH
The size of the enqueue hash table.
_ENQUEUE_HASH_CHAIN_LATCHES
The number of latches used for
access to the enqueue hash table.
Defaults to the CPU count.
_ENQUEUE_LOCKS
The number of enqueue lock
structures.
DML_LOCKS
The size of the DML locks fixed
array. Where possible, DML locking
should be disabled to reduce locking
overheads and the risk of blocking
locks.
ENQUEUE_RESOURCES
The size of the enqueue resources
array.
PARALLEL_TRANSACTION_RESOURCE_TIMEOUT Timeout for assumed deadlocks

between the branches of a parallel
transaction and another transaction
in release 8.0.
TEMPORARY_TABLE_LOCKS
This parameter is obsolete in
Oracle8. It does still exist in release
8.0, but setting it has no effect.
4.9.2 Events
Event
Description
60
This is the enqueue deadlock detection error. In cases of recurrent, mysterious
deadlock problems, you may need to take a systemstate dump on this event
to diagnose the interactions causing the deadlocks.
370
This event is signaled for assumed buffer cache deadlocks, and can be used
for investigating severe buffer locking contention, using processstate dumps.
4020
This is the library cache deadlock detection error. With a systemstate dump on
this event, you will be able to see what happened. Without it, you will never
know.
4021
This is the library cache assumed deadlock timeout error. This timeout is
needed because the library cache deadlock detection mechanism is not
exhaustive, lest it be too expensive. Once again, this error is normally caused
by ad hoc DDL.
4.9.3 Statistics
Statistic
Source
Description
enqueue
conversions
V$SYSSTAT Local enqueue conversions.
enqueue
deadlocks
V$SYSSTAT Local enqueue deadlocks detected and broken.
enqueue
releases
V$SYSSTAT Local enqueue releases.
enqueue
requests
V$SYSSTAT Local enqueue requests.
enqueue
timeouts
V$SYSSTAT Aborted local enqueue operations.
enqueue waits V$SYSSTAT
The number of enqueue operations that waited. Not the
number of waits.
exchange
deadlocks
V$SYSSTAT
Number of local buffer deadlocks assumed. The statistic
name reflects the fact that index block exchanges are
one possible cause of such deadlocks.

4.9.4 Waits
Event
Description
buffer busy due
to global cache
Waits to acquire a local buffer lock on a buffer that is locked for a
global cache operation, such as a ping.
buffer busy
waits
Waits for a local buffer lock on a buffer that is locked in an
incompatible mode.
buffer deadlock Assumed deadlocks while waiting for a local buffer lock.
enqueue
These are waits for both local and global enqueues.
library cache
load lock
This wait is seen if two sessions attempt to load (not reload) the
library cache information for an object simultaneously.
Simultaneous reloads cause library cache pin waits instead.
library cache
lock
Waits to reference a library cache object that is in flux.
library cache
pin
Waits to modify a library cache object that is in flux.
row cache lock
Waits to obtain either a local row cache enqueue or a row cache
instance lock.
write complete
waits
Waits for a buffer lock on a block that is part of a normal write
batch.
4.9.5 APT Scripts
Script
Description
enqueue_locks.sql
Shows enqueue locks held and wanted in the order requested.
enqueue_stats.sql
Shows the breakdown of enqueue gets and waits by type.
fixed_table_hwms.sql
Shows the high-water mark usage for the fixed tables under
Oracle7. This can be used to check whether your settings for
the corresponding initialization parameters are inadequate or
overly generous. U nder Oracle8, use V$RESOURCE_LIMIT
instead.

Chapter 5. Instance Locks
Instance locks are used for inter-instance locking and communication between the
instances of an Oracle parallel server database. Although instance locks are scarcely used
in single-instance Oracle, I encourage all readers to browse this chapter anyway. Single-
instance Oracle is really just a special case of parallel server, and there are some aspects
of its operation that you will find difficult to grasp unless you understand the general
case. If nothing else, rea
5.1 The Lock Manager
The part of Oracle that manages instance locks is called the lock manager. The
lock manager is a layer of functionality that affects the operation of all processes.
However, its most obvious manifestations are the presence of a set of lock
management processes, and an in-memory database of instance lock information
in each instance.
The lock manager is said to be distributed. There is no central point of control.
Each instance only maintains information about the instance locks in which it has
an interest. The lock manager is also said to be integrated. This is because, prior
to Oracle8, a separate product provided by the operating system vendors was
required for lock management. In Oracle8, release 8.0, this functionality was
incorporated into the Oracle kernel.
5.1.1 The Instance Lock Database
The lock and resource structures for instance locks reside in a dedicated area
within the SGA called the instance lock database. The lock and resource arrays
are dimensioned by the LM_LOCKS and LM_RESS parameters. A third
parameter, LM_PROCS, dimensions the array of processes and instances that
can own the locks. This array needs one slot for each local process and one slot
for each remote instance.
The instance lock database also includes an array of process groups. In some
cases, instance locks may be owned by a group of processes, rather than a single
process. Group lock ownership allows Multi-Threaded Server sessions to migrate
between shared server processes, and allows OCI transactions to be detached
from one process and resumed by a different process. All lock acquisition
requests can specify either process or group ownership. The group membership

of processes is inferred and tracked automatically in the instance lock database.
Exchanges of group-owned instance locks within the process group do not
require any further lock acquisition or conversion. The size of the process groups
array is set by the _LM_GROUPS parameter, which defaults to 20.
The instance lock database contains many other structures besides the resources,
locks, processes, and process groups. There are hash tables for access to many of
these arrays; structures for recording statistics, managing waits and timeouts,
checking for deadlocks, and performing recovery; and also a large portion of
memory to hold the message buffers used for inter-instance communication. The
number of buffers is set by the _LM_SEND_BUFFERS parameter, which
defaults to 10,000.
Most parts of the instance lock database are fixed in size from instance startup.
However, Oracle has the option of allocating memory from the shared pool for
additional dynamically allocated resources and locks if necessary. If this occurs, a
message is written to the alert log, and the corresponding parameter should be
increased prior to the next database startup, unless the overrun was due to the
recovery of another instance. The GV$RESOURCE_LIMIT view contains
statistics about the number of dynamic resources and locks allocated, as does
GV$DLM_MISC . Note that the dynamically allocated memory is never released
back into the shared pool.
5.1.2 Lock Mastering
The instance lock database is a distributed database. No single node tracks all the
locks on all the resources. For each resource there is a master node. The master
node for a resource maintains complete information about all the locks on that
resource. Other nodes need only maintain information about locally held locks on
that resource. For dynamically allocated resources, the master node is normally
the first node to take a lock on the resource. There is also a directory node for
each resource, which maintains a pointer to the master node. The directory node
is determined using a hash function based on the resource identification. For
persistent resources, the master node is always the directory node.
Whenever the set of active instances changes due to instance startup or
shutdown, or due to the failure of an instance or node, then the distribution of
resources to nodes must be changed. In general, both the directory node and the
master node for each resource might change, and the required information must
be reconstructed at each node. If an instance has failed, then the roll forward

phase of instance recovery (called cache recovery) must also be completed before
all instance lock information can be validated.
The instance lock database is frozen during both resource redistribution and
cache recovery, if applicable. During this time, local activity may continue, but
only under the instance locks that were already held. However, if an instance has
been lost, local activity is limited to read-only access to data already in memory,
and for which an instance lock was already held. This is an extremely severe
constraint. You should attempt to limit the time required for resource
redistribution and instance recovery roll forward by using modest numbers of
resources and locks, and by configuring checkpoint activity to ensure bounded
recovery times.
5.1.3 Lock Handle Acquisition
Many instance locks are acquired in two steps. The first step is to obtain a lock
handle, which is an identifier of the lock to be used in subsequent conversion or
release operations. Some instance locks are held for the life of the instance and
are never converted or released. These locks are acquired in a single step, and no
lock handle is returned.
Although the lock manager has been integrated into the Oracle kernel, processes
needing a lock handle do not access the instance lock database to allocate a lock
handle directly. Instead, they still construct and send a message to the LMDn
background process, and wait for LMDn to return a lock handle. The message
identifies the resource, and sets certain options that govern both the acquisition
of the lock and its subsequent management.
If the resource does not exist in the local instance lock database, then a slot is
allocated from the instance lock resource table. The resource may be marked as
persistent, if it is to be retained once all locks have been released. The directory
node is computed from the resource identification, and the master node is
marked as unknown (unless the resource is persistent). Once the resource exists
in the local instance lock database, a slot in the instance lock table is allocated to
the lock. Its process or group ownership is established, and deadlock detection
parameters are set. The LMDn background process then constructs and sends a
reply message to the client process. This message is called an acquisition
asynchronous trap, or acquisition AST. The acquisition AST message includes a
lock handle.

Processes waiting for LMDn to return a lock handle wait on a DFS lock handle
wait. DFS stands for Distributed File System, which is an old name for Oracle's
instance lock management functionality. Lock handle waits should be brief,
because they are resolved entirely locally. If these waits take longer than 1
centisecond on average, then the LMDn process is overworked.
5.1.4 Instance Lock Acquisition
Once a lock handle has been obtained, the process needing an instance lock
constructs and sends a second message to LMDn to convert the lock. This
message identifies the lock handle, specifies the new lock mode required, and sets
further options. If the master node for the resource is already known, this
message may be sent directly to the LMDn process at the master node depending
on the setting of the _LM_DIRECT_SENDS parameter which defaults to ALL in
release 8.1, but just to LKMGR in release 8.0.
If the master node for the resource is still unknown, the local LMDn sends a
message to the directory node to find out which node is the master node for this
resource. If a master node has not already been assigned, the directory node
assigns a master node. Depending on the resource type, the lock mastering is
either assigned to all active nodes cyclically, or to the originating instance if the
resource is unlikely to be used from other instances. Once the master node is
known, the acquisition or conversion request can be forwarded to the master
node.
If the lock information held at the master node indicates that the lock can be
granted immediately, then the lock is linked into the granted queue at both the
master node and locally, and a conversion AST message is returned to the client
process via the LMDn process of the client instance. Otherwise, the lock is linked
to the convert queue for the resource, and the client process continues to wait.
When a lock request is blocked, the LMDn process at the master node may ask
the blocking lock holders to downgrade the modes of their locks on the resource,
in order to allow the new conversion request to be granted. This is done by
sending a blocking asynchronous trap, or BAST, to the blocking processes and
instances. Whether a lock holder is able to receive BAST messages, and the level
to which it may be willing to downgrade its lock, are set during lock acquisition or
conversion. When a blocking process has complied with a BAST, it sends a
completion AST in reply.

The GV$DLM_LOCKS view shows the details for all blocked and blocking locks
in the instance lock database, including all the options set when acquiring and
converting the locks. GV$DLM_ALL_LOCKS shows the same details, but for all
instance locks, including those held in null mode.
5.1.5 LCKn Processes
Many instance locks are not obtained directly by the process requiring the lock.
Instead, the LCKn processes obtain them on behalf of the entire instance. The
LCKn processes operate asynchronously. That is, when they send requests to the
LMDn process, they do not wait for an acquisition or conversion AST to be
returned. Instead, they are available to handle further lock requests from other
processes. This is why a distinction is made in the GV$SYSSTAT statistics
between asynchronous and synchronous global lock gets and conversions.
By default, only one LCKn process is started. This is normally sufficient, because
it operates asynchronously. However, if LCK0 is very active, and if the operating
system does not support priority fixing, then LCK0 may have to queue for the
CPU, thereby degrading overall system performance. If so, multiple LCKn
processes can be started using the _GC_LCK_PROCS parameter.
5.1.6 Lock Value Blocks
When a process acquires or converts an instance lock, it can read or write the 16-
byte lock value block which is maintained in the resource structure at the master
node. For example, the lock value block of the SM (SMON) instance lock resource
represents the last time an SMON process ran in any instance. The lock value
block facility is also used to communicate System Change Numbers (SCNs)
between instances, and to establish parallel execution communication paths.
However, the lock value block is not used for most resource types.
Incidentally, the resource structure for local enqueues also includes a lock value
block, but it is scarcely ever used.
5.2 Global Locks
Many of the resources protected by local locks in single-instance Oracle require
global exposure in a parallel server database. Whenever one of these local locks is
needed, a corresponding instance lock must be held as well, to protect the
resource across all instances. The instance locks used to protect local locks

globally are called global locks . However, the term is sometimes used informally
as a synonym for all instance locks generally.
5.2.1 Row Cache Instance Locks
Row cache instance locks correspond directly to local row cache enqueue locks.
They do not supersede the local locks, but give them global exposure.
When a process needs a row cache instance lock, it posts the LCK0 background
process to obtain the lock on behalf of the instance, and waits on a row cache lock
wait. This same wait is also recorded when waiting for the corresponding local
lock. LCK0 obtains the instance lock asynchronously. When LCK0 receives the
acquisition or conversion AST from LMDn, it posts the waiting process.
When the local process releases its row cache enqueue lock, the dictionary row
remains cached, and so the instance lock is not released but downgraded to null
mode in the background by the LCK0 process. However, the row cache instance
lock is released if the dictionary cache entry is flushed from the shared pool.
Although dictionary cache entries and row cache enqueue locks are dynamically
allocated in the shared pool, the lock state information for the corresponding
instance locks is not. That information is maintained in a fixed array which is
dimensioned by the _ROW_CACHE_INSTANCE_LOCKS parameter. The size of
this array limits the number of null mode instance locks cached by each instance,
and thus constrains the resource usage in the instance lock database for row
cache instance locks. Consider increasing the size of this array to cache a working
set of instance locks if the GV$ROWCACHE view shows ongoing
DLM_RELEASES without many DLM_CONFLICTS.
5.2.2 Global Enqueues
Most of the resources protected by enqueue locks in single-instance Oracle have
global exposure in a parallel server database. These are the global enqueues.
Global enqueue locks are taken by the foreground and background processes
taking the local locks. They are not taken by the LCKn processes on behalf of the
instance. The instance lock resources for global enqueues are dynamically
assigned, and like the local enqueue resources, they are not persistent. Most
global enqueue resource types are mastered locally, because locks on these
resources are seldom needed by other instances.

The single most effective way to optimize global enqueue locking is to disable
table locking. Indeed, this is strongly recommended for Oracle parallel server.
The preferred way of doing this is to use the ALTER TABLE DISABLE TABLE
LOCK command on all application tables, rather than setting the DML_LOCKS
parameter to 0, as discussed in the previous chapter.
5.2.3 Cross-Instance Calls
One global enqueue type is worthy of particular mention because of its role in
inter-instance communication. Some operations, such as changing the backup
state of tablespaces, log file operations, global checkpoints, and others, need
global coordination because all the instances must cooperate in performing the
operation.
This communication between instances is effected using CI (cross-instance call)
enqueues . For each type of operation, the background processes of each instance
hold instance locks on a set of resources. By manipulating the modes of these
locks, it is possible to trigger global actions and wait for them to be completed.
For example, prior to performing a direct read operation on a database segment,
the reader process or parallel query coordinator uses a cross-instance call to the
DBWn processes requesting a checkpoint of all dirty cached blocks belonging to
that segment. The lock value block is used to communicate the database object
number for the segment. Similarly, before truncating a segment, reuse block
range cross-instance calls are used to ensure that dirty cached blocks within the
affected range have been flushed to disk, and that clean cached blocks within the
affected range have been invalidated.
Despite their name, many cross-instance calls are used, and the corresponding CI
enqueues are taken in single-instance Oracle as well as in a parallel server.
5.2.4 Library Cache Instance Locks
Some library cache locks and pins also have global exposure in a parallel server
database. Remember that library cache locks are held during parse calls, and that
pins are held during execute calls, to prevent conflicting DDL. In parallel server
databases it is necessary to prevent such conflicting DDL in all instances. To
achieve this, it is sufficient to globally expose the library cache locks and pins on
database objects only. The local locks and pins on dependent objects such as

cursors do not need global exposure, because they are indirectly protected if all
the database objects on which they depend are protected.
Remember further that local library cache locks are retained in null mode to
invalidate cached library cache objects should the definition of an object on which
they depend be changed. The same functionality is provided between instances,
on database objects only, by the LCK0 processes holding an IV (invalidation)
instance lock in shared mode on all database objects cached in the library cache.
Any process that needs to invalidate an object definition globally merely takes an
exclusive mode lock on the same resource, thereby causing the LCK0 processes to
drop their shared lock and invalidate the object.
The use of global library cache locks, pins, and invalidation locks can be disabled
using hidden parameters. This is not recommended unless DML locks have also
been completely disabled.
5.3 PCM Instance Locks
Parallel cache management (PCM) instance locks do not protect cache buffers—at
least not directly. They protect data structures known as lock elements. Each lock
element protects a set of data blocks, not cache buffers. However, any cache
buffers containing those data blocks are linked to their lock element.
Lock elements are also called global cache locks, but that term is unhelpful
because they are neither locks nor resources. They are an intersection entity
between PCM instance locks and cache buffers.
5.3.1 Fixed Lock Elements
Lock elements are either releasable or fixed. Releasable lock elements may be
used for either hashed or fine-grained locking, but fixed lock elements are used
only for hashed locking. In hashed locking, data blocks are mapped to lock
elements using a hash algorithm, and a single lock element may protect any
number of cached blocks at once. In fine-grained locking, lock elements are
dynamically allocated to protect a single cached block at a time.
The mapping of data blocks to hashed lock elements, and whether they are fixed
or releasable lock elements, is established by the GC_FILES_TO_LOCKS and
GC_ROLLBACK_LOCKS parameters. The number of fixed lock elements is
derived from these strings. The number of releasable lock elements used for
hashed locking in these strings must be less than the number of releasable lock

elements specified with the GC_RELEASABLE_LOCKS parameter, which
defaults to the number of buffers in the cache. The remaining releasable lock
elements are available for fine-grained locking.
Fixed and releasable hashed locking exhibit identical performance, except in one
very important respect. During instance startup, the LCKn processes must
acquire null mode instance locks on all fixed lock elements. This can take many
minutes. Releasable hashed locking diffuses this cost over an initial ramp-up
phase of instance activity. Thereafter, the performance of these two forms of
hashed locking are identical. Note that the lock handles on releasable hashed lock
elements are never actually released, despite the lock elements being releasable.
In view of this, you should only use releasable lock elements for hashed locking,
and should not use fixed lock elements at all.
5.3.2 Hashed Locking
When a block is brought into the cache, the lock element under which it will be
protected must be determined, and the buffer must be linked to that lock
element. How this is done depends on whether the block uses fine-grained or
hashed locking, and in the case of hashed locking, it also depends on the class of
the block. Rollback segment blocks and data blocks are treated separately.
For data blocks subject to hashed locking , there is an index array that maps file
numbers to lock element buckets, and a bucket header array that identifies the
series of lock elements in each bucket. These arrays are visible as X$KCLFI and
X$KCLFH . For rollback segment blocks, the corresponding arrays are X$KCLUI
and X$KCLUH . These arrays are constructed from the GC_FILES_TO_LOCKS
and GC_ROLLBACK_LOCKS parameters during instance startup.
When a rollback segment block or data block is brought into cache, these arrays
are used to look up the correct lock element bucket. No latching is necessary,
because the arrays are static. The lock element chosen to protect a particular
block from within its bucket is the block number minus two, divided by the
blocking factor for the bucket, divided by the number of lock elements in the
bucket, rounded down. This hash function subtracts two from the block number,
rather than one, to allow for the file header block and to thereby ensure that if the
blocking factor is chosen as an integer divisor of the extent size expressed in
blocks, then lock element coverage will align to extent boundaries. Further, it is
good practice to make the number of lock elements in each bucket a prime

number to ensure an even distribution of blocks to lock elements, regardless of
the data distribution within database segments.
A heavier concentration of lock elements should be allocated to data files that
may be subject to contention for hashed PCM instance locks. The risk of such
contention is greatest on data files whose blocks are subject to change and whose
blocks are accessed from multiple instances.
5.3.3 Fine-Grained Locking
Data files and rollback segments that are not assigned any hashed lock elements
in GC_FILES_TO_LOCKS and GC_ROLLBACK_LOCKS, or that are explicitly
given no lock elements, use fine-grained locking unless an alternative default
bucket (bucket 0) has also been defined. In fine-grained locking each data block
is protected by a dedicated lock element from the set of unassigned releasable
lock elements. Because just one data block is protected by each lock element at
any one time, fine-grained locking is also called DBA (data block address)
locking. Fine-grained locking is also used for all block classes other than data
blocks and rollback segment blocks. These minor block classes include segment
header blocks, free list blocks, and extent map blocks.
If fine-grained locking is being used for certain data files, and if important minor
class blocks such as segment header blocks are often aged out of the buffer cache,
then the lock elements for those blocks may be reused before their blocks are
read in again. This results in unnecessary instance lock acquisition and resource
allocation overhead. In this case, to improve the retention of instance locks, you
should consider reserving a number of lock elements in a separate bucket for the
minor class blocks by setting the _GC_CLASS_LOCKS parameter.
5.3.4 The Lock Element Free List
When a block subject to fine-grained locking is brought into the cache, a hash
table is consulted to determine whether a lock element for the block has been
preserved. This is done under the protection of the KCL name table latch . If
necessary, a lock element is allocated from the LRU (least recently used) end of
the lock element LRU chain under the protection of the KCL freelist latch . Note
that despite the name of this latch, the data structure that it protects is an LRU
chain of both free and in use (named) lock elements. The term, lock element free
list, is just another name for the set of free lock elements at the end of the lock
element LRU chain.

In most instances, it is desirable to have lock elements available on the free list at
all times. The X$KCLFX fixed table contains some free list statistics. In
particular, the LWM column contains the low-water mark of the free list length.
This can be seen with the APT script lock_element_lwm.sql . Lock elements are
returned to the MRU (most recently used) end of the LRU chain when their
protected buffer is reused. Lock elements may be reclaimed from the free list if
the protected block is brought back into cache before the lock element has been
reused.
In very large memory (VLM) environments, it may be desirable to have fewer
lock elements available than the number of cache buffers under fine-grained
locking. It is not that there is not ample memory available for the lock elements
and instance locks, but that having a large number of instance locks would greatly
extend the period of reduced availability during instance lock redistribution when
necessary. In such environments, named lock elements are reused in LRU order
as required. If a process has to wait while a lock element is prepared for reuse, it
waits on a global cache freelist wait . The only parameter to this wait is the lock
element number.
5.3.5 PCM Lock Acquisition
When a block is brought into cache, a buffer from the buffer cache LRU chain is
selected for reuse, and the session allocates a buffer handle to work with the
buffer. First it must unlink the buffer header from the lock element under which
the previous block cached in that buffer was protected, if any. Then it must link
the buffer header to the lock element for the new block. These operations are
performed under the protection of the KCL lock element parent latch for that
lock element.
If multiple LCKn processes have been configured, then the lock element array is
partitioned between these processes, and a separate set of lock element parent
latches is used for each partition. The number of latches in each set is determined
by the _GC_LATCHES parameter, which defaults amply to two times the CPU
count.
Of course, more needs to be done than merely linking the buffer for a new block
to its lock element. In particular, a PCM instance lock of the correct mode needs
to be acquired on the lock element. The LCKn background processes perform this
task. For fine-grained locks, they must also release the instance lock and resource
previously held for that lock element.

When a foreground process needs to acquire or convert a PCM instance lock on a
particular lock element, it allocates a structure called a lock context object . The
lock context object is linked to the lock element, and fully describes the operation
to be performed. The foreground process then posts the LCKn process and waits
for the LCKn process to complete the locking operation and clean up the lock
context object.
While the foreground process is waiting for LCKn to obtain a lock, it sleeps on
one of the global cache lock waits. The timeout for these waits is 1 second. The
parameters are as shown in
Table 5.1
.
Table 5.1. Wait Parameters (global cache lock waits)
Parameter
Description
p1
The file number of the database block.
p2
The block number of the database block in its file.
p3
The lock element number, or the block class for minor class block lock
acquisitions.
While a process is waiting on a global cache lock wait because a blocking lock is
held by a remote instance, the details can be seen in GV$DLM_LOCKS . The
resource name is constructed from the lock type and the two lock identifiers. The
lock type for PCM instance locks is BL (block lock) . The first identifier is the lock
element number for hashed locking, and the data block address for fine-grained
locking. The second identifier is the block class, as shown in
Table 5.2
.
Table 5.2. Block Classes
Block Class
Class Description
1
Data blocks
2
Sort blocks
3
Deferred rollback segment blocks
4
Segment header blocks
5
Deferred rollback segment header blocks
6
Free list blocks
7
Extent map blocks
8
Space management bitmap blocks
9
Space management index blocks
10
Unused
11 + 2r
Segment header block for rollback segment r

12 + 2r
Data blocks for rollback segment r
5.3.6 Block Pings
If a remote instance needs a PCM instance lock in an incompatible mode with the
lock held locally, then the LCKn process holding that lock will receive a BAST
from the local LMDn process. If none of the blocks protected by that lock element
are currently in the cache, or if they are in cache but in a compatible state, then
the LCKn process can downgrade its lock mode immediately. However, if any
blocks protected by the lock element are in cache in an incompatible state, then
the lock cannot be downgraded until after the block states have been changed.
Changing the state of a cached block in response to a BAST is called a ping.
Cached blocks can be in three possible states.
[1]
First, they can be current or stale.
Stale copies of blocks are kept in the cache to satisfy long-running queries.
Queries need to perform consistent reads. That is, blocks that have been modified
since the query started need to be rolled back, so that the information returned
by the query will reflect a consistent snapshot of the database at the time that the
query or transaction began. Retaining stale copies of blocks in cache for
consistent reads reduces the need to roll back changes for queries. Because of
this, stale copies of blocks that are still in the cache are said to be in consistent
read (CR) state. Note that CR is also the abbreviation for the concurrent read lock
mode, which can be cause for confusion at times.
[1]
Note that I am speaking here of block states. The states of the buffers containing those
blocks are related, but different.
Cached blocks that are not stale are current. Current blocks can be in two states,
namely clean or dirty. A current block is dirty if it has been changed and still has
to be written to disk. A current block is clean if it does not contain changes that
still have to be written to disk.
Pings only affect current blocks. If a remote instance requires a shared lock on a
lock element, then any dirty blocks protected by that lock element locally need to
be written to disk and thus cleaned. When these blocks have been cleaned, the
local lock on that lock element can be downgraded to shared mode. However, if
the remote instance needs to change a block, then it will request an exclusive lock
on its lock element. Any dirty blocks protected by that lock element locally need
to be written to disk, and clean blocks must be marked as stale; that is, they must
be converted to consistent read state. The local lock on the lock element can then
be downgraded to null mode.

Pings that affect dirty blocks and cause them to be written to disk are called hard
pings. Pings that only affect the state of blocks, by causing them to be marked as
stale, are called soft pings. Hard pings are a form of forced write. Forced writes
also occur in response to checkpoint object, reuse block range, and write buffer
cross-instance calls. Soft pings are a form of cache invalidation, which is forcing a
block to become stale. This term reflects the fact that the cache buffer no longer
contains a valid current copy of the block. Cache invalidations also occur in
response to reuse block range cross-instance calls. Forced reads, as shown in
GV$BH , are cases when an instance had to read a block back into cache after it
was invalidated.
Under hashed locking, it is possible for multiple cached blocks to be affected by a
single ping. Similarly, it is possible for blocks other than the block required by the
remote instance to be affected by a ping. Pings of blocks other than the block
required by the remote instance are called false pings . True pings are those in
which the only block affected is the block required by the remote instance. Fine-
grained locking is not subject to false pings, because only one block is protected
under each lock element.
Pings are a major performance issue for parallel server databases. The fixed table
GV$FILE_PING contains detailed statistics about pings that have occurred for
each data file, as well as other forced writes and invalidations. This information is
invaluable in pinpointing trouble spots while tuning a parallel server database to
reduce pings.
5.3.7 Consistent Read Requests
Oracle uses several optimizations to reduce the number of pings and their impact.
Queries only need consistent read copies of the data blocks, not necessarily the
current block image. If a stale copy of the block that is more recent than the
consistent read SCN for the query is available in the local cache, then that copy
will be used. If the lock element is not locked in exclusive mode by another
instance, then a shared mode lock is taken and the block is read from disk and
rolled back as required. However, if an exclusive lock is held by another instance,
Oracle must obtain a suitable read consistent copy of the block from that
instance. How this is done depends on the Oracle release.
In release 8.0, Oracle first attempts to ping the block. However, if the block is
very hot in the remote instance, the ping request times out after 6 seconds (or the
value of the _CR_DEADTIME parameter). In this case, Oracle uses a write buffer

cross-instance call to trigger the remote DBWn to write the current buffer to disk.
The block can then be read from disk and rolled back as required. However, the
rollback operation commonly requires several more calls for rollback segment
blocks from the remote instance.
In release 8.1, Oracle uses an alternative cross-instance call to trigger the remote
block server process to construct the required consistent read copy of the block
and transfer it directly to the client instance. If, however, the remote instance no
longer has a current copy of the block in its cache, then the client instance is
given permission to read the current image of the block from disk and perform
the required rollback itself. This is reflected in the global cache cr blocks received
and global cache cr blocks read from disk statistics.
Oracle plans to extend the block service feature to include transfers of current
mode blocks in a later release.
5.3.8 Deferred Ping Responses
Another optimization that Oracle uses to reduce the impact of pings is to defer its
response to hard pings by 10 centiseconds, or by the setting of the
GC_DEFER_TIME parameter. This is often long enough to allow the active
transaction to complete its current series of changes to the block, and mark them
as complete within the block header, so that the remote instance will not have to
check that transaction's status immediately after reading the block. Checking the
status of a remote transaction is an expensive operation, because it requires a
ping of the transaction's rollback segment header block, which is invariably a very
hot block.
Tuning GC_DEFER_TIME is a matter of balancing the number of pings against
the response time for pings, and it can be tuned conveniently because it is a
dynamic parameter with ALTER SYSTEM scope. However, local operations on a
lock element may be delayed unduly if pings take too long to resolve. In this case
global cache lock busy waits will be observed. The timeout for this wait is one
second, and the wait parameters are the same as for the other global cache lock
waits.
Another optimization that Oracle uses to reduce the impact of pings is to
automatically queue a conversion request to restore its lock mode after a ping.
This can be disabled in release 8.0 using the _UPCONVERT_FROM_AST
parameter. Similarly, Oracle sometimes takes an exclusive lock earlier than

necessary to reduce the number of lock conversions. This can be disabled using
the _SAVE_ESCALATES parameter. These parameter settings should not
normally be changed.
5.3.9 Workload Partitioning
Of course, the best way to reduce pings is to partition the workload so the
instances use mutually exclusive sets of data. With a little imagination, and a lot
of hard work, it is possible to partition most workloads satisfactorily. One
approach, for example, is to use a three-tier architecture with a TP monitor and
Oracle's XA libraries to direct global transaction branches to distinct instances
based on the data set required.
Another approach worthy of extended consideration is to embrace distributed
database technology, in preference to parallel server technology. The overheads
of instance locking add significantly to application response times, even under
ideal workload partitioning. Those overheads can be eliminated and replaced
with more modest network latencies that affect distributed transactions only, as
long as you can partition the data as well as the workload into distinct distributed
databases.
A parallel server architecture should only be adopted if scalability requirements
demand it, and if such complete partitioning of both data and workload into a set
of distributed databases is not feasible. The performance of a parallel server
database will always be mediocre by comparison with an equivalent distributed
or single-instance database. Parallel server is only superior in its scalability under
vast workloads.
You must realize, however, that parallel server scalability is not automatic.
Careful workload partitioning is essential. Workload partitioning is the key not
only to reducing pings, but also to reducing the instance lock acquisition
overheads of a parallel server database—in particular, inter-instance message
passing.
5.3.10 Blocking Factor
There is one way of improving parallel server scalability that is not immediately
obvious, but can result in significant savings both in pings and in lock acquisition
messages.

In hashed locking, although each lock element covers multiple blocks, the default
blocking factor is only one block. For multiblock reads, this means that a distinct
PCM instance lock must be held for each consecutive block. However, if a
blocking factor equal to the multiblock read count is adopted, then no more than
one PCM instance lock will be acquired for each multiblock read. For globally
visible data, this reduces PCM instance lock acquisition and thus inter-instance
messages. This reduction in lock acquisition also reduces pings for data that is
modified. This is because all the blocks covered by the lock that are cached in an
incompatible state in a remote instance will be released in a single ping
operation.
Clearly, a large blocking factor is desirable for data files that contain tables that
are subject to multiblock reads, particularly if they are globally visible and subject
to modification. But if a very large blocking factor is used, then a large number of
buffers will be linked to individual lock elements at times, introducing a risk of
contention for the lock element parent latches covering those lock elements. Also,
if there are hot spots within the table, a large blocking factor increases the risk of
false pings. Nevertheless, a blocking factor of several times the multiblock read
count is normally appropriate for such data files. A generous blocking factor is
also appropriate for rollback segments.
Indexes are much more problematic than tables and rollback segments—
particularly globally visible indexes that are subject to modification. First, it is
imperative that reverse key indexes be used to index monotonically increasing
primary keys, lest considerable contention arise for the PCM instance lock
covering the right-hand leaf block of the index. Oracle knows few forms of
contention so debilitating as this slow motion game of ping-pong.
For the general case of globally visible and updated indexes, fine-grained locking
is often suggested to combat the risk of false pings. Indeed, in my opinion, this is
the only case in which fine-grained locking should be considered, and even then
you should normally reject it in favor of heavy hashed locking.
I will concede that heavy hashed locking requires many more lock elements and
instance lock resources and locks. But memory is cheap. Somewhat more telling
is the complaint that heavy hashed locking, because of its retention of large
numbers of instance locks, extends the period of reduced availability during
instance lock redistribution when necessary. On the other hand, the database is
frozen by default for the transaction recovery phase of instance recovery if any
data files use fine-grained locking. This default can be changed with

_FREEZE_DB_FOR_FAST_INSTANCE_RECOVERY if relatively few fine-
grained locks are in use. But hashed locking is nevertheless to be preferred if
lengthy transaction recovery may be required. However, the decisive argument in
favor of heavy hashed locking is that the reduction in locking overhead from the
retention of instance locks easily outweighs the performance impact of false pings
in almost all cases.
Indexes that are subject to fast full scans also stand to benefit from an increased
blocking factor. However, indexes are also more sensitive to false pings than
tables, and so a more modest blocking factor is recommended.
In summary, my recommendation is that you use releasable hashed locking for
all data files, with a heavier concentration of lock elements on globally visible and
updated data.
5.4 Other Instance Locks
There are a number of other instance locks used for controlling certain
operations in parallel server databases that have no counterpart in single-
instance Oracle. For example, the SM (SMON) instance lock is used to ensure
that the SMON processes of multiple instances cannot be simultaneously active.
This is not necessary in single-instance Oracle. Similarly, the DR (distributed
recovery) instance lock is used to ensure that only one RECO process can be
active at any one time.
The DF (data file) instance locks are another group of locks that are not needed in
single-instance Oracle. There is one DF resource for each data file, and each
DBWn process holds a shared mode instance lock on each resource. If a data file
is taken offline in one instance, then the remote DBWn processes are notified to
no longer attempt to write to that data file by converting the mode of the instance
lock on that resource.
5.5 Reference
This section contains a quick reference to the parameters, events, statistics, waits,
and APT scripts mentioned in Chapter 5.
5.5.1 Parameters
Parameter
Description

_FREEZE_DB_FOR_FAST_INSTANCE_RECOVERY
Whether to freeze database activity
during the transaction recovery
phase of instance recovery. Defaults
to TRUE if any data files use fine-
grained locking.
_GC_CLASS_LOCKS
The number of releasable lock
elements to reserve for fine-grained
locking of the minor class blocks.
_GC_LATCHES
The number of lock element latches
per partition of the lock elements
fixed array. Defaults to two times
the number of CPUs, which is
ample.
_GC_LCK_PROCS
The number of LCKn processes.
Defaults to 1, which is normally
sufficient.
_IGNORE_FAILED_ESCALATES
Attempts to convert a PCM lock
straight after a ping appears to fail
because Oracle does not know
which instance last modified the
protected blocks. However, this
merely means that the lock value
block is invalid and cannot be used
for SCN generation. The lock is
usable in every other respect, and
so the default setting of TRUE
should be accepted. This parameter
is not available in release 8.1.
_KGL_MULTI_INSTANCE_INVALIDATION
This can be set to FALSE to disable
global library cache invalidation
locks.
_KGL_MULTI_INSTANCE_LOCK
This can be set to FALSE to disable
global library cache locks.
_KGL_MULTI_INSTANCE_PIN
This can be set to FALSE to disable
global library cache pins.
_LM_DIRECT_SENDS
The processes that can send inter-
instance messages directly. The 8.0
default of LKMGR means that all
messages are sent via LMDn. The
8.1 default value is ALL.
_LM_DLMD_PROCS
The number of LMDn processes.
_LM_DOMAINS
The number of domain structures in

the instance lock database.
Domains are used for lock
redistribution and recovery. Defaults
to 2.
_LM_GROUPS
The number of process group
structures in the instance lock
database. Defaults to 20.
_LM_SEND_BUFFERS
The number of message buffers in
the instance lock database. Defaults
to 10000.
_LM_XIDS
The number of transaction
structures in the instance lock
database. Defaults to 1.1 times the
LM_PROCS value.
_ROW_CACHE_BUFFER_SIZE
The size of the circular buffer in the
PGA of the LCK0 process used for
row cache instance locking
messages.
_ROW_CACHE_INSTANCE_LOCKS
The size of the row cache instance
locks fixed array.
_SAVE_ESCALATES
The default setting of TRUE enables
early acquisition of more restrictive
PCM instance locks than necessary.
_UPCONVERT_FROM_AST
The default setting of TRUE enables
the automatic reclamation of PCM
instance lock modes lost due to
pings. This parameter is not
available in release 8.1.
GC_DEFER_TIME
How long to defer response to ping
requests. Defaults to 10
centiseconds.
GC_FILES_TO_LOCKS
A string establishing the mapping of
files to lock element buckets for
hashed locking.
GC_RELEASABLE_LOCKS
The number of releasable lock
elements.
GC_ROLLBACK_LOCKS
A string establishing the mapping of
rollback segments to lock element
buckets for hashed locking.
LM_LOCKS
The number of lock structures in the
instance lock database. Defaults to

12000.
LM_PROCS
The number of process structures in
the instance lock database. The
default is operating system specific.
LM_RESS
The number of resource structures
in the instance lock database.
Defaults to 6000.
PARALLEL_SERVER
Virtually no memory is allocated to
all the instance lock structures
unless this parameter is set to
TRUE.
5.5.2 Events
Event
Description
10706
This is the trace event for instance lock operations. Level 1 lists the calls;
level 5 includes the replies; and level 10 adds time stamps. Expect large trace
files.
29700
This event enables the collection of statistics in GV$DLM_CONVERT_LOCAL
and GV$DLM_CONVERT_REMOTE.
5.5.3 Statistics
Statistic
Source
Description
cross instance
CR read
GV$SYSSTAT
A block required for a query was held under an
exclusive lock by another instance. After a ping
request timed out, this instance made a cross-
instance call for the block. This statistic no longer
exists in release 8.1 due to the introduction of cache
fusion.
DBWR flush
object cross
instance calls
GV$SYSSTAT
Number of checkpoint object and invalidate object
cross-instance calls.
DBWR forced
writes
GV$SYSSTAT
Total number of blocks written for forced writes. This
statistic was named DBWR cross instance writes prior
to release 8.1.
global cache
convert time
GV$SYSSTAT PCM instance lock conversion time.
global cache
converts
GV$SYSSTAT PCM instance lock conversions.
global cache cr GV$SYSSTAT The total time for consistent read block requests to be

block receive
time
satisfied.
global cache cr
blocks read
from disk
GV$SYSSTAT
Blocks read from disk for consistent reads because
the block had already aged out of the cache of the
remote instance holding an exclusive PCM instance
lock covering that block.
global cache cr
blocks
received
GV$SYSSTAT
Consistent read blocks received from remote
instances via direct transfer.
global cache
defers
GV$SYSSTAT The number of times a ping request was deferred.
global cache
freelist waits
GV$SYSSTAT Waits to free a lock element for reuse.
global cache
get time
GV$SYSSTAT PCM instance lock acquisition time.
global cache
gets
GV$SYSSTAT PCM instance lock acquisitions.
global cache
queued
converts
GV$SYSSTAT
PCM instance lock conversions that had to be queued,
because another instance was holding the lock in an
incompatible mode.
global lock
async converts
GV$SYSSTAT Asynchronous instance lock conversions.
global lock
async gets
GV$SYSSTAT Asynchronous instance lock acquisitions.
global lock
convert time
GV$SYSSTAT Total instance lock conversion time.
global lock get
time
GV$SYSSTAT Total instance lock acquisition time.
global lock
releases
GV$SYSSTAT Instance lock releases.
global lock
sync converts
GV$SYSSTAT Synchronous instance lock conversions.
global lock
sync gets
GV$SYSSTAT Synchronous instance lock acquisitions.
instance
recovery
database
freeze count
GV$SYSSTAT
Global freezes for the transaction recovery phase of
instance recovery.
remote
instance undo
GV$SYSSTAT Forced writes of rollback segment data blocks.

block writes
remote
instance undo
header writes
GV$SYSSTAT Forced writes of rollback segment header blocks.
remote
instance undo
requests
GV$SYSSTAT
Rollback segment block write requests to remote
instances needed while rolling back data blocks for
consistent reads.
dlm messages
sent directly
GV$DLM_MISC
The number of lock management messages sent
directly to the target instance by the process needing
the lock.
dlm messages
flow controlled
GV$DLM_MISC
The number of lock management messages sent
indirectly via the local LDMn processes.
dlm messages
received
GV$DLM_MISC
The number of lock management messages received
by the local LDMn processes.
5.5.4 Waits
Event
Description
DFS lock handle
Waits to obtain a lock handle for an instance
lock other than a PCM instance lock.
global cache freelist wait
Waits to free a lock element for reuse.
global cache lock busy
This wait occurs when a PCM instance lock
operation cannot proceed because the
previous operation on that lock element has
not yet completed.
global cache lock open sglobal cache
lock open xglobal cache lock null to
sglobal cache lock null to xglobal
cache lock s to x
Acquiring a PCM instance lock or converting its
mode upwards.
global cache lock open ss
Acquiring a PCM instance lock on a minor class
block in release 8.0.
5.5.5 APT Scripts
Script
Description
lock_element_lwm.sql Shows the low-water mark of the lock element free list

Chapter 6. Memory
Many tuning issues involve making decisions about memory allocation. Those decisions
are complicated by the fact that Oracle manages much of its memory dynamically. To
tune Oracle effectively, you need to understand both what it uses memory for and how it
manages that memory.
6.1 The SGA
The System Global Area (SGA), together with the essential background processes,
is definitive of an Oracle instance. It is a global area in the sense that it contains
global variables and data structures, and it is a system area in the sense that it
contains data structures that must be accessible to the entire Oracle instance,
rather than just a particular process.
6.1.1 The SGA Areas
The SGA contains four or five main areas:
??
The fixed area
??
The variable area
??
The database block buffers
??
The log buffer
??
The instance lock database (for parallel server instances)
In terms of memory size, the fixed area and the log buffer should be trivial.
6.1.1.1 The fixed area
The fixed area of the SGA contains several thousand atomic variables, small data
structures such as latches and pointers into other areas of the SGA. These
variables are all listed in the fixed table X$KSMFSV along with their data types,
sizes, and memory addresses, as shown in
Example 6.1
. The names of these SGA
variables are cryptic, and seldom of use to know. However, senior Oracle staff can
obtain advanced diagnostic information by joining X$KSMFSV with
X$KSMMEM to monitor the values of these variables or to probe the data
structures that they point to. X$KSMMEM has one row for every memory
address in the SGA, and one non-key column which exposes the contents of the
memory locations.

Example 6.1. The Redo Allocation Latch as Seen from X$KSMFSV
SQL> select ksmfsnam, ksmfstyp, ksmfssiz, ksmfsadr
2> from x$ksmfsv where ksmfsnam = `kcrfal_';
KSMFSNAM KSMFSTYP KSMFSSIZ KSMFSADR
------------------- ----------------- ---------- --------
kcrfal_ ksllt 120 C3F4D13C
The size of each component of the fixed area of the SGA is fixed. That is, they are
not dependent on the setting of any initialization parameters, or anything else.
Thus the offset into the fixed SGA for each variable is fixed, as is the total size of
the fixed area itself.
6.1.1.2 The variable area
The variable area of the SGA is made up of the large pool and the shared pool. All
memory in the large pool is dynamically allocated, whereas the shared pool
contains both dynamically managed memory and permanent memory. The
SHARED_POOL_SIZE parameter actually specifies the approximate amount of
memory in the shared pool available for dynamic allocation, rather than the total
size of the shared pool itself.
The permanent shared pool memory contains a variety of data structures such as
the buffer headers, the process, session, and transaction arrays, the enqueue
resources and locks, the online rollback segment array, and various arrays for
recording statistics.
The sizes of most of these arrays are dependent on the settings of one or more
initialization parameters. These initialization parameters cannot be changed
without shutting down the instance, and so the sizes of the permanent memory
arrays are fixed for the life of each instance. For example, the size of the process
array is set by the PROCESSES parameter. If all the slots in this array are in use,
then any further attempts to create another process in the instance will fail,
because the array cannot be dynamically resized.
For many of the permanent memory arrays, there are X$ tables that export each
array element as a row, and certain of the structure members as columns. These
X$ tables are sometimes called fixed tables. There are also corresponding V$
views that expose the most useful columns of the X$ tables, but only for the rows
representing array slots that are currently in use. For example, the V$PROCESS
view is based on the X$KSUPR fixed table, which is in turn based on the process
array in memory. V$PROCESS does not include all the rows and columns in

X$KSUPR, and X$KSUPR does not expose all the members of the SGA process
structure.
Learning More About the X$ Tables
People often ask how they can learn more about the X$ tables. My first
answer is to say that there is not much of use in the X$ tables that is not
also visible in the V$ views. Most of the few useful scraps of information
that can be gleaned directly from the X$ tables, but not the V$ views,
can be readily obtained using scripts such as those referred to in this
book.
But, for those with the passion to know and the hours to burn, the APT
script fixed_table_columns.sql , which is based on V$FIXED_TABLES,
will give you a list of all the X$ tables, their columns, and their data
types. You can then use the APT script fixed_view_text.sql , which is
based on V$FIXED_VIEW_DEFINITION, to get the SQL statement text
for all the V$ view definitions. From this information it is easy to work
out which X$ tables and which X$ table columns are visible in a V$ view
and which are not. Then, working out what extra information the X$
tables contain is a matter of guesswork, trial, and probably some error.
Remember that the X$ tables change significantly from release to
release, so scripts should only be based on the X$ tables when it is really
necessary.
The size of the variable area of the SGA is equal to the LARGE_POOL_SIZE, plus
the SHARED_POOL_SIZE, plus the size of the permanent memory arrays. The
total size of the permanent memory arrays can, in theory, be calculated from the
settings of the initialization parameters. However, you need to know the formulae
used to derive the array sizes from the parameters, the size of each type of array
element in bytes, and the sizes of the array headers where applicable. These all
change from release to release, and there are also operating system dependent
differences. You also need to be aware that each permanent memory array is
aligned on a memory page boundary to optimize memory addressing, and so
some space is left unused. Fortunately, it is seldom necessary to calculate the
permanent memory size precisely. If you really need this information, you can
start up a test instance with a dummy SID and measure the permanent memory
size, without needing to mount a database.

6.1.1.3 The database block buffers
This area of the SGA buffers copies of the database blocks. The number of buffers
is specified by the DB_BLOCK_BUFFERS parameter, and the size of each buffer
is equal to the DB_BLOCK_SIZE for the database. This area of the SGA contains
only the buffers themselves, not their control structures. For each buffer there is
a corresponding buffer header in the variable area of the SGA. Similarly, the
working set headers, the hash chain headers, and their latches reside in the
variable area of the SGA. Therefore, you will notice that the size of the variable
area of the SGA will change by approximately 1K for every four buffers in the
database block buffers area of the SGA.
6.1.1.4 The log buffer
The size of the log buffer area of the SGA is based on the value specified by the
LOG_BUFFER parameter. However, the log buffer will be silently enlarged if an
attempt is made to set it to less than its minimum size. The minimum size is four
times the maximum database block size supported for the platform. On operating
systems that support memory protection, the log buffer is bracketed by two guard
pages (or, more correctly, memory protection units) to prevent corruption of the
log buffer by errant Oracle processes. Nevertheless, the log buffer area of the SGA
should be trivial by comparison with the size of the variable area and the
database block buffers. The log buffer is internally divided into blocks. For each
log buffer block, there is an 8-byte header in the variable area of the SGA.
6.1.1.5 The instance lock database
In parallel server configurations, instance locks are used to serialize access to
resources that are shared between instances. This area of the SGA maintains a
database of the resources in which this instance has an interest, the processes and
instances that may need those resources, and the locks currently held or
requested by those processes and instances. The sizes of these three arrays are set
by the LM_RESS, LM_PROCS, and LM_LOCKS parameters respectively. The
instance lock database also includes message buffers and other structures. This
area of memory is required even in single-instance Oracle. However, in this case
its size is trivial.
This area is not presently included by Oracle when reporting the composition and
size of the SGA at instance startup; however, it can be seen in dumps taken with
the ORADEBUG IPC command in svrmgrl.

6.1.1.6 Overhead
The last small area of the SGA is the shared memory overhead itself. This area
contains information about the shared memory segments in use, and the SGA
areas and sub-areas that they contain.
6.1.2 Shared Memory
The SGA resides in shared memory on most operating systems. To understand
shared memory segments, you need some understanding of memory segments
generally, and thus of virtual memory.
6.1.2.1 Virtual memory addressing
Today, virtual memory addressing is so prevalent that the alternative of direct
memory addressing is almost only a memory. If you once programmed for the
Z80 or 8086 CPUs, then you may remember direct memory addressing. You had
to know exactly which memory addresses were available to you, so that you did
not reference nonexistent memory or corrupt the BIOS. If you needed to write a
big program, bigger than the available memory or address space, then you had to
break it into sections that could be loaded or switched into memory as required.
In fact, the Oracle two-task architecture was initially adopted for this very reason.
Virtual memory addressing introduces a layer of abstraction between program
code and physical memory. All memory references are dynamically translated
from virtual memory addresses to physical memory addresses before each
instruction is executed. The operating system maintains data structures, called
page tables, to support virtual-to-physical memory address translation. The most
recently used page table entries are cached in each CPU to optimize address
translation. This cache is commonly called a translation lookaside buffer (TLB).
To further optimize address translation, TLB lookups are performed in hardware.
A TLB miss must be resolved by reference to the page tables in main memory.
This operation is also performed by hardware in some cases. If hardware address
translation fails, the CPU switches into a special execution context to ensure that
a physical memory page is allocated for the virtual page and refreshed from disk
if necessary. The page table entry is also copied into the TLB. Such hardware
address translation failures are called page faults. If a page has to be read from
disk, it is called a hard or major page fault—otherwise, it is a soft or minor page
fault. After a minor page fault has been resolved, the CPU switches back into user
mode and restarts the current instruction. However, while a major page fault is
being resolved, the CPU time may be used to service other processes.

Virtual memory addressing enables programs to run when not all of their
program code or data is currently in physical memory. This means that relatively
inactive virtual pages can be temporarily removed from physical memory if
necessary. If these pages have been modified, they must be saved to a temporary
storage area on disk, called a paging file or swap space. The operation of writing
one or a cluster of inactive memory pages to disk is called a page out, and the
corresponding operation of reading them in again later when one of the pages is
referenced is called a page in. Paging is the aspect of virtual memory
management that allows large programs to run. It is effective because programs
typically use only a small proportion of their virtual memory pages actively at any
one a time. The set of pages in active use by a process is called its working set.
Virtual memory addressing also enables programs to run from almost any
location in physical memory. This means that it is possible to have many
programs and their data in memory at the same time, and to switch between
them very quickly. CPU time is not wasted while a process performs disk I/O, or
waits for user input, or to resolve a page fault.
6.1.2.2 Memory access
Heavy paging activity can have a major impact on system performance, as is
discussed later in this chapter. But first, it's important to note that address
translation itself and memory access generally, apart from paging, also affect
system performance significantly. Main memory access is expensive in terms of
CPU cycles. Memory operates at much lower hardware clock speeds than CPUs
do, and there is also a recovery time component required after each memory
access before that memory bank can service another memory access by either the
same CPU or another one. This is why computer manufacturers put so much
effort into their CPU caching technology. Not only are page table entries cached
in the TLB, but portions of user memory (called cache lines) are cached in a
general cache as well. Sophisticated mechanisms are used to maintain
consistency between main memory and the CPU caches (called cache coherency
mechanisms). Cache lines are retained as long as possible to maximize cache hits,
with a distinction often being made between program code and data because of
their different locality properties. At the operating system level, scheduling
algorithms are biased towards scheduling processes to get a time slice on the CPU
on which they ran most recently. This is intended to minimize the probability of
hardware address translation failures and CPU cache misses, and thereby to
reduce main memory access.

Your control over memory access performance is limited to purchasing decisions.
If you are lucky enough to have a say in such matters, here are the guidelines:
1. Reduce the impact of cache coherency mechanisms by buying fewer, faster
CPUs.
2. Further reduce the risk of memory access contention between CPUs by buying
a large number of small memory boards.
3. Reduce the cost of memory access for each CPU by buying the fastest
available memory. However, if fast memory implies only a few large memory
boards, and if you expect to scale beyond six CPUs, then prefer slower
memory in more, smaller boards.
4. There are pitfalls associated with mixing different types of memory in the
same system. Avoid this, unless your hardware vendor assures you that it is
OK.
6.1.2.3 Process memory segments
One of the benefits of virtual memory addressing is that processes can use a large
virtual memory address space regardless of the physical memory available. This
enables process memory to be logically divided into distinct segments based on
usage. These segments may be mapped to non-contiguous virtual memory
addresses to allow for segment growth. Oracle uses the following segment types,
as do programs generally:
Program text
The text segment contains the executable machine code for the program
itself, excluding dynamically linked shared libraries. Text segments are
normally marked read-only, so that they can be shared between multiple
processes running the same program. For example, all Oracle processes
execute the same oracle binary, albeit with different personalities. Regardless
of how many processes are running in an instance, and regardless of how
many instances are running that release of Oracle on the same server, only
one copy of the program text is required in physical memory.
Initialized global data
This segment contains global data structures that are initialized by the
compiler, such as text strings for use in trace output. Initialized data can
theoretically be modified, and thus it is not shared between processes running
the same program. Oracle makes little use of this segment.
Uninitialized global data
The uninitialized data segment is normally called the BSS (Block Started by
Symbol) segment. This segment contains statically allocated global data
structures that are initialized at runtime by the process itself. Oracle makes
minimal use of the BSS segment.
Data heap

The heap is available to processes for the dynamic allocation of memory at
runtime using the malloc ( ) or sbrk ( ) system calls. Oracle uses the heap for
its PGA (process global area) which is discussed later in this chapter.
Execution stack
Whenever a function is called, the arguments and the return context are
pushed onto the execution stack. The return context is essentially a set of
CPU register values that describe the exact state of the process at the point of
the function call. When the function call completes, the stack is popped and
the context is resumed so that execution continues from the instruction
immediately following the function call. The stack also holds variables that are
local to a code block. Stack size is dependent on the depth of function call
nesting, or recursion, and the memory requirements of the arguments and
local variables. Oracle's stack space requirements are modest given its
complexity.
Shared libraries
Shared libraries are collections of position-independent executable code
implementing functions that may be required by a number of programs—in
particular, collections of system call functions. Shared library segments are
marked read-only and shared between all dependent processes, including
Oracle processes. No more than one copy of each shared library is required in
physical memory. Before a function in a shared library can be called, the
process must open the shared library file, and map it into its address space
using the mmap ( ) system call.
The alternative to using shared libraries is to include the required system call
functions in the program text segment itself. This is necessary on operating
systems that do not support shared libraries, or where the implementation is
problematic. On most operating systems, Oracle uses shared libraries for
system call functions but not for the Oracle server code itself. However, Java
class libraries are compiled and dynamically linked as shared libraries.
Shared memory segments
Shared memory allows associated processes to cooperatively read and write
common data structures in memory. Each process that needs to address a
shared memory segment must first attach that segment into its virtual
address space. This is normally done using the shmat ( ) system call. Oracle
uses shared memory segments for the SGA.
The location of these segments in the virtual address space of a process is
operating system specific. Some operating systems reserve certain virtual address
ranges for particular types of segments. Others allocate the text, data, and BSS
segments at the extremities of the virtual address space range, leaving a
contiguous unused address space range in between. The stack and heap are
allocated at the opposite ends of this range, and grow towards the center. Other
segments, such as shared memory segments, must be located between the stack
and heap at a location specified by the program itself.

On such operating systems, it is sometimes necessary to control the address at
which the SGA is attached, to prevent address range conflicts between the
segments. In some cases, this can be done with the
SHARED_MEMORY_ADDRESS and HI_SHARED_MEMORY_ADDRESS
parameters, but on other systems it is necessary to use genksms and modify the
attach address in the ksms.s file before relinking Oracle. Consult your Oracle
installation guide for details.
6.1.2.4 Intimate shared memory
Each segment in the virtual address space of a process requires page table entries
to support virtual-to-physical address translation. If two or more processes have
mapped a single memory segment into the same location in their virtual address
space, then they can theoretically share the same page table entries. This is called
intimate shared memory.
Intimate shared memory boosts Oracle performance in several ways. In
particular, it greatly increases the TLB hit rate for page table entries and thus
reduces main memory access and speeds up execution significantly. In instances
with large shared memory requirements and large numbers of processes, it also
results in a significant saving in page table memory—on the order of hundreds of
megabytes.
Under some operating systems intimate shared memory is used automatically for
Oracle because there is no alternative. In some cases, it is not available because
either the operating system or the hardware does not support it. However, in
other cases, it is dependent on the _USE_ISM parameter or the size of the shared
memory segments.
If _USE_ISM is set to TRUE (the default) on an operating system that supports
program-selectable intimate shared memory, then Oracle uses a flag to request
intimate shared memory from the operating system for its shared memory
segments. However, on some operating systems intimate shared memory is only
available for segments for which the page table is itself an exact number of pages
in size, and if so it is used automatically. For example, assuming a 32-bit address
space and a 4KB memory page size, one page in the page table can address 4MB
of memory. In this case shared memory segments must be an exact multiple of
4MB in size if intimate shared memory is to be used. This is always possible to
ensure by making small adjustments to the SHARED_POOL_SIZE,

DB_BLOCK_BUFFERS, and LOG_BUFFER parameters, and then checking the
sizes of the SGA segments using the ORADEBUG IPC command.
A further optimization to address translation is possible on operating systems
that allow some segments to use larger than normal memory page sizes. For
example, you may be able to use the chatr command to request a large page size
for the data or instruction segments for a particular executable. Using a large
page size reduces the number of page table entries required for each segment,
and thus improves the TLB hit rate for the segment, as well as reducing its load
on the TLB. Oracle has some built-in dependencies on its memory page size, so
check with Oracle Support as to whether it is safe to use a large page size for
Oracle on your platform, before attempting to do so.
6.1.2.5 SGA allocation
When an Oracle instance is started, the sizes of the main SGA areas are first
calculated based on the initialization parameters. These are the sizes shown by
Oracle when reporting the SGA size. However, before shared memory segments
are allocated, the size of each area is rounded up to a memory page boundary.
The areas are then divided into sub-areas, if necessary, so that no sub-area is
larger than the operating system limit on the size of a shared memory segment
(SHMMAX for System V shared memory under Unix). In the case of the variable
area, there is an operating system specific minimum sub-area size, and so the size
of the variable area is rounded up further to a multiple of the minimum sub-area
size.
Oracle will allocate a single shared memory segment for the entire SGA if
possible. However, if the SGA is larger than the operating system limit on the size
of a single shared memory segment, then Oracle will use a best fit algorithm to
group the sub-areas together into multiple shared memory segments no larger
than the maximum size.
Under Oracle7 the variable area of the SGA had to reside in contiguous memory.
Therefore, if the operating system did not allow Oracle to specify the virtual
memory address at which shared memory segments were to be attached, and
thereby to attach them contiguously, then the variable segment had to be small
enough to fit in a shared memory segment by itself. This constraint no longer
applies in Oracle8, because of the introduction of sub-areas.

It is commonly suggested that the operating system limit on the size of a single
shared memory segment should be raised in order to allow Oracle to allocate the
SGA in a single shared memory segment if possible. I follow this advice, but only
for reasons of manageability. The performance difference is negligible at instance
and process startup and is nil otherwise.
6.1.2.6 Paging
The operating system allocates physical memory pages for the SGA and Oracle
processes from its page pool. The page pool comprises all physical system
memory excluding that reserved for the operating system itself. A page is
allocated from the page pool's free list whenever a virtual memory page that is
not in physical memory is referenced. Pages are returned to the head of the free
list when memory is deallocated.
If the number of pages on the free list falls below a configurable threshold
(LOTSFREE in Unix System V based systems) then the operating system begins
to look for inactive pages to page out. Pages are regarded as inactive if they have
not been referenced for a certain amount of time. Inactive pages are moved to the
end of the free list, but if they have been modified then their contents must first
be saved to disk. Paging stops as soon as the number of free pages rises back
above the threshold.
If the number of pages on the free list continues to fall, then the operating system
steps up the pace of paging by regarding pages as inactive more quickly.
However, under extreme memory pressure it is possible for the majority of
physical memory to remain very active, so that the operating system searches in
vain for sufficient inactive pages. In this case, some low-priority processes will be
selected and deactivated entirely to ensure that inactive pages will be able to be
found. Although many aspects of this operating system paging behavior are
highly tunable, such tuning is seldom beneficial.
Heavy paging activity can have a disastrous effect on system performance.
However, high memory usage with intermittent light paging is of no concern.
Most systems have plenty of inactive memory that can be paged out with very
little performance impact. However, consistent light paging is of some concern
because some moderately active pages in the SGA will be paged out repeatedly.
Most operating systems provide a mechanism for Oracle to lock the SGA into
physical memory to prevent it from paging. If paging is consistent then the
LOCK_SGA parameter should be set to TRUE to prevent the SGA from paging.

On some operating systems, Oracle needs a special system privilege to be able to
use this facility.
How do you determine whether your operating system is paging and, if it is,
whether it's paging consistently or heavily? If you have plenty of free memory,
then your system will not page at all. If free memory seems scarce, then you can
monitor the number of pages paged out per second. This metric is available from
the Performance Monitor under NT, or from the vmstat command under Unix. If
this metric is constantly nonzero, then your system is paging consistently and the
SGA should be locked into physical memory if possible. This applies particularly
to operating systems with a paged file system buffer cache, such as NT and
Solaris.
Note, however, that the page out rate is not a good indication of the intensity of
paging activity on operating systems with a paged buffer cache. This is because
buffered file system writes are handled by the paging subsystem and thus
exaggerate the page out rate. A better indication of the intensity of paging activity
on such systems is the scan rate. The scan rate is the number of pages that the
operating system has searched per second while looking for inactive pages. The
scan rate is reported by vmstat on Unix systems under the
sr
column heading.
Paging may be regarded as light if the scan rate is below 10 pages per second.
If paging activity is moderate or heavy, then memory pressure must be reduced
either by reducing the demand for memory, or by buying more. In particular,
beware of oversizing the SGA and then locking it into memory.
6.2 The Shared Pool
The part of the SGA that is most commonly oversized is the shared pool. Many
DBAs have little understanding of what the shared pool is used for, and how to
determine whether it is correctly sized. So they just make it "BIG!" Sometimes
that is not big enough, but more often it is wasteful and can also impair
performance.
6.2.1 Chunks
To understand the shared pool better, you need to do little more than take a
careful look at X$KSMSP . Each row in this table represents a chunk of shared
pool memory.
Example 6.2
shows some sample rows.
Example 6.2. Sample Chunks in the Shared Pool

SQL> select ksmchcom, ksmchcls, ksmchsiz from x$ksmsp;
KSMCHCOM KSMCHCLS KSMCHSIZ
---------------- -------- ----------
KGL handles recr 496
PL/SQL MPCODE recr 1624
dictionary cach freeabl 4256
free memory free 1088
library cache freeabl 568
library cache recr 584
multiblock rea freeabl 2072
permanent memor perm 1677104
row cache lru recr 48
session param v freeabl 2936
sql area freeabl 2104
sql area recr 1208
...
When each shared pool chunk is allocated, the code passes a comment to the
function that is called to perform the allocation. These comments are visible in
the KSMCHCOM column of X$KSMSP, and describe the purpose for which the
memory has been allocated.
Each chunk is a little larger than the object it contains because there is a 16-byte
header to identify the type, class, and size of the chunk and to contain linked-list
pointers used for shared pool management.
There are four main classes of memory chunks. These can be seen in the
KSMCHCLS column of X$KSMSP.
free
Free chunks do not contain a valid object, and are available for allocation
without restriction.
recr
Recreatable chunks contain objects that may be able to be temporarily
removed from memory if necessary, and recreated again as required. For
example, many of the chunks associated with shared SQL statements are
recreatable.
freeabl
Freeable chunks contain objects that are normally needed for the duration of
a session or call, and are freed thereafter. However, they can sometimes be
freed earlier, either in whole or in part. Freeable chunks are not available for
temporary removal from memory, because they are not recreatable.
perm
Permanent memory chunks contain persistent objects. The large permanent
memory chunk may also contain internal free space, which can be released
into the shared pool as required.

The APT script called shared_pool_summary.sql shows a useful summary of the
type, class, and size of all chunks in the shared pool.
Example 6.3
is a sample of its
output. The total size of the chunks for each type of memory is also visible in the
shared pool rows of V$SGASTAT , except that some of the structures in the main
permanent memory chunk are also broken out and shown separately.
Example 6.3. Sample Output of shared_pool_summary.sql
SQL> @shared_pool_summary
KSMCHCOM CHUNKS RECR FREEABL TOTAL
---------------- ---------- ---------- ---------- ----------
KGFF heap 6 1296 2528 3824
KGK contexts 2 2400 2400
KGK heap 2 1136 1136
KGL handles 571 178616 178616
KQLS heap 404 87952 524888 612840
PL/SQL DIANA 274 42168 459504 501672
PL/SQL MPCODE 57 14560 88384 102944
PLS cca hp desc 1 168 168
PLS non-lib hp 1 2104 2104
character set m 5 23504 23504
dictionary cach 108 223872 223872
fixed allocatio 9 360 360
free memory 185 614088
kzull 1 48 48
library cache 1612 268312 356312 624624
multiblock rea 1 2072 2072
permanent memor 1 1677104
reserved stoppe 2 48
row cache lru 24 1168 1168
session param v 8 23488 23488
sql area 983 231080 1303792 1534872
table columns 19 18520 18520
table definiti 2 176 176
6.2.2 Free Lists
Free chunks in the shared pool are organized into free lists or buckets, based on
their size. The bucket numbers and free chunk sizes are as shown in
Table 6.1
.
Table 6.1. Free List Buckets and Chunks
Bucket Number
Free Chunk Sizes
0
Up to 79 bytes
1
80 bytes
to 143 bytes
2
144 bytes
to 271 bytes
3
272 bytes
to 527 bytes
4
528 bytes
to 1039 bytes

5
1040 bytes
to 2063 bytes
6
2064 bytes
to 4111 bytes
7
4112 bytes
to 8207 bytes
8
8208 bytes
to 16399 bytes
9
16400 bytes
to 32783 bytes
10
32784 bytes and larger
You may notice that the lower bound on the free chunk sizes for each free list is a
binary power plus the 16-byte header. The APT script shared_pool_free_lists.sql
uses this fact to be able to report the number of chunks and the amount of free
space on each free list.
Example 6.4
shows some interesting output.
Example 6.4. Sample Output of shared_pool_free_lists.sql
SQL> @shared_pool_free_lists
BUCKET FREE_SPACE FREE_CHUNKS AVERAGE_SIZE BIGGEST
---------- ---------- ----------- ------------ ----------
0 166344 3872 42 72
1 32208 374 86 96
4 928 1 928 928
6 11784 4 2946 3328
When a process needs a chunk of shared pool memory, it first scans the target
free list for the chunk of best fit. If a chunk of exactly the right size is not found,
then the scan continues to the end of that free list, looking for the next largest
available chunk. If the next largest available chunk is 24 or more bytes larger
than required, then that chunk is split and the remaining free space chunk is
added to the appropriate free list. If, however, the free list does not contain any
chunks of the required size, then the smallest chunk is taken from the next
nonempty free list. If all of the remaining free lists are empty, then an LRU chain
scan will be attempted, as explained in the next section.
Free list scans, management, and chunk allocations are all performed under the
protection of the shared pool latch. Clearly, if the shared pool contains a large
number of very small free chunks, as illustrated in
Example 6.4
, then the shared
pool latch will be held for a relatively long time when searching these particular
free lists. It is, in fact, normal to have a large number of very small free chunks
like this, and this is the major cause of contention for the shared pool latch. DBAs
often respond to shared pool latch contention by increasing the size of the shared
pool. Unfortunately, this merely delays the onset of shared pool latch contention,
and in the end exacerbates it.

6.2.3 LRU Lists
If a process fails to find a free memory chunk of the required size on the shared
pool free lists, then it will attempt to remove chunks containing recreatable
objects from the shared pool in order to free a large enough chunk.
There are two categories of recreatable chunks—those that are pinned, and those
that are not pinned. The concept of chunks in the shared pool being pinned is
often confused with the concept of marking the objects that they contain to be
kept using the DBMS_SHARED_POOL.KEEP procedure. Keeping applies only to
library cache objects, and is a DBA responsibility. However, all chunks are pinned
automatically while the objects that they contain are in use. Recreatable chunks
cannot be freed while they are pinned. However, unpinned recreatable chunks
can normally be freed.
Unpinned recreatable chunks are organized in the shared pool on two lists, each
of which is maintained in LRU (least recently used) order. These are called the
transient and recurrent LRU lists. Transient objects are unlikely to be required
again, whereas recurrent objects may be. The composition of these lists changes
rapidly. Chunks are added to the MRU (most recently used) ends whenever they
are unpinned, and they are removed from the lists whenever they are pinned
again.
Chunks are also removed from the LRU ends of the lists when a process needs to
free shared pool memory for a new allocation. Chunks are flushed in sets of eight
chunks alternately—first from the transient list, and then from the recurrent list.
Chunks are flushed in LRU order regardless of their size. However, some chunks
cannot be flushed. For example, chunks containing library cache objects that
have been marked for keeping with DBMS_SHARED_POOL.KEEP cannot be
flushed. These chunks are instead removed from the LRU lists by being pinned.
The length of the transient and recurrent LRU lists of unpinned recreatable
chunks can be seen in X$KGHLU , together with the number of chunks that have
been flushed, and the number of chunks that have been added to or removed
from the LRU lists due to pinning and unpinning. X$KGHLU also shows the
number of times that the LRU lists were flushed completely but unsuccessfully,
and the size of the most recent such request failure. All these statistics can be
checked with the APT script shared_pool_lru_stats.sql . See
Example 6.5
for
sample output.

Example 6.5. Sample Output of shared_pool_lru_stats.sql
SQL> @shared_pool_lru_stats
RECURRENT TRANSIENT FLUSHED PINS AND ORA-4031 LAST ERROR
CHUNKS CHUNKS CHUNKS RELEASES ERRORS SIZE
---------- ---------- ---------- ---------- ---------- -----------
121 164 148447 4126701 0 0
Beware how you interpret these figures, because they are only part of the story.
The lengths of the LRU lists and the rate of flushing are both heavily dependent
of the memory requirements of the application, and variations in its workload.
Neither long nor short LRU lists are necessarily a problem, and the flushing of
dead chunks is an important part of healthy memory management. However,
based on my experience, if the transient list is more than three times longer than
the recurrent list, then the shared pool is probably oversized, and if the ratio of
chunk flushes to other LRU operations is more than 1 in 20, then the shared pool
is probably too small.
6.2.4 Spare Free Memory
If a large memory request cannot be satisfied either directly from the free lists or
from the LRU lists by flushing, then Oracle has one more strategy to try.
Surprisingly, the last resort is not to coalesce contiguous free chunks. When
chunks are freed, they may be coalesced with the following chunk, if that chunk is
also free. However, Oracle only fully coalesces shared pool free space when the
ALTER SYSTEM FLUSH SHARED_POOL command is executed explicitly. So
memory allocation requests can and do fail even when the shared pool contains
enough contiguous free memory. If that free memory is fragmented into multiple
small chunks, then it cannot be used to satisfy large memory allocation requests.
Rather, Oracle's last resort for satisfying large memory allocation requests is to
release more memory into the shared pool. Oracle actually keeps aside about half
the shared pool memory at instance startup. This memory is then released
gradually under memory pressure. Oracle does this to limit fragmentation.
Oracle's spare free memory is concealed in the main permanent memory chunk
in the shared pool, together with the fixed tables and other genuine permanent
memory structures. This memory is not on the shared pool free lists, and is
therefore not available for immediate allocation. It is, however, included in the
free memory statistic shown in V$SGASTAT .

Chunks of spare free memory are released into the shared pool when necessary.
An ORA-4031 error, "unable to allocate x bytes of shared memory," will not be
raised for the shared pool until all of this spare free memory has been exhausted.
If an instance still has a fair amount of spare free memory after it has been
working at peak load for some time, then that is an indication that the shared
pool is considerably larger than necessary. The amount of spare free memory
remaining can be checked with the APT script shared_pool_spare_free.sql .
6.2.5 The Reserved List
Since the introduction of paged PL/SQL code in release 7.3, the vast majority of
shared pool memory chunks are less than 5000 bytes in size. So much so, that in
a mature instance it would be almost futile to search the shared pool free lists and
LRU lists for chunks of that size or greater. So, Oracle does not.
Instead, Oracle reserves part of the shared pool for large chunks. The size of this
reserved area defaults to 5% of the shared pool, and may be adjusted using the
SHARED_POOL_RESERVED_SIZE parameter. As the parameter name
indicates, this memory is taken out of the shared pool. The informal term, the
reserved pool, should be thought of as a contraction for a longer term, the
reserved part of the shared pool. There is just one shared pool, part of which is
reserved for large chunks.
Chunks larger than 5000 bytes are placed into the reserved part of the shared
pool. This threshold
can be set with the
_SHARED_POOL_RESERVED_MIN_ALLOC parameter but should not be
changed. Small chunks never go into the reserved pool, and large chunks never
go into the rest of the shared pool, except during instance startup.
Free memory in the reserved part of the shared pool is not included on the
general shared pool free lists. Instead, a separate reserved free list is maintained.
The reserved pool does not, however, have its own LRU lists for unpinned
recreatable chunks. Nevertheless, large chunks are not flushed when freeing
memory for the general free lists, and small chunks are not flushed when freeing
memory for the reserved free list.
Reserved pool statistics are visible in the V$SHARED_POOL_RESERVED view.
In particular, the REQUEST_MISSES column shows the number of times that
requests for a large chunk of memory were not able to be satisfied immediately

from the reserved free list. This metric should be zero. That is, there should be
enough free memory in the reserved part of the shared pool to satisfy short-term
demands for freeable memory, without needing to flush unpinned recreatable
chunks that would otherwise be cached for the long term.
You can configure your monitoring software to watch the USED_SPACE column
of V$SHARED_POOL_RESERVED in an attempt to determine whether the size
of the reserved part of the shared pool is appropriate. Alternatively, you can use
the APT script reserved_pool_hwm.sql to obtain a high-water mark for reserved
shared pool usage since instance startup. This script relies upon the fact that, in
the absence of reserved list request misses, the first chunk of the reserved list has
never been used, and all other chunks have been.
Example 6.6
shows some sample
output. In many cases you will find that the reserved pool is scarcely used, if at
all, and that the default reservation of 5% of the shared pool for large chunks is
unduly wasteful. I recommend that you run this script routinely prior to
shutdown, and also check the maximum utilization of other resources as shown
in V$RESOURCE_LIMIT.
Example 6.6. Sample Output of reserved_pool_hwm.sql
SQL> @reserved_pool_hwm
RESERVED_SIZE HIGH_WATER_MARK USAGE
------------- --------------- -------
256000 15080 6%
6.2.6 Marking Objects for Keeping
In a well-sized shared pool, dead chunks will be flushed out. However, any
flushing introduces a risk that valuable objects will be flushed out as well. This
applies particularly to recreatable objects that are used only intermittently, but
are expensive to recreate, because they are large or require complex processing.
You may also not want cached sequences to be flushed out, because this results in
the remaining cached sequence numbers never being used.
Of course, the way to mitigate this risk is to mark known valuable objects for
keeping in the shared pool using DBMS_SHARED_POOL.KEEP . This procedure
loads the object and all subordinate objects into the library cache immediately,
and marks them all for keeping. So far as possible, this should be done directly
after instance startup to minimize shared pool fragmentation.
It is sometimes mistakenly claimed that large objects such as packages do not
have to be marked for keeping, because they will be placed in the reserved part of

the shared pool and thus be much less likely to be flushed out. However, most
large objects are actually loaded into the shared pool in multiple small chunks,
and therefore get no special protection by virtue of their size.
It is also unwise to rely on a high frequency of use to prevent objects from being
aged out of the shared pool. If your shared pool is well sized, the LRU lists will be
fairly short during periods of peak load, and unpinned objects will age out very
quickly, unless they are marked for keeping.
If you don't already have your own scripts to do the job, take a look at APT; it
includes a set of scripts that you can use for keeping. The keep_sys_packages.sql
script keeps some key packages in the SYS schema. You will need to customize
this script to include any other SYS packages that may be required by your
application. The keep_cached_sequences.sql script can be used to mark all
cached sequences in the database for keeping. And the keep_schema.sql script
can be used to mark all candidate objects in your key application schemata for
keeping.
Keeping should also be used to protect repeatedly executed cursors, once again,
regardless of their size. The APT script keep_cursors.sql marks all cursors that
have been executed five or more times for keeping.
For completeness, I should also mention that the X$KSMLRU fixed table can also
be used to help you identify additional library cache objects that should be kept.
X$KSMLRU records statistics about up to ten shared pool chunk allocations that
have required flushes. Not all chunk allocations are captured, however. In fact,
only the largest candidate allocation is guaranteed to be captured. Another, most
unusual aspect of this fixed table is that it is cleared entirely whenever it is
queried, so it should not be queried casually.
6.2.7 Flushing the Shared Pool
The only way to coalesce contiguous free chunks in the shared pool is to explicitly
flush the shared pool using the ALTER SYSTEM FLUSH SHARED_POOL
command. The question of whether you should, or should not do so, tends to
divide DBAs.
In practice, flushing the shared pool can relieve shared pool latch contention and
greatly reduce the risk of ORA-4031 errors, with much less immediate impact on
performance than is commonly believed, particularly if key objects have been

marked for keeping. On the other hand, if all key objects have been marked for
keeping, and if your shared pool is not oversized, then you should scarcely need
to flush the shared pool, unless your instance has very demanding, long-term
uptime requirements.
My personal preference is to flush the shared pool nightly (after backups) and at
other times if shared pool free space is becoming too scarce or too fragmented.
However, you may need to ensure that flushing the shared pool does not leave
unwanted gaps in cached sequences. This can be done either by marking the
sequences for keeping, or, in single-instance Oracle, by temporarily unloading the
sequences using the ALTER SEQUENCE NOCACHE command. There are APT
scripts to do both. The first has already been mentioned, and the second is called
nice_shared_pool_flush.sql . The two methods work rather well together.
Unloading the sequences does not affect their kept status, but protects them even
if they were not kept. Also, using nice_shared_pool_flush.sql before instance
shutdown prevents sequence number loss even if a SHUTDOWN ABORT is
necessary.
6.2.8 Heaps and Subheaps
You may have noticed that the names of the X$ tables for the shared pool begin
with either KSM or KGH. These are the names for the Oracle memory manager
and heap manager modules, respectively. These two modules work together in
very close cooperation. The memory manager is responsible for interfacing with
the operating system to obtain memory for use by Oracle, and for static
allocations of memory. Dynamic memory management is performed by the heap
manager. This is why the shared pool is also called the SGA heap.
A heap consists of a heap descriptor and one or more memory extents. A heap
can also contain subheaps. In this case, the heap descriptor and extents of the
subheap are seen as chunks in the parent heap. Heap descriptors vary in size
depending on the type of heap and contain list headers for the heap's free lists
and LRU lists. An extent has a small header for pointers to the previous and next
extents, and the rest of its memory is available to the heap for dynamic allocation.
Except for the reserved list feature, subheaps within the shared pool have exactly
the same structure as the shared pool itself. Memory is allocated in chunks. Free
chunks are organized on free lists according to size. And unpinned recreatable
chunks are maintained on two LRU lists for recurrent and transient chunks,
respectively. Subheaps even have a main permanent memory chunk that may

contain spare free memory. Subheaps may also contain further subheaps, up to a
nesting depth of four.
The concept of subheaps is important to understand because most of the objects
that are cached in the shared pool actually reside in subheaps, rather than in the
top-level heap itself. Finding space for a new chunk within a subheap is much like
finding space for a new chunk within the shared pool itself, except that subheaps
can grow by allocating a new extent, whereas the shared pool has a fixed number
of extents. The allocation of new extents for subheaps is governed by a minimum
extent size, so it is possible to search for a small chunk in a subheap and fail,
because none of the parent heaps could allocate a chunk of the required
minimum extent sizes.
6.2.9 The Large Pool
If the LARGE_POOL_SIZE parameter is set, then the large pool is configured as
a separate heap within the variable area of the SGA. The large pool is not part of
the shared pool, and is protected by the large memory latch . The large pool only
contains free and freeable chunks. It does not contain any recreatable chunks,
and so the heap manager's LRU mechanism is not used.
To prevent fragmentation of the large pool, all large pool chunks are rounded up
to _LARGE_POOL_MIN_ALLOC, which defaults to 16K. This parameter should
not be tuned. It does not affect whether or not certain chunks will be allocated in
the large pool. Rather, if a large pool is configured, chunks are allocated explicitly
in the large pool based on their usage, and rounded up to the required size if
necessary.
It is recommended that you configure a large pool if you use any of the following
Oracle features:
??
Multi-Threaded Server (MTS ) or Oracle*XA
??
Recovery Manager (RMAN )
??
Parallel Query Option (PQO)
6.3 Process Memory
In addition to the SGA, or System Global Area, each Oracle process uses three
similar global areas as well:
??
The Process Global Area (PGA)

??
The User Global Area (UGA)
??
The Call Global Area (CGA)
Many DBAs are unclear about the distinction between the PGA and the UGA. The
distinction is as simple as that between a process and a session. Although there is
commonly a one-to-one relationship between processes and sessions, it can be
more complex than that. The most obvious case is a Multi-Threaded Server
configuration, in which there can be many more sessions than processes. In such
configurations there is one PGA for each process, and one UGA for each session.
The PGA contains information that is independent of the session that the process
may be serving at any one time, whereas the UGA contains information that is
specific to a particular session.
6.3.1 The PGA
The Process Global Area, often known as the Program Global Area, resides in
process private memory, rather than in shared memory. It is a global area in the
sense that it contains global variables and data structures that must be accessible
to all modules of the Oracle server code. However, it is not shared between
processes. Each Oracle server process has its own PGA, which contains only
process-specific information. Structures in the PGA do not need to be protected
by latches because no other process can access them.
The PGA contains information about the operating system resources that the
process is using, and some information about the state of the process. However,
information about shared Oracle resources that the process is using resides in the
SGA. This is necessary so those resources can be cleaned up and freed in the
event of the unexpected death of the process.
The PGA consists of two component areas, the fixed PGA and the variable PGA,
or PGA heap. The fixed PGA serves a similar purpose to the fixed SGA. It is fixed
in size, and contains several hundred atomic variables, small data structures, and
pointers into the variable PGA.
The variable PGA is a heap. Its chunks are visible to the process in X$KSMPP ,
which has the same structure as X$KSMSP. The PGA heap contains permanent
memory for a number of fixed tables, which are dependent on certain parameter
settings. These include DB_FILES, LOG_FILES (prior to release 8.1), and
CONTROL_FILES. Beyond that, the PGA heap is almost entirely dedicated to its
subheaps, mainly the UGA (if applicable) and the CGA.

6.3.2 The UGA
The User Global Area contains information that is specific to a particular session,
including:
??
The persistent and runtime areas for open cursors
??
State information for packages, in particular package variables
??
Java session state
??
The roles that are enabled
??
Any trace events that are enabled
??
The NLS parameters that are in effect
??
Any database links that are open
??
The session's mandatory access control (MAC) label for Trusted Oracle
Like the PGA, the UGA also consists of two component areas, the fixed UGA and
the variable UGA, or UGA heap. The fixed UGA contains about 70 atomic
variables, small data structures, and pointers into the UGA heap.
The chunks in the UGA heap are visible to its session in X$KSMUP , which has
the same structure as X$KSMSP. The UGA heap contains permanent memory for
a number of fixed tables, which are dependent on certain parameter settings.
These include OPEN_CURSORS, OPEN_LINKS, and MAX_ENABLED_ROLES.
Beyond that, the UGA heap is largely dedicated to private SQL and PL/SQL areas.
The location of the UGA in memory depends on the session configuration. In
dedicated server connections where there is a permanent one-to-one relationship
between a session and a process, the UGA is located within the PGA. The fixed
UGA is a chunk within the PGA, and the UGA heap is a subheap of the PGA. In
Multi-Threaded Server and XA connections, the fixed UGA is a chunk within the
shared pool, and the UGA heap is a subheap of the large pool or, failing that, the
shared pool.
In configurations in which the UGA is located in the SGA, it may be prudent to
constrain the amount of SGA memory that each user's UGA can consume. This
can be done using the PRIVATE_SGA profile resource limit .
6.3.3 The CGA
Unlike the other global areas, the Call Global Area is transient. It only exists for
the duration of a call. A CGA is required for most low-level calls to the instance,
including calls to:

??
Parse an SQL statement
??
Execute an SQL statement
??
Fetch the outputs of a SELECT statement
A separate CGA is required for recursive calls. Recursive calls to query data
dictionary information may be required during statement parsing, to check the
semantics of a statement, and during statement optimization to evaluate
alternative execution plans. Recursive calls are also needed during the execution
of PL/SQL blocks to process the component SQL statements, and during DML
statement execution to process trigger execution.
The CGA is a subheap of the PGA, regardless of whether the UGA is located in the
PGA or SGA. An important corollary of this fact is that sessions are bound to a
process for the duration of any call. This is particularly important to understand
when developing applications for Oracle's Multi-Threaded Server. If some calls
are protracted, the number of processes configured must be increased to
compensate for that.
Of course, calls do not work exclusively with data structures in their CGA. In fact,
the most important data structures involved in calls are typically in the UGA. For
example, private SQL and PL/SQL areas and sort areas must be in the UGA
because they must persist between calls. The CGA only contains data structures
that can be freed at the end of the call. For example, the CGA contains direct I/O
buffers, information about recursive calls, stack space for expression evaluation,
and other temporary data structures.
Java call memory is also allocated in the CGA. This memory is managed more
intensively than any other Oracle memory region. It is divided into three spaces,
the stack space, the new space, and the old space. Chunks within the new space
and old space that are no longer referenced are garbage collected during call
execution with varying frequency based on their length of tenure and size. New
space chunks are copied to the old space once they have survived a certain
number of new space garbage collection iterations. This is the only garbage
collection in Oracle's memory management. All other Oracle memory
management relies on the explicit freeing of dead chunks.
6.3.4 Process Memory Allocation
Unlike the SGA, which is fixed in size at instance startup, the PGA can and does
grow. It grows by using the malloc ( ) or sbrk ( ) system calls to extend the heap
data segment for the process. The new operating system virtual memory is then

added to the PGA heap as a new extent. These extents are normally only a few
kilobytes in size, and Oracle may well allocate thousands of them if necessary.
There are, however, operating system limits on the growth of the heap data
segment of a process. In most cases the default limit is set by an operating system
kernel parameter (commonly MAXDSIZ). In some cases that default can be
changed on a per-process basis. There is also a system-wide limit on the total
virtual memory size of all processes. That limit is related to the amount of swap
space
[1]
available. If either of these limits is exceeded, then the Oracle process
concerned will return an ORA-4030 error.
[1]
Please read paging file space for swap space in this discussion, if that is the correct term on
your operating system.
This error is only rarely due to the per-process resource limit, and normally
indicates a shortage of swap space. To diagnose the problem, you can use the
operating system facility to report swap space usage. Alternatively, on some
operating systems Oracle includes a small utility called maxmem which can be
used to check the maximum heap data segment size that a process can allocate,
and which limit is being hit first.
If the problem is a shortage of swap space, and if paging activity is moderate or
heavy, then you should attempt to reduce the system-wide virtual memory usage
either by reducing the process count or by reducing the per-process memory
usage. Otherwise, if paging activity is light or nil, you should increase the swap
space or, preferably, if your operating system supports it, you should enable the
use of virtual or pseudo swap space.
This operating system facility allows system-wide total virtual memory to exceed
swap space by approximately the amount of physical memory that is not locked.
Some system administrators are unreasonably opposed to the use of this feature
in the mistaken belief that it causes paging to memory. It does not. It does,
however, significantly reduce the amount of swap space required on large
memory systems. Incidentally, the truism that swap space should exceed physical
memory by a factor of at least two is not true. It depends on the operating system,
memory size, and memory usage, but many systems need virtually no swap space
at all.
6.3.5 Process Memory Deallocation

Oracle heaps grow much more readily than they shrink, but contrary to popular
belief they can and do shrink. The session statistics session uga memory and
session pga memory visible in V$MYSTAT and V$SESSTAT show the current
size of the UGA and PGA heaps respectively, including internal free space. The
corresponding statistics session uga memory max and session pga memory max
show the peak size of the respective heaps during the life of the session.
The UGA and PGA heaps only shrink after certain operations, such as the merge
phase of a disk sort, or when the user explicitly attempts to free memory using
the DBMS_SESSION.FREE_UNUSED_USER_MEMORY procedure. However,
only entirely free heap extents are released to the parent heap or to the process
data heap segment. So some internal free space remains, even after memory has
been explicitly freed.
Although it is technically possible to do so, on most operating systems Oracle
does not attempt to reduce the size of the process data heap segment and release
that virtual memory back to the operating system. So from an operating system
point of view, the virtual memory size of an Oracle process remains at its high-
water mark. Oracle relies on the operating system to page out any unused virtual
pages if necessary. For this reason, operating system statistics about the virtual
memory sizes of Oracle processes should be regarded as misleading. The internal
Oracle statistics should be used instead, and even these tend to overstate the true
memory requirements.
The DBMS_SESSION.FREE_UNUSED_USER_MEMORY procedure need only
be used in Multi-Threaded Server applications. It should be used sparingly and
only to release the memory used by large package array variables back to the
large pool or shared pool. However, that memory must first be freed within the
UGA heap, either by assigning an empty array to the array variable, or by calling
the DBMS_SESSION.RESET_PACKAGE procedure.
Please disregard the comments in the DBMS_SESSION package specification to
the effect that memory, once used for a purpose, can only ever be reused for the
same purpose, and that it is necessary to free unused user memory after a large
sort. What is intended is that memory, once allocated to a subheap, is normally
only available within that subheap, until the entire subheap has been freed.
However, many subheaps, such as the CGA, are freed so quickly that the
statement is, at best, misleading. Moreover, it is not normally necessary to free
unused user memory after a sort, not even in Multi-Threaded Server applications,
because the majority of sort memory is, in fact, freed automatically.

Taking Heapdumps
Oracle Support may sometimes ask you to take heapdumps to help to diagnose a
potential memory problem. Heapdumps may be taken in the current process
using the ALTER SESSION SET EVENTS command, or in another session using
the ORADEBUG EVENT command. Heapdumps are written to a trace file in the
process's dump destination directory, and contain largely the same information
as the corresponding X$ tables.
The event syntax for heapdumps of the primary heaps is IMMEDIATE TRACE
NAME HEAPDUMP LEVEL n. The level number is a bit pattern representing
which heaps should be dumped: 1 for the PGA, 2 for the SGA, 4 for the UGA, 8
for the CGA, and 32 for the large pool.
The event syntax for heapdumps of arbitrary subheaps is IMMEDIATE TRACE
NAME HEAPDUMP_ADDR LEVEL n, where n is the decimal equivalent of the
hexadecimal address of the heap descriptor. Subheap heap descriptor addresses
are visible in the KSMCHPAR column of the KSM X$ tables, and in heapdumps
of their parent heaps alongside the
ds=
string.
6.4 Reference
This section contains a quick reference to the parameters, events, statistics, and
APT scripts mentioned in Chapter 6.
6.4.1 Parameters
Parameter
Description
_LARGE_POOL_
MIN_ALLOC
Large pool chunk allocations are rounded up to this size. This parameter
defaults to 16K, and should not be changed.
_USE_ISM
Intimate shared memory is used by default where possible. However,
the implementation is problematic on some operating systems, and so it
is sometimes necessary to set this parameter to FALSE.
DB_BLOCK_BUF
FERSDB_BLOCK
_SIZE
The product of these two parameters dictates the size of the SGA area
for the database block buffers.
DB_FILESLOG_F
ILES (prior to
8.1)CONTROL_FI
LES
These parameters affect the size of the fixed PGA. They should not be
any larger than reasonably necessary.

LARGE_POOL_SI
ZE
Certain demands for large chunks of memory are satisfied from the
large pool, if a large pool has been configured. This parameter sets the
size of the large pool in bytes.
LOCK_SGA
If operating system paging is consistent, this parameter should be set to
TRUE, to prevent the SGA from paging.
LOG_BUFFER
Although the log buffer has a separate area in the SGA, it should
nevertheless be trivial in size.
OPEN_CURSORS
OPEN_LINKSMA
X_ENABLED_RO
LES
These parameters affect the size of the fixed UGA. They should not be
any larger than necessary.
PRE_PAGE_SGA
If set to TRUE, this causes all Oracle server processes to page in the
entire SGA on process startup if necessary. This may yield a marginal
improvement in performance during the period shortly after instance
startup, but only at the considerable cost of slowing down all process
startups.
SESSIONS
This is the parameter that has the greatest effect on the total size of the
fixed tables in the permanent memory chunk of the shared pool.
SHARED_MEMOR
Y_ADDRESSHI_
SHARED_MEMOR
Y_ADDRESS
On some platforms, these parameters may be used to specify the virtual
memory address at which the SGA should be attached.
SHARED_POOL_
RESERVED_SIZE
Shared pool chunk allocations larger than 5000 bytes are satisfied from
the shared pool reserved list. This parameter sets the size of the
reserved list in bytes. The threshold size for reserved list allocation,
which is set by the _SHARED_POOL_RESERVED_MIN_ALLOC parameter,
should not be changed.
SHARED_POOL_
SIZE
This parameter sets the approximate amount of memory in the shared
pool available for dynamic allocation, expressed in bytes.
SORT_AREA_SIZ
E
This parameter can have a big impact on memory usage and
performance.
6.4.2 Events
Event
Description
4030
This is the out of process memory error event. To take PGA, UGA, and CGA
heapdumps at the exact time of this error, set the following event in your
parameter file:
event = "4030 trace name heapdump level 13"
4031 This is the out of shared memory error event. If you are struggling with repeated

ORA-4031 errors, you may wish to take an SGA heapdump at the exact time of the
error by setting the following event in your parameter file:
event = "4031 trace name heapdump level 2"
In Multi-Threaded Server environments, you may wish to use level 6 instead, to
include a UGA heapdump as well.
10235
This event causes the Oracle server code to continually check the integrity of the
memory and heap management data structures. This is sometimes necessary to
diagnose suspected memory corruption issues. Unfortunately, this event can only
be set instance-wide. It cannot be set on a single process.
Only set this event under direction from Oracle Support, and then only as a last
resort. Even the minimal checking at level 1 has a severe impact on performance.
6.4.3 Statistics
Statistic
Source
Description
free
memory
V$SGASTAT
Free memory in the SGA heap. This includes chunks on the free
lists and spare free memory in the permanent memory chunk,
but does not include unpinned recreatable chunks.
session
uga
memory
V$MYSTAT
and
V$SESSTAT
The current size of the UGA heap for the session, excluding the
fixed UGA.
session
uga
memory
max
V$MYSTAT
and
V$SESSTAT
The UGA heap size high-water mark.
session
pga
memory
V$MYSTAT
and
V$SESSTAT
The current size of the PGA heap for the session, excluding the
fixed PGA.
session
pga
memory
max
V$MYSTAT
and
V$SESSTAT
The PGA heap size high-water mark.
6.4.4 APT Scripts
Script
Description
fixed_table_columns.sql
Gets a description of all the X$ tables.
fixed_view_text.sql
Extracts the SQL statement text for all the V$ views.
keep_cached_sequences.sql Marks all cached sequences for keeping in the shared pool.
keep_cursors.sql
Marks cursors that have been executed five or more times for
keeping in the shared pool.

keep_schema.sql
Marks all candidate objects in an application schema for
keeping in the shared pool.
keep_sys_packages.sql
Marks some key packages in the SYS schema for keeping.
nice_shared_pool_flush.sql
Flushes the shared pool, but unloads all cached sequences
first, to prevent gaps lest they were not kept.
reserved_pool_hwm.sql
Shows the high-water mark usage of the reserved pool. This
can be used to check whether the reserved pool is too large.
shared_pool_free_lists.sql Shows the composition of the shared pool free lists.
shared_pool_lru_stats.sql
Shows key statistics for the shared pool LRU lists.
shared_pool_spare_free.sql Shows how spare free memory remains in the shared pool.
shared_pool_summary.sql
Shows a summary of the shared pool by chunk usage, class,
and size.

Colophon
Our look is the result of reader comments, our own experimentation, and
feedback from distribution channels. Distinctive covers complement our
distinctive approach to technical topics, breathing personality and life into
potentially dry subjects.
The animal on the cover of Oracle 8i Internal Services is a bumblebee. Only three
types of bees are social insects: bumblebees, honeybees, and tropical stingless
bees. There are approximately 200 species of bumblebee, most of which reside in
temperate zones, where their thick layer of hair protects them from cool
temperatures. In early spring the queen bee emerges from underground
hibernation and searches for a nesting site, often in a deserted rodent nest. She
then makes a honey pot of secreted wax, and a cell into which she places pollen
and lays the first of her eggs. When these eggs hatch, the larvae grow into small
worker bees. Later broods of eggs grow into bigger bees, as the queen now has
help gathering food for the larvae. Toward the end of the breeding season, males
and young queens are produced. By late autumn, the entire colony has died, with
the exception of the young queens, who scatter to find places to hibernate until
the following spring, when they will begin their own colonies.
The disproportionate appearance of bumblebees is deceptive. Despite their large,
apparently clumsy bodies and delicate wings, they move swiftly and efficiently,
pollinating flowers as they go. Bumblebees play an important role in pollinating
flowers such as the red clover, in which the nectar is too deep down for most bees
to reach. This is because the bumblebee's tongue is, on average, 2.5 mm longer
than other that of other bees. In New Zealand, English settlers discovered that
the red clover that they transported and planted did not thrive until they
imported bumblebees to aid with pollination.
Colleen Gorman was the production editor and proofreader for Oracle 8i
Internal Services; Nicole Gipson Arigo and Jeff Holcomb provided quality
control. Mike Sierra provided FrameMaker technical support. Steve Adams wrote
the index.
Ellie Volkenhausen designed the cover of this book, using an original drawing by
Lorrie LeJeune. Kathleen Wilson produced the cover layout using QuarkXPress
3.3 and the ITC Garamond font.

Alicia Cech designed the interior layout based on a series design by Nancy Priest.
It was implemented in FrameMaker 5.5 by Mike Sierra. The text and heading
fonts are ITC Garamond Light and Garamond Book. The illustrations that appear
in the book were produced by Robert Romano and Rhon Porter using
Macromedia FreeHand 8 and Adobe Photoshop 5. This colophon was written by
Clairemarie Fisher O'Leary.
Wyszukiwarka
Podobne podstrony:
Oracle 8i a internet IGA2QB7WKB Nieznany
Administracja bazą danych Oracle 8i Magic 8i
oracle 8i r2 w praktyce U4RM7NCFT2WAWDBWLS5WWFNXL5X7RIUOCNU57MQ
cobra technologia stawiajaca i przy oracle 8i jak ja oki g772blqdb6o7hep3jpzid3wnluyl6vs63xovy5i G
O'Reilly Oracle PL SQL Best Practices
O Reilly Oracle Language Pocket Reference
O Reilly Oracle PL SQL Built ins Pocket Reference
Administracja bazą danych Oracle 8i Magic 8i
helion%2c+o%27reilly+ +optymalizacja+oracle+sql+ +leksykon+kieszonkowy 5VYAOTMKBEMJVIKMQWPLPR26MA5UX
What is typical for call centre jobs Job characteristics, and service interactions in different call
EFEKTY GLOWNE I INTERAKCJE PREZENTACJA
Prezentacja firmy MARSTATE SERVICE BHP PPOZ PPT
Techniki wywierania wplywu oparte na dynamice interakcji
II wyklad Interakcje i rodzaje wiedzy
05 DFC 4 1 Sequence and Interation of Key QMS Processes Rev 3 1 03
więcej podobnych podstron