
reviews
research focus
1085
DDT Vol. 8, No. 23 December 2003
www.drugdiscoverytoday.com
1359-6446/03/$ – see front matter ©2003 Elsevier Science Ltd. All rights reserved. PII: S1359-6446(03)02833-2
Within pharmaceutical companies, there is
increased pressure to use chemical compounds
economically and to employ lower amounts
of expensive bioreagents. To meet these new
demands, HTS groups worldwide have made
attempts to dramatically reduce the sample
volume in drug screening assays. This minia-
turization faces two major challenges: han-
dling of minute volumes and the sensitivity
of the typically optical detection. Optimization
of liquid handling tools has preceded devel-
opments in detection: several sub-microliter
pipetting and dispensing devices have been
established in HTS routine use. However, all
macroscopic fluorescence methods face the
problem of increasing background with de-
creasing assay volumes. By contrast, the femto-
liter-sized confocal observation volume enables
miniaturization without loss of data quality [1].
Confocal optics
For the optical detection of fluorescence emis-
sion from individual molecules, unwanted
background must be rigorously minimized.
Most importantly, the volume from which
light is collected has to be made as small as
possible because background from solvent
Rayleigh and Raman scattering as well as from
fluorescent impurities cannot be completely
suppressed. Confocal optics [2] typically em-
ploy a high numerical aperture objective lens
to focus the excitation laser light. The restric-
tion to fluorescence emission from the confo-
cal volume is achieved by guiding the emitted
light through a pinhole (Figure 1a). To obtain
high fluorescence sensitivity, low noise detec-
tors, such as avalanche photodiodes, are em-
ployed. Using the confocal detection principle,
femtoliter-sized sample volumes that enable
single-molecule studies can be analyzed.
Fluorescence studies at the single-molecule
level can be performed on localized individual
biomolecules, for example, while attached to
surfaces. In an alternative approach, however,
the emission from an open confocal volume,
through which the biomolecules diffuse, can be
monitored. Sample preparation is much sim-
pler in this case, as samples are simply dilute,
typically nanomolar, solutions of the molecules
being studied. This technique is, therefore, pre-
ferred in biochemical drug screening assays, as
described later. Alternatively, the confocal sam-
ple volume can be scanned through living cells
for the study of fluorescent biomolecules in
their native environments.
Fluorescence fluctuation spectroscopy
techniques used in biochemical drug
discovery
The fluorescence signal from a few molecules
inside a small volume shows temporal intensity
Confocal optics microscopy for
biochemical and cellular
high-throughput screening
Lenka Zemanová, Andreas Schenk, Martin J. Valler, G. Ulrich Nienhaus
and Ralf Heilker
Lenka Zemanová
Andreas Schenk
Martin J. Valler
G. Ulrich Nienhaus
Ralf Heilker*
Boehringer Ingelheim Pharma
GmbH & Co.KG
Department of Integrated
Lead Discovery
Birkendorfer Strasse 65
D-88397 Biberach an der Riss
Germany
*e-mail: Ralf.Heilker@
bc.boehringer-ingelheim.com
In recent years, both academia and pharmaceutical industry have
produced significant advances in confocal detection and spectroscopy
by laser-induced fluorescence. Confocal fluorescence studies provide
information on identity, size, diffusion coefficient and concentration
of the fluorescently labeled entity. This enables the establishment of
sophisticated biochemical drug screening assays using the multitude of
fluorescence parameters that can be observed (e.g. molecular brightness,
fluorescence lifetime, anisotropy, resonance energy transfer). In cellular
screening assays, confocality introduces spatial resolution in the vertical
direction and reduces background fluorescence from outside the focal
plane. Confocal HTS systems focusing on femtoliter-sized observation
volumes allow for assay volumes far beyond current limits.
▼

1086
DDT Vol. 8, No. 23 December 2003
reviews
research focus
www.drugdiscoverytoday.com
fluctuations. In contrast to most other techniques, where
these intensity fluctuations are considered as noise in the
measured signal, fluorescence fluctuation spectroscopy
uses the fluctuations themselves to obtain information
about the processes that generate them. The fluctuations
are caused by changes in the number
of observed molecules and/or by changes
in the fluorescent properties of the ob-
served molecules. The processes caus-
ing the fluctuations can be diffusion or
drift of the molecules, flow of the sam-
ple, and/or chemical reactions. Thus,
fluorescence fluctuation experiments
give access to information, such as
the number of molecules, molecular
concentration, molecular size, diffu-
sion coefficient, rate coefficients of
inter- and intra-molecular reactions,
and molecular brightness.
Because fluctuations of the intensity
signal are analyzed, it is desirable to
maximize them. For a large number of
molecules in the observation volume,
fluctuations are averaged out. Conse-
quently, the total number of fluor-
escent molecules in the observation
volume has to be kept low to maximize
fluctuations. This can be achieved by a
low fluorophore concentration and/or
small observation volume. Typical flu-
orophore concentrations used in fluor-
escence fluctuation spectroscopy are in
the nanomolar range, and the femto-
liter-sized observation volume can be
realized by confocal optics, as described
previously.
The primary data generated by a
fluorescence fluctuation spectroscopy
experiment are a record of fluorescence
intensity as a function of time (Figure 1b).
These data contain information about
the number of molecules in the obser-
vation volume at a given time and
about their fluorescent properties. The
information can, in principle, be ex-
tracted with two different (and partly
complementary) statistical approaches:
(i) analysis of the autocorrelation func-
tion and (ii) analysis of the photon
counting histogram. Both methods,
as well as additional techniques, are
described in more detail in the following sections.
Fluorescence correlation spectroscopy (FCS)
Fluorescence correlation spectroscopy (FCS), introduced by
Magde, Elson and Webb in 1972 [3–7] and applied for the
Figure 1. (a) The observation volume in confocal microscopy. The laser excitation light
(shown in blue) is focused through the objective to a diffraction-limited point. The
confocal pinhole in the detection path ensures that only fluorescence light (shown in red)
emitted from the focal plane is detected (shown in the middle). Light coming from below
or above focus can not be registered (see left and right). The combination of focused
excitation and a pinhole in the detection path establish the confocal sample volume of
approximately one femtoliter (10
-15
l), from which the fluorescence is detected. (b)
Fluorescence intensity time trace. For each time point, the fluorescence intensity signal is
determined by the fluorescent particles in the observation volume. The fluctuations are
caused by either a change of the number of observed molecules (e.g. through diffusion)
and/or a change of their fluorescent properties (e.g. due to chemical reaction). In this
example, bright lipid vesicles (labelled with several fluorophores per vesicle) cause the
large spikes in the time trace, and dimmer particles (free fluorophores) cause the smaller
fluorescence fluctuations. (c) An autocorrelation function (ACF). The photon bursts in (b)
can be analyzed for their duration by the ACF, which yields information about the
diffusion time through a confocal observation volume. Small molecules diffuse faster and
show a shorter diffusion time, larger molecules diffusing slowly show a longer diffusion
time. Moreover, the amplitude of the ACF provides information about number of
fluorescent particles diffusing through the confocal observation volume. A large
amplitude (~1/N) indicates a low concentration of particles, a lower amplitude indicates a
higher concentration of particles.
Drug Discovery Today
Diffusion time
~1/N
Log (correlation time)
A
CF G(t)
0
2
4
6
8
0
100
200
Time (s)
Fluorescence intensity
(photons/s)
Excitation
light
Objective lens
Focus plane
Detector
Beamsplitter
Pinhole
Below focus
In focus
Above focus
Fluorescence
(a)
(b)
(c)

1087
DDT Vol. 8, No. 23 December 2003
reviews
research focus
www.drugdiscoverytoday.com
first time by the same group in 1974,
uses the autocorrelation function (ACF)
to analyze fluctuation data. The ACF is
defined in Equation 1.
[Eqn 1]
where F denotes fluorescence intensity,
δ
F fluorescence intensity fluctuations,
t time,
τ
correlation time and
〈 〉
de-
notes the time average. It calculates
the probability to detect a photon at
some time (t+
τ
) if there was a photon
at time t. In other words, the ACF cor-
relates the fluorescence at the time-
point t with the time-point (t+
τ
). For
freely diffusing molecules moving in
and out of the observation volume, a
high correlation of the fluorescence
signal is expected while a molecule
stays in the volume. Independent mol-
ecules should be uncorrelated and the
ACF will drop to zero, at times larger
than the typical residence time in the
observation volume, as shown in the
schematic ACF in Figure 1c. This is
called the diffusion time of the molecule; it is dependent
on the size of the molecule and the observation volume.
Small molecules diffuse fast, the diffusion time is short,
and their ACF decays at a short correlation time. As larger
molecules diffuse more slowly, their diffusion times are
longer and, therefore, the decay of the ACF is shifted
towards longer correlation times.
As stated earlier, fluctuations are larger if the number of
molecules is smaller. The amplitude of the ACF is propor-
tional to the inverse number of the molecules in the vol-
ume (~1/N in Figure 1c). Lower concentrations, thus, give
a larger signal in FCS measurements (i.e. a large amplitude
is associated with a low concentration of particles while a
smaller amplitude is associated with a higher concen-
tration of particles); FCS enables us to distinguish between
different molecules in the sample with regard to their size
and to measure their concentrations.
A typical biochemical application of FCS in an HTS envi-
ronment is a ligand binding assay, which measures the
binding of a ligand to the target and its displacement by
tested compounds. An example of the application of FCS
for such a biochemical assay, the binding of a peptide to
its receptor, is shown in Figure 2a. The peptide ligand is
fluorescently labeled so that its diffusion through the obser
vation volume can be measured. The free ligand is rela-
tively small and diffuses quickly through the confocal ob-
servation volume (red data points). As the receptor is in-
corporated into large lipid vesicles, binding of the ligand
to its receptor results in a longer diffusion time through
the observation volume (blue data points). The situation
of small, fast diffusing and large, slowly diffusing particles
is schematically shown in the inset in Figure 2a. Further
applications of FCS for HTS have been reviewed by Auer
et al. [1].
In principle, FCS can be used for any binding assay
associated with a change in the size (mass) of the detected
molecule on binding; however, as translational diffusion is
proportional to the hydrodynamic radius, and thus, only
to the cube-root of the mass, the mass difference should
ideally be rather large. Hence, an eightfold increase in the
molecular mass changes the diffusion time only by a factor
of two. Thus, FCS measurements are sensitive only to large
changes in the molecular mass. Typically, ligands are small
and target molecules are large, so the condition of a large
mass ratio is fulfilled by many binding assays. From this
point of view, large membrane fragments or lipid vesicles
( )
2
)
(
)
(
)
(
:
t
F
t
F
t
F
G
τ
+
δ
⋅
δ
=
τ
Figure 2. Application of FCS (a) and FIDA (b) to a receptor–ligand binding assay.
(a) Autocorrelation functions (ACFs) are shown for two samples: the ACF of a
fluorophore-labeled peptide (red) and of this peptide bound to its receptor in large lipid
vesicles (blue). The unbound peptide traverses the confocal observation volume fast (red
track in inset), and its ACF correspondingly shows a shorter diffusion time. If the
fluorophore-labeled peptide is bound to its receptor in the large vesicle (blue track in
inset), it will diffuse through the confocal volume more slowly, and the ACF yields a
longer diffusion time. (b) In a photon counting histogram (PCH), the photon-bursts are
analysed for their intensity, so that two components can be distinguished with regard to
their individual molecular brightness. The emitted photons are counted for a short time
interval (bin width here is 100 µs) and plotted as a histogram. The PCH for a fluorophore-
labelled peptide is shown in red, and the PCH for peptide ligands bound to multiple
receptors in a lipid vesicle is shown in blue. Each lipid vesicle contains 50-100 receptors,
and the receptors were saturated with ligands in this example. The unbound fluorescent
peptide emits less photons during its passage through the confocal volume (red track in
inset) than the vesicle with multiple fluorescent peptides bound to its receptors (blue
track in inset) for different wavelength detection.
Drug Discovery Today
(a)
(b)
-6
-4
-2
0
0
20
40
60
2
0.0
0.5
1.0
ACF G(t)
Small
particles
Large
particles
2
4
6
Log (events)
Dim
particles
Bright
particles
Log (correlation time/s)
Photons per bin

1088
DDT Vol. 8, No. 23 December 2003
reviews
research focus
www.drugdiscoverytoday.com
are optimal as slowly diffusing components in FCS meas-
urement. However, a problem that is associated with
experiments on particles that diffuse extremely slowly is
the long data acquisition time needed to generate enough
statistical events for the calculation of the ACF. This disad-
vantage of FCS can be partially compensated for by a scan-
ning approach – a technique that achieves a reduction of
the measuring time without loss of data quality. It is based
on an active search for membrane fragments in the sample
by moving the focused laser beam or the entire sample.
Using the scanning approach, many more membrane frag-
ments or vesicles with bound ligand can be detected in the
same measuring time. For scanning FCS, the diffusion ACF
must be supplemented with an additional exponential
factor containing the scanning velocity [7,8].
FCS is an excellent method for the estimation of ab-
solute concentrations of fluorescently labeled species and
allows us to quantify free and bound ligand, based on the
mass difference between these two species. When several
diffusing species are simultaneously present in the sample,
the ACF is the sum of the ACFs of each species weighted by
the square of its fractional intensity, which depends on its
molecular brightness and concentration. For example, in
a mixture containing identical concentrations of two
species, but one having twice the molecular brightness of
the other, the weights differ by a factor of four.
In addition to the different diffusion times, differences
in the molecular brightness of multiple species in the assay
make the evaluation of the ACF complicated. Under well-
controlled conditions, these effects can be entangled. In
one special case for FCS enabling simplified analysis, all
fluorescent species in the assay should have the same mol-
ecular brightness and differ by their molecular masses only.
The second special case can be achieved if the molecular
brightnesses of two species are vastly different; here, the
dimmer species can be neglected, and the ACF represents
only one species. The difference in molecular brightness is
used for the second type of statistical evaluation of fluor-
escent intensity time traces, as described in the following
section.
Photon counting histogram (PCH) or fluorescence intensity
distribution analysis (FIDA)
Instead of analyzing the temporal fluctuations of the fluor-
escence signal (as done in FCS), the statistics of the intensi-
ties of the generated photon bursts can be analyzed.
Photons that are emitted during passage of the fluorophore
through the confocal observation volume are counted for
a short time interval (time bin) and plotted as a histogram.
A dimmer fluorophore emits less photons per time bin dur-
ing its passage through the confocal volume than does a
brighter fluorophore (see inset in Figure 2b). If the time bin
is shorter than the diffusion time of the fluorophore, the
fluorophore size does not influence the histogram. Thus,
two components can be distinguished with regard to their
individual molecular brightness. The distribution of the
numbers of photons per bin-width can be analyzed by two
slightly different statistical methods. One method, analysis
of photon counting histograms (PCHs), has been devel-
oped by Chen, Müller and coworkers [9], and the other,
fluorescence intensity distribution analysis (FIDA), by
P. Kask, K. Palo and co-workers from Evotec OAI (http://www.
evotecoai.com) [10].
FIDA/PCH analyses enable us to distinguish between dif-
ferent molecules in the sample by their brightness and to
measure their concentrations. The application of FIDA to a
HTS ligand–receptor binding assay necessitates changes
in the molecular brightness on binding, which may arise
from changes in the fluorescent properties of the fluo-
rophore-labeled species, binding to a multivalent receptor
or binding to vesicle/membrane fragment/particle with
multiple receptors. In Figure 2b, a PCH diagram is shown
as an example of a peptide binding to its receptor. The pep-
tide ligand is fluorescently labeled; so its photon statistics
on passage through the observation volume are shown as
the red data points. As multiple receptors are incorporated
into the lipid vesicles, the vesicle carries more fluorophore-
labeled ligands on binding of the ligand to its receptor. The
vesicle with multiple bound ligands emits many more pho-
tons during its passage through the observation volume
(blue data points) than the free ligand. The scheme of dim
and bright diffusing fluorescent particles in the confocal
observation volume is shown as an inset in Figure 2b.
Applications of FIDA to membrane receptor assays were
published previously [11–13] and in our work (report in
preparation). Most known sources of membrane receptors
bear multiple receptors and hence, FIDA appears to be an
ideal method for such assays. Membrane receptors, like
G-protein coupled receptors, can be obtained in cell mem-
brane fragments from cell culture or partly purified, and
reconstituted in lipid vesicles or enriched in virus-like par-
ticles (VLiPs™; Evotec OAI). As for the FCS experiments,
the scanning approach reduces the measuring time with-
out loss of data quality and has been used successfully in
FIDA measurements [11–13].
Further fluorescence fluctuation spectroscopy techniques
used in drug discovery
Futher techniques have been developed that combine
the basic methods FCS and PCH, and might also include
additional observable factors, which help to identify differ-
ent species in complex biological samples and provide

additional information about the properties of the species
or their binding.
Fluorescence cross correlation spectroscopy (FCCS); this
technique extends FCS to enable cross correlation analysis
of two colors [4,14]. For example, if ligand and receptor are
labeled with two different fluorophores, the binding event
is indicated by the simultaneous presence of both labels in
the confocal volume.
Confocal fluorescence coincidence analysis (CFCA); this is a
recently developed technique, which emphasizes short
analysis times and simplified data evaluation [15]. It is,
therefore, particularly useful for screening applications
and/or measurement on living cells where small illumina-
tion doses need to be applied.
Fluorescence lifetime analysis; this could be also used with
confocal optics. It gives insight into changes of the excited
state by monitoring the fluorophore lifetime in the nano-
second time range.
2-dimensional fluorescence intensity distribution analysis
(2D-FIDA; Evotec OAI); this extends FIDA to the combined
analysis of two simultaneously recorded brightness distrib-
utions [16]. 2D-FIDA might be configured for two-color,
anisotropy or FRET applications, and enables high quality
and high content data.
Fluorescence intensity and lifetime distribution analysis
(FILDA; Evotec OAI); this is an advanced analysis technique,
yielding simultaneous information on the fluorescence
lifetime and molecular brightness of multiple fluorescent
species [17].
Biomolecular dynamics in the confocal volume
Proteins are enormously complex physical systems that are
characterized by a huge number of conformational states,
and transitions among these states are intimately linked
to their function. Single molecule spectroscopy, the meas-
urement of intensity fluctuations, emission spectra, fluor-
escence lifetime and polarization in the confocal observa-
tion volume can provide valuable information on these
dynamic processes [18]. Molecular interactions, enzymatic
activity, reaction kinetics, conformational dynamics, as
well as alterations in the chemical environment of the
fluorophore can be monitored. For G-protein coupled
receptors (GPCRs), the most frequently addressed drug
targets in pharmaceutical industry, this method has the po-
tential to distinguish between partial, full, inverse agonists
or antagonists [19].
Instrumentation for fluctuation fluorescence spectroscopy
in a HTS environment
Several companies supply devices that enable fluctuation
fluorescence spectroscopy measurements, but Evotec OAI
is the most advanced in applying this technology to HTS.
The Insight™ reader (Evotec Technologies GmbH; http://
www.evotec-technologies.com) detects fluorescent molecules
with single-molecule resolution. Submicroliter miniatur-
ization without loss of signal quality becomes possible by
the use of confocal optics. Parallel analysis of multiple
fluorescent dyes is enabled by multiple laser sources and
detectors. Detection of single molecules at different wave-
lengths or polarization states with nanosecond time reso-
lution is made possible by the use of two highly sensitive
single photon detectors. High-speed signal processing
boards support a real-time calculation of all incorporated
methods. Measurement times for large particles, such as
membrane fragments, are reduced by 2D beam scanning.
Evotec Technologies GmbH indicates a typical readout time
per well of ~1 s, which fulfills the requirements of ultra-HTS.
The basic version of the Insight™ reader is equipped with
three lasers: an Ar+ laser for excitation at 488 and 514 nm,
a HeNe laser (543 nm) and another HeNe laser (633 nm). It
supports the FCS, FIDA, FCCS and 2D-FIDA modes.
For fluorescence lifetime measurements, another version
of the Insight™ reader is available, which additionally con-
tains a mode-locked frequency doubled Nd:YAG green laser
(532 nm) and a pulsed red laser diode (635 nm). This last
reader also contains a software extension that supports the
fluorescence lifetime analysis and the FILDA technique.
Confocal cellular screening
Advantages of confocal cellular imaging
Fluorescence microscopy has been widely used in cell bi-
ology as a non-destructive and sensitive technique for the
visualization of intracellular structures and biomolecular
translocations. The imaging of intracellular structures has
benefited substantially from the introduction of confocal
microscopy. Fundamentally, confocal optics dramatically
improve the spatial resolution in the vertical direction,
greatly reducing interference from adjacent object features
above or below the focal plane (Figure 4a). For example,
confocal optics enable the observation of cells that are ad-
herent to the bottom of a microtiter plate well without in-
terference from dead cells, free fluorophores or autofluo-
rescent particles above the cellular layer. In a standard
microscopic image, light is also collected from a layer out-
side the focal plane. This increased optical resolution is
particularly important to permit the visualization of the
complex subcellular membrane, vesicle and organelle sys-
tems within eukaryotic cells. The detailed study of intra-
cellular translocation of target biomolecules, for example,
the translocation of a transcription factor from the cytosol
to the nucleus in response to a stimulus, is facilitated by
this approach.
1089
DDT Vol. 8, No. 23 December 2003
reviews
research focus
www.drugdiscoverytoday.com

1090
DDT Vol. 8, No. 23 December 2003
reviews
research focus
www.drugdiscoverytoday.com
‘High (Information) content screening’
The emerging field of ‘High (Information) Content
Screening’ (HCS; main topic of the meeting of the Society
for Biomolecular Screening 2002; http://www.sbsonline.com)
is based on high resolution imaging of fluorophore-stained
cells. Typically, several fluorophores can be observed in
parallel (multiplexing). Image analysis software automati-
cally quantifies intracellular translocations of fluorophore-
labeled biomolecules. Apart from protein trafficking, HCS
can provide information on apoptosis, morphological
changes (e.g. neurite outgrowth), cellular movements and
other phenomena that result in an overall change of the
fluorescent cellular image.
Like other non-confocal imaging systems, confocal read-
ers enable single-cell imaging. Single-cell imaging provides
the additional advantage of being able to analyze the re-
sponse of a heterogeneous cell population to a drug stimu-
lus, for example. The individual cells of a population might
differ with respect to their developmental stage, their stage
in the cell cycle, their state of transfection or by natural
variability. Single-cell analysis enables the study of cellular
responses that only occur in a subset of a cell population.
Furthermore, certain drug effects on single cells might be
cross-correlated with other phenomena, such as apoptosis.
Both the study of intracellular transport pathways and sin-
gle-cell distinction benefit from the good spatial resolution
of confocal readers.
Drug discovery applications of confocal cellular imaging
To localize specific biomolecules within a cell using fluor-
escence microscopy, the biomolecules must be labeled with
an appropriate fluorophore. Labeling can be achieved
through chemical, antibody-mediated or endogenous (fu-
sions with fluorescent proteins) methods. If the biomolecular
transport starts from the plasma membrane, the biomole-
cule of interest can be labeled (e.g. with a fluorophore-la-
beled antibody or ligand) from the extracellular side before
it begins its journey into the cell. However, if the epitope
for an antibody-based fluorescent labeling is not exposed
to the extracellular medium, the cells must be fixed and
lysed before the fluorescent antibody can be applied. This
fixation procedure restricts the possibilities of the cellular
imaging to end-point measurements. Alternatively, en-
dogenously synthesized fluorophores, such as the green
fluorescent protein [20] or its differently colored relatives
[21–24] might be attached to a protein-encoding sequence
on the DNA level. The resulting fluorescent fusion protein
and its movement kinetics can be so visualized in a non-
destructive way. The novel fast cellular confocal readers
that are described below enable kinetic measurements with
a high temporal resolution.
In a typical drug screening application for a cellular
imaging system, the intracellular transport of fluorophore-
labeled biomolecules is observed in response to an extra-
cellular stimulus. As an example, the endothelin 1-induced
internalization of a fusion protein between endothelin A
receptor (ET
A
R) and green fluorescent protein (GFP) has
been studied using the Opera™ system (G. Gradl, pers.
commun.; Figure 3). In the absence of endothelin, the
ET
A
R-GFP resides in the plasma membrane. Upon binding
of endothelin, the ET
A
R-GFP becomes internalized and
translocated to a central endosomal compartment. Image
analysis and object recognition software enable the distinc-
tion between the peripheral and the accumulated intracel-
lular green fluorescence on the single-cell level.
Instrumentation for cellular confocal imaging in an HTS
environment
Several systems are commercially available for confocal mi-
croscopic imaging of cells. However, the available confocal
point scanning microscopes are generally too slow for
drug screening applications. Three confocal high-through-
put cellular imagers are marketed to fill this gap: the
Opera™ from Evotec Technologies GmbH, the InCell
Analyser™ from Amersham Biosciences (http://www5.
amershambiosciences.com) and the Pathway HT™ from
Atto Biosciences Inc. (http://www.atto.com). These systems
achieve a readout time of ~1 s per well (varying for exam-
ple with the required resolution of the microscopic image
and the brightness of the fluorophores) and are described
in detail later. For the sake of higher throughput, the
Opera™ (Figure 4c) and the Pathway HT™ (Figure 4d)
employ a Nipkow disk to project fluorescence from sev-
eral confocal volumes in parallel to a CCD camera. In a
similar approach to shorten the imaging time, the InCell
Analyser™ employs line scanning through a confocal slit
(Figure 4b). This new generation of HTS-compatible confo-
cal imaging readers combines high temporal with high spa-
tial resolution. All three systems support an autofocus
mechanism that keeps the microscope objective focused to
the cellular layer adherent to the bottom of the well. The
Pathway HT™ and InCell Analyser™ provide an environ-
mental chamber that maintains user-defined temperature
and carbon dioxide levels, thus, enabling live cell experi-
ments; for the Opera™ this feature will be available in the
near future.
The Evotec Opera™ possesses three laser sources (488 nm,
532 nm and 633 nm) and two CCD cameras for the de-
tection of two fluorescence emission wavelengths. Using
parallel two-color excitation (488/633 nm or 532/633 nm)
and two parallel detection channels, it enables the simulta-
neous observation of two cellular phenomena.
1091
DDT Vol. 8, No. 23 December 2003
reviews
research focus
www.drugdiscoverytoday.com
The Pathway HT™ is constructed around the Confocal
Attofluor Ratio Vision (CARV) scanning technology of Atto
Bioscience. In contrast to the Opera™ reader, the system
employs two independent full-spectrum mercury arc lamps
for illumination. Therefore, this setup provides the full
spectrum of excitation wavelengths (340 nm to near-IR),
using 16 excitation and 8 emission filters with indepen-
dent dichroic mirror setting (Figure 4d). A single CCD
camera enables the measurement of multiple fluorescent
markers by taking fast sequential images at different wave-
lengths.
The InCell Analyser™ possesses three laser sources (365 nm,
488 nm and 647 nm) and three CCD cameras for simul-
taneous imaging (Figure 4b). Parallel use of the three
excitation wavelengths and of the three detection chan-
nels enables observation of three cellular phenomena
simultaneously.
Conclusions
Confocal fluorescence studies can be performed on fluo-
rophore-labeled biomolecules in femtoliter-sized volumes
in a biochemical assay solution or within living cells.
Biochemical HTS assays based on fluorescence fluctuation
spectroscopy are predominantly homogeneous assays. Due
to the high sensitivity of the technique, only minute quan-
tities – typically nanomolar concentrations – of the bio-
reagents are needed. Because of the confocal setup, these
assays are well suited for extreme miniaturization, while
maintaining the same background fluorescence. The re-
duced assay volume results in overall lower bioreagent
costs and lower consumption of the analyzed compounds.
The fluorophore-labeled entity in the sample might be
analyzed for translational diffusion time, fluorescence life-
time, fluorescence brightness, fluorescence polarization or
spectral characteristics. All of these parameters could change
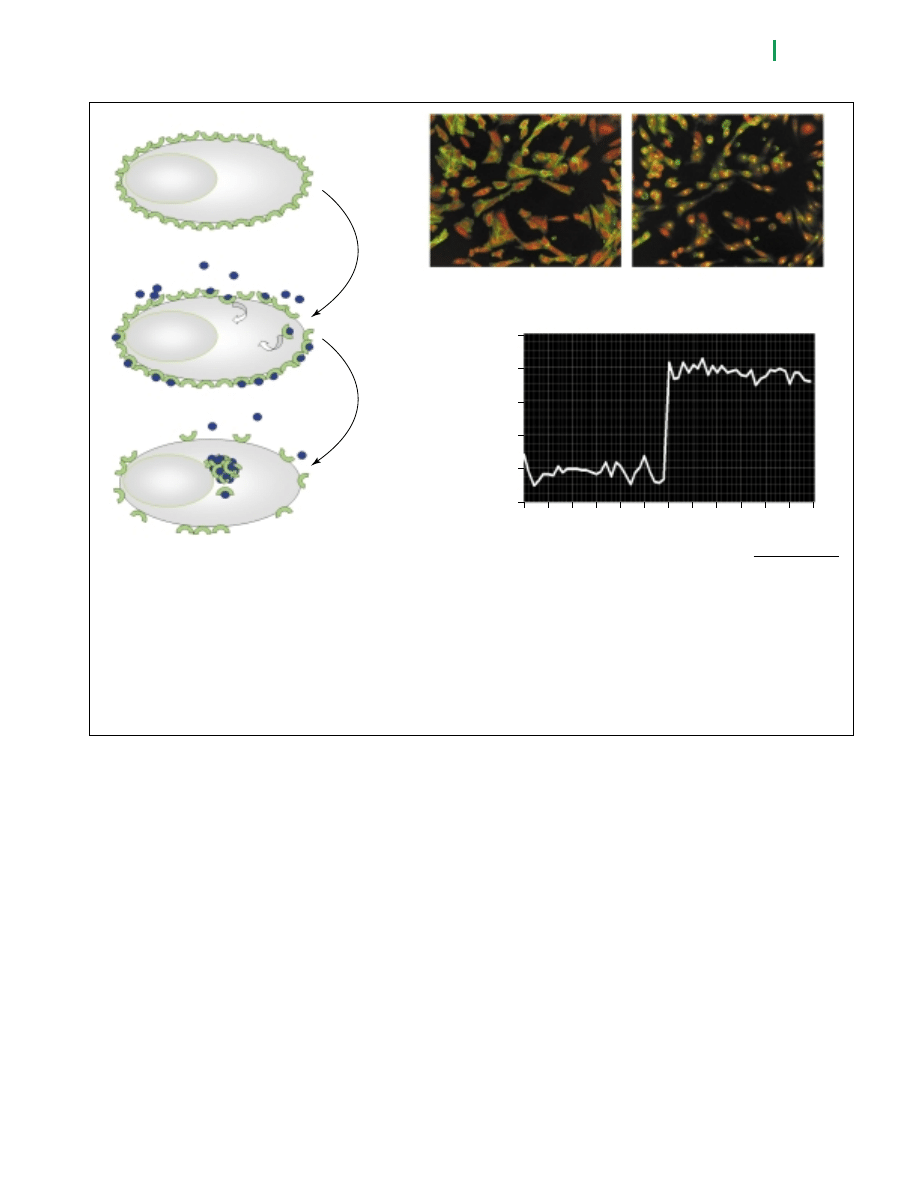
Figure 3. Agonist-induced internalisation of a fusion protein between endothelin A receptor (ET
A
R) and green fluorescent protein (GFP)
observed in the Opera system. (a) Scheme of the experiment: In the absence of endothelin (blue dots) the ET
A
R-GFP (green semicircles)
resides in the plasma membrane. Upon addition (i) and binding of endothelin, the ET
A
R-GFP becomes internalized and translocated to a
central endosomal compartment (ii). (b) In the absence of endothelin (left panel), the green fluorescence is mainly localized to the plasma
membrane, 3 h after addition of endothelin (right panel), green fluorescence arises largely from a central spot in the cytosol. (c) Image
analysis that distinguishes between the peripheral and the accumulated intracellular green fluorescence was carried out on the single-cell
level. The results of this analysis for 30 microtiter plate wells that were not exposed to endothelin are shown for wells # 0-29, the results for
30 wells that had been exposed to endothelin for 3 hours are shown for wells # 30-59. Statistics of this analysis predict a Z’ value [25] of
0.58 for an internalisation assay.
Drug Discovery Today
(a)
(b)
(c)
(i)
– Endothelin
+ Endothelin
– Endothelin
+ Endothelin
(ii)
Relativ
e n
umber of cells
sho
wing tr
anslocation
1.0
0.8
0.6
0.4
0.2
0.0
0
5
10 15 20 25 30 35 40 45 50 55 60

1092
DDT Vol. 8, No. 23 December 2003
reviews
research focus
www.drugdiscoverytoday.com
on binding of the investigated compound to the target bio-
molecule. From this multitude of fluorescence characteris-
tics, the optimal parameter might be chosen as the basis
for a drug screening assay format. Alternatively, multipara-
meter analysis can be performed to help distinguish be-
tween a technological artifact and a true pharmacological
effect of the compound. Overall, multiparameter analysis
is expected to substantially improve screening data quality.
In the pharmaceutical industry, fluorescence microscopy
has been established as a widely applied tool to study the
cellular effects of drug candidates. For cellular imaging,
confocal optics provide a significant improvement in spa-
tial resolution and data quality. The current generation of
automated confocal imaging readers promises to deliver
these advantages at a scale appropriate for HTS drug dis-
covery applications. The available HTS-capable confocal
Figure 4. Light paths of three confocal imaging systems. (a) A large arteriole in a skin section was doubly stained for nerve with an
antibody to protein gene product 9.5 conjugated to fluorescent marker Cy3 and to collagen type IV using marker Cy 2 (antibodies from
Jackson ImmunoResearch Laboratories; http://www.jacksonimmuno.com). The image was captured sequentially in confocal and wide-field
mode using the Atto Bioscience CARV scanning technology. The two images were then juxtaposed (courtesy of William R. Kennedy,
University of Minnesota; http://www.umn.edu). (b) Light path of the InCell Analyser™. The excitation laser light is autofocused through an
objective to the bottom of the microtiter plate. Fluorescence emission is collected by the same objective, then guided through a dichroic
mirror and confocal slit mask to three simultaneously operating CCD detectors for different wavelength detection (scheme is courtesy of
Gerd Erhard, Amersham Biosciences). (c) Light path of the Opera™. The excitation laser light is guided through a rotating microlens array
that focuses the light through a dichroic mirror, a simultaneously rotating pinhole array and an objective lens to the sample. Fluorescence
emission from the sample is guided back via an objective and pinhole array, then reflected towards a CCD camera (courtesy of Gabriele
Gradl, Evotec Technologies GmbH). (d) Light path of the Pathway HT™. Light from two high intensity mercury arc lamps is sequentially
passed through one of two 8-position excitation filters. The excitation light is reflected/passed through two selectable dichroic filter wheels,
and projected through a broad-spectrum spinning Nipkow disk to the objective and onto the specimen. Fluorescence emission from the
sample is collected by the objective, passed once again through the same spinning disk, through the dichroic mirror, and then through one
of eight selectable emission filters to a CCD camera (courtesy of Phil Vanek, Atto Biosciences).
Drug Discovery Today
(a)
(b)
(c)
(d)
Confocal
Standard
fluorescence
3 simultaneous
laser inputs
Tracking autofocus
Microtiter plate
Objective: 40X 0.6 NA
Dichroic mirror
Confocal slit mask
Laser
Microlens
array
Microlens
Pinhole
Pinhole array
Objective lens
Sample
Lens
Camera
Sample plate
Objective
Nipkow disk
Dichroic mirror
Dichroic
mirror
Excitation
filter
wheel 1
Excitation
filter
wheel 2
Emission filter
wheel
CCD
camera
Arc lamp
source 2
Arc lamp
source 1
Rotation
3 CCD detectors
operating simultaneously

1093
DDT Vol. 8, No. 23 December 2003
reviews
research focus
www.drugdiscoverytoday.com
cell imagers achieve increased imaging velocity, either
by line-scanning or by Nipkow disk-based multi-point
scanning, both of which enable fast kinetic assays while
maintaining high spatial resolution.
Confocal optics have the potential to benefit multiple
stages of the drug discovery process. We predict a substan-
tially increased use of this technology for highly miniatur-
ized biochemical assays and for high resolution cellular
imaging in the near future.
References
1 Auer, M. et al. (1998) Fluorescence correlation spectroscopy: lead
discovery by miniaturized HTS. Drug Discov. Today 3, 457–465
2 Wilson, T. (1990) Confocal Microscopy, Academic Press
3 Magde, D. et al. (1974) Fluorescence correlation spectroscopy. II.
An experimental realization. Biopolymers 13, 29–61
4 Rigler, R. (1995) Fluorescence correlations, single molecule detection
and large number screening. Applications in biotechnology.
J. Biotechnol. 41, 177–186
5 Ehrenberg, M. and Rigler, R. (1976) Fluorescence correlation
spectroscopy applied to rotational diffusion of macromolecules.
Q. Rev. Biophys. 9, 69–81
6 Magde, D. et al. (1972) Thermodynamic fluctuations in a reacting
system – measurement by fluorescence correlation spectroscopy.
Phys. Rev. Lett. 29, 705–708
7 Thompson, N.L. (1991) Fluorescence correlation spectroscopy. In Topics
in Fluorescence Spectroscopy (Vol. 1) (Lakowicz, J.R., ed.), pp. 337–378,
Plenum Press
8 Magde, D. et al. (1978) Fluorescence correlation spectroscopy. III.
Uniform translation and laminar flow. Biopolymers 17, 361–376
9 Chen, Y. et al. (1999) The photon counting histogram in fluorescence
fluctuation spectroscopy. Biophys. J. 77, 553–567
10 Kask, P. et al. (1999) Fluorescence-intensity distribution analysis and its
application in biomolecular detection technology. Proc. Natl. Acad. Sci.
U. S. A. 96, 13756–13761
11 Klumpp, M. et al. (2001) Ligand binding to transmembrane receptors
on intact cells or membrane vesicles measured in a homogeneous
1-microliter assay format. J. Biomol. Screen. 6, 159–170
12 Rüdiger, M. et al. (2001) Single-molecule detection technologies in
miniaturized high throughput screening: binding assays for g protein-
coupled receptors using fluorescence intensity distribution analysis and
fluorescence anisotropy. J. Biomol. Screen. 6, 29–37
13 Scheel, A.A. et al. (2001) Receptor-ligand interactions studied with
homogeneous fluorescence-based assays suitable for miniaturized
screening. J. Biomol. Screen. 6, 11–18
14 Schwille, P. et al. (1997) Dual-color fluorescence cross-correlation
spectroscopy for multicomponent diffusional analysis in solution.
Biophys. J. 72, 1878–1886
15 Winkler, T. et al. (1999) Confocal fluorescence coincidence analysis: an
approach to ultra high-throughput screening. Proc. Natl. Acad. Sci. U. S. A.
96, 1375–1378
16 Kask, P. et al. (2000) Two-dimensional fluorescence intensity
distribution analysis: theory and applications. Biophys. J. 78, 1703–1713
17 Palo, K. et al. (2002) Fluorescence intensity and lifetime distribution
analysis: toward higher accuracy in fluorescence fluctuation
spectroscopy. Biophys. J. 83, 605–618
18 Lamb, D.C. et al. (2000) Sensitivity enhancement in fluorescence
correlation spectroscopy of multiple species using time-gated detection.
Biophys. J. 79, 1129–1138
19 Ghanouni, P. et al. (2001) Functionally different agonists induce
distinct conformations in the G protein coupling domain of the beta 2
adrenergic receptor. J. Biol. Chem. 276, 24433–24436
20 Kain, S.R. (1999) Green fluorescent protein (GFP): applications in cell-
based assays for drug discovery. Drug Discov. Today 4, 304–312
21 Wiedenmann, J. et al. (2000) Cracks in the beta-can: fluorescent
proteins from Anemonia sulcata (Anthozoa, Actinaria). Proc. Natl. Acad.
Sci. U. S. A. 97, 14091–14096
22 Wiedenmann, J. et al. (2002) A far-red fluorescent protein with fast
maturation and reduced oligomerization tendency from Entacmaea
quadricolor (Anthozoa, Actinaria). Proc. Natl. Acad. Sci. U. S. A. 99,
11646–11651
23 Tsien, R.Y. (1999) Rosy dawn for fluorescent proteins. Nat. Biotechnol.
17, 956–957
24 Chudakov, D.M. et al. (2003) Kindling fluorescent proteins for precise
in vivo photolabeling. Nat. Biotechnol. 21, 191–194
25 Zhang, J.H. et al. (1999) A simple statistical parameter for use in
evaluation and validation of high throughput screening assays.
J. Biomol. Screen. 4, 67–73
Do you want to reproduce material from Drug Discovery Today?
This publication and the individual contributions contained in it are protected by the copyright of Elsevier.
Except as outlined in the terms and conditions (see p. X), no part of Drug Discovery Today can be reproduced,
either in print or in electronic form, without written permission from Elsevier.
Please send any permission requests to:
Elsevier, PO Box 800, Oxford, UK OX5 1DX
Wyszukiwarka
Podobne podstrony:
23 299 318 Optimizing Microstructure for High Toughness Cold Work Steels
23 299 318 Optimizing Microstructure for High Toughness Cold Work Steels
US Patent 568,179 Method Of And Apparatus For Producing Currents Of High Frequency
GUIDELINES FOR WRITING AND PUBLISHING SCIENTIFIC PAPERS
Guidelines for Persons and Organizations Providing Support for Victims of Forced Migration
steel?rgoes guidelines for master and co
for love and sex (2)
Get Set for Media and Cultural Studies
Improvements in Fan Performance Rating Methods for Air and Sound
Preparing for Death and Helping the Dying Sangye Khadro
Supply chain for cheese and desserts
Conditioning for Sports and Martial Arts
For Health and Strenght
Jig For Frame And Panel Gluing
10 129 139 New Tool Steel for Warm and Hot Forging
Supply chain for vegetables and fruits
więcej podobnych podstron