
Internal Use Only (FIUO)---For Official Use Only (FOUO)
NOT FOR FURTHER DISTRIBUTION
-Sensitive But Unclassified (SBU) 1
Director’s Update Brief
Wednesday
20 May 2009 1100 EDT
Day 32
Day of Supplemental
Internal Use Only (FIUO)---For Official Use Only (FOUO)
NOT FOR FURTHER DISTRIBUTION
-Sensitive But Unclassified (SBU) 2
Novel Influenza A (H1N1) Key Events
20 May 2009
•
Novel Influenza A (H1N1) Declarations
– WHO: Pandemic Phase 5 (29 Apr 1600 EDT)
– USG: Public Health Emergency declared (26 Apr 2009)
– SLTT Declarations: 11
• CA, TX, WI, FL, NE, VA, MD, IA, OH, American Samoa,
ME
•
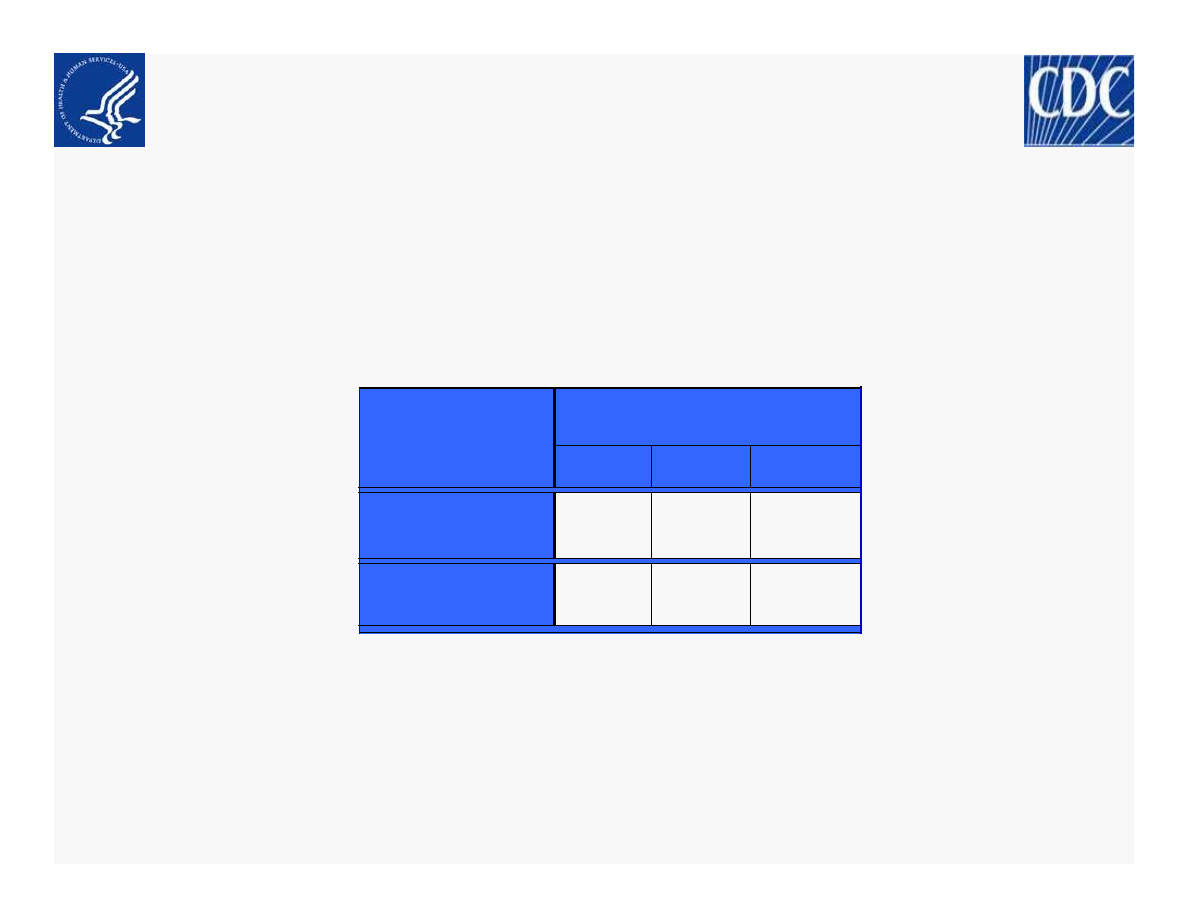
US Cases:
•
Deployments: 66 deployed, 5 pending, 207 potential
•
New countries with confirmed cases: Greece
•
Laboratory: 44 states validated: 9 states with multiple sites; 582
genes have been sequenced
Cases
Hosp
Deaths
5710
247
8
48
35
5
US TOTAL States
Affected INCL DC
Total Confimed and
Probable
US TOTAL Cases
INCL DC
Internal Use Only (FIUO)---For Official Use Only (FOUO)
NOT FOR FURTHER DISTRIBUTION
-Sensitive But Unclassified (SBU) 3
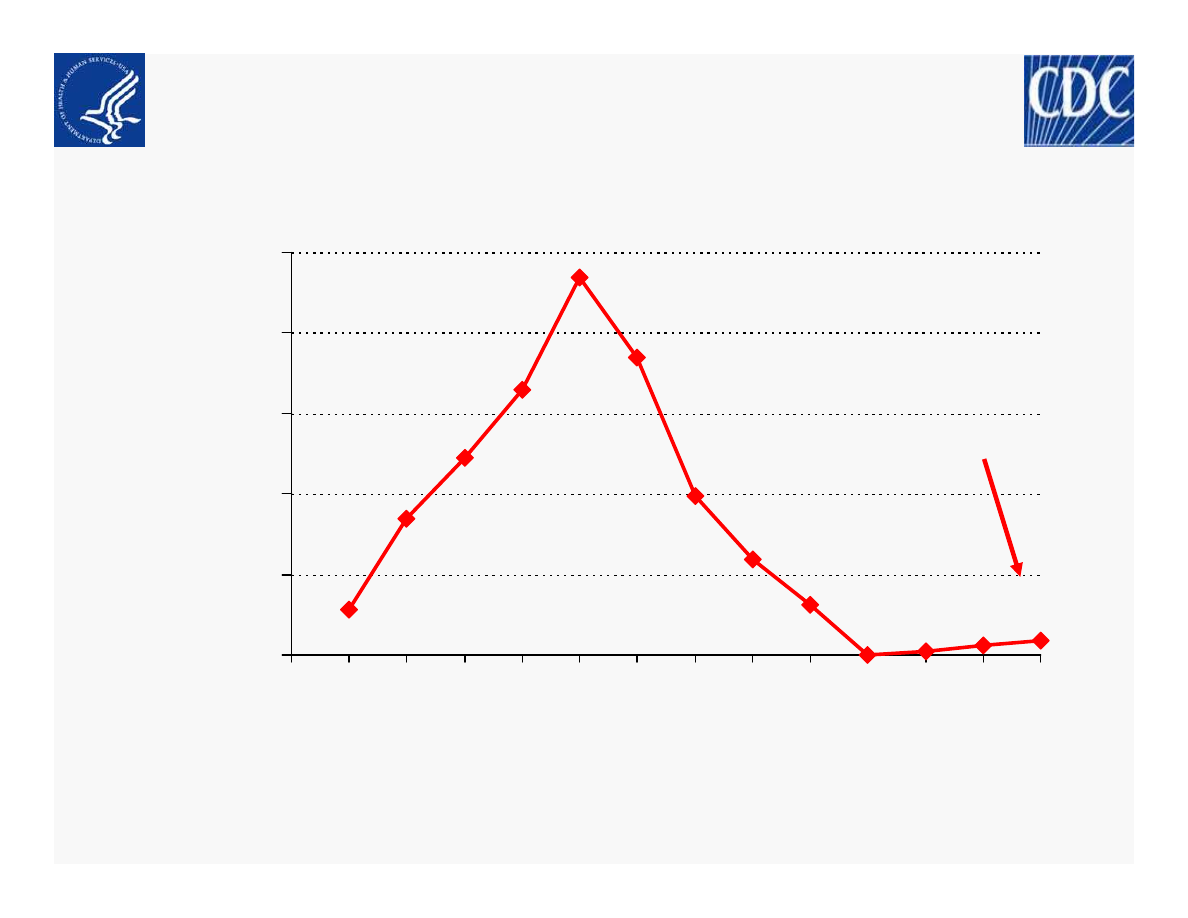
Epidemiology/Surveillance
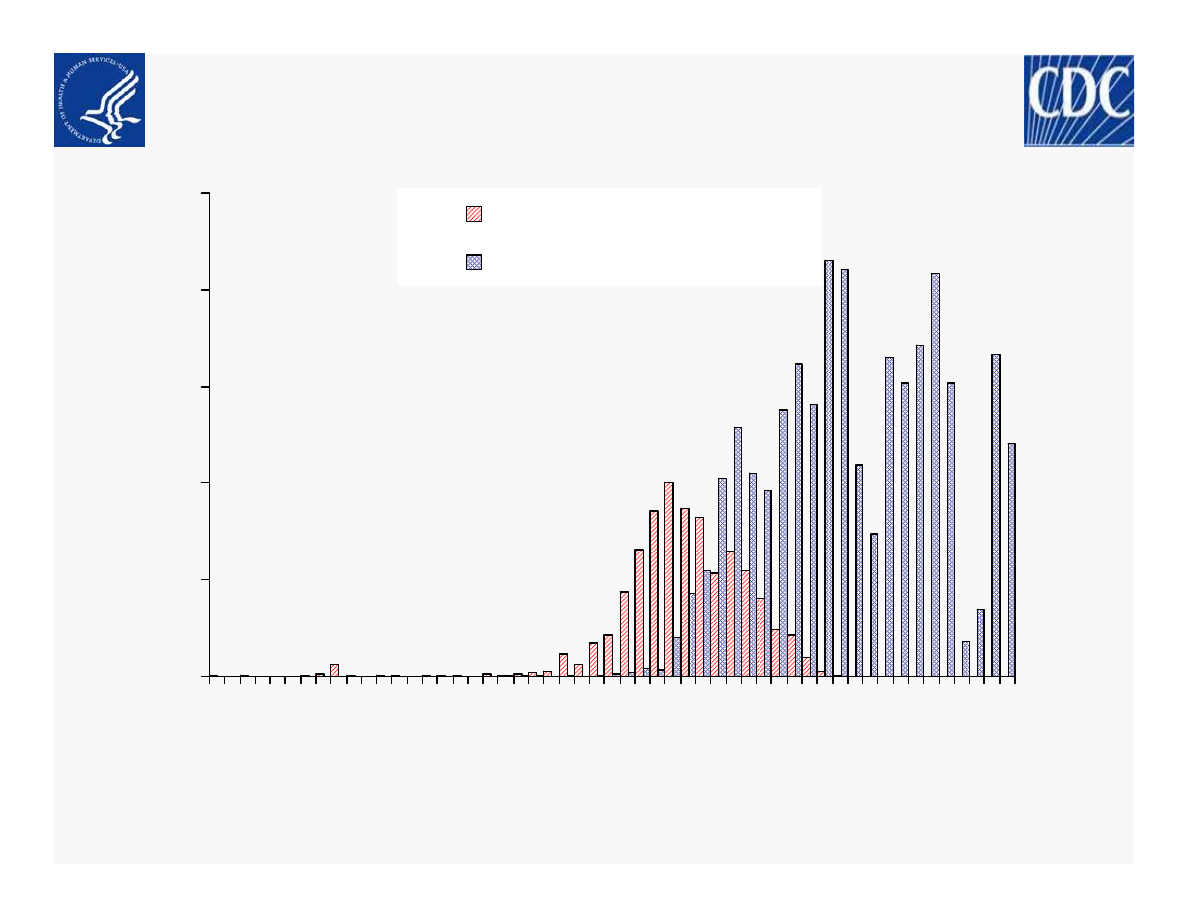
Confirmed and Probable Novel Influenza A (H1N1)
Cases By Onset Date* and Report Date as of 20 May 2009 1100 EDT
0
100
200
300
400
500
28
-Ma
r
30
-M
ar
1-A
pr
3-A
pr
5-A
pr
7-A
pr
9-A
pr
11
-A
pr
13
-A
pr
15
-A
pr
17
-A
pr
19
-A
pr
21
-A
pr
23
-A
pr
25
-A
pr
27
-A
pr
29
-A
pr
1-M
ay
3-M
ay
5-M
ay
7-M
ay
9-M
ay
11
-M
ay
13
-M
ay
15
-M
ay
17
-Ma
y
19
-M
ay
D
Date of Illness onset
lness Onset
N
o
.
o
f
C
a
s
e
s
Onset Date (n=1,632)
Report Date (n=5,605)
*Information on onset date no longer presented after May 12 due to change to aggregate reporting
Internal Use Only (FIUO)---For Official Use Only (FOUO)
NOT FOR FURTHER DISTRIBUTION
-Sensitive But Unclassified (SBU) 4
Epidemiology/Surveillance
Novel Influenza A (H1N1) - 20 May 2009 1100 EDT
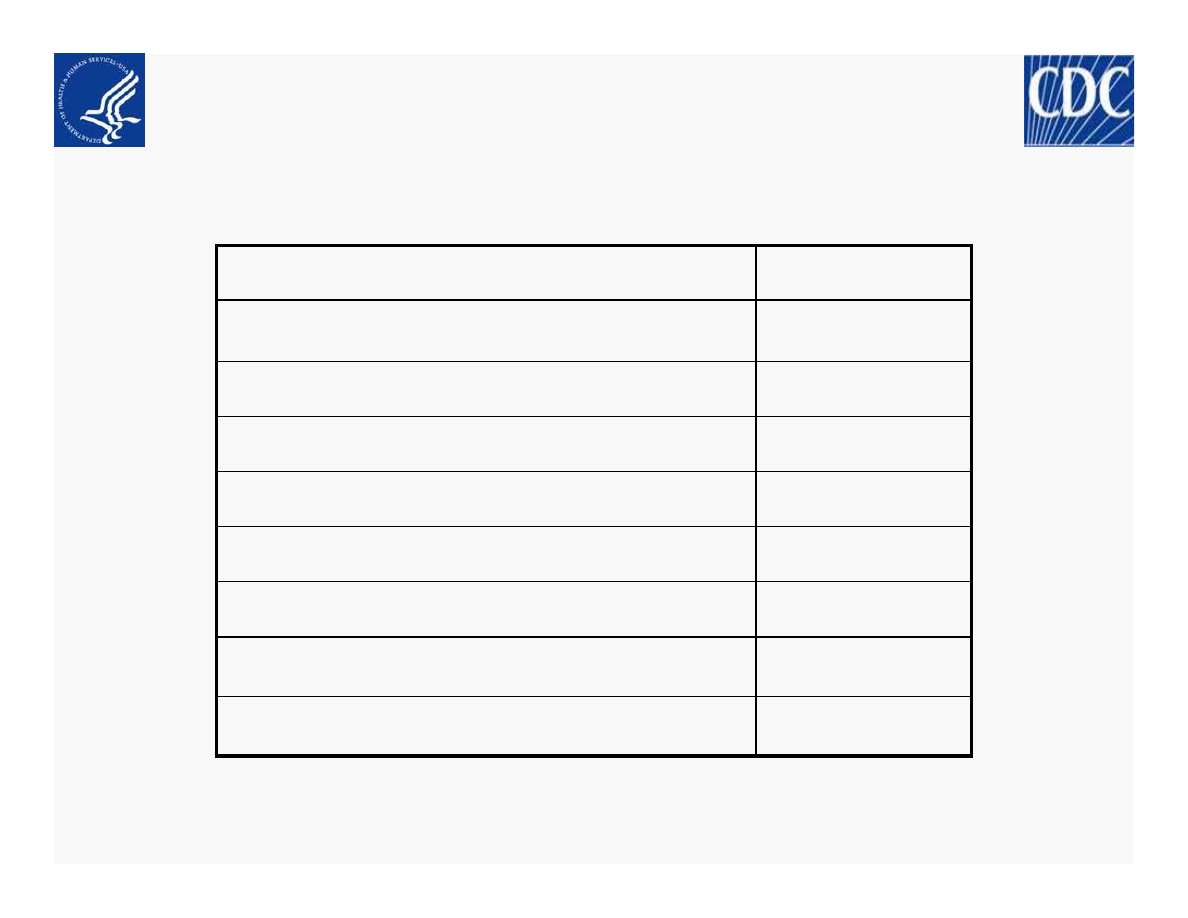
Selected Underlying Conditions
Persons Hospitalized with H1N1, 2009
6 (6%)
Obesity
4 (4%)
Chronic Renal Disease
7 (8%)
Pregnant
10 (11%)
Chronic cardiovascular disease
11 (12%)
Immunocompromised
14 (15%)
Diabetes
3 (3%)
Cancer
37 (40%)
Asthma or COPD
No. (%)
Condition
66 (71%) of hospitalized patients had an underlying chronic condition
Internal Use Only (FIUO)---For Official Use Only (FOUO)
NOT FOR FURTHER DISTRIBUTION
-Sensitive But Unclassified (SBU) 5
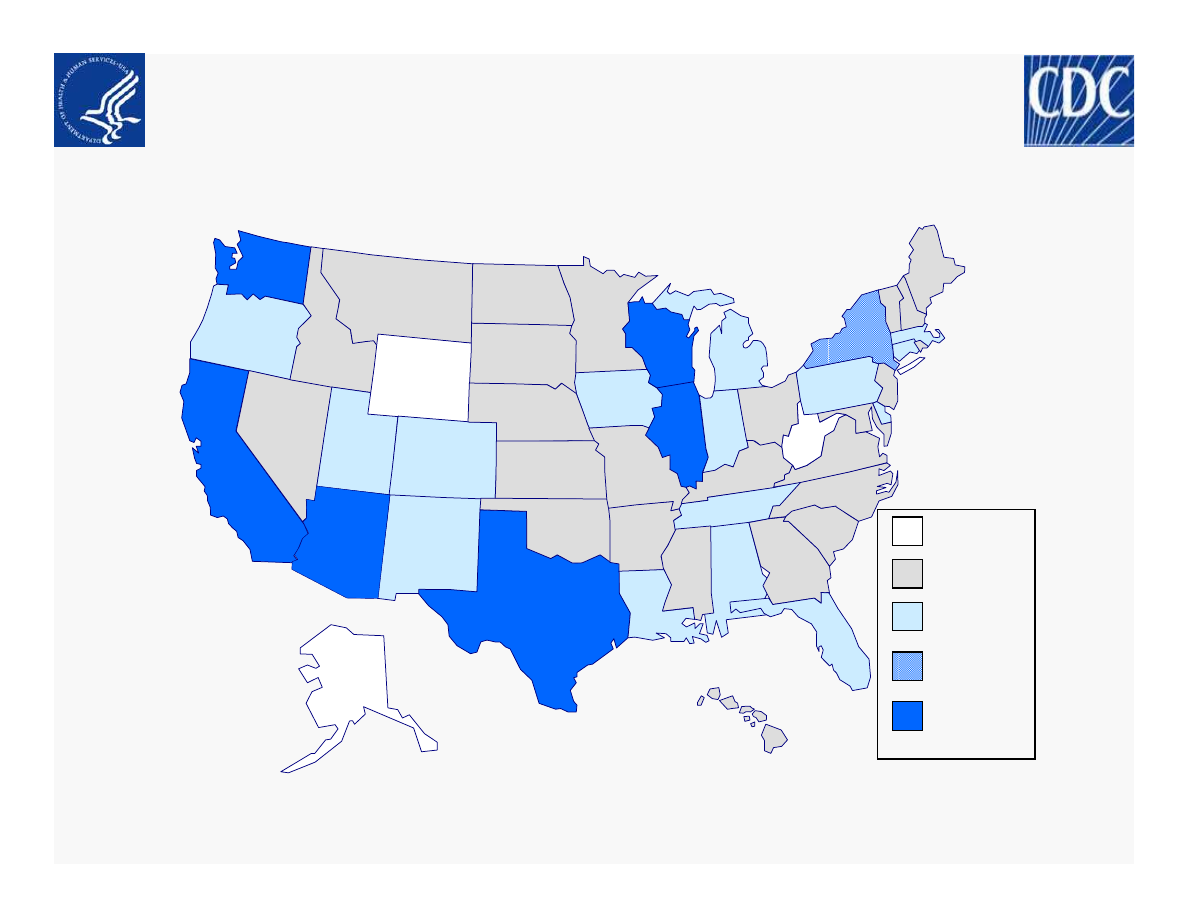
200-400
51-200
1-50
0
>400
Epidemiology/Surveillance
Number of cases of H1N1 reported to CDC by state
as of 17:30 EDT on 19 May 2009 (n=5710)
Internal Use Only (FIUO)---For Official Use Only (FOUO)
NOT FOR FURTHER DISTRIBUTION
-Sensitive But Unclassified (SBU) 6
Epidemiology/Surveillance
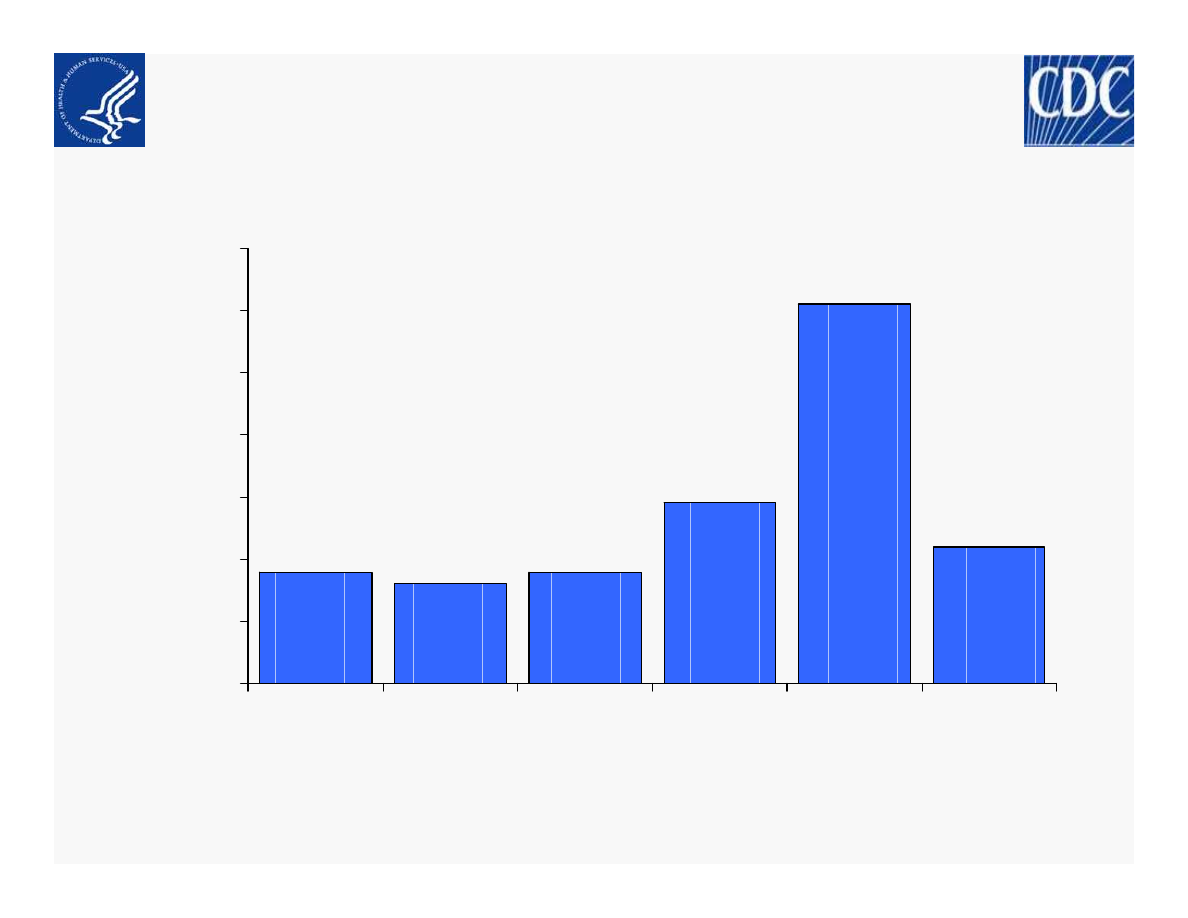
Novel Influenza A (H1N1) - 20 May 2009 1100 EDT
Age of Persons Hospitalized with H1N1, 2009 n=164
18
16
18
29
61
22
0
10
20
30
40
50
60
70
0-23 mos.
2-4 Yrs
5-9 Yrs
10-18 Yrs 19-49 Yrs
≥50 Yrs
Age
N
u
m
b
e
r
o
f
C
a
s
e
s
11%
10%
11%
18%
37%
13%
Median Age = 19 years

Internal Use Only (FIUO)---For Official Use Only (FOUO)
NOT FOR FURTHER DISTRIBUTION
-Sensitive But Unclassified (SBU) 7
Epidemiology/Surveillance
Novel Influenza A (H1N1) - 20 May 2009 1100 EDT
Antiviral and Antimicrobial Usage
Persons Hospitalized with H1N1, 2009
•
63/88 (60%) treated with antivirals
– Median time from illness onset to antiviral initiation 4 days
(1-25 days)
– Median time from admission to antiviral initiation 1 day
(6-13 days)
•
70 (75%) treated with antibiotics
– 100% initiated on day of admission

Internal Use Only (FIUO)---For Official Use Only (FOUO)
NOT FOR FURTHER DISTRIBUTION
-Sensitive But Unclassified (SBU) 8
Epidemiology/Surveillance
Novel Influenza A (H1N1) - 20 May 2009 1100 EDT
Indicators of Severity
Persons Hospitalized with H1N1
•
26/118 (22%) were admitted to the ICU
– 13 (50%) required mechanical ventilation
– 9 had ARDS
– Median age of ICU patients (n=23)
23 years (1 month-86 yrs)
– Median length of ICU stay (n=14)
9 days (2-34 days)
– Time from onset to ICU admit (n=13)
6 days (2-14 days)

Internal Use Only (FIUO)---For Official Use Only (FOUO)
NOT FOR FURTHER DISTRIBUTION
-Sensitive But Unclassified (SBU) 9
Epidemiology/Surveillance
Current Influenza Surveillance, 20 May 2009 1100 EDT
These data are considered provisional and preliminary and will not be officially released by the CDC until 1100 EDT.
•
WHO/NREVSS Collaborating Laboratories
(graph as of
5/19/2009)
– Seasonal influenza A (H1), A (H3), and B viruses co-
circulated with novel influenza A (H1N1) viruses
•
Influenza-associated Pediatric Deaths
– No new influenza-associated pediatric death were reported
– 2008-09 season total = 61
•
ILINet
– During week ending 5/16/2009, the percentage of ILI
outpatient visits was below the national baseline
– Overall, the percentage of outpatient visits for ILI remains
stable, based upon daily ILI reports from the US Outpatient
Influenza-like Illness Surveillance Network (ILINet)

Internal Use Only (FIUO)---For Official Use Only (FOUO)
NOT FOR FURTHER DISTRIBUTION
-Sensitive But Unclassified (SBU) 10
•
122 Cities Mortality Reporting System (graph as of 5/19/2009)
– As weekly mortality reports continue to be received at CDC for
week ending 5/9/2009, the percentage of pneumonia and influenza
deaths is not expected to be significantly elevated
– Percentage of deaths due to pneumonia and influenza remains
stable, based upon daily mortality reports from the 122 Cities
Mortality Reporting System
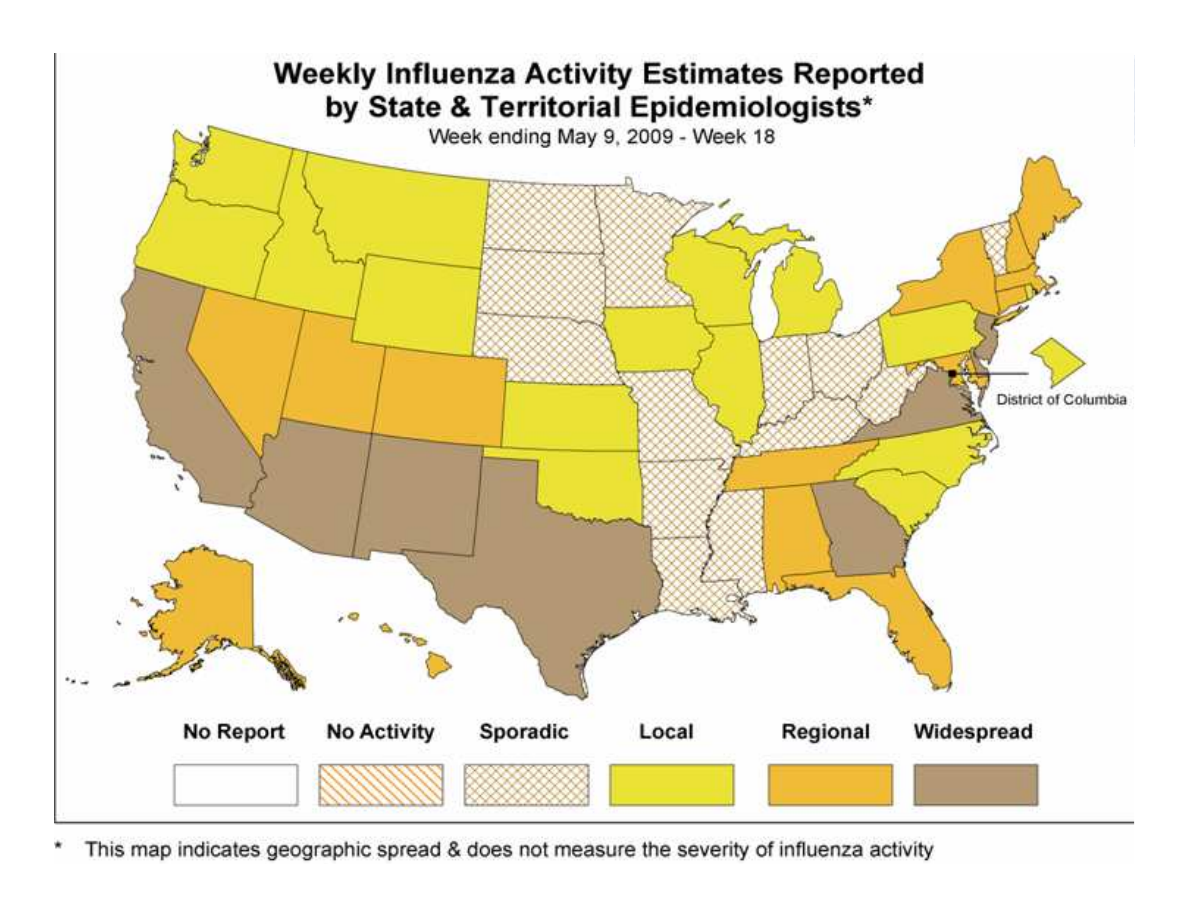
•
Geographic Spread of Influenza as Assessed by State and
Territorial Epidemiologists
– The influenza activity reported by state and territorial
epidemiologists indicates geographic spread of both seasonal
influenza and novel influenza A (H1N1) viruses and does not
measure the severity of influenza activity.
– Eight states reported geographically widespread influenza activity,
14 states reported regional activity, the District of Columbia and 15
states reported local influenza activity; and 13 states reported
sporadic influenza activity.
Epidemiology/Surveillance
Current Influenza Surveillance, 20 May 2009 1100 EDT
Internal Use Only (FIUO)---For Official Use Only (FOUO)
NOT FOR FURTHER DISTRIBUTION
-Sensitive But Unclassified (SBU) 11
Internal Use Only (FIUO)---For Official Use Only (FOUO)
NOT FOR FURTHER DISTRIBUTION
-Sensitive But Unclassified (SBU) 12
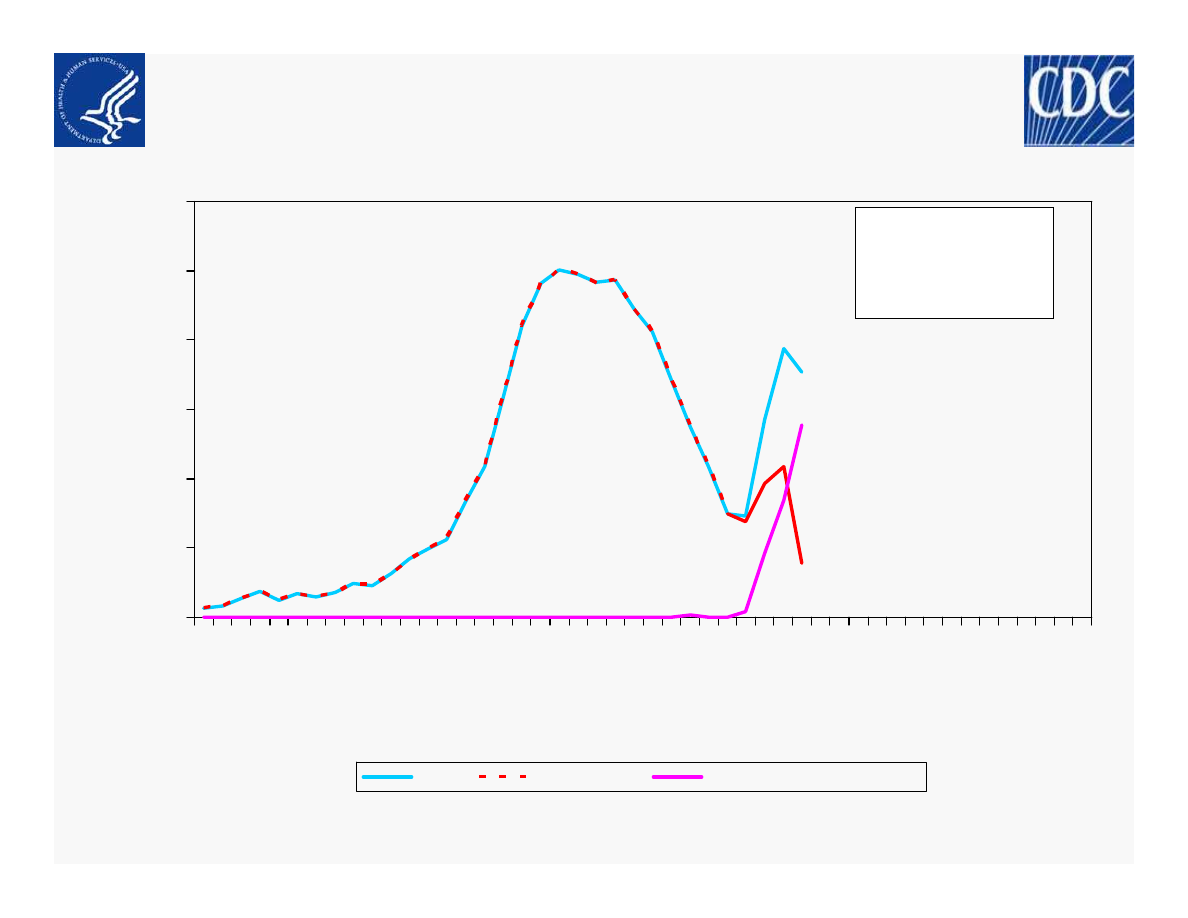
Percent of Specimens Positive for Influenza
Reported by WHO and NREVSS Labs:
Novel Influenza A(H1N1) vs. Seasonal Influenza, by Week
20 May 2009 1100 EDT
0
5
10
15
20
25
30
10
/4
10
/1
8
11
/1
11
/1
5
11
/2
9
12
/1
3
12
/2
7
1/
10
1/
24 2/
7
2/
21 3/
7
3/
21 4/
4
4/
18 5/
2
5/
16
5/
30
6/
13
6/
27
7/
11
7/
25 8/
8
8/
22
Week Ending Date
P
e
rc
e
n
t
P
o
s
it
iv
e
All Flu
Seasonal Flu
Novel Influenza A(H1N1)
Influenza % Positive
by Season (Week 18):
05-06: 8.70%
06-07: 6.75%
07-08: 4.38%
Internal Use Only (FIUO)---For Official Use Only (FOUO)
NOT FOR FURTHER DISTRIBUTION
-Sensitive But Unclassified (SBU) 13
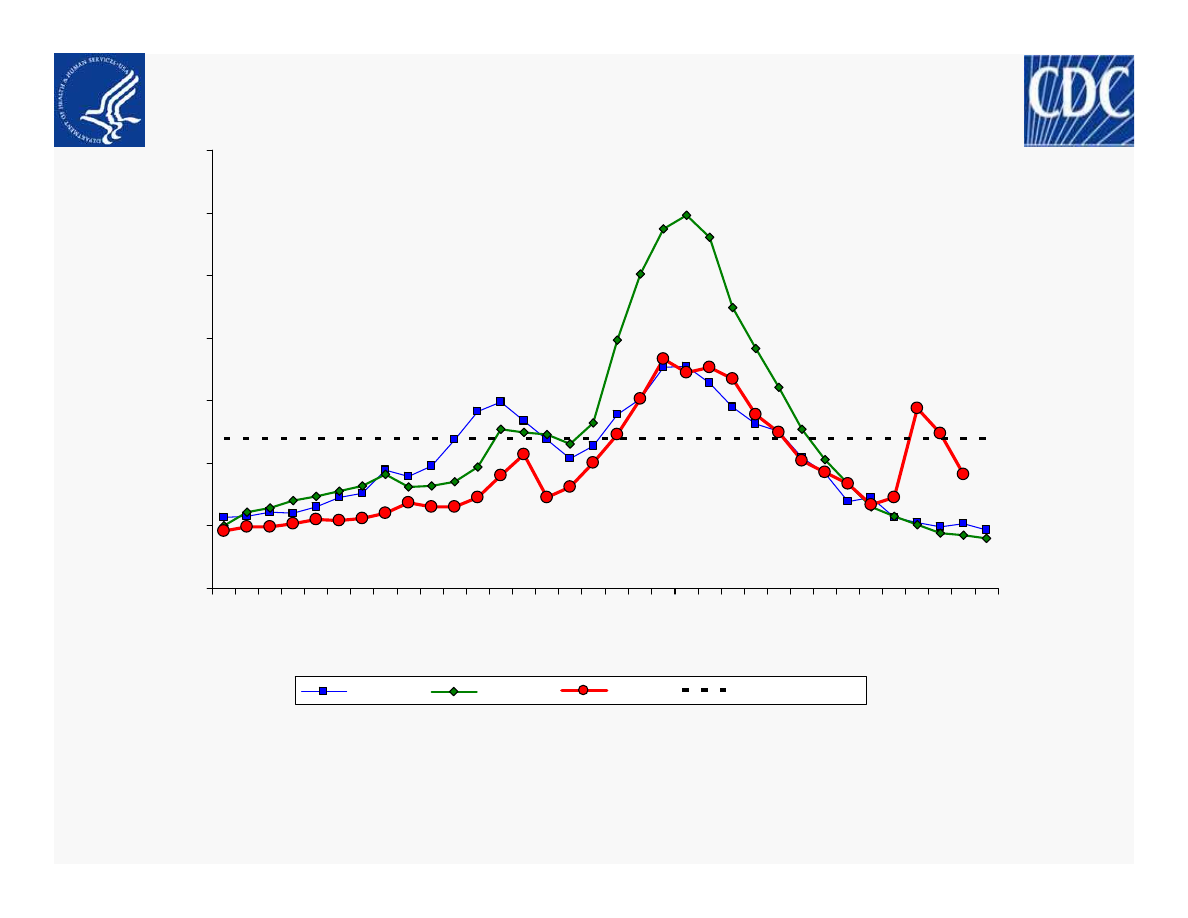
NOTE: Week ending dates vary by influenza season
*Preliminary ILI data for week 19, as of May 19, 2009 (n=667 weekly ILI reports received from 47 states)
† There was no week 53 during the 2006-07 and 2007-08 seasons, therefore the week 53 data point for those seasons is an average of weeks 52 and 1.
0
1
2
3
4
5
6
7
10
/4
10
/1
8
11
/1
11
/1
5
11
/2
9
12
/1
3
12
/2
7
1/
10
1/
24
2/
7
2/
21
3/
7
3/
21
4/
4
4/
18
5/
2
5/
16
Week Ending Dates
%
o
f
V
is
it
s
f
o
r
IL
I
2006-07†
2007-08†
2008-09
National Baseline
Epidemiology/Surveillance
Percentage of Visits for Influenza-like Illness (ILI) Reported by
the US Outpatient Influenza-like Illness Surveillance Network (ILINet),
National Summary 2008-09 and Previous Two Seasons
20 May 2009 1100 EDT
Internal Use Only (FIUO)---For Official Use Only (FOUO)
NOT FOR FURTHER DISTRIBUTION
-Sensitive But Unclassified (SBU) 14
Region II - NJ, NY
0
2
4
6
10
/4
10
/1
8
11
/1
11
/1
5
11
/2
9
12
/1
3
12
/2
7
1/
10
1/
24
2/
7
2/
21
3/
7
3/
21
4/
4
4/
18
5/
2
5/
16
Week Ending Dates
%
o
f
V
is
it
s
f
o
r
IL
I
Region III - DE, DC, MD, PA, VA, W V
0
1
2
3
4
5
6
7
8
10
/4
10
/1
8
11
/1
11
/1
5
11
/2
9
12
/1
3
12
/2
7
1/
10
1/
24
2/
7
2/
21
3/
7
3/
21
4/
4
4/
18
5/
2
5/
16
Week Ending Dates
%
o
f
V
is
it
s
f
o
r
IL
I
Region I - CT, ME, MA, NH, RI, VT
0
1
2
3
4
5
10
/4
10
/1
8
11
/1
11
/1
5
11
/2
9
12
/1
3
12
/2
7
1/
10
1/
24
2/
7
2/
21
3/
7
3/
21
4/
4
4/
18
5/
2
5/
16
Week Ending Dates
%
o
f
V
is
it
s
f
o
r
IL
I
NOTE: Scales differ between regions
NOTE: There was no week 53 during the 2006-07 and 2007-08 seasons, therefore the week 53 data point for those seasons is an average of weeks 52 and 1.
2006-07
2007-08
2008-09
Baseline
Epidemiology/Surveillance
Current Influenza Surveillance – ILINet Regions I-III
20 May 2009 1100 EDT
Internal Use Only (FIUO)---For Official Use Only (FOUO)
NOT FOR FURTHER DISTRIBUTION
-Sensitive But Unclassified (SBU) 15
Region IV - AL, FL, GA, KY, MS, NC, SC, TN
0
1
2
3
4
5
6
10
/4
10
/1
8
11
/1
11
/1
5
11
/2
9
12
/1
3
12
/2
7
1/
10
1/
24
2/
7
2/
21
3/
7
3/
21
4/
4
4/
18
5/
2
5/
16
Week Ending Dates
%
o
f
V
is
it
s
f
o
r
IL
I
Region V - IL, IN, MI, MN, OH, W I
0
2
4
6
10
/4
10
/1
8
11
/1
11
/1
5
11
/2
9
12
/1
3
12
/2
7
1/
10
1/
24
2/
7
2/
21
3/
7
3/
21
4/
4
4/
18
5/
2
5/
16
Week Ending Dates
%
o
f
V
is
it
s
f
o
r
IL
I
Region VI - AR, LA, NM, OK, TX
0
2
4
6
8
10
12
10
/4
10
/1
8
11
/1
11
/1
5
11
/2
9
12
/1
3
12
/2
7
1/
10
1/
24
2/
7
2/
21
3/
7
3/
21
4/
4
4/
18
5/
2
5/
16
Week Ending Dates
%
o
f
V
is
it
s
f
o
r
IL
I
NOTE: Scales differ between regions
NOTE: There was no week 53 during the 2006-07 and 2007-08 seasons, therefore the week 53 data point for those seasons is an average of weeks 52 and 1.
2006-07
2007-08
2008-09
Baseline
Epidemiology/Surveillance
Current Influenza Surveillance – ILINet Regions IV-VI
20 May 2009 1100 EDT
Internal Use Only (FIUO)---For Official Use Only (FOUO)
NOT FOR FURTHER DISTRIBUTION
-Sensitive But Unclassified (SBU) 16
Region X - AK, ID, OR, WA
0
2
4
6
8
10
10
/4
10
/1
8
11
/1
11
/1
5
11
/2
9
12
/1
3
12
/2
7
1/
10
1/
24
2/
7
2/
21
3/
7
3/
21
4/
4
4/
18
5/
2
5/
16
Week Ending Dates
%
o
f
V
is
it
s
f
o
r
IL
I
Region IX - AZ, CA, HI, NV
0
2
4
6
8
10
/4
10
/1
8
11
/1
11
/1
5
11
/2
9
12
/1
3
12
/2
7
1/
10
1/
24
2/
7
2/
21
3/
7
3/
21
4/
4
4/
18
5/
2
5/
16
Week Ending Dates
%
o
f
V
is
it
s
f
o
r
IL
I
Region VIII - CO, MT, ND, SD, UT, WY
0
1
2
3
4
5
10
/4
10
/1
8
11
/1
11
/1
5
11
/2
9
12
/1
3
12
/2
7
1/
10
1/
24
2/
7
2/
21
3/
7
3/
21
4/
4
4/
18
5/
2
5/
16
Week Ending Dates
%
o
f
V
is
it
s
f
o
r
IL
I
Region VII - IA, KS, MO, NE
0
2
4
6
8
10
/4
10
/1
8
11
/1
11
/1
5
11
/2
9
12
/1
3
12
/2
7
1/
10
1/
24
2/
7
2/
21
3/
7
3/
21
4/
4
4/
18
5/
2
5/
16
Week Ending Dates
%
o
f
V
is
it
s
f
o
r
IL
I
NOTE: Scales differ between regions
NOTE: There was no week 53 during the 2006-07 and 2007-08 seasons, therefore the week 53 data point for those seasons is an average of weeks 52 and 1.
2006-07
2007-08
2008-09
Baseline
Epidemiology/Surveillance
Current Influenza Surveillance – ILINet Regions VII-X
20 May 2009 1100 EDT
Internal Use Only (FIUO)---For Official Use Only (FOUO)
NOT FOR FURTHER DISTRIBUTION
-Sensitive But Unclassified (SBU) 17
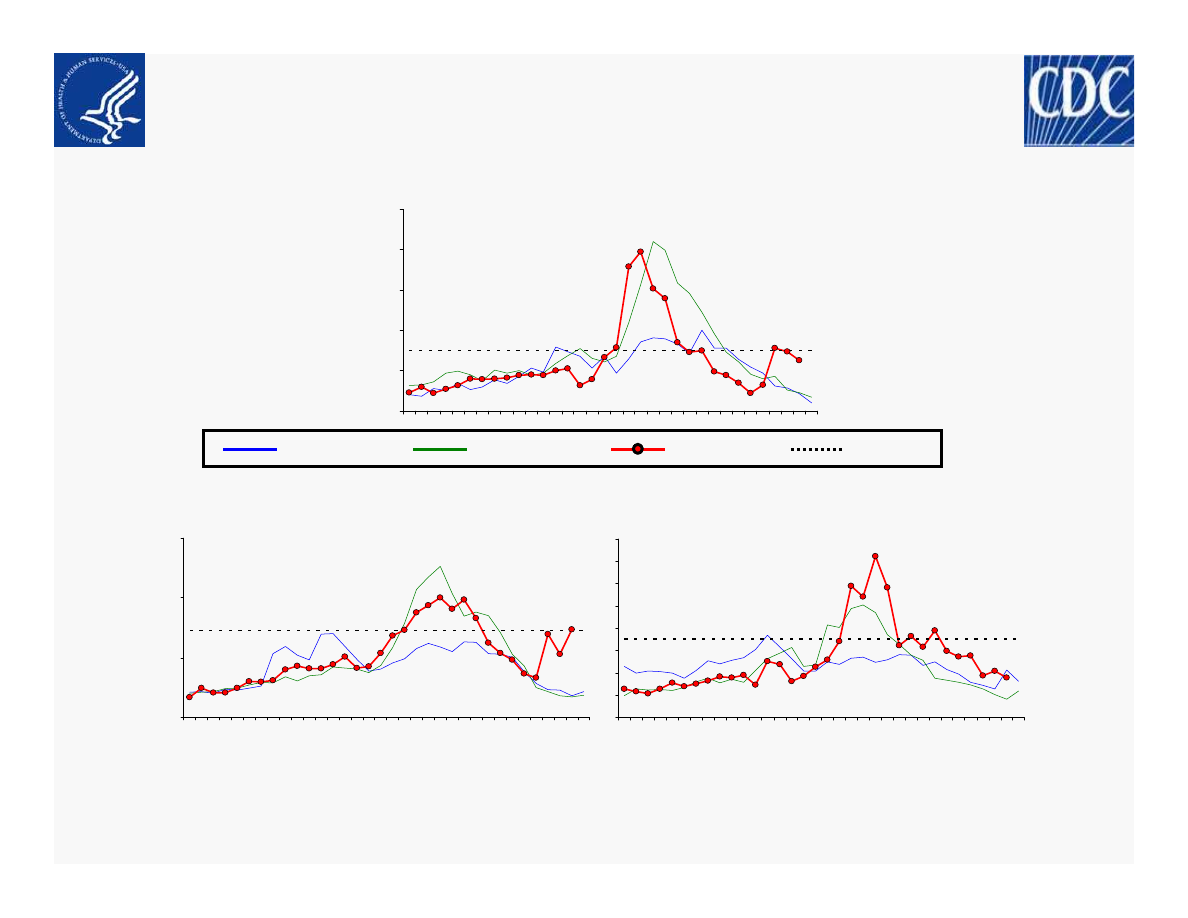
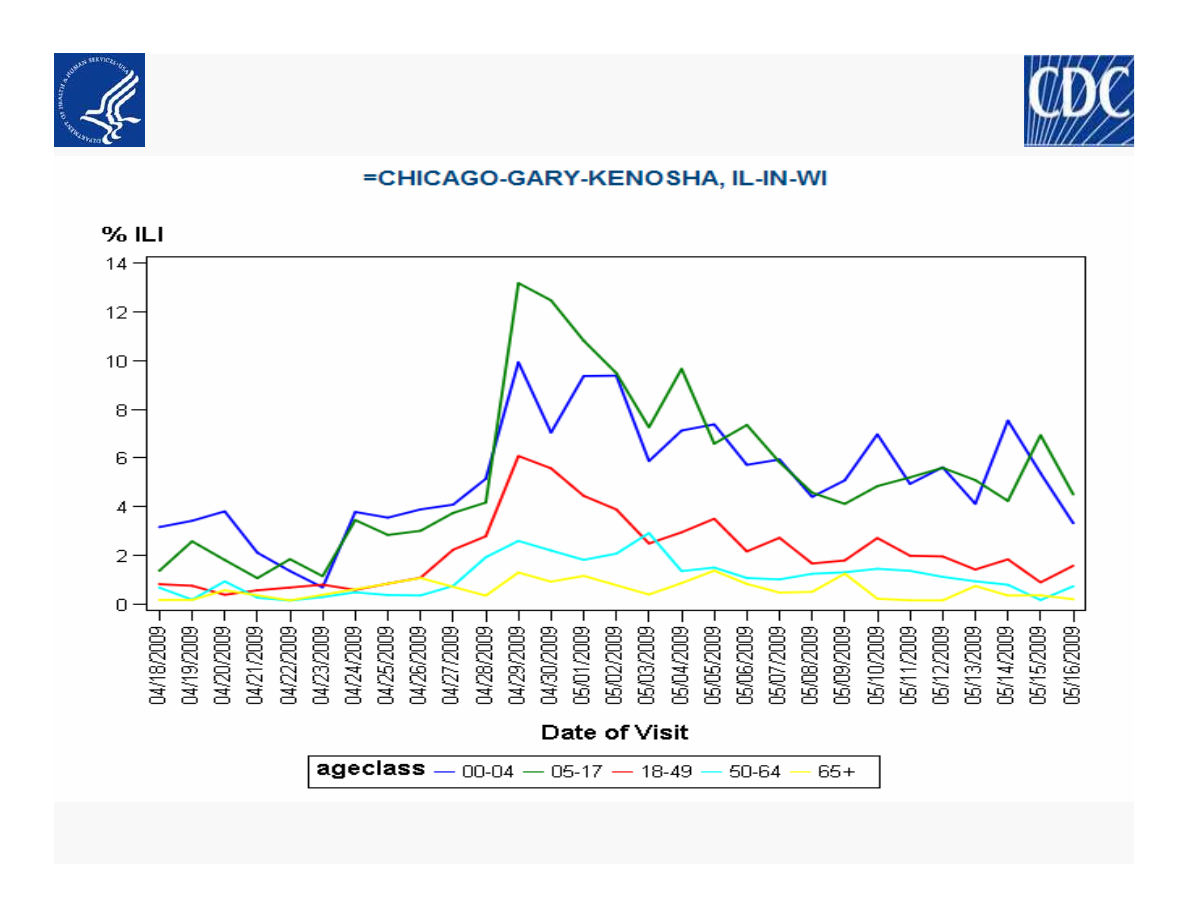
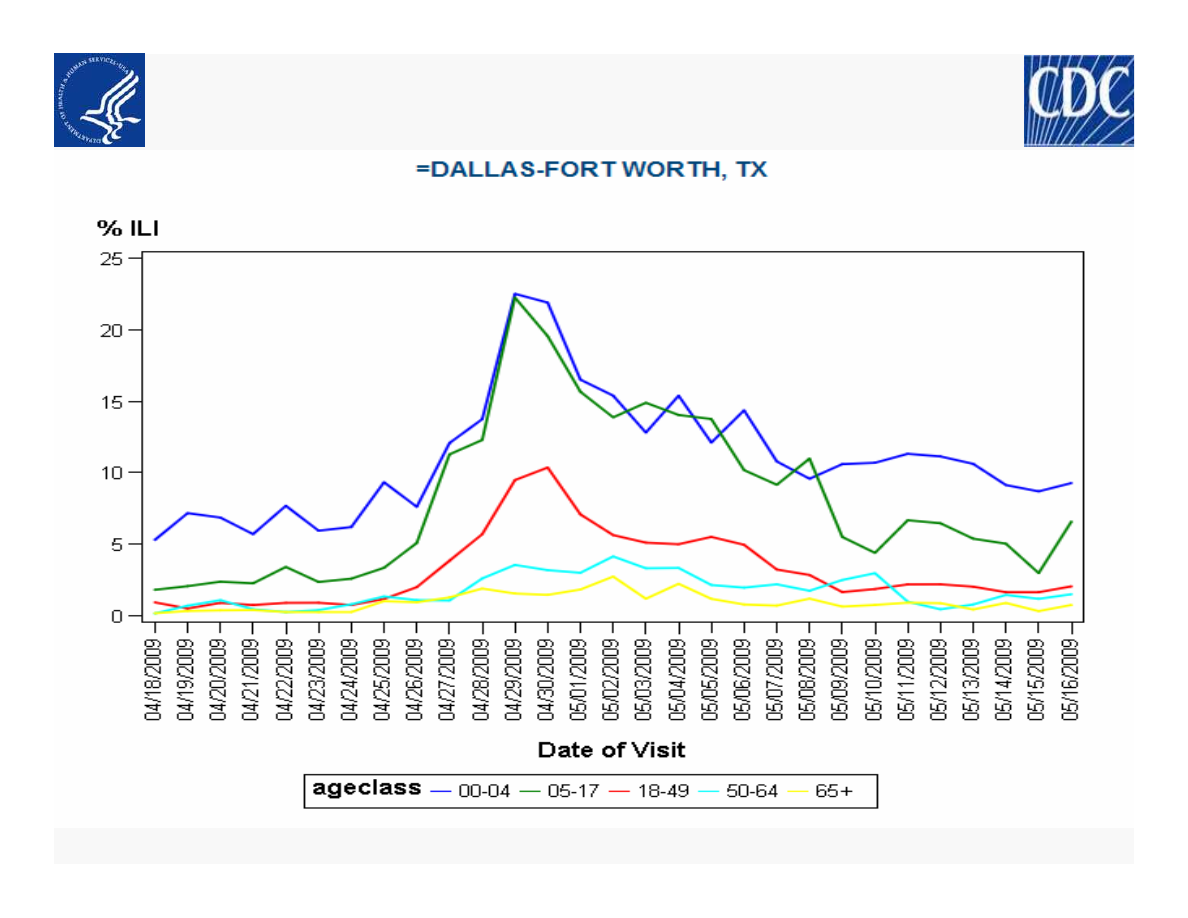
BioSense
% Patients Presenting With ILI as a Chief Complaint by Age
April 18-May 16, 2009
Internal Use Only (FIUO)---For Official Use Only (FOUO)
NOT FOR FURTHER DISTRIBUTION
-Sensitive But Unclassified (SBU) 18
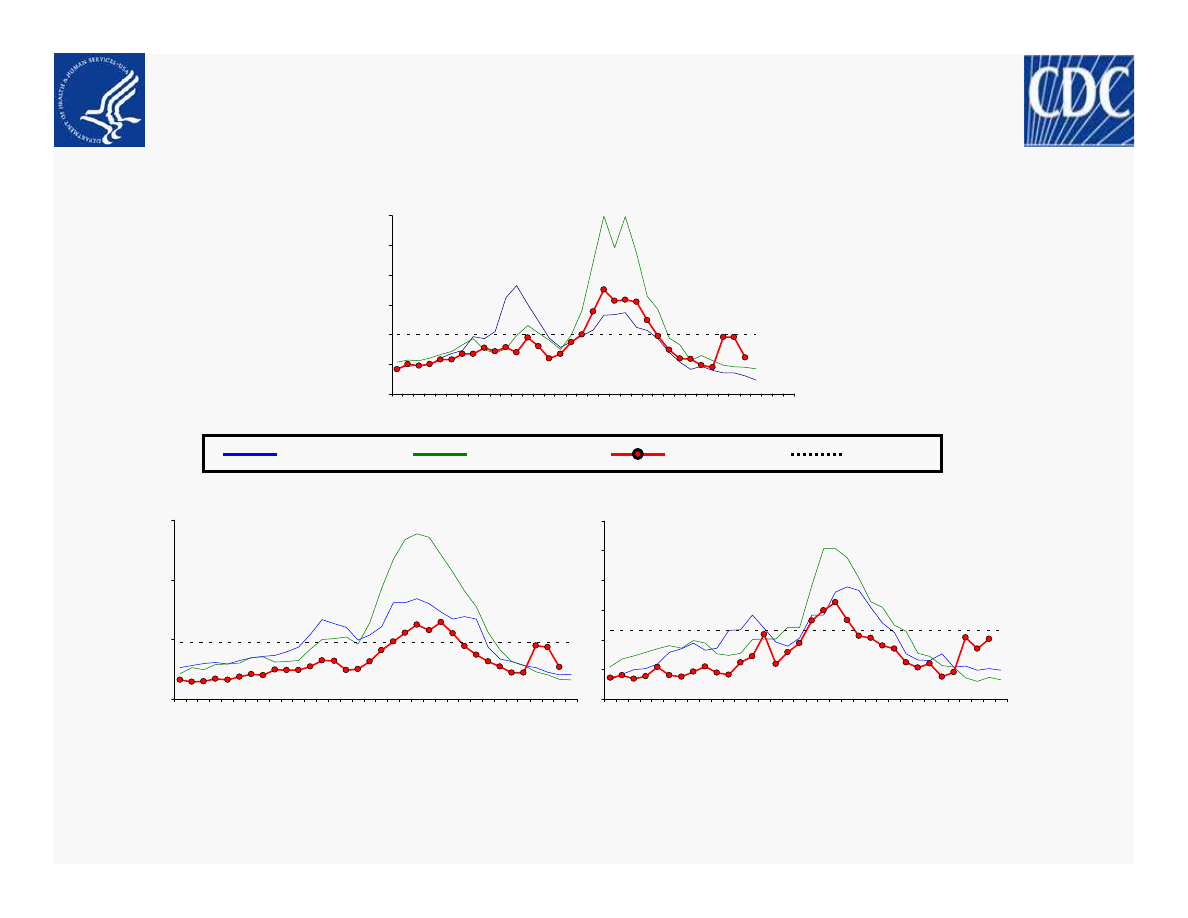
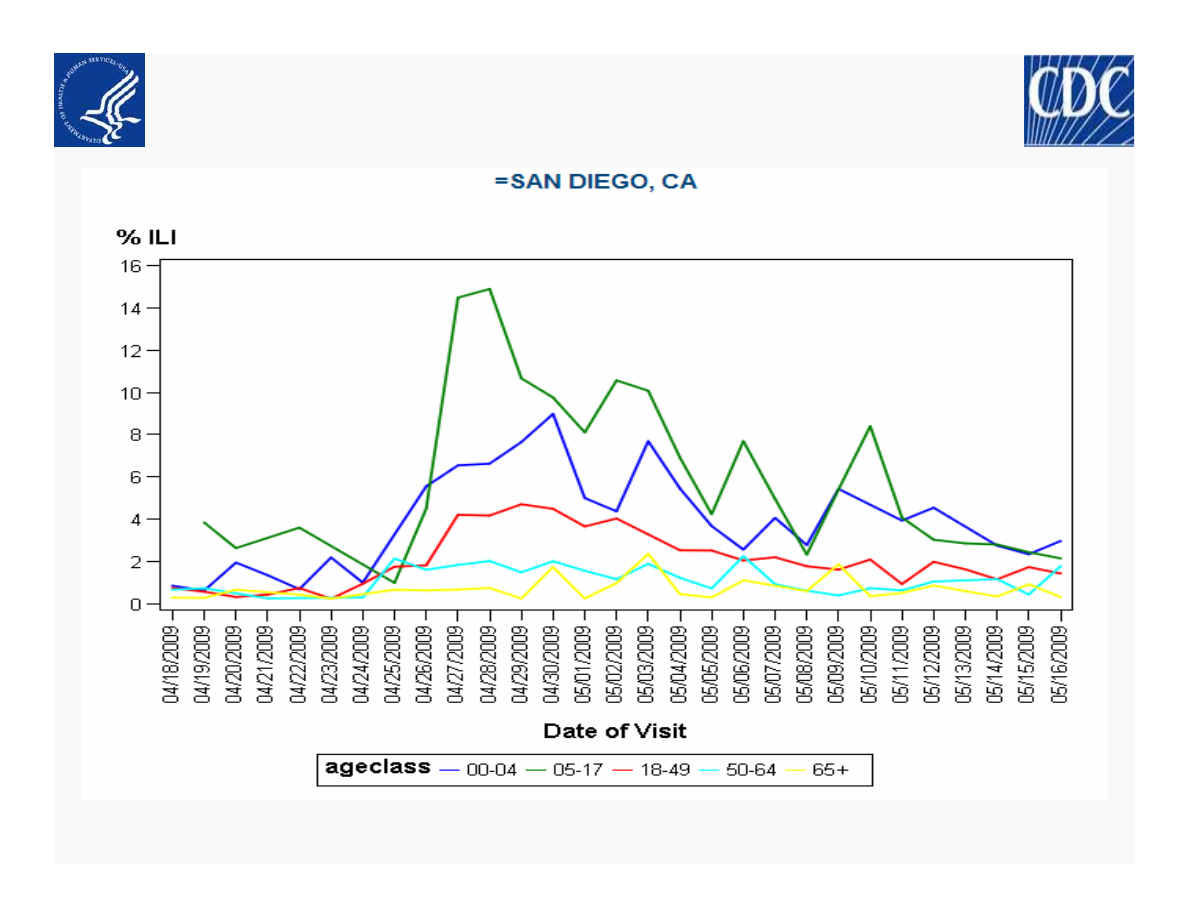
BioSense
% Patients Presenting With ILI as a Chief Complaint by Age
April 18-May 16, 2009
Internal Use Only (FIUO)---For Official Use Only (FOUO)
NOT FOR FURTHER DISTRIBUTION
-Sensitive But Unclassified (SBU) 19
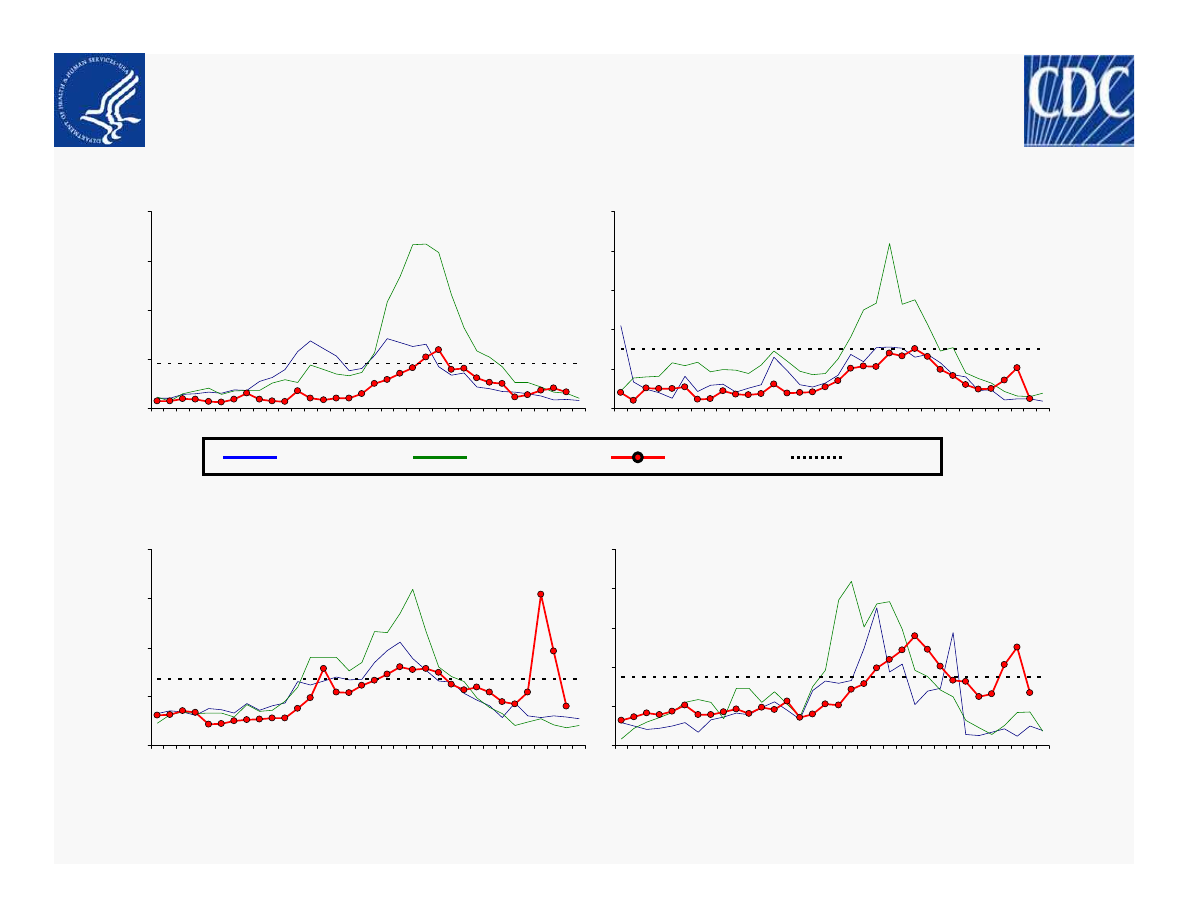
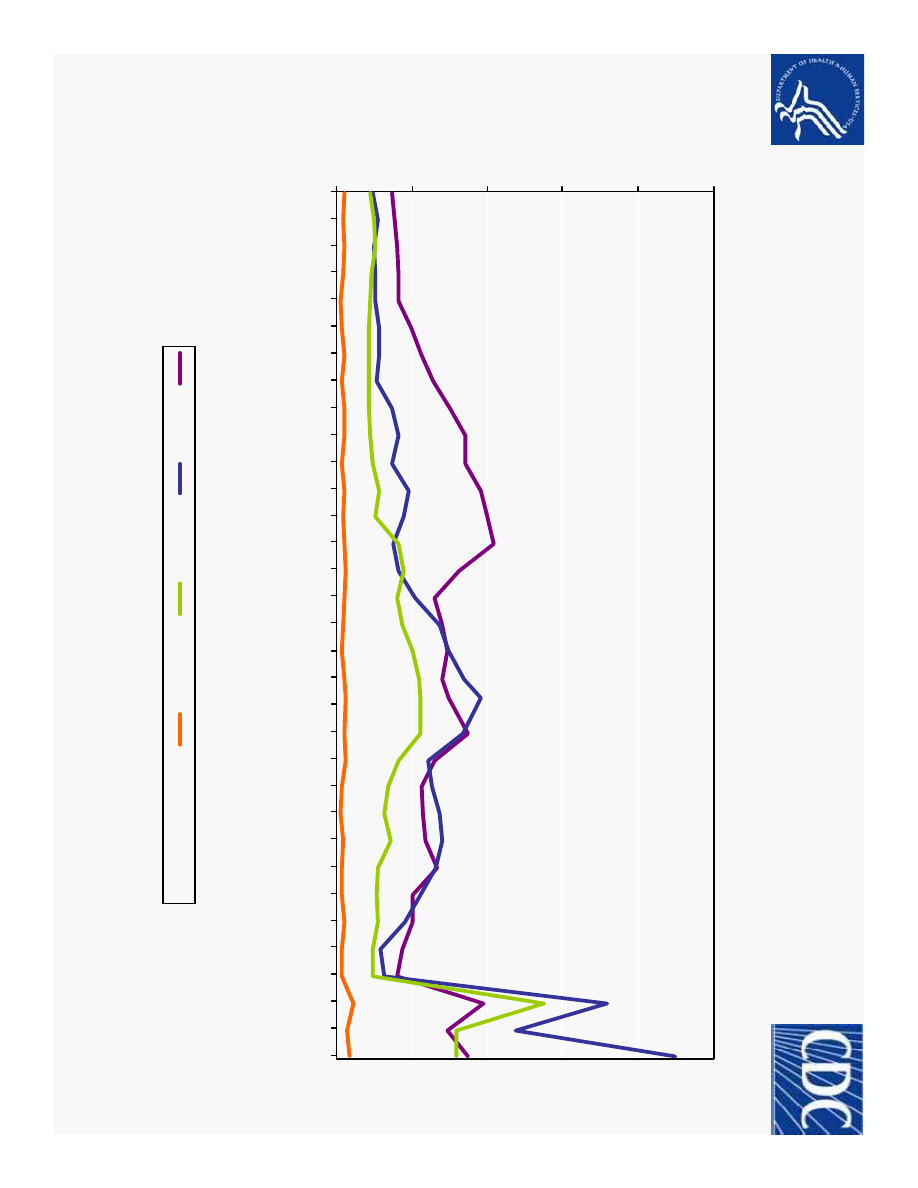
BioSense
% Patients Presenting With ILI as a Chief Complaint by Age
April 18-May 16, 2009
Internal Use Only (FIUO)---For Official Use Only (FOUO)
NOT FOR FURTHER DISTRIBUTION
-Sensitive But Unclassified (SBU) 20
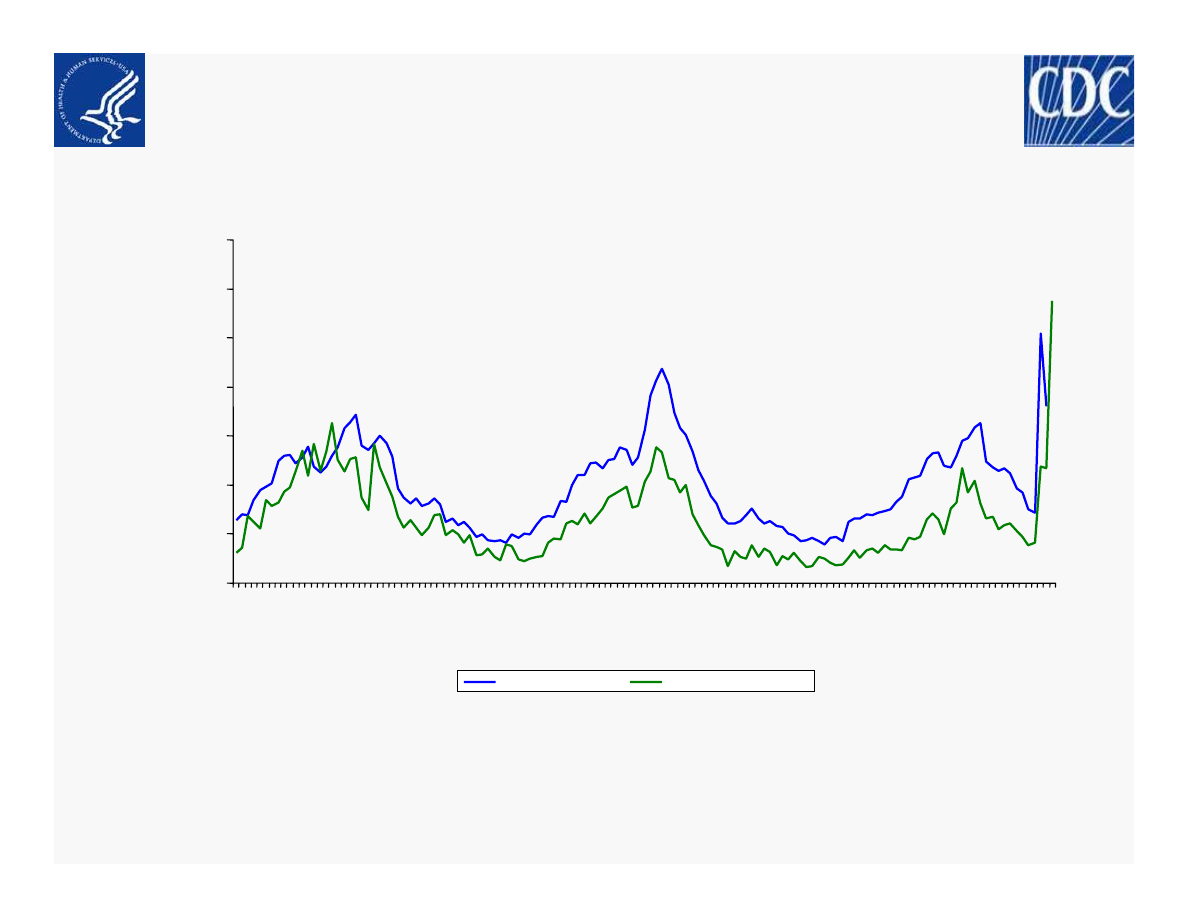
Epidemiology/Surveillance - Percentage of Visits for ILI
NYC ED and Other ILINet Providers, 2008-09 and Previous Two Seasons
20 May 2009 1100 EDT
*Consists of 50 ED sites across NYC; An average of 19 sites reporting each week from across NYC of various practice types (Family Practice,
Pediatrics, Internal Medicine, and Student Health)
0
1
2
3
4
5
6
7
20
06
40
20
06
44
20
06
48
20
06
52
20
07
04
20
07
08
20
07
12
20
07
16
20
07
20
20
07
24
20
07
28
20
07
32
20
07
36
20
07
40
20
07
44
20
07
48
20
07
52
20
08
04
20
08
08
20
08
12
20
08
16
20
08
20
20
08
24
20
08
28
20
08
32
20
08
36
20
08
40
20
08
44
20
08
48
20
08
52
20
09
03
20
09
07
20
09
11
20
09
15
20
09
19
Week
%
o
f
Vi
s
it
s
fo
r
IL
I
NYC ED Sites*
Other NYC Sites†
In
te
rn
a
l U
s
e
O
n
ly
(F
IU
O
)---F
o
r
O
ffi
c
ia
l U
s
e
O
n
ly
(
F
O
U
O
)
N
O
T
F
O
R
F
U
R
T
H
E
R
D
IST
R
IB
U
T
IO
N
-S
e
n
si
tive
B
u
t U
n
c
la
ss
ifie
d
(S
BU
)
2
1
Ep
id
e
mi
o
lo
g
y/
Su
rve
illa
n
ce
N
YC
ED
IL
I C
o
u
n
ts
b
y
Ag
e
G
ro
u
p
O
ct
2
0
0
8
-
M
a
y
1
6
, 2
0
0
9
2
0
Ma
y
2
0
0
9
1
1
0
0
ED
T
0
5
0
0
1
0
0
0
1
5
0
0
2
0
0
0
2
5
0
0
10/4/2008
10/11/2008
10/18/2008
10/25/2008
11/1/2008
11/8/2008
11/15/2008
11/22/2008
11/29/2008
12/6/2008
12/13/2008
12/20/2008
12/27/2008
1/3/2009
1/10/2009
1/17/2009
1/24/2009
1/31/2009
2/7/2009
2/14/2009
2/21/2009
2/28/2009
3/7/2009
3/14/2009
3/21/2009
3/28/2009
4/4/2009
4/11/2009
4/18/2009
4/25/2009
5/2/2009
5/9/2009
5/16/2009
w
e
e
k
# ILI
A
g
e
0
-4
A
g
e
5
-2
4
A
g
e
2
5
-6
4
A
g
e
6
5
a
n
d
o
ld
e
r

Internal Use Only (FIUO)---For Official Use Only (FOUO)
NOT FOR FURTHER DISTRIBUTION
-Sensitive But Unclassified (SBU) 22
International
Novel Influenza A (H1N1) - 20 May 2009 1100 EDT
•
WHO global case count: 10,243 confirmed cases in 41 countries*
– New countries with confirmed cases: Greece
– Countries with highest confirmed case count after the US and
Mexico:
• Canada: 496 (=)
Japan: 210 ( 51)
• Spain: 107 ( 4)
UK: 102 ( 1)
•
Increases in case counts expected in countries receiving CDC PCR
kits as testing capabilities are improved
*Note: WHO case counts are current as of 05/20/09, 9:00 am EDT
Internal Use Only (FIUO)---For Official Use Only (FOUO)
NOT FOR FURTHER DISTRIBUTION
-Sensitive But Unclassified (SBU) 23
55,765
169,000
245,449
329,834
468,282
369,237
197,985
118,033
61,697
11,794
17,663
4,838
0
0
100,000
200,000
300,000
400,000
500,000
4/29 4/30 5/1
5/4
5/5
5/6
5/7
5/8 5/11 5/12 5/15 5/18 5/19
Date
N
u
m
b
e
r
o
f
S
tu
d
e
n
ts
Source: ED and CDC Confirmed School Closing Reports released each weekday at 2:00pm.
Division of Global Migration and Quarantine
Novel Influenza A (H1N1)
Students Dismissed by Date (ED as of 1400 EDT 19 May 2009)
19 May 2009: 24
schools closed due to
H1N1 in 5 states
NH, NY (n=18), PA, TX,
and WI.
Internal Use Only (FIUO)---For Official Use Only (FOUO)
NOT FOR FURTHER DISTRIBUTION
-Sensitive But Unclassified (SBU) 24
Communications Summary
Novel Influenza A (H1N1) - 20 May 2009 1100 EDT
Themes
• 2 deaths linked to H1N1: St. Louis man and 16-month old boy in NYC
• School closings in NYC
• WHO meeting vaccine development
–“proving much tougher than expected”; taking “longer than expected”; now “delayed”
• Nations urge WHO to change criteria, consider severity not just spread
Emerging Themes
• Controversy over change in school closing guidelines,
–NYC: “Guidelines did not call for that school to be closed and public is upset…school
should have been closed sooner”
–Schools across the country continue to close
–Strong local reaction to deaths in the community: NYC hospitals -- seeing hundreds
more people than usual
1,216,785
547,371
512,254
927,305
Web
189
212
114
109
News Stories Print/Internet
510
178
188
380
Public Inquiries
5/19 Tue
5/18 Mon
5/17 Sun
5/16 Sat
Channel Traffic
Wyszukiwarka
Podobne podstrony:
us cdc swine flu 26 may 2009
us cdc swine flu 12 may 2009
us cdc swine flu 11 may 2009
us cdc swine flu 19 may 2009
us cdc swine flu 25 may 2009
us cdc swine flu 18 may 2009
us cdc swine flu 27 may 2009
us cdc swine flu 5 jun 2009
us cdc swine flu 9 jun 2009
us dia swine flu 2009
minnesota mls swine flu testing 2009
Pierwsi turyści od upadku Husajna (20 03 2009)
0108 20[1].04.2009, II rok, II rok CM UMK, Histologia i cytofizjologia, histologia, Histologia, His
kpk, ART 538 KPK, I KZP 1/09 - postanowienie składu 7 sędziów z dnia 20 października 2009 r
MPLP 270 20.12.2009, lp
6. Sens Cierpienia (20.01.2009)
Dialysis students 20[1] 04 2009
Informatyka, egzam Tomczewski 20.06.2009
Część 3. Postępowanie egzekucyjne, ART 1026 KPC, III CZP 87/09 - z dnia 20 listopada 2009 r
więcej podobnych podstron