
Eur. Phys. J. B 38, 269–276 (2004)
DOI: 10.1140/epjb/e2004-00119-8
T
HE
E
UROPEAN
P
HYSICAL
J
OURNAL
B
Immunization and epidemic dynamics in complex networks
N. Madar
1
, T. Kalisky
1
, R. Cohen
1,2,a
, D. ben-Avraham
3
, and S. Havlin
1
1
Minerva Center and Department of Physics, Bar-Ilan University, Ramat-Gan, 52900, Israel
2
Department of Computer Science and Applied Mathematics, Weizmann Institute of Science, Rehovot 76100, Israel
3
Department of Physics, Clarkson University, Potsdam NY 13699-5820, USA
Received 3 November 2003
Published online 14 May 2004 – c
EDP Sciences, Societ`a Italiana di Fisica, Springer-Verlag 2004
Abstract. We study the behavior of epidemic spreading in networks, and, in particular, scale free networks.
We use the Susceptible–Infected–Removed (SIR) epidemiological model. We give simulation results for
the dynamics of epidemic spreading. By mapping the model into a static bond-percolation model we
derive analytical results for the total number of infected individuals. We study this model with various
immunization strategies, including random, targeted and acquaintance immunization.
PACS. 02.50.Cw Probability theory – 02.10.Ox Combinatorics; graph theory – 89.20.Hh World Wide
Web, Internet – 64.60.-i General studies of phase transitions
1 Introduction
The study of epidemic spreading is based upon the notion
that a disease is conveyed by contact between an infected
individual and an uninfected individual who is susceptible
to the disease. An endemic stage is reached if a finite frac-
tion of the population is infected. Similarly, this notion
may describe the spreading of a computer virus through
a network of computers. Recently, it has been shown that
in a class of scale free networks an epidemic may spread
regardless of how low is its rate of infection [1–3].
An extensive research was dedicated to the subject
of attacks on networks [4–7], by targeting individuals ei-
ther randomly or by intentionally. In particular, the Inter-
net and the WWW were shown to be robust to random
breakdowns and fragile to intentional attacks, due to their
scale-free distribution of nodes. However, these studies fo-
cused on the results of damaging computers by an outside
source, and did not take into account the possibility of
a propagation of a problem throughout the connections
amongst the computers themselves, in a way similar to a
spreading of a disease. The application of network stabil-
ity to immunization has been studied in [8], and the effect
of partial information has been studied in [9].
Several models have been proposed for epidemic dy-
namics, differing in the disease stages, the dynamical pa-
rameters, and the underlying structure of contacts. The
most common models for the disease dynamics are the
SIR, SIS and SIRS models, which represent the develop-
ment of each individual’s disease in a network. In this
paper we will focus on the SIR model, where an infected
individual is infective for some period of time, and then
a
e-mail: cohenr@shoshi.ph.biu.ac.il
is recovered and can no longer be infected by the disease.
For a general introduction to epidemiology, see [10].
Another issue regarding the model used is the underly-
ing network topology. The network of (possible) contacts
between individuals determines which individuals can in-
fect each other. In general, this network may also be dy-
namic and change during the spread of the disease. We
will assume that the network is static during the epidemic
outbreak. We will also assume that the network is sparse,
i.e., that the number of links is proportional to the num-
ber of individuals. We will focus on scale free network
topologies.
Moreover, we will also allow a fraction of the individ-
uals to be immunized, i.e., these individuals can not be
infected. When a vaccination for a disease exists, immu-
nizing certain individuals against being infected by a dis-
ease as a preemptive method may be the most efficient
way to prevent loss of time and funds (and, of course,
suffering, when dealing with infected people) due to the
disease. Obviously, immunization of the entire population
will eradicate the disease entirely, but this is not always
possible, or may involve high costs and effort. Therefore,
the choice of which individuals to immune is an impor-
tant step in the immunization process, and may increase
the efficiency of the immunization strategy.
2 Epidemic dynamics
A contagious disease may turn into an epidemic, if the
number of infected (sick) individuals is of the order of the
number of individuals in the whole system. When there are
no more sick individuals in the system (only susceptible

270
The European Physical Journal B
left, and the others are removed), we may say that the
disease is cured.
In many cases, an epidemic is indeed being cured. The
main consideration therefore should be how much time is
required for the system to reach such a stage, and how
many individuals are being infected throughout the pro-
cess. If both the time of the contagious period and the
number of people exposed to it can be reduced, then the
amount of suffering and loss of resources can be reduced
as well.
2.1 The SIR model
The SIR model represents the development of a disease
in a network of connected individuals. S stands for the
susceptible stage, where the individual is healthy. I stands
for the infected stage, where the individual is infected with
the disease and can infect other individuals in contact with
it. R is the removed stage, where the individual is either
recovered and has acquired immunization to the disease
or otherwise permanently removed from the system.
In our numerical simulations all the individuals (ver-
tices) are at first susceptible, i.e., they are all healthy and
none of them is immuned to the disease. One vertex, cho-
sen randomly, is being infected. At each time step, every
susceptible neighbor of an infected vertex has a probabil-
ity of becoming infected itself, and each infected vertex
has a probability to be removed from the system. We as-
sume here that both probabilities (infection and removal)
are the same for each vertex and its neighbors (networks
having different probabilities for each vertex are studied
in [3]).
2.2 The SIR model as bond percolation
One of the nicest features of the SIR model is that de-
spite it being a dynamic model it can be mapped into a
completely static one [3, 11, 12]. Consider a network where
each node transmits the epidemic to each of its neighbors
with rate
r, and is removed with average recovery time τ.
The infection can be, therefore, considered as a Poisson
process, with average
rτ. Thus, the probability for each
neighbor not to be infected is e
−rτ
.
The outcome of this process is therefore the same as
bond percolation, in which each directed link is occupied
with probability
p
b
= 1
− e
−rτ
. If
r and τ have the same
value for each node, the network can be taken to be non-
directed. While information on the epidemic dynamics is
lost by this description, the critical threshold for the dy-
namic model can be deduced from the bond percolation
problem. Furthermore, the total fraction of infected indi-
viduals in the endemic state is the same as the size of the
giant component of the percolation model, and the prob-
ability of a single disease event to decay before reaching
the endemic state equals the fraction of finite components
in the percolation networks.
To find the threshold for bond percolation in networks
one should consider the average number of links outgoing
from a site which is, in itself, reached by following a link.
This is similar to the course of the epidemic. If an infected
individual infects, on average, at least one other individ-
ual, then the epidemic can reach an endemic state. Since
a site can be reached by one of its
k links, its probability
of being reached is
kP (k)/(Nk), where N is the num-
ber of nodes,
P (k) is the fraction of nodes having degree
(number of links)
k, and k =
k
kP (k) denotes the av-
erage degree of nodes in the network. The probability of
each of its
k − 1 outgoing links of infecting its neighbor
is
p
b
. Since the network is randomly connected, as long
as the epidemic is not spread yet, the average number of
influenced neighbors is:
n
i
= p
b
k
P (k)k(k − 1)
k
.
(1)
Therefore, an endemic state can be reached only if
n
i
>
1, leading to [5, 6]
k
2
k
− 1
> p
−1
b
.
(2)
From this expression it can easily be seen that scale free
networks, with degree distribution
P (k) ∼ k
−γ
, with
γ ≤ 3, having a divergent second moment, undergo
the transition only at
p
b
→ 0 [5,6]. That is, an epi-
demic can spread in this network regardless of how small
the infection probability and how quick is the recovery
process [1, 2].
3 Immunization
In general immunization can be seen as a site percolation
problem. Each immunized individual can be regarded as
a site which is removed from the network. The goal of the
immunization process is to pass (or at least approach) the
percolation threshold, leading to minimization of the num-
ber of infected individuals. The complete model of SIR and
immunization can be considered as a site–bond percola-
tion model, and the immunization is considered successful
if the network is below the percolation threshold.
It is well established that immunization of randomly
selected individuals requires immunizing a very large frac-
tion
f of the population, in order to arrest epidemics
that spread upon contact between infected individuals
[1, 4, 5, 10, 13–15]. Many diseases require 80%–100% immu-
nization. For example, Measles requires 95% of the pop-
ulation to be immunized [10]. The same is correct for
the Internet, where stopping computer viruses requires al-
most 100% immunization [1, 4, 5, 16]. On the other hand,
targeted immunization of the most highly connected in-
dividuals [4, 6–8, 10, 17], while effective, requires global in-
formation about the network in question, rendering it im-
practical in many cases. Here, we develop a mathematical
model and propose an effective strategy, based on the im-
munization of a small fraction of random acquaintances
of randomly selected nodes. In this way, the most highly
connected nodes are immunized, and the process prevents

N. Madar et al.: Immunization and epidemic dynamics in complex networks
271
epidemics with a small finite immunization threshold and
without requiring specific knowledge of the network.
3.1 Random immunization
Social networks are known to possess a broad distribution
of the number of links (contacts),
k, emanating from a
node (an individual) [18–22]. Examples are the web of sex-
ual contacts [23], movie-actor networks, science citations
and cooperation networks [24, 25] etc. Computer networks,
both physical (such as the Internet [26]) and logical (such
as the WWW [27], e-mail [28] and trust networks [29])
are also known to possess wide, scale-free, distributions.
Studies of percolation on broad-scale networks show that
a large fraction
f
c
of the nodes need to be removed (im-
munized) before the integrity of the network is compro-
mised. This is particularly true for scale-free networks,
P (k) = ck
−γ
(
k ≥ m), where 2 < γ < 3 — the case
of most known networks [18–20] — where the percolation
threshold
f
c
→ 1, and the network remains connected
(contagious) even after removal of most of its nodes [5]. In
other words, with a random immunization strategy almost
all of the nodes need to be immunized before an epidemic
is arrested (see Fig. 1).
To calculate the immunization threshold, one should
consider the site–bond percolation model. The considera-
tions are the same as for the epidemic threshold (Eq. (2)),
with the exception that a site may also be immunized, in
which case it can not propagate the disease. This adds
another factor of
p
s
= 1
− f, the probability that a site is
not immunized, to the calculation. Leading to
k
2
k
− 1
> (p
s
p
b
)
−1
.
(3)
As can be seen, in this case as well, the epidemic will only
be arrested if
p
b
p
s
→ 0, meaning that for every epidemic
almost the entire population must be immunized in order
to prevent the epidemic spreading.
3.2 Targeted immunization
When the most highly connected nodes are targeted first,
removal of just a small fraction of the nodes results in the
network’s disintegration [4, 6, 7]. This has led to the sug-
gestion of targeted immunization of the HUBs (the most
highly connected nodes in the network) [8, 9].
The simplest targeted immunization strategy calls for
the immunization of the most highly connected individ-
uals. To use this approach, the number of connections of
each individual should be known (at least approximately
– see [9]). In this case, the probability that a site is not
immunized, when the immunization rate is
f, is θ
f
(
k),
where,
θ
f
(
k) =
1
, k < k
∗
,
c, k = k
∗
,
0
, k > k
∗
,
(4)
and
k
∗
and 0
< c ≤ 1 are determined by the condition
k
P (k)θ
f
(
k) = 1 − f .
(5)
To find the critical immunization threshold using this
strategy, one can again find the fraction giving, on average,
one outgoing infective link per infected individual. this
amounts to the demand:
k
k(k − 1)P (k)θ
f
c
(
k)
k
=
p
−1
b
.
(6)
Solving equation (6) in conjunction with equation (5) al-
lows the calculation of the exact immunization threshold.
The implications of partial knowledge of the node degrees,
leading to functions other than
θ
f
(
k), were studied in [9].
3.3 Acquaintance immunization
3.3.1 Description
One problem with the targeted immunization approach is
that it requires a complete, or at least fairly good knowl-
edge of the degree of each node in the network. Such global
information often proves hard to gather, and may not even
be well-defined (as in social networks, where the number
of social relations depends on subjective judging). The ac-
quaintance immunization strategy proposed herein works
at low immunization rates,
f, and obviates the need for
global information.
In our approach [30], we choose a random fraction
p
of the
N nodes and look for a random acquaintance with
whom they are in contact (thus, the strategy is purely
local, requiring minimal information about randomly se-
lected nodes and their immediate environments ). The ac-
quaintances, rather than the originally chosen nodes, are
the ones immunized. The fraction
p may be larger than
1, for a node might be queried more than once, on aver-
age, while the fraction of nodes immunized
f is always less
than or equal to 1.
3.3.2 Analysis
Suppose we apply the acquaintance strategy on a random
fraction
p of the network. The critical fractions, p
c
and
f
c
,
needed to stop the epidemic can be analytically calculated.
In each event, the probability that a particular node with
k contacts is selected for immunization is kP (k)/(Nk)
[6, 5]. This quantifies the known fact that randomly se-
lected acquaintances have, on average, a higher degree
than randomly selected nodes [31, 32].
Suppose we follow some possible branch in the course
of the epidemic, starting from a random link of the span-
ning cluster. That is, we study the possible spread of the
epidemic by considering nodes that are not immunized,
and therefore are susceptible to the epidemic that may
become infected. In some layer (hop-distance from the

272
The European Physical Journal B
starting point),
l, we have n
l
(
k
) nodes of degree
k
. In
the next layer (
l + 1) each of those nodes has k
− 1 new
neighbors (excluding the one through which we arrived).
Let us denote the event that a node of degree
k is suscep-
tible to the disease (not immunized, and therefore may
be infected through the course of epidemic spreading) by
s
k
. To find out the number of nodes,
n
l+1
(
k), of degree
k that are susceptible and are reached in the course of
the epidemic, we multiply the number of links going out
of the
lth layer by the probability of reaching a node of
degree
k through following a link from a susceptible node,
p(k|k
, s
k
). Then, we multiply by the probability that this
node is also susceptible given both the node and the neigh-
bor’s degrees, and the fact that the neighbor is also sus-
ceptible,
p(s
k
|k, k
, s
k
). Since below and at the critical
percolation threshold loops are irrelevant [5], one can ig-
nore them for the calculation of the threshold. Therefore,
n
l+1
(
k) = p
b
k
n
l
(
k
)(
k
− 1)p(k|k
, s
k
)
p(s
k
|k, k
, s
k
)
.
(7)
By using Bayes’ rule:
p(k|k
, s
k
) =
p(s
k
|k, k
)
p(k|k
)
p(s
k
|k
)
.
(8)
Assuming that the network is uncorrelated (no degree-
degree correlations), the probability
φ(k) of reaching a
node with degree
k via a link is independent of k
:
φ(k) ≡ p(k|k
) =
kP (k)/k .
(9)
(A study of cases where correlations exists can be found
in [3, 33, 34].)
A random site (of degree
k
) is selected in each step
with probability 1
/N. The probability of being redirected
to a specific acquaintance is 1
/k
. Thus, the probability
that the acquaintance is not selected in one particular at-
tempt, is 1
−1/(Nk
), and in all
Np vaccination attempts,
it is
ν
p
(
k
)
≡
1
−
1
Nk
Np
≈ e
−p/k
.
(10)
If the neighbor’s degree is not known, the probability is
ν
p
≡ ν
p
(
k), where the average (and all averages hence-
forth) is taken with respect to the probability distribution
φ(k). In general, the probability that a node with degree
k is susceptible is p(s
k
|k) = e
−p/k
k
, if no other informa-
tion exists on its neighbors. If the degree of one neighbor
(which is the one through which the epidemic propagated)
is known to be
k
:
p(s
k
|k, k
) =
e
−p/k
× e
−p/k
k−1
. Since
the fact that a neighbor with a known degree is immunized
does not provide any further information about a node’s
probability of immunization, it follows that
p(s
k
|k, k
) =
p(s
k
|k, k
, s
k
). Using the above equations one obtains:
p(k
|k, s
k
) =
φ(k
)
e
−p/k
e
−p/k
.
(11)
Substituting these results in (7) yields:
n
l+1
(
k) = p
b
ν
k−2
p
φ(k)e
−p/k
k
n
l
(
k
)(
k
− 1)e
−p/k
.
(12)
Since the sum in (12) does not depend on
k
, it leads
to the stable distribution of degree in a layer
l: n
l
(
k) =
a
l
ν
k−2
p
φ(k)e
−p/k
, for some
a
l
. Substituting this into (12)
yields:
n
l+1
(
k) = n
l
(
k)p
b
k
φ(k
)(
k
− 1)ν
k
−2
p
e
−2p/k
. (13)
Therefore, if the sum is larger than 1 the branching pro-
cess will continue forever (the percolating phase), while if
it is smaller than 1 immunization is sub-critical and the
epidemic is arrested. Thus, we obtain a relation for
p
c
:
k
φ(k)(k − 1)ν
k−2
p
c
e
−2p
c
/k
=
p
−1
b
,
(14)
where the case
p
b
→ 1 corresponds to full immunization,
i.e. stopping the epidemic regardless of its infection rate.
The fraction of immunized nodes is easily obtained
from the fraction of nodes which are not susceptible,
f
c
= 1
−
k
P (k)p(s
k
|k) = 1 −
k
P (k)ν
k
p
c
,
(15)
where
P (k) is the regular distribution, and p
c
is found nu-
merically using equation (14). The term
ν
k−2
p
c
in equation
(14) induces an exponential cutoff on the degree distri-
bution of susceptible nodes for 0
< ν
p
c
< 1. Therefore,
the sum in equation (14) becomes finite for some finite
ν
p
c
> 0. Substituting this into equation (15) indicates that
f
c
= 1, and is finite even in the thermodynamic limit.
A related immunization strategy calls for the immu-
nization of acquaintances referred to by at least
n nodes.
(Above, we specialized to
n = 1.) The threshold is lower
the larger
n is, and may justify, under certain circum-
stances, this somewhat more involved protocol.
To analyze the threshold for the double acquaintance
(
n = 2) case, we should replace the probabilities for sus-
ceptibility with the appropriate probabilities considering
the fact that a node is immunized only if 2 of its contacts
point at it. Since the process is a Poisson process (in the
limit of large
N), the probabilities are:
p(s
k
|k, k
) =
e
−p/k
e
−p/k
k−2
(16)
×
pe
−p/k
k
(k − 1) + e
−p/k
1 +
p
k
,
and
p(s
k
|k) = e
−p/k
k−1
pe
−p/k
k
k + e
−p/k
.
(17)
We will use the notation
ν
p
≡ e
−p/k
and µ
p
≡
pe
−p/k
/k. Using Bayes’ rule as before and substituting
into equation (7), one obtains
n
l+1
(
k) = p
b
k
n
l
(
k
)
φ(k)e
−p/k
e
−p/k
ν
p
k−3
(18)
×
(k
−1)
[
(k
−1)µ
p
+
(
1+
p
k
)
ν
p
][
(k−1)µ
p
+
(
1+
p
k
)
ν
p
]
ν
p
+k
µ
p
.
N. Madar et al.: Immunization and epidemic dynamics in complex networks
273
It can now be seen that the kernel of equation (18) is
separable into three functions
n
l
(
k) = φ(k)ν
p
k−3
e
−p/k
a
l
+
b
l
k +
c
l
k
.
(19)
Substituting this back into equation (18) leads to the ma-
trix notation
a
l+1
b
l+1
c
l+1
= p
b
k
φ(k
)(
k
− 1)e
−2p/k
ν
p
k
−3
ν
p
+
k
µ
p
M
a
l
b
l
c
l
,
(20)
where
M is the matrix:
M =
A
p
(
k
)
k
A
p
(
k
)
A
p
(k
)
k
µ
p
B
p
(
k
)
k
µ
p
B
p
(
k
)
µ
p
B
p
(k
)
k
pν
p
C
p
(
k
)
k
pν
p
C
p
(
k
)
pν
p
C
p
(k
)
k
,
(21)
and we have used the definition
B
p
(
k
)
≡ ν
p
+
k
µ
p
− µ
p
,
C
p
(
k
)
≡ ν
p
−µ
p
+
ν
p
p
k
and
A
p
(
k
)
≡ C
p
(
k
)
B
p
(
k
)+
pµ
p
ν
p
.
Since this is a branching process, it is controlled by the
largest eigenvalue of the matrix
N,
N =
k
φ(k
)(
k
− 1)e
−2p/k
ν
p
k
−3
ν
p
+
k
µ
p
M .
(22)
This eigenvalue can be calculated numerically using stan-
dard methods and the immunization threshold is obtained
when
λ
1
≡ max
v
||Mv||/||v||, the largest eigenvalue of N,
satisfies
λ
1
= 1
/p
b
. This can be solved numerically for
a given degree distribution
P (k). The critical value p
c
is
then obtained and can be used to evaluate
f
c
, the fraction
of immunized individuals,
f
c
= 1
−
k
P (k)ν
p
c
k−1
(
ν
p
c
+
pkµ
p
c
)
.
(23)
3.3.3 Discussion
The acquaintance immunization strategy is effective for
any broad-scale distributed network. Here we give exam-
ples for scale-free and bimodal distributions, which are
common in many natural networks. We also give an exam-
ple of an assortatively mixed network (where high degree
nodes tend to connect to other high degree nodes [35]). We
also discuss the effectiveness of the strategy in conjunction
with the SIR epidemiological model.
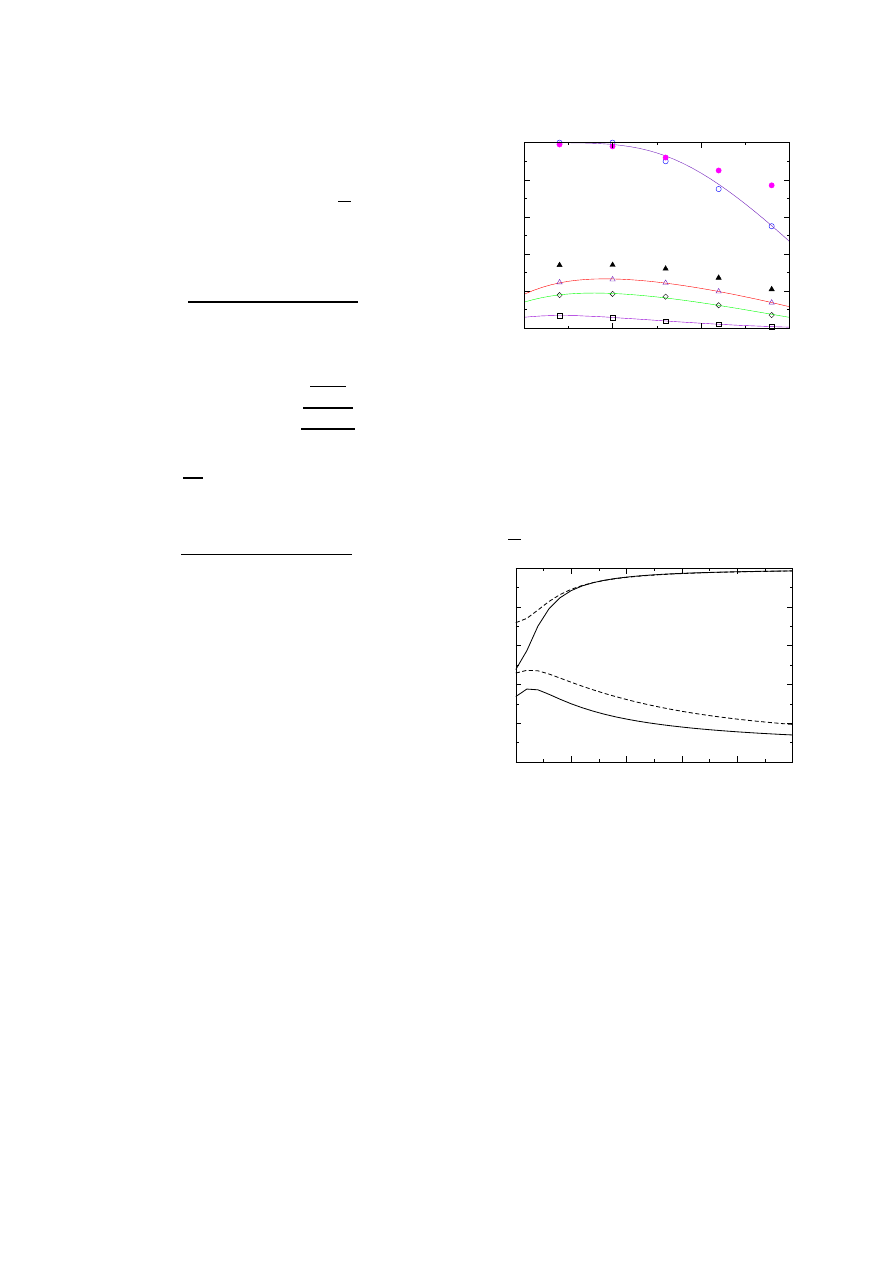
In Figure 1, we show the immunization threshold
f
c
needed to stop an epidemic in networks with 2
< γ < 3.5
(this covers all known cases). Plotted are curves for the
(inefficient) random strategy, and the strategy advanced
here, for the cases of
n = 1 and 2. Note that while f
c
= 1
for networks with 2
< γ < 3 (e.g. the Internet) it decreases
dramatically to values
f
c
≈ 0.25 with the suggested strat-
egy. The figure also shows the strategy’s effectiveness in
case of assortatively mixed networks [35], i.e., in cases
where
p(k
|k) does depend on k, and high degree nodes
2
2.5
3
3.5
λ
0
0.2
0.4
0.6
0.8
1
f
c
Fig. 1. Critical immunization threshold, f
c
, as a function of γ
in scale-free networks (with m = 1), for the random immuniza-
tion (
◦), acquaintance immunization (), double acquaintance
immunization (
), and targeted immunization () strategies.
Curves represent analytical results, while data points represent
simulation data, for a population N = 10
6
(due to the popu-
lation’s final size f
c
< 1 for random immunization even when
γ < 3). Full symbols are for random and acquaintance immu-
nization of assortatively mixed networks (where links between
sites of degree k
1
and k
2
(> k
1
) are rejected with probability
0.7
1
−
k
1
k
2
).
0
20
40
60
80
100
d
0
0.2
0.4
0.6
0.8
1
f
c
Fig. 2. Critical concentration, f
c
, for the bimodal distribution
(of two Gaussians) as a function of d, the distance between
the modes. The first Gaussian is centered at k = 3 and the
second one at k = d + 3 with height 5% of the first. Both
have variance 2 (solid lines) or 8 (dashed lines). Top 2 lines
are for random immunization. The bottom 2 lines are for ac-
quaintance immunization. All curves are analytically derived
from equations (15) and (14). Very similar results have been
obtained for bimodal distributions of two Poissonians. Note
that also for the case d = 0, i.e. a single Gaussian, the value of
f
c
reduces considerably due to the acquaintance immunization
strategy. Thus the strategy gives improved performance even
for relatively narrow distributions [36].
tend to connect to other high degree nodes, which is the
case for many real networks.
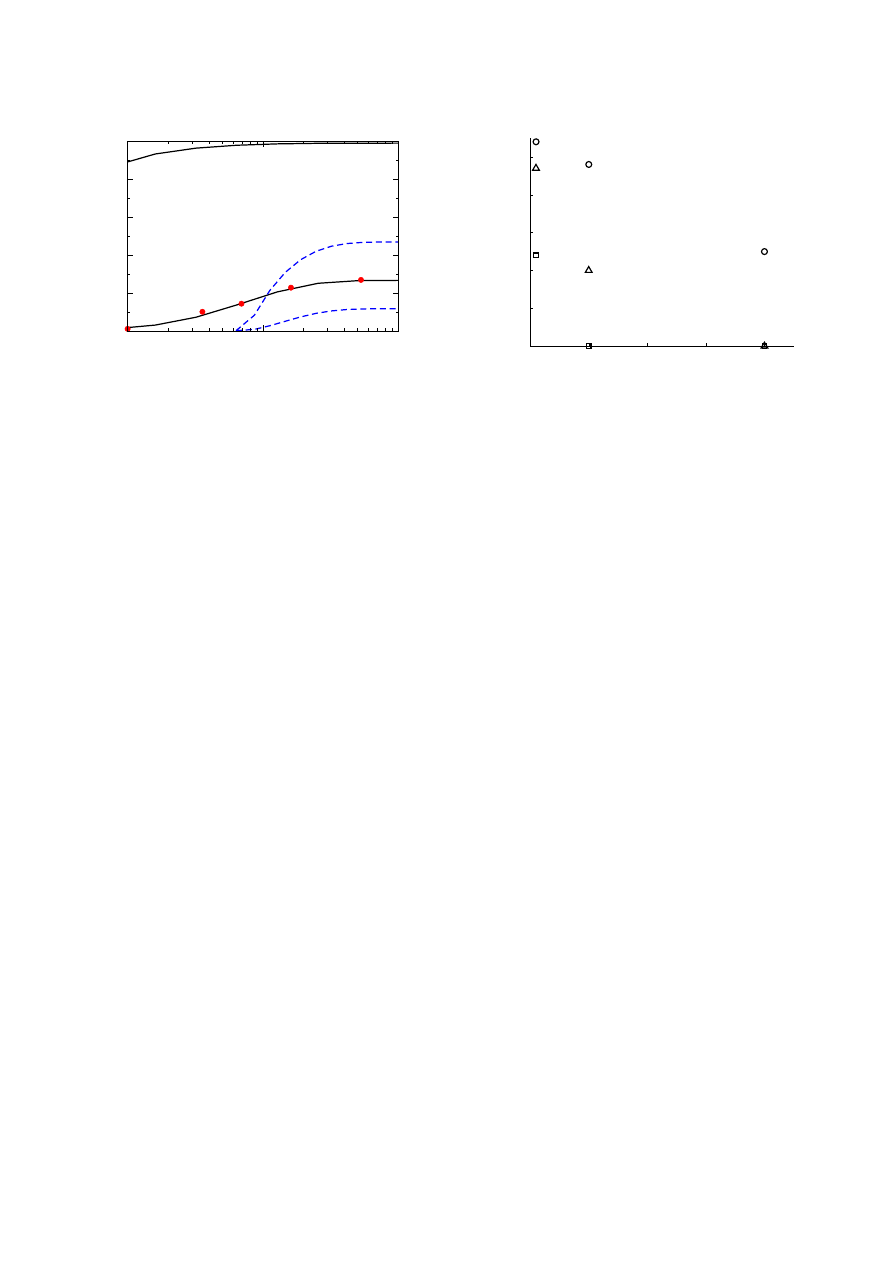
Figure 2 gives similar results for a bimodal distri-
bution (consisting of two Gaussians, where high degree
nodes are rare compared to low degree ones). This distri-
bution is also believed to exist for some social networks,
in particular, for some networks of sexual contacts. The
274
The European Physical Journal B
0.1
1
10
r
0
0.2
0.4
0.6
0.8
1
f
c
Fig. 3. Critical concentration, f
c
, vs. r, the infection rate, for
the SIR model with τ = 1. The solid lines are for random
(top) and acquaintance immunization (bottom) for scale-free
networks with γ = 2.5. The dashed lines are for γ = 3.5 (top
– random, bottom – acquaintance immunization). The circles
represent simulation results for acquaintance immunization for
scale-free networks with γ = 2.5.
improvement gained by the use of the acquaintance immu-
nization strategy is evident in Figure 2. The improvement
is also noticable in a range of infection rates, as can be
seen in Figure 3.
3.3.4 Practical issues
Various immunization strategies have been proposed,
mainly for the case of an already spread disease, and are
based on tracing the chain of infection towards the super-
spreaders of the disease [13]. This approach is different
from our proposed approach, since it is mainly aimed at
stopping an epidemic after the outbreak began. It is also
applicable for cases where no immunization exists and only
treatment for already infected individuals is possible. Our
approach, on the other hand, can be used even before the
epidemic starts spreading, since it does not require any
knowledge of the chain of infection.
In practice, any population immunization strategy
must take into account issues of attempted manipulation.
We would expect the suggested strategy to be less sensitive
to manipulations than targeted immunization strategies.
This is due to its dependence on acquaintance reports,
rather than on self-estimates of number of contacts. Since
a node’s reported contacts pose a direct threat to the node
(and relations), we anticipate that manipulations would be
less frequent. Furthermore, we would suggest adding some
randomness to the process: for example, reported acquain-
tances are not immunized, with some small probability
(smaller than the random epidemic threshold), while ran-
domly selected individuals are immunized directly, with
some low probability. This will have a small impact on
the efficiency, while enhancing privacy and rendering ma-
nipulations less practical.
3.4 Numerical results
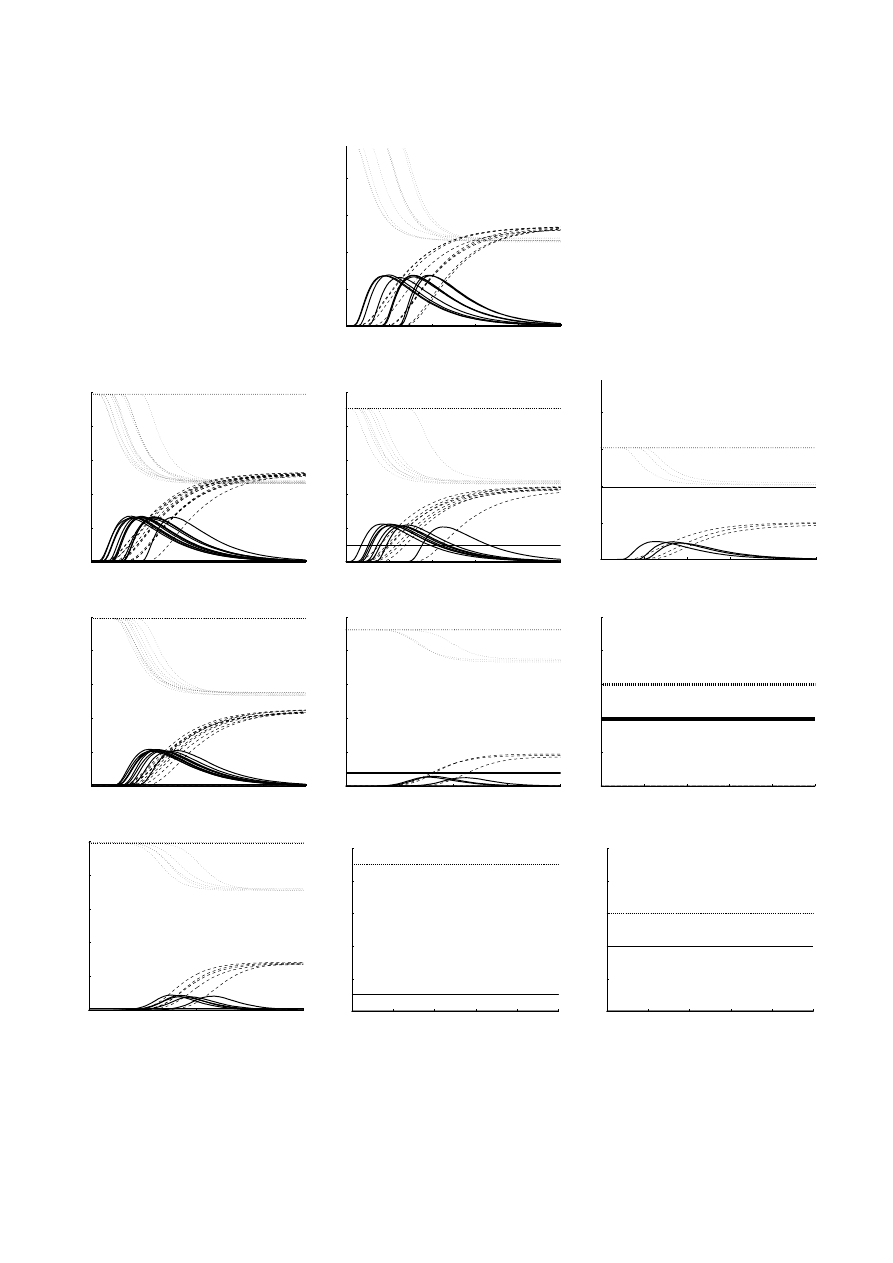
Figure 5 presents the dynamic of the spreading of the
disease in the SIR model, as well as while implementing
0
10
20
30
40
0
10
20
30
40
50
f
p
e
Fig. 4. Fraction of endemic outbreaks, p
e
, as a function of the
fraction of immunized individuals f, for random immunization
(
◦), acquaintance immunization (), and targeted immuniza-
tion (
) strategies.
the three methods of immunization which were discussed
above (random, acquaintance and targeted).
In the event of an epidemic outbreak the fraction of
Infected individuals grows until reaching a certain maxi-
mum, after which it decays to zero, if given sufficient time.
When there is no epidemic outbreak, however, the number
on Infected (and therefore Removed) individuals is rela-
tively so low, and the number of Susceptible individuals
is relatively so high, that their plotting versus the time
reveals no change after a very short time, and the respec-
tive graphs appear as horizontal lines. This may happen
even with no immunization, for some network realizations
or due to the low degree or cluster size of the first In-
fected individual. The fraction of such occurrences grows
higher with immunization, and higher still as the immu-
nized fraction of the population grows, in each of the three
immunization methods we checked. In fact, a very similar
endemic fraction can be detected in randomly immunizing
10% of the population and in acquaintance immunization
of 1% of it.
Figure 4 shows the fraction of endemic outbreaks, out
of all the network realizations a randomly infecting an
individual. As mentioned above, random immunization
requires a high fraction of immunized nodes in order to
be effective, while targeted immunization terminates the
disease completely in a fraction immunization of 10%.
This fraction is not enough for acquaintance immuniza-
tion. Despite lowering considerably the endemic fraction,
this strategy requires a higher immunization fraction in
order to eradicate the disease.
In Figure 5 it can easily be seen that for a low immu-
nization fraction, the dynamics of random immunization
are very similar to the regular SIR model. Targeted im-
munization is already highly effective – not only most of
its realizations are devoid of endemic state, but when the
epidemic does spread, a significantly smaller fraction of
individuals is Infected. Acquaintance immunization shows
a higher fraction of endemic states than the targeted, but
N. Madar et al.: Immunization and epidemic dynamics in complex networks
275
0
20
40
60
80
100
0
0.2
0.4
0.6
0.8
t
f
t
0
20
40
60
80
100
0
0.2
0.4
0.6
0.8
1
t
f
t
0
20
40
60
80
100
0
0.2
0.4
0.6
0.8
1
t
f
t
0
20
40
60
80
100
0
0.2
0.4
0.6
0.8
t
f
t
0
20
40
60
80
100
0
0.2
0.4
0.6
0.8
1
t
f
t
0
50
100
150
200
0
0.2
0.4
0.6
0.8
1
t
f
t
0
20
40
60
80
100
0
0.2
0.4
0.6
0.8
1
t
f
t
0
50
100
150
200
0
0.2
0.4
0.6
0.8
1
t
f
t
0
20
40
60
80
100
0
0.2
0.4
0.6
0.8
1
t
f
t
0
20
40
60
80
100
0
0.2
0.4
0.6
0.8
1
t
f
t
Fig. 5. Dynamics of SIR model on a scale free network: fraction of the population occupying each state, as a function of time.
Fraction of Susceptible (dotted light grey line), Infected (solid black line) and Removed (dashed darker grey) individuals. Regular
SIR model (top), Random immunization (second row), acquaintance immunization (third row) and targeted immunization
(bottom), where p is 1% (left), 10% (middle column) and 40% (right). Immunized fraction is denoted by a black straight line.
In all cases, the size of the network is 10
5
, with λ = 2.5 and m = 1. The parameters of the SIR model are r = 0.1 and τ = 10.
Each graph contains 20 different realizations of the scale-free network.

276
The European Physical Journal B
its fraction of Infected individuals is still lower than that
obtained with the random immunization strategy.
4 Conclusions
In conclusion, we have proposed a novel efficient strategy
for immunization, requiring no knowledge of the nodes’
degrees or any other global information. This strategy is
efficient for networks of any broad-degree distribution and
allows for a low threshold of immunization, even where
random immunization requires the entire population to
be immunized. We have presented analytical results for
the critical immunization fraction in both a static model
and the kinetic SIR model.
As a final remark, we note that our approach may be
relevant to other networks, such as ecological networks of
predator-prey [37, 38], metabolic networks [39], networks
of cellular proteins [40], and terrorist networks. For ter-
rorist networks, our findings suggest that an efficient way
to disintegrate the network, is to focus more on removing
individuals whose name is obtained from another member
of the network.
We thank the Israel Science Foundation and the NSF (PHY-
0140094) for support.
References
1. R. Pastor-Satorras, A. Vespignani, Phys. Rev. Lett. 86,
3200 (2001)
2. R. Pastor-Satorras, A. Vespignani
Phys. Rev. E 63,
066117 (2001)
3. M.E.J. Newman, Phys. Rev. E 66, 016128 (2002)
4. R. Albert, H. Jeong, A.-L. Barab´
asi, Nature, 406, 378
(2000)
5. R. Cohen, K. Erez, D. ben-Avraham, S. Havlin, Phys. Rev.
Lett. 85, 4626 (2000)
6. D.S. Callaway, M.E.J. Newman, S.H. Strogatz, D.J. Watts,
Phys. Rev. Lett. 85, 5468 (2000)
7. R. Cohen, K. Erez, D. ben-Avraham, S. Havlin, Phys. Rev.
Lett. 86, 3682 (2001)
8. R. Pastor-Satorras, A. Vespignani, Phys. Rev. E 65,
036104 (2002)
9. Z. Dezso, A.-L. Barab´
asi, Phys. Rev. E 65, 055103(R)
(2002)
10. R.M. Anderson, R.M. May, Infectious Diseases of Humans:
Dynamics and Control (Oxford University Press, UK,
1992)
11. P. Grassberger, Math. Biosci. 63, 157 (1983)
12. C.P. Warren, L.M. Sander, I.M. Sokolov, Math. Biosci.
180, 293 (2002)
13. H.W. Hethcote, J.A. Yorke, Gonorrhea transmission
dynamics and control, Vol. 56 of Lecture notes in
Biomathematics (Springer-Verlag, Berlin, 1984)
14. R.M. May, R.M. Anderson, Math. Biosci. 72, 83 (1984)
15. H.W. Hethcote, J.W. Van-Ark, Math. Biosci. 84, 85 (1987)
16. R. Pastor-Satorras, A. Vespignani, Evolution and structure
in the Internet (Cambridge University Press, UK, 2004)
17. A.L. Lloyd, R.M. May, Science 292, 1316 (2001)
18. S.H. Strogatz, Nature 410, 268 (2000)
19. R. Albert, A.L. Barab´
asi, Rev. Mod. Phys. 74, 47 (2002)
20. S.N. Dorogovtsev, J.F.F. Mendes, Adv. Phys. 51, 1079
(2002)
21. M.E.J. Newman, SIAM Rev. 45, 167 (2003)
22. S.N. Dorogovtsev, J.F.F. Mendes, Evolution of Networks:
From Biological Nets to the Internet and WWW (Oxford
University Press, 2003)
23. F. Liljeros, C.R. Edling, L.A.N. Amaral, H.E. Stanley, Y.
˚
Aberg, Nature 411, 907 (2001)
24. A.-L. Barab´
asi, H. Jeong, R. Ravasz, Z. Neda, T. Vicsek,
A. Schubert, Physica A 311, 590 (2002)
25. M.E.J. Newman, D.J. Watts, S.H. Strogatz, PNAS 99,
2566 (2002)
26. S.-H. Yook, H. Jeong, A.-L. Barab´
asi Proc. Nat. Acad. Sci.
USA 99, 13382 (2002)
27. A.L. Barab´
asi, R. Albert, Science 286, 509 (1999)
28. H. Ebel, L.-I. Mielsch, S. Bornholdt, Phys. Rev. E 66,
035103(R) (2002)
29. X. Guardiola, R. Guimera, A. Arenas, A. Diaz-Guilera, D.
Streib, L.A.N. Amaral, cond-mat/0206240
30. R. Cohen, S. Havlin, D. ben-Avraham, Phys. Rev. Lett.
91, 247901 (2003)
31. S.L. Feld, Am. J. Soc. 96, 1464 (1991)
32. M.E.J. Newman, Social Networks 25, 83 (2003); M.E.J.
Newman, Nature 411, 41 (2001)
33. M. Boguna, R. Pastor-Satorras, Phys. Rev. E 66, 047104
(2002)
34. M. Boguna, R. Pastor-Satorras, A. Vespignani, Phys. Rev.
Lett. 90, 028701 (2003)
35. M.E.J. Newman, Phys. Rev. Lett. 89, 208701 (2002)
36. L.A.N. Amaral, A. Scala, M. Barth´
el´
emy, H.E. Stanley,
PNAS 97, 11149 (2000)
37. R.V. Sol´
e, J.M. Montoya, Proc. Roy. Soc. Lond. B Bio.
268, 2039 (2001)
38. J. Camacho, R. Guimer´
a, L.A.N. Amaral, Phys. Rev. Lett.
88, 228102 (2002)
39. H. Jeong, B. Tombor, R. Albert, Z.N. Oltvai, A.L.
Barab´
asi, Nature, 407, 651 (2000)
40. H. Jeong, S. Mason, A.-L. Barab´
asi, Z.N. Oltvai, Nature
411, 41 (2001)
Wyszukiwarka
Podobne podstrony:
Epidemic dynamics and endemic states in complex networks
exploring the social ledger negative relationship and negative assymetry in social networks in organ
Epidemic Spreading in Real Networks An Eigenvalue Viewpoint
2016 Energy scaling and reduction in controling complex network Chen
managing in complex business networks
Internet Worm and Virus Protection in Dynamically Reconfigurable Hardware
Mobile Multimedia In Context To Atm Transport And Gsm Gprs Mobile Access Networks
PROPAGATION MODELING AND ANALYSIS OF VIRUSES IN P2P NETWORKS
knowledge transfer in intraorganizational networks effects of network position and absortive capacit
Epidemiological Models Applied to Viruses in Computer Networks
Production networks and consumer choice in the earliest metal of Western Europe
Queuing theory based models for studying intrusion evolution and elimination in computer networks
the genesisi and dynamics of organizational networks
Epidemic Profiles and Defense of Scale Free Networks
Windows 10 A Complete User Guide Learn How To Choose And Install Updates In Your Windows 10!
Modelling Development of Epidemics with Dynamic Small World Networks
Coopetition in Business Networks to Cooperate and Compete Simultaneously
więcej podobnych podstron