
Measurements of accommodation amplitude
in polychromatic light
Katarzyna Sarnowska-Habrat, Bogusława Dubik, Marek Zając
Wrocław University of Technology, Institute of Physics
Wybrzeże Wyspiańskiego 27, 50-370 Wrocław, Poland
email:
zajac@if.pwr.wroc.pl
ABSTRACT
Keywords: human vision, visual acuity, accommodation
1. INTRODUCTION
Human beings receive predominant percentage of the information about the environment thanks to their sense of vision.
Therefore the vision quality is one of the most important parameters determining our well-being. By the vision quality
we understand the possibility of perceiving light and darkness, colours and shadows, differentiating details from background
and recognition of various objects. Vision quality depends on number of factors connected with the optical system
of an eye, the light detection by retina, transmission of neural signals from eye to brain and the psychological process
of signal interpretation. Vision quality is thus a complex idea.
In optometry we investigate typically one of the aspects of vision quality, namely visual acuity (V.A.). This value
describes the possibility of detecting and recognising small objects typically of high contrast and depends mainly on the
quality of retinal image. A number of methods is used for determining V.A. differing in types of the test object used and the
procedure of performing the measurements. We have chosen some of them as it will be described in the following text.
The other important parameter characterising human vision is amplitude of accommodation. The time dependent
physiological changes in the eye and in particular in crystalline lens lead to diminishing of accommodation amplitude. This
fault, called presbyopy, affects increasing number of people in the ageing society and becomes an important medical and
sociological problem. Presbyopy manifests in diminishing of visual acuity, so from the measurements of visual acuity
in dependency of induced accommodation the changes in accommodation amplitude can be evaluated.
2. VISUAL ACUITY AND ACCOMMODATION
The eye accommodation can be measured with the same instruments and methods that are developed for determining the
refractive state of the eye. A test target is presented to the investigated Subject in strictly defined and reproducible
conditions (distance, illumination mode etc.) and the retinal image is analysed in order to determine weather it is correctly
focused or not. The objective methods based on the analysis of this image are difficult, however, since the retinal image
is not directly accessible in the living eye. Therefore a number of subjective methods based on the judging of the image
quality done by the Subject itself are used alternatively. In principle the objective and subjective methods should give the
same results within the depth of focus of the eye [1].
The accommodation can be changed by moving the test target to and from the eye, but the same effect can be achieved
by inserting the spherical lens in front of the eye. A phoroptor or trial case lenses can be used for inducing the
accommodation.
The subjective methods used for measuring of eye accommodation are based on the estimation of the image blurring
present if the observed target is out of focus.
3. MEASUREMENTS
3.1. Snellen test method
For preliminary investigations we employed the standard procedure as used in the routine eye testing i.e. Snellen
method. Subjects were seated in the 5 meters distance from the acuity letter chart and asked to read the consecutive rows of
letters. The smallest recognised letter size was then expressed as Snellen fraction V. According to the definition V=L/D
where D is a standard observation distance and L is the distance from which the recognised letter has angular size equal to
5 mins of arc.
The accommodation was induced by lenses placed in front of the eyes. The lenses powers were changed within the wide
range in 0.25 D steps.
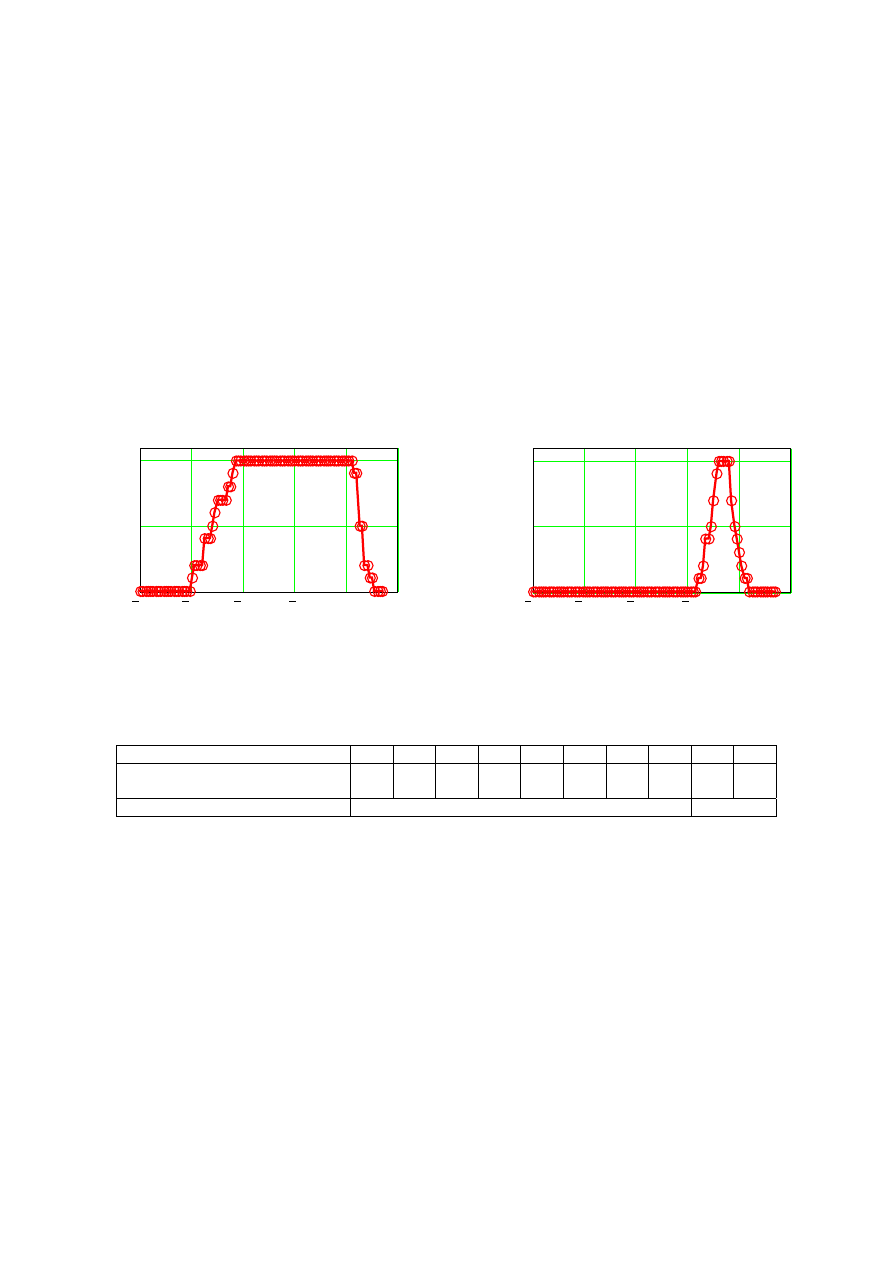
10 persons were investigated: 8 of them were of 20-28 years of age, 2 being much older (over 50). The results of two
exemplary measurements are presented graphically in the Figure 1. The amplitude of accommodation can be estimated from
the graphs assuming that witin the range of accommodation V.A. is not much lower than its maximum value (by assumption
not below 0.9). Under such assumption we have the results collected in the Table 1. As it is supposed the average amplitude
of accommodation for younger Subjects is around 8 D while for the older Subjects does not exceed the value of 1.5 D.
Fig. 1. Two exemplary result of measurement of visual acuity versus optical power of the lens inducing accommodation
Table 1.
The estimated amplitude of accommodation measured with Snellen method
Subject
1
2
3
4
5
6
7
8
9
10
Amplitude of accommodation
in Dioptres
6.0
8.0 11.5 7.5
7.0 11.5 7.5
6.5
1.5
1.0
Average
8
1.25
3.2. Ronchi ruling - chart test
It is well known, that the method of V.A. measurement in which letter charts are used, although the most popular in
ophthalmic practice, has a serious drawback. The result of measurement depends strongly on the type and shape of letters
[e.g. 2]. The crowding effect also may cause the result falsification. Therefore it is better to use simpler and more easy for
describing test objects such as Snellen "E" or Landolt ring [e.g. 3]. We prefer, however, a test typicall for instrumental
optics, i.e. Ronchi ruling. Visual acuity is then defined as the highest angular spacing of the dark and light, parallel,
equidistant fringes of high contrast resolved from the uniform background. V.A. defined in such way is usually expressed in
MAR (minimum angle of resolution measured in cycles per angular degree) or logMAR units [e.g. 4].
The first series of experiments in which we wanted to measure visual acuity was performed in the following way: The
investigated Subject was seated in a darkroom in the distance 4.25 m from the white background surface illuminated with a
light of specified colour and intensity characteristics. After few minutes of adaptation to the illumination conditions a test
20
15
10
5
0
5
0
0.5
1
Lens Power in Diopters
Visual Acuity
20
15
10
5
0
5
0
0.5
1
Lens Power in Diopters
Visual Acuity
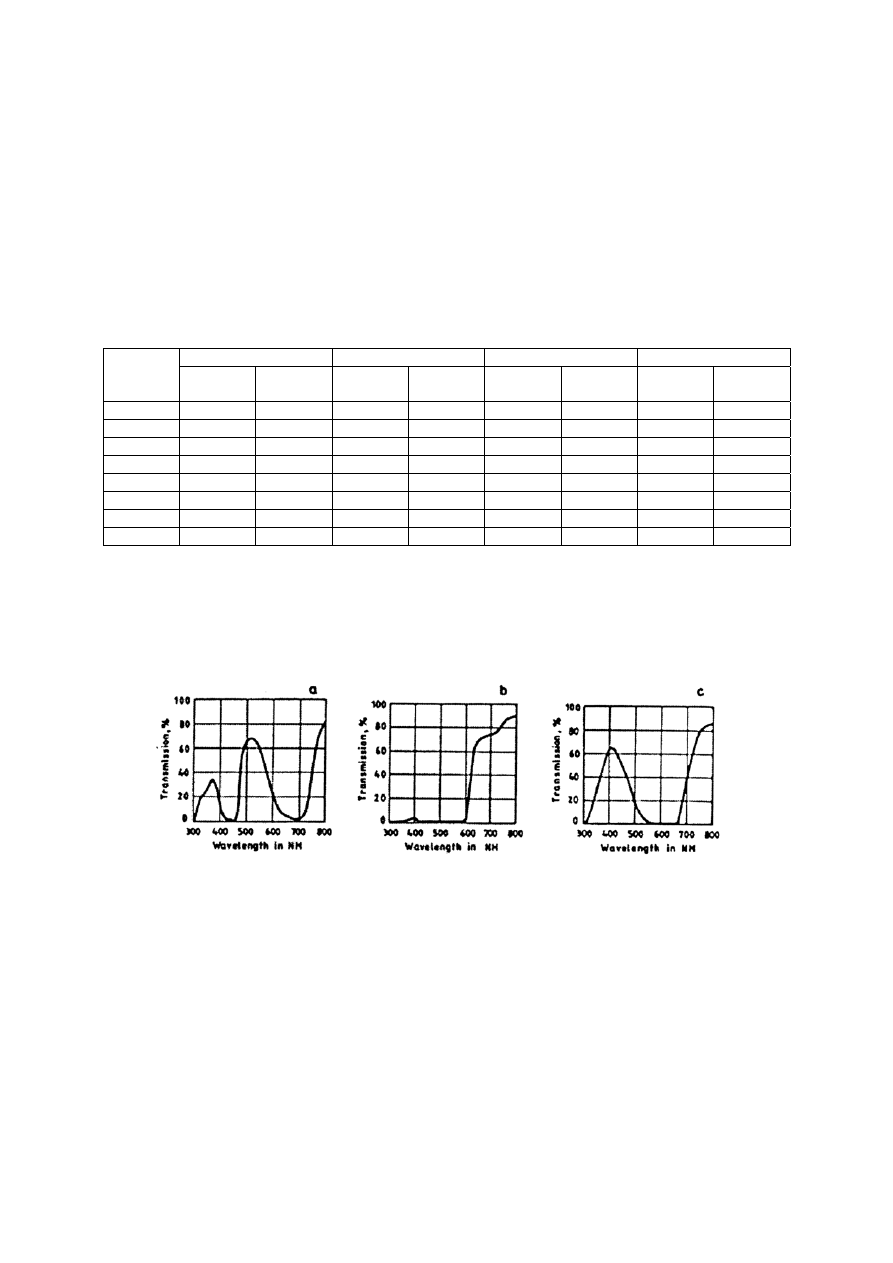
chart was presented to the Subject who could observe it binocularly without head restriction. The test has a form of black
parallel equidistant lines printed on the matt white paper. A series of tests of increasing spatial frequencies were presented
until the Subject cannot recognise the striped structure but sees uniform field. The orientation of the test lines was randomly
changed during the experiment. The highest spatial frequency of recognised test structure was recorded as the resolution
limit. The above procedure was repeated some 10 to 20 times and all answers of the Subject were recorded. The average
value of resolution limit and its standard deviation were calculated [5].
Eight subjects: four females and four males, of different age took part in experiments. Some of them were emmetropes,
the others wore their correction glasses. All had normal colour vision. The measured resolution limits (in white light) are
presented in the first columns of Table 2.
Table 2.
Resolution limits measured with Ronchi ruling illuminated with incoherent light
white light
red filter
green filter
blue filter
Subject
MAR [arc
min]
δ
MAR
MAR
[arc min]
δ
MAR
MAR [arc
min]
δ
MAR
MAR [arc
min]
δ
MAR
1
1.32
0.061
1.36
0.082
1.29
0.050
1.83
0.122
2
1.62
0.050
1.62
0.050
1.65
0.071
2.48
0.153
3
1.57
0.078
1.85
0.107
1.80
0.050
1.88
0.082
4
0.98
0.045
1.34
0.087
1.12
0.045
1.64
0.061
5
1.62
0.050
1.78
0.050
1.96
0.050
2.43
0.050
6
1.53
0.084
1.47
0.045
1.17
0.071
1.62
0.050
7
1.47
0.045
1.71
0.084
1.76
0.050
2.00
0.078
8
1.29
0.050
1.29
0.050
1.29
0.050
2.10
0.050
Since we wanted to check how visual acuity depends on the spectral characteristics of illumination light we used
different illuminators. There were spectral lamps: (sodium, cadmium), high pressure mercury lamp with interference filters
and white light illuminator with colour filters. The spectral characteristics of used filters (GamColor
) are presented in the
Figure 2. The other detailed data of the illuminators are presented in [5]. As it is reported there the most convenient for our
goal is halogen microscope lamp with broad-band absorption filters. In this paper we will present only the resolution limits
measured in such illumination. The appropriate date are collected also in the Table 2
Fig. 2. Spectral characteristics of filters used (GamColor
)
3.3. Ronchi ruling - projector test method
As an alternative to the test charts printed on the paper we used tests of similar character projected onto the screen.
A modified slide projector with remote control and exchangeable colour filters (of the same characteristics as presented in
the Figure 2) was used. The periodic line tests were projected onto a white matt surface in such a way that on a dark
background a system of bright parallel equidistant lines of four different orientation limited to the circle of 30 cm diameter
was formed. Subjects were seated 15.5 m from the screen.
The experiment was performed for 23 persons of different age and sex, either emmetropic or wearing their usual
correction glasses. The tests were presented in random orientation and increasing spatial frequency until the Subjects
reported that he or she cannot recognise the test orientation. Spatial frequency of this test expressed in MAR units was taken
as the measure of visual acuity. The results are presented in the Table 3.
Table 3.
Resolution limits measured with projected Ronchi ruling
Visual acuity MAR [arc min]
Subject
white light
red light
green light
blue light
1
1.41
1.41
1.77
2.23
2
1.77
2.23
1.77
2.81
3
1.41
1.77
1.77
2.23
4
1.77
1.77
1.77
1.77
5
1.41
1.77
1.77
2.23
6
1.41
1.77
1.41
1.77
7
1.41
1.77
1.41
1.77
8
1.77
1.77
1.77
2.23
9
1.41
1.41
1.41
2.23
10
1.41
1.77
1.77
2.23
11
1.11
1.41
1.41
1.41
12
1.11
1.41
1.11
1.41
13
1.41
1.41
1.41
1.90
14
1.11
1.77
1.41
1.77
15
1.41
1.41
1.41
1.41
16
1.41
1.41
1.77
1.77
17
1.11
1.11
1.11
1.41
18
1.11
1.11
1.11
1.77
19
1.41
1.41
1.77
1.90
20
1.11
1.11
1.11
1.41
21
1.41
1.41
1.41
1.77
22
1.41
1.77
1.41
1.77
23
1.41
1.77
1.77
1.77
average
1.414
1.577
1.530
1.938
standard
deviation
0.067
0.075
0.065
0.229
3.4. Ronchi ruling - computer screen test method
In this method, based on the Freiburg Acuity Test [6]) we used optotypes of controlled size displayed on the computer
screen. The optotype were capital "E" or Landolt ring presented in four directions: "up", "down", "left" and "right",
randomly generated. Optotypes were displayed in different colours, also the background colour could be changed. The
Subject had to determine the orientation of the optotype and answer by pushing the appropriate key on a special keyboard.
The responses were recorded by a computer and influenced the size of the next presented optotype. If answer was correct
then the size of the consecutive optotype was decreased. If the answer was wrong its size was increased. The optional
answer "cannot recognise" was treated equally as the false recognition. In this way the date for plotting the psychometric
function were collected. The psychometric function presents the relationship between size of optotype and the probability of
correct recognitions. The value of 50% correct recognitions denoted by K50 is adopted as a numerical parameter
characterising the visual acuity [7].
Results of two exemplary measurements are presented in the Figure 3a and b. The psychometric functions for two
Subjects, measured with white, red, green, yellow and blue optotypes displayed on the black background, are determined.
a)
b)
Fig 3. Examples of psychometric functions determining visual acuity
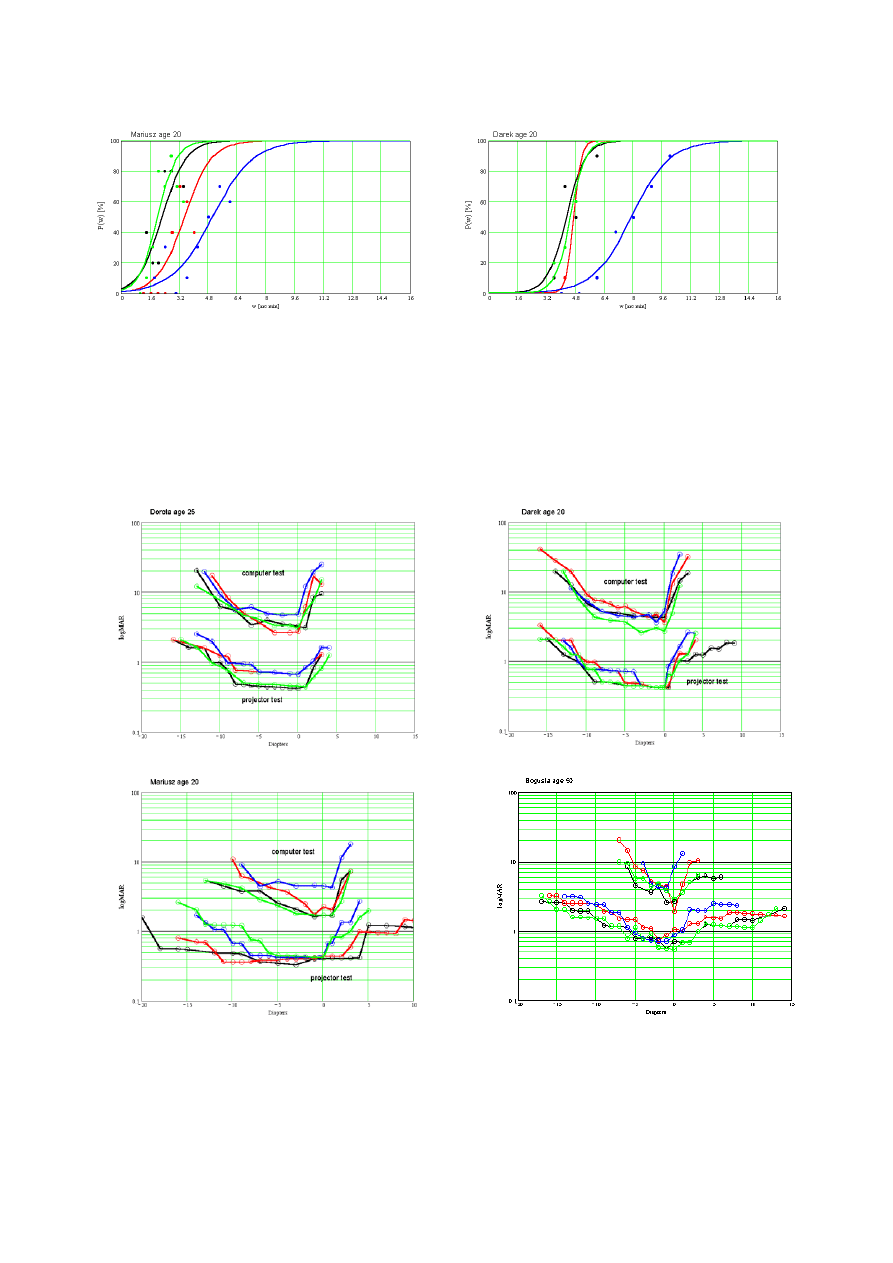
3.5. Measurements of accommodation
The two above mentioned methods of V.A. evaluation i.e. method with computer generated optotypes and with
projecting the Ronchi ruling on a screen were used to investigate the relationship of the amplitude of accommodation and
colour of the test. In both methods a number of randomly oriented and randomly sized optotypes were presented to the
investigated Subject who was asked to indicate the orientation of seen optotype. The answers were collected and the
percentage of correct recognitions versus optotype size were plotted. The data were approximated with psychometric
function and the parameter K50 was calculated. The exemplary results of measurements are displayed in the Figure 4.
a)
b)
c)
d)
Fig 4. Exemplary curves illustrating the accommodation measured in light of different spectral characteristics
3.6. Speckle optometer
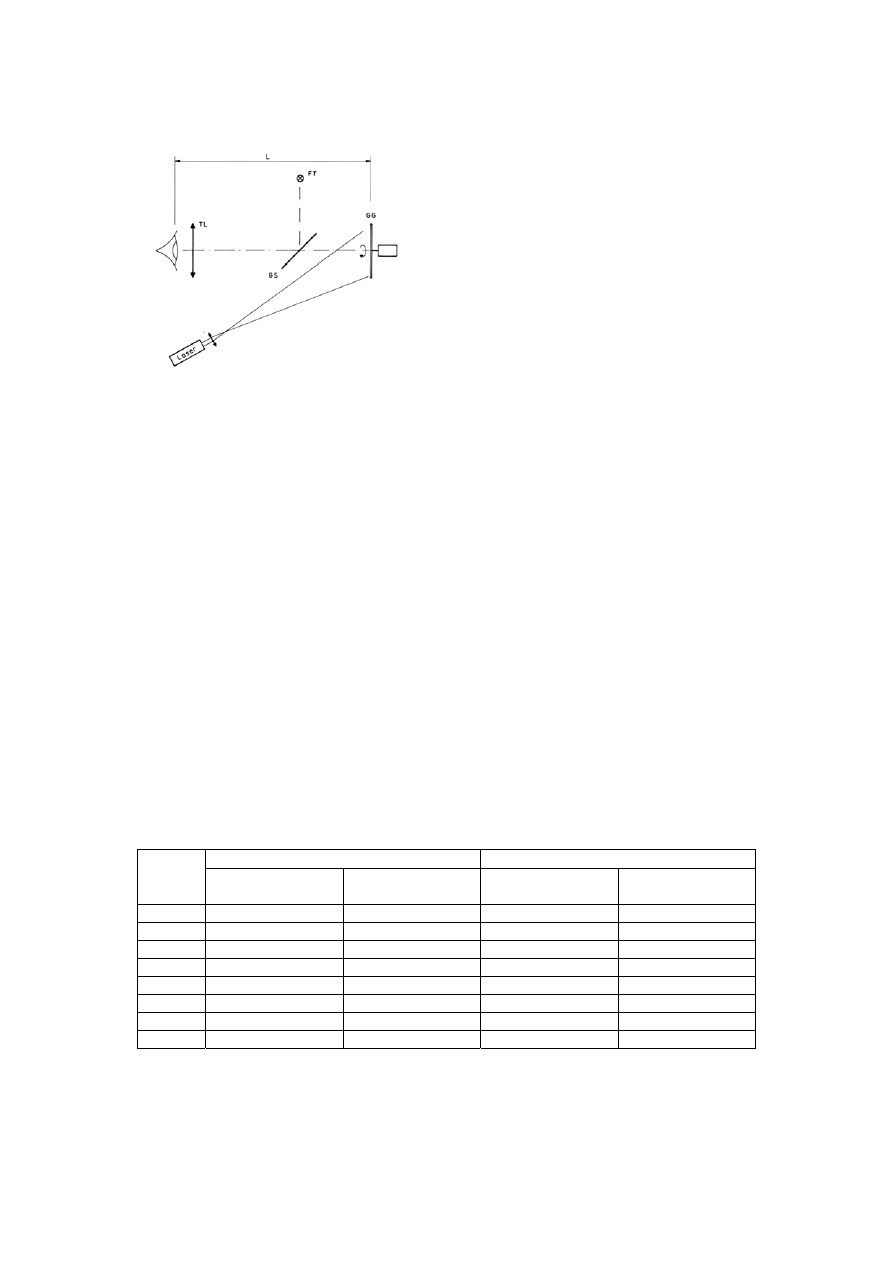
GG - rotating ground glass,
BS - half transparent mirror,
FT - fixation target
TL - trial lens inducing accommodation
L - distance 50 cm
Fig 5 Schematic diagram of speckle optometer
An optometer which makes use of the phenomenon of laser speckle was built according to the diagram presented on the
Figure 5 [1, 8]. An expanded laser beam illuminates a rough surface. The reflected light diffracts and forms an infinite
number of speckles being the Fresnel diffraction pattern. The speckles originate in the whole space, and in particular in the
plane optically conjugated with the retina of the investigated Subject's eye. If the surface moves transversally to the viewing
direction the speckles in space also move in the same direction. However if the eye is not focused exactly on the rough
surface there appears the relative motion of the images of speckles and the surface on the retina. If the eye is focused on the
plane before the surface (myopic eye) the images of speckles move slower than the image of surface itself. Thus the
observer states the relative movement of speckles in the same direction that the surface ("against" movement). For the eye
focused behind the surface (hyperopic) we have the opposite effect. Images of speckles move quicker than the image of
a surface so the observer sees the relative movement of the speckles in the same direction that the surface ("with"
movement). Only if the eye is focused perfectly on the surface no relative movement is seen.
In our experiment the Subject head was fixed in such way, that he or she could see only small part of slowly rotating
(about 1 cycle per min) disc illuminated with expanded laser light. Thanks to a half reflecting mirror the Subject observed
simultaneously a fixation light. The direction of rotation was changed by the experimenter and the Subject was asked on the
direction of speckle movement. Accommodation was induced by trial case lenses put in front of the Subject's eye.
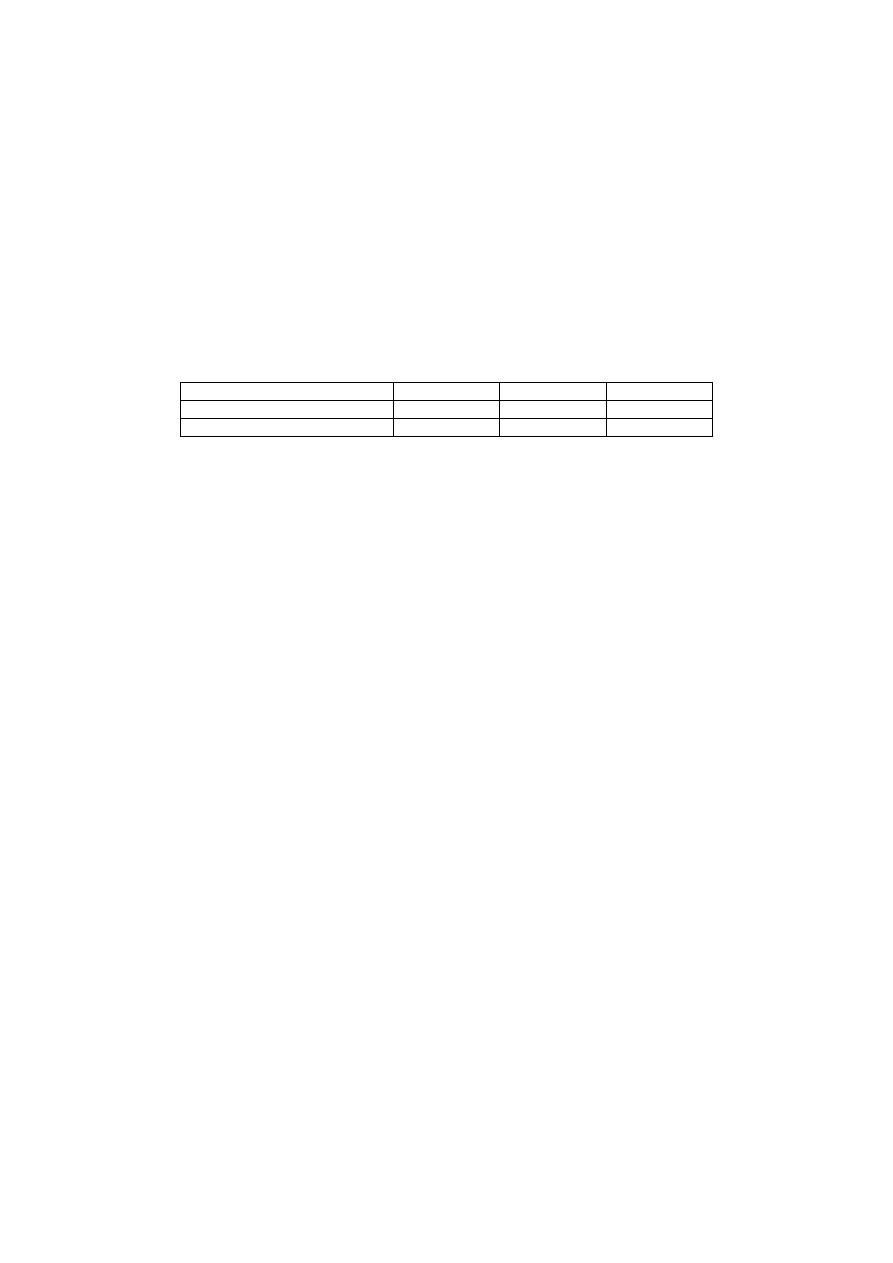
Measurements were done for 8 subjects of different sex and age. Two lasers were used giving the light of wavelengths
λ = 632.8 nm (red) and λ = 532 nm (green). In the Table 4 we presented the maximum and minimum power of trial lens
defining the range where no relative speckle movement was observed for both wavelengths as well as the amplitude of
accomodation A expressed in Dioptres (equal to the length of the above mentioned range).
Table 4.
Amplitude of accommodation measured with speckle optometer
λ = 632.8 nm
λ = 532 nm
Subject
R
xmin
- R
xmax
Amplitude of
accommodation
R
xmin
- R
xmax
Amplitude of
accommodation
1
-6.5 - 0
6.5
-7.5 - +0.25
7.75
2
-6.0 - +0.25
6.25
-7.0 - +0.5
7.5
3
-6.0 - +1.25
7.25
-7.5 - +1.25
8.75
4
-4.5 - 0
4.5
-5.5 - +0.25
5.75
5
+3.0 - +5.5
2.5
+2.5 - +7.0
5.5
6
-1.0 - -1.0
0
-1.25 - -1.0
0.25
7
-2.5 - -2.25
0.25
-2.5 - -2.25
0.25
8
-1.75 - -1.75
0
-3.5 - -1.5
2.0
4. DISCUSSION OF RESULTS
While analysing the described experiments we see that the accommodation measurement done with help of standard
Snellent V.A. test chart (Fig. 1 and Tab. 1) were easy to perform and give the reasonable results.
Obviously, V.A. depends on the colour of light used. It is clearly seen from the Tab. 2 and 3. Visual acuity in blue light
is worse than that in white light while ged and green illumination give approximately no difference.
To prove it first we analysed data from Table 2. In order to verify the above stated hypothesis on the basis of the data
from Table 2 we calculated the relative change in V.A. measured in coloured light with respect to the V.A. in white light.
Such normalisation enables us to compare V.A. in different colours with no regard to the absolute values of resolution. The
average values of the ratio MAR
colour
/MAR
white
and its variances are collected in the Table 5.
Table 5.
Visual acuity in coloured light compared to V.A. in white light (data taken from Table 2)
red/white
green/white
blue/white
average MAR
colour
/MAR
white
1.100
1.045
1.417
variance
0.134
0.144
0.212
We used statistical methods for testing the significance of differences between mean values of average relative V.A.
Since the numbers of our sample is low (n = 8) we used t-Student test [9]. On the level of significance
α = 0.05 and r = 7
degrees of freedom the critical value of t-Student variable equals t
r,
α
= 2.36 while the value of statistical parameter t
calculated for MAR
blue
/MAR
white
equals t = 2.562 > t
r,
α
. Therefore we can assume that with 95% probability the visual
acuity in blue light is worse that in white. Similar calculations for red and green lights lead to the conclusion that there are
no significant differences in visual acuity in those colours in comparison to white light.
Data collected in the Table 3 were analysed in the same way. The mean value of visual acuity measured in white light
calculated from 23-elements sample equals <MAR
white
> = 1.394 with standard deviation 0.039. The appropriate numbers for
red light are 1.563 and 0.074 and for green light are 1.514 and 0.061 respectively. For blue light we have 1.866 and 0.122.
Statistical test for consistency of mean values confirms that V.A in blue differs substantially from V.A in white light: On the
level of significance
α = 0.01 and r = 22 degrees of freedom the critical value of t-Student variable equals t
r,
α
= 2.797 while
the value of statistical parameter t calculated for MAR
blue
compared to MAR
white
equals t = 5.787 > t
r,
α
. The appropriate
parameter for red-to-white light equals t = 2.419 < t
r,
α
and for green-to-white t = 1.813 < t
r,
α
, so we cannot assume, that the
resolution in red and green differ substantially from the resolution in blue. Psychometric curves presented in the Figure 3
also illustrate the same effect. The curve illustrating visual acuity in blue light is shifted towards greater values of MAR
with respect of curves corresponding to white, red and green light. The above conclusion is in accordance with the data from
another sources [e.g. 10].
Experiments described in paragraph 3.5 and illustrated in the Figure 4 can be summarised as follows:
• Typical curve illustrating accommodation is U shaped with rather steep right slope. The optical power of trial lens at this
point corresponds to the refractive error of the Subject's eye.
• For some Subjects (older ones as a rule) the left slope is less steep than the right one (Figs. 5b, d). The probable reason is
that the accommodation response (actual accommodation) does not follow the accommodation stimulus fully, especially
for its greater values.
• Visual acuity measured with computer test is always substantial worse that V.A. measured with the test projected on the
screen (Figs. 5a - d). The probable reason is that the image displayed on the computer monitor has lower contrast and is
not stable (due to screen blinking) than that projected on a screen.
• In general accommodation amplitude as measured with computer test is more or less smaller that the anologous
amplitude measured with the projected test. This observation confirms that computer monitor is less comfortable for
observing than image projected on a screen.
Measurements with speckle optometer are very easy to perform and give more clear and easier to interpret results. Slight
difference between accommodation amplitude in red and green light can be noticed (the accommodation being better in
green), however the number of investigated Subjects was too small for draw an firm conclusion.

5. ACKNOWLEDGMENTS
This paper was sponsored by Polish Committee of Scientific Research (Komitet Badań Naukowych).
In some experiments the Students of the Faculty of Basic Problems of Technology specialising in Optical Engineering
participated: Miss Joanna Sibilska, Miss Iwona Kamińska, Miss Aneta Kobzarska, Miss Katarzyna Rynkiewicz. Their help
in collecting the experimental data is greatly appreciated.
6. REFERENCES
1. G. Smith, D. A. Atchinson, "The eye. Visual optical instruments", Cambridge University Press, Cambridge 1997,
2. A. Arditi, R. Cagenello, "On the statistical reliability of letter-chart visual acuity measurements", Investigative
Ophthalmology & Visual Science, 34 (1993), pp. 120-129,
3. EN ISO 8597 Standard "Ophthalmic optics. Visual acuity testing - standard optotype and its presentation (1994),
4. W. Johnston, "Making sense of M, N and logMAR systems specifying visual acuity", Problems in Optometry, 3 (1991),
pp. 394-404,
5. K. Sarnowska-Habrat, M. Zając, B. Dubik, "Measurement of visual acuity in different illumination conditions" presented
on the conference on Physiological Optics PHO’99 held in September 1999 in Wrocław, Poland,
6. M. Bach, ‘The Freiburg Visual Acuity Test –Automatic measurements of visual acuity’, Optometry and Vision Science,
73 (1996),
7. K. Sarnowska-Habrat, M. Zając, B. Dubik, "Computer based tester for visual acuity measurements", SPIE Proc., 4001
(2000), pp 238-244,
8. M. Żarowska, "Investigation of the influence of coherence on vision quality", MSc Thesis, Institute of Physics, Wrocław
University of Technology, Wrocław, 2000 [in Polish],
9. H. Szydłowski, "Theory of measurements", PWN, Warszawa, 1981 [in Polish],
10. M. Pluta, "Visual resolution of sinusoidal color line patterns", SPIE Proc. 3579 (1998), pp. 48 - 52.
Wyszukiwarka
Podobne podstrony:
collimated flash test and in sun measurements of high concentration photovoltaic modules
Summers Measurement of audience seat absorption for use in geometrical acoustics software
Measuring the deflection of a micromachined cantilever in cantilever device using a piezoresistive s
[Friedrich Schneider] Size and Measurement of the Informal Economy in 110 Countries Around the Worl
Dance, Shield Modelling of sound ®elds in enclosed spaces with absorbent room surfaces
Proteomics of drug resistance in C glabrata
Microstructures and stability of retained austenite in TRIP steels
MMA Research Articles, Risk of cervical injuries in mixed martial arts
Development of financial markets in poland 1999
LAB1 MN, AutarKaw Measuring of errors
Antigone Analysis of Greek Ideals in the Play
Analysis of Police Corruption In Depth Analysis of the Pro
Low Temperature Differential Stirling Engines(Lots Of Good References In The End)Bushendorf
01 [ABSTRACT] Development of poplar coppices in Central and Eastern Europe
13 161 172 Investigation of Soldiering Reaction in Magnesium High Pressure Die Casting Dies
feminism and formation of ethnic identity in greek culture
86 1225 1236 Machinability of Martensitic Steels in Milling and the Role of Hardness
Formation of heartwood substances in the stemwood of Robinia
więcej podobnych podstron