
Paper 1B 05A — SINOROCK2004 Symposium
Int. J. Rock Mech. Min. Sci. Vol. 41, No. 3, CD-ROM, © 2004 Elsevier Ltd.
1
CHARACTERISATION OF ITALIAN CLAY SHALES FOR TUNNEL DESIGN
G. Barla, M. Barla, M. Bonini
Department of Structural and Geotechnical Engineering
Politecnico di Torino, Italy
giovanni.barla@polito.it
Abstract: This paper describes the characterisation studies carried out so far on Italian clay shales, involved
in the construction of significant tunnel lengths. Laboratory tests performed on cylindrical specimens, taken
from either cubic samples at the tunnel face or from borehole drilling, point out the characteristics of clay
shales: chaotic structure (tectonized and intensely fissured), sensitivity to ionic concentration of pore fluid,
swelling/squeezing behaviour. Numerical analyses have been performed in order to reproduce the response
of clay shales both at laboratory and in situ scale, in undrained and drained conditions. The difficulties in
assessing the design parameters based on laboratory testing are evidenced, thus pointing out the importance
of in situ observation and monitoring of the tunnel response during excavation.
Keywords: clay shales; rock characterisation; large size tunnels; full face excavation; monitoring.
1. INTRODUCTION
Tunnelling through the Apennines is presently
under way in Italy, in connection with the
construction and renewal of important
communication routes. Examples are the high
speed railway line between Bologna and Florence,
presently under construction, the A1 base tunnel
and the Sparvo tunnel, soon to be excavated.
Significant tunnel lengths are in a tectonized clay
shale formation known as “Chaotic Complex”.
Clay shales are the result of depositional or
post-depositional events of physical, chemical or
tectonic origin. They are classified as “soft rocks or
hard soils” and characterised by the following main
features:
•
high variability of physical properties and
mineralogical composition,
•
significant content of expansive clay
minerals,
•
presence of developed structure at different
scale levels,
•
low strength properties,
•
time-dependent behaviour.
It is the aim of this paper to give an overview of
the complex characteristics of clay shales with
reference to large size tunnel excavation and
construction.
2. EXCAVATION AND SUPPORT
METHODS
Current trends for construction of large size
tunnels (spans greater than 10 m and cross sections
of 100 m
2
or more) in difficult conditions, such as
represented by clay shales, involve the following
conventional construction methods (Barla G.,
2002):
•
side drift method,
•
top heading and benching down excavation,
•
full face excavation.
The first two methods of construction have been
widely applied in poor ground conditions as a mean
to reduce the cross section open in one stage, thus
reducing the potential of instability of the working
face. In particular, the second method permits a
high degree of mechanization for implementation
of stabilization measures, if required, and support
placement.
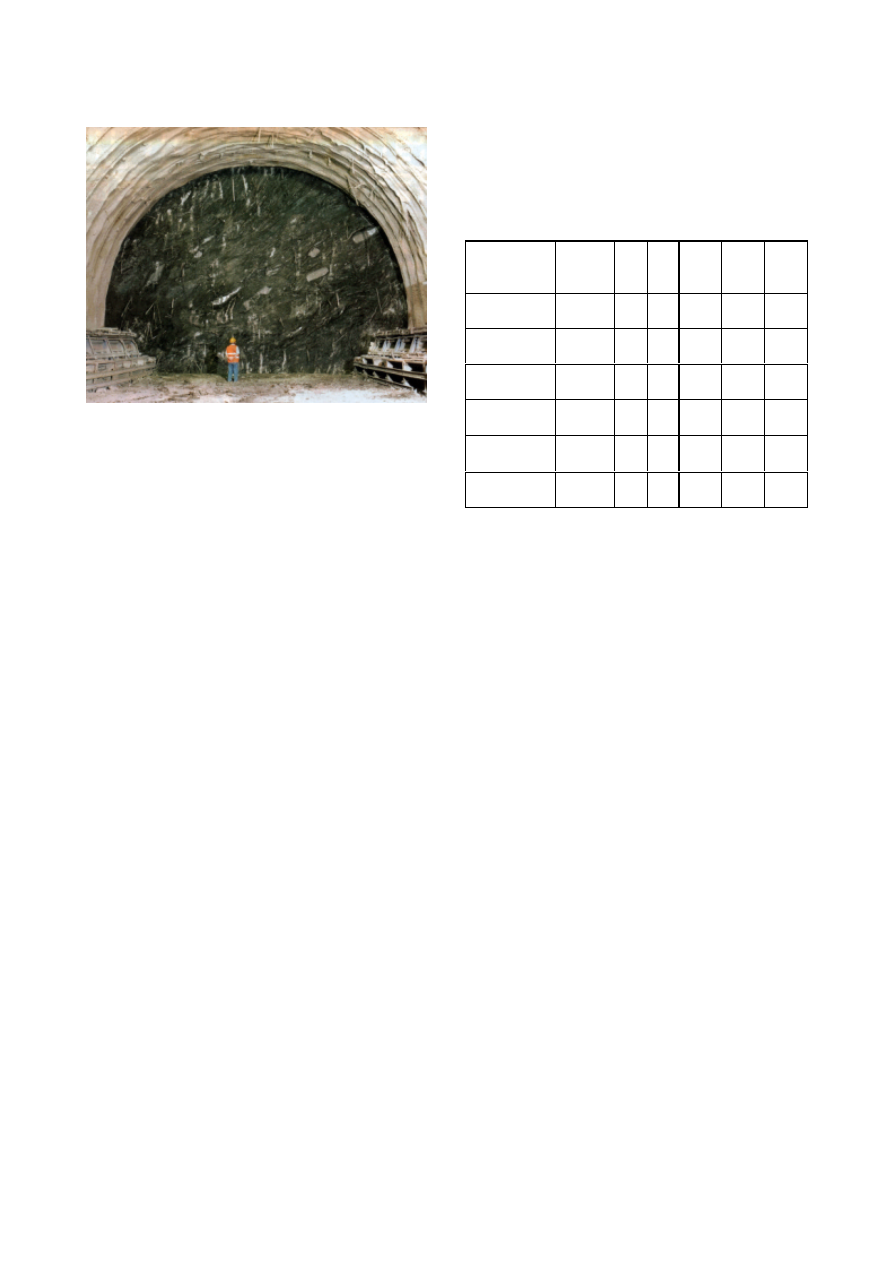
However, full face excavation (Fig. 1) is, at
present, the most appealing method and has been
applied with success in many cases (Barla G.,
2003). It was formerly introduced by Lunardi
(1995) and it is definitely being favoured by
designers from Italy with respect to other methods.
A significant advantage of this method is found in
the large working space available at the
Paper 1B 05A — SINOROCK2004 Symposium
Int. J. Rock Mech. Min. Sci. Vol. 41, No. 3, CD-ROM, © 2004 Elsevier Ltd.
2
Figure 1. Example of full face excavation method.
advancing face, so that large equipments can be
used effectively for installing support/stabilization
measures at the tunnel perimeter and ahead of the
face. However, the method makes it mandatory to
use a systematic reinforcement of the working face
and of the ground ahead.
Generally, the cross section is entirely open and
a primary lining (with steel fiber shotcrete and
heavy steel sets) with concrete invert (each
segment is cast within a very short distance from
the face) is installed as near the face as possible.
The face is reinforced by fiber-glass elements. The
concrete lining is completed at a distance not
greater than 3÷4 tunnel diameters behind the face.
3. CHARACTERISATION OF CLAY
SHALES
Cubic samples of clay shale are cut directly
from the tunnel face or, at the design stage,
cylindrical cores are obtained from borehole
drilling. Considering the presence in clay shales of
lithic components such as calcareous, marly and
arenaceous blocks in the form of disarranged
elements, cylindrical specimens (to be used in
laboratory tests) are often obtained with great
difficulty. The material in excess is used to
determine the physical properties and the
mineralogical contents as well as for oedometer
tests on reconstituted material.
3.1 Physical properties and
mineralogical composition
A common feature of clay shales is the
variability in grain size distribution. Silt and sand
may be present, although most significant is the
presence of clay particles. According to the
Plasticity Chart
, clay shales are in general
classified as “inorganic clays of low to average
plasticity” (Tab. 1).
Table 1. Triaxial tests performed*.
Tunnel
γ
d
[kN/m
3
]
G
s
[-]
w
n
[%
]
LL
[%]
PL
[%]
PI
[%}
S. Donato
22.1
22.
1
8.6
20-
30
13-
15
7-15
Raticosa
20.5
2.7
11.
5
40-
43
21-
22
≈
20
Osteria
21.7
2.7 7.0
34-
43
18-
20
14-
25
Sparvo
20.0
2.7
≈
1
0
26-
57
16-
25
10-
36
S. Vitale
18.5
18.
5
≈
1
7
25-
85
-
10-
55
Garbinogara
18.2
18.
2
20.
5
60.2
25.9
34.3
*
γ
d
= drained unit weight;
G
s
= grain specific
weight;
w
n
= natural water content;
LL = liquid
limit;
PL = plastic limit; PI = plastic index.
Based on X-ray diffraction analyses the clay
fraction is more than 50%. As the clay content
evaluated from the grain size distribution is less
than this quantity, one can infer that some of the
larger particles (more than 0.002 mm in diameter)
are made of attached clay grains. Expandable
minerals (i.e. smectite) may be present up to 40%
the clay composition.
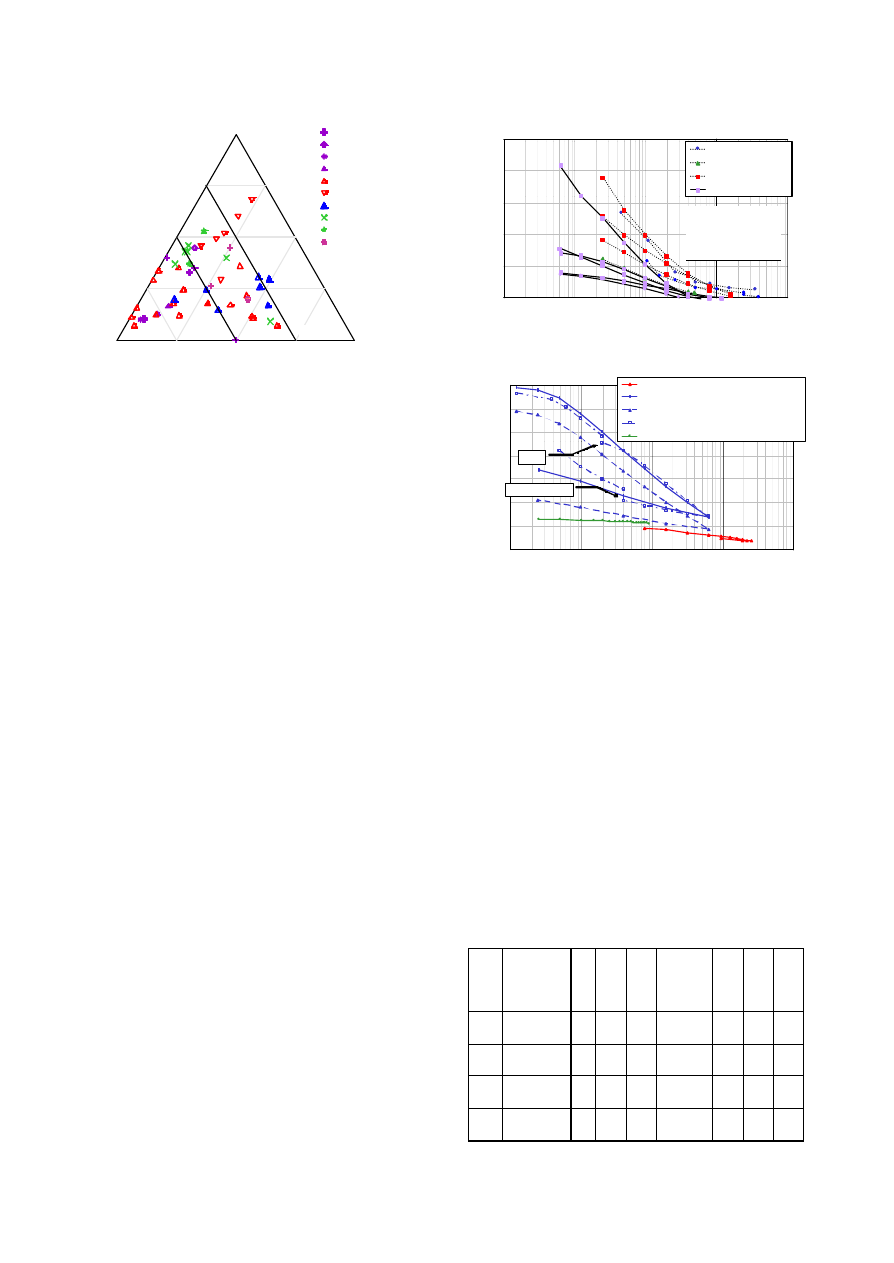
The swelling potential of clay shales is well
illustrated in Figure 2. Each point in the triangular
plot is defined by three percentages of clay
minerals, quartz and carbonate content,
respectively, as shown clockwise from 0 to 100%.
The diagram does not account for the effective
amount of swelling shown by the different clay
minerals (smectite, illite, etc.). An average to high
swelling potential is shown to characterize Italian
clay shales.
Paper 1B 05A — SINOROCK2004 Symposium
Int. J. Rock Mech. Min. Sci. Vol. 41, No. 3, CD-ROM, © 2004 Elsevier Ltd.
3
0
25
50
75
100
Carbonat e content [ %]
100
75
50
25
0
Q
ua
rtz
[%
]
100
75
50
25
0
C
la
y
m
in
e
ra
ls
[
%
]
A
B
C
A: high swelling potent ial
B: average swelling potent ial
C: low swelling pot ent ial
O steria clay shale
Rat icosa clay shale
Sparvo clay shale
S . Donato clay shale
V aricolori clay s hale
Terravecc hia clayst one
Caneva st iff c lay
Opalinus s hale
Lias Alpha shale
French marls
Figure 2. Swelling potential of Italian clay shales
compared to similar formations.
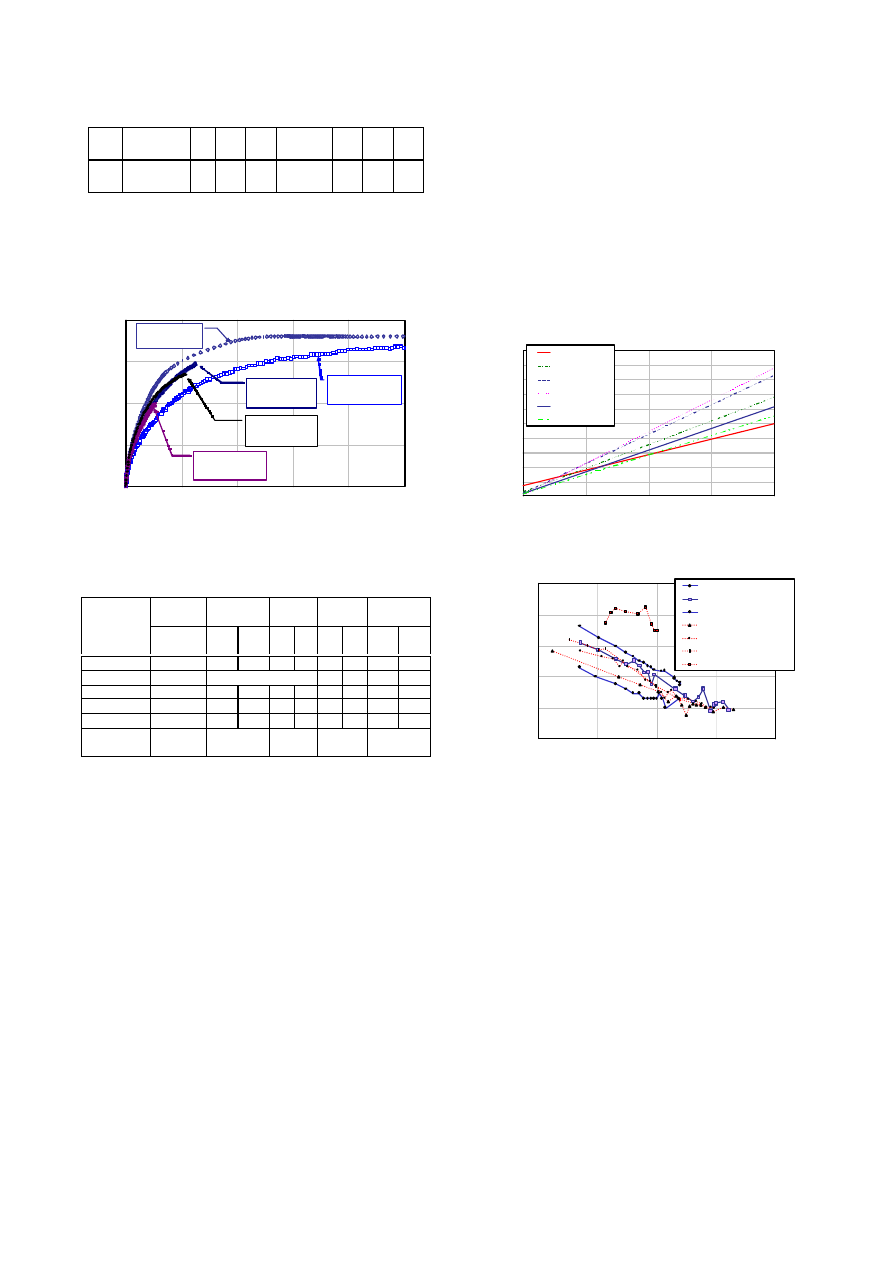
3.2 Oedometer tests
From a quantitative point of view, the swelling
potential can be investigated by means of the
Huder-Amberg modified oedometer test (Madsen,
1999). This allows for the determination of the
swelling coefficient
K on the diagram giving the
vertical strain versus the effective vertical stress as
shown in Figure 3.
The compressibility characteristics of clay
shales may be inferred by comparing oedometer
tests on natural and reconstituted samples. The
reconstitution, in fact, allows the determination of
the influence of structure and material intrinsic
properties. For the purpose of this study, the
Raticosa tunnel natural material was remoulded
with pestle and sieved through the ASTM sieves
nr. 10 and 40. Aggregates included in the matrix
were thus separated from the rest.
The materials were mixed at a water content
equal to 1.5 the liquid limit. Moreover, the
chemical composition of the pore fluid was
changed (i.e. adding NaCl and vice versa) in order
to check the sensitivity of expandable minerals
(Fig. 4). Chemical consolidation and swelling were
induced and the swelling index determined to be a
function of cation concentration.
0
5
10
15
20
25
0.001
0.01
0.1
1
10
Axial stress [MPa]
Swelling strain [%]
S. Donato tunnel
Raticosa tunnel
Osteria access adit
Sparvo tunnel
K [%]
S. Donato
2.9÷6.6
Raticosa
4.1
Osteria
4.9÷10.6
Sparvo
2.6÷11.6
Figure 3. Swelling tests with indication of K.
0.1
0.2
0.3
0.4
0.5
0.6
0.7
0.8
0.01
0.1
1
10
100
Vertical stress [MPa]
Void index [ - ]
Oed.: natural
Oed.: reconst. dist. water
Oed.: reconst. NaCl solution
Oed.: reconst. mixed test
Triaxial: natural isotropic comp. test
NaCl
Distilled water
Figure 4. Compression curves from oedometer
and triaxial tests.
3.3 Triaxial tests
Triaxial tests in closely controlled stress-path
conditions are a useful tool for the simulation of
the tunnel short- and long-term behaviour at
laboratory scale (Barla M., 1999). With reference
to the case of the Raticosa tunnel, a total of six
triaxial tests (Tab. 2) were performed by means of
the Soft Rock Triaxial Apparatus (SRTA) available
at the Politecnico di Torino (Bonini, 2003).
The stress-strain curves obtained for the
Raticosa tunnel (Fig. 5) exhibit an elasto-plastic
hyperbolic behaviour, clearly influenced by the rate
of axial displacement and saturation degree.
Table 2. Triaxial tests performed*.
Test
Type
B
[-]
B.P
.
[kP
a]
σ’
c
[kP
a]
a
ε&
[mm/mi
n]
t
max
[kP
a]
s’
m
ax
[kP
a]
∆u
[kP
a]
OS
T3
CID
-
0
90
0
0.0005
53
8
14
38
-
RT
C1
CIU
0.
81
400 48
6
0.001
17
0
55
5
-65
RT
C2
CIU+cr
0.
75
403 49
6
0.01
18
1
52
4
-28
RT
C3
CIU+cr
0.
77
399 49
7
0.005
14
8
48
0
18
Paper 1B 05A — SINOROCK2004 Symposium
Int. J. Rock Mech. Min. Sci. Vol. 41, No. 3, CD-ROM, © 2004 Elsevier Ltd.
4
RT
C4
CIU+cr
0.
80
404 48
8
0.005
94
45
3
31
RT
C5
Barla (1999) 0.
65
396 50
1
0.001
13
4
49
1
9
* B = Skempton’s parameter; B.P. = back
pressure;
σ
’
c
= consolidation effective stress;
= axial strain rate in the shearing phase;
t
max
= (
σ
v
-
σ
h
)
max
/ 2; s’
max
= (
σ
’
v
+
σ
’
h
)
max
/ 2;
∆
u = excess pore pressure.
0
0.1
0.2
0.3
0.4
0.0
1.0
2.0
3.0
4.0
5.0
External axial strain [%]
Deviator stress [MPa]
RTC1
0.001 mm/min
RTC2
0.01 mm/min
RTC3
0.005 mm/min
RTC4
0.005 mm/min
RTC5
0.001 mm/min
Figure 5. Stress-strain behaviour for different
axial strain rates.
Table 3. Strength parameters (mean values)*.
c
u
[kPa]
c
p
’
[kPa]
c
r
’
[kPa]
φ’
p
[°]
φ’
r
[°]
Tunnel
TX
TX
DS
T
X
D
S
T
X
D
S
TX
DS
S. Donato
-
35
-
10
-
24
34
20
24
Raticosa
100-900
16-540
16
-
16
-
Osteria
-
48
23
15
20 29
22
17
7
Sparvo
170-340
70
-
70
-
12
-
12
-
S. Vitale
-
-
28
-
0
-
26
-
20
Garbinogar
a
100-800
70
0
31
17
*
c
u
= undrained shear strength;
c
p
’, c
r
’ = peak
and residual cohesion;
φ’
p
,
φ’
r
= peak and residual
friction angle.
The mechanical behaviour of clay shales may
be inferred by comparing the results of triaxial tests
(TX) and direct shear tests (DS) in terms of
strength envelopes (Fig. 6) and strength parameters
(Tab. 3). These data together with the experience
gained during laboratory testing allow one to state
the following considerations.
•
The strength parameters are generally
influenced by structure (particle arrangement
and orientation of discontinuities), saturation
degree, loosening and stress release due to
sampling, etc.
•
Failure in TX tests often takes place along
planes on which fragments tend to align. The
development of a failure plane is free and
strength parameters are often influenced by
the direction of shearing.
•
The failure plane in DS tests is imposed so
that the strength parameters are higher than
those obtained by the TX tests.
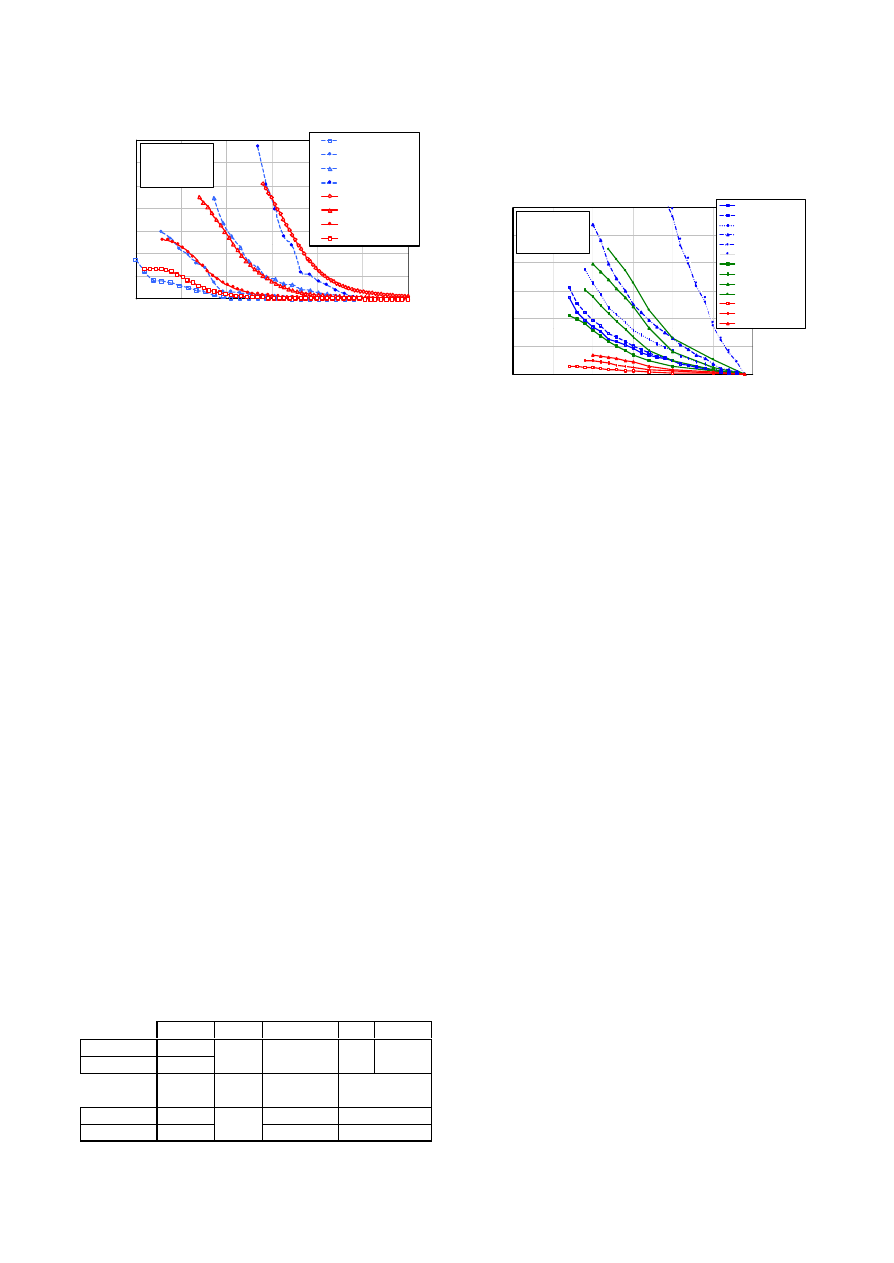
Clay shales exhibit a time-dependent behaviour
as shown by the strain rate versus time plots
(Fig. 7). Time-dependent strains develop for a
mobilised strength nearly equal to 50% of the
failure value. Moreover, the strain rate is shown not
to increase significantly as the stress increases,
even if the failure deviator stress is attained.
0.0
0.1
0.2
0.3
0.4
0.5
0.6
0.7
0.8
0.9
1.0
0.0
0.5
1.0
1.5
2.0
Normal stress [MPa]
Shear strength [MPa]
Sparvo
S. Vitale
S. Donato
Garbinogara
Osteria
Raticosa
Figure 6. Shear strength envelopes.
0.000001
0.00001
0.0001
0.001
0.01
0.1
10
100
1000
10000
100000
Time [min]
Axial strain rate [%/min]
Sparvo SL=32%
Sparvo SL=50%
Sparvo SL=86%
Raticosa SL=55%
Raticosa SL=78%
Raticosa SL=87%
Raticosa SL=100%
Figure 7. Axial strain rate versus time obtained
for different stress levels (SL).
4. CASE STUDIES
The modern engineering approach to the design
of tunnels, as applied in full face excavation,
requires the following: definition of a realistic
geological and geotechnical model; prediction of
the ground behaviour by means of available
methods (previous experience, closed-form
solutions, numerical methods); selection of the
excavation sequence and support systems; final
design analyses; verification by observation and
monitoring.
For the purpose of the present paper it is of
interest to apply some of these tools to case studies,
in order to gain insights into the design parameters
a
ε&
Paper 1B 05A — SINOROCK2004 Symposium
Int. J. Rock Mech. Min. Sci. Vol. 41, No. 3, CD-ROM, © 2004 Elsevier Ltd.
5
of clay shales. For a circular tunnel (7.14 m radius)
subjected to a hydrostatic in situ state of stress (the
tunnel is at 100 m depth and the pore pressure is
taken to be 1.0 MPa), the ground reaction curve
can be obtained as shown in Figure 8.
The calculations have been performed by using
closed-form solutions, in terms of total (Ribacchi
and Riccioni, 1977) and effective stresses
(Labiouse and Giraud, 1998), and numerical
modelling by the Finite Difference Method (FDM)
and the Flac code (Itasca, 2000). Water flow is not
considered in the computations. Clay shales are
assumed to behave as an elastic perfectly plastic
0
20
40
60
80
100
0
2
4
6
8
10
12
14
16
18
20
Normalized radial displacement [%]
Normalized support pressure [%]
total stresses - closed-form solution
total stresses - numerical analysis
effective stresses - closed-form solution
effective stresses - numerical solution
range of allowed radial displcaments
analysis
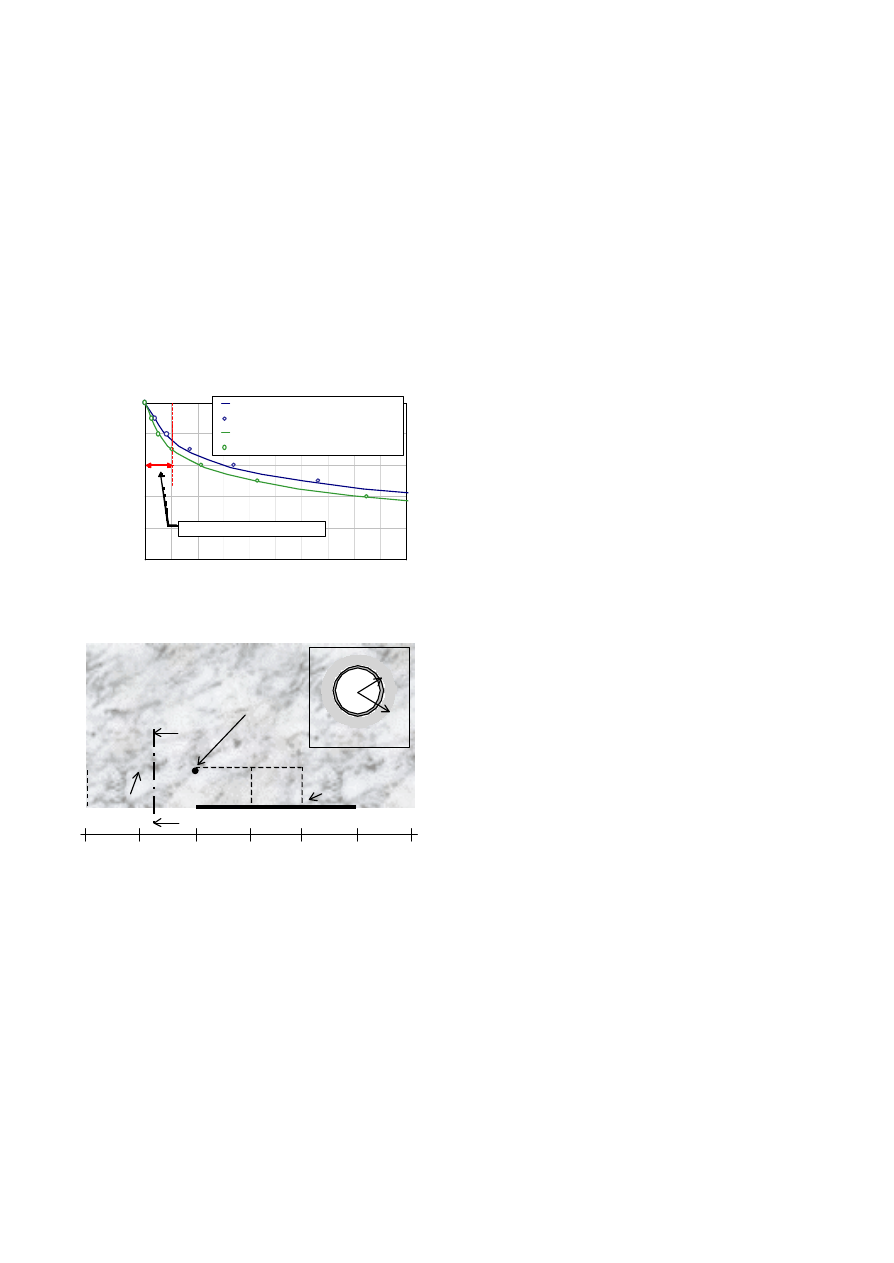
Figure 8. Normalized ground reaction curve in
the case of Sparvo tunnel.
Figure 9. Sketch of the numerical model.
medium with the following parameters:
•
Undrained cohesion
c
u
= 340 kPa
•
Effective cohesion
c’ = 70 kPa
•
Effective friction angle
φ’ = 12 °
•
Young’s modulus
E’ = 40 MPa
•
Poisson’s ratio
ν = 0.35 -
•
Porosity
n = 0.25 -
•
Drained unit weight
γ
d
=
20 kN/m
3
which are typical values obtained from laboratory
tests carried out for the Sparvo tunnel at the design
stage (Tab. 3).
It is immediate to observe from the ground
reaction curve of Figure 8 that in order to keep the
normalized radial displacement below an
acceptable limit (say not greater than 1 to 2%), one
would need a support pressure of 60 to 80% of the
in situ state of stress (2.2 MPa). This is
significantly greater than the support pressure that
can be applied with a stabilization system at the
face and along the tunnel perimeter. However, it is
noted that, based on present experience derived
from excavation of large size tunnels in Italian clay
shales, although with some difficulties, these
tunnels have been excavated successfully. Should
one say that the prediction of tunnel performance
based on laboratory tests is not reliable?
To address this question, it is of interest to
consider the case of the Osteria access adit. This
tunnel (about 10.2 m span, 90 m
2
cross section), a
secondary access to the Raticosa tunnel (high speed
railway line Bologna-Florence), was excavated full
face through clay shales, under overburden depth
up to 200 m. With systematic reinforcement of the
tunnel face and heavy support at the heading, the
tunnel was completed reaching average
convergences of the tunnel cross section up to
46 mm and maximum longitudinal displacement
(“extrusion”) at the face of 137 mm.
Numerical analyses were performed by FDM
and an axi-symmetric coupled model reproducing
the full excavation sequence of an equivalent
circular tunnel (5.4 m radius) with the overburden
depth equal to 148 m (pore pressure 1.48 MPa).
The reinforcement was represented by a zone of
increased cohesion and Young modulus (150%)
while the support was simulated either with a
fictitious pressure or an equivalent lining (Fig. 9).
The results obtained are shown in Figure 10,
where the computed values are compared with the
observed values obtained from the longitudinal
displacements measured at the tunnel face by a
sliding micrometer. It is shown from Figure 10
that, independent of the many simplifications
introduced, the deformational response of the
tunnel, assuming a Mohr-Coulomb elasto-plastic
perfectly plastic law, is well represented. However,
in order to do this, the clay shales parameters
needed to be increased from the laboratory values
to the in situ values:
c’, from 20 kPa to 130 kPa;
E’, from 40 MPa to 200 MPa (dilatancy
ψ
= 0°).
60 m
0
10
20
30
40
50
Longitudinal
displacements
(sliding micrometer)
Radial
displacements
(optical targets)
Reinforced
ground
Primary
lining
9.5 m
7.0 m
A
A
Paper 1B 05A — SINOROCK2004 Symposium
Int. J. Rock Mech. Min. Sci. Vol. 41, No. 3, CD-ROM, © 2004 Elsevier Ltd.
6
0
20
40
60
80
100
120
140
45
50
55
60
65
70
75
Face advance [m]
Longitudinal displacement [mm]
04/07/98
05/07/98
07/07/98
08/07/98
Mohr-Coulomb
computed
values
0 5 10 15 20 25 30
Sliding
micrometer
installation (zero):
03/07/98
Mohr-Coulomb
computed
values
Figure 10. Longitudinal displacements at the face
of Osteria tunnel.
Another case of interest is the Raticosa tunnel
(high speed railway line Bologna-Florence), where
the excavation from the North side took place
through a paleo-landslide zone, in intensely
tectonized clay shales and under a limited
overburden (from few meters to 100 m). This
tunnel (about 14 m span, 160 m
2
cross section),
excavated full face with fiber glass dowels
reinforcement of the face and heavy support
systems installed in the heading, underwent
significant longitudinal displacements at the face as
shown typically in Figure 11, at a depth of 50 m
(pore pressure 0.4 MPa).
Also for this case numerical analyses were
performed with the FDM and an axi-symmetric
coupled model, in accordance with the same
procedure illustrated for the Osteria access adit. By
adopting a Mohr-Coulomb elasto-plastic perfectly
plastic law for the ground, the computed results
based on laboratory data gave once again
unrealistically high displacements around the
tunnel and an extent of the plastic zone such as to
make the tunnel unstable. However, by retaining
the same Mohr-Coulomb elasto-plastic model with
the ground parameters scaled up as shown in Table
4, the computed longitudinal displacements were
significantly underestimated with respect to the
measured values, as illustrated in Figure 11.
Considering the apparent time-dependent
behaviour influencing the tunnel response at the
face, as shown in Figure 11 for the longitudinal
Table 4. Raticosa tunnel parameters.
c’ [kPa]
φ’ [°]
ψ [°]
ν [-] σ
t
[kPa]
Laboratory
20
Tunnel
100
16
0
0.3
5.5
G
M
[MPa]
G
K
[MPa]
η
K
[MPa min]
η
M
[MPa min]
Laboratory
100
1.05
⋅
10
5
8.0
⋅
10
5
Tunnel
400
24.5
1.1
⋅
10
5
8.0
⋅
10
8
*
σ
t
= tensile strength;
G = shear modulus;
η
=
viscosity;
M
= Maxwell component;
K
= Kelvin
component.
0
20
40
60
80
100
120
0
5
10
15
20
25
30
Face advance [m]
Longitudinal displacement [mm]
04/07/98, h.13.00
04/07/98, h.20.00
05/07/98
06/07/98
15/07/98
16/07/98
CVISC
-
-
-
Mohr-Coulomb
-
-
Sliding
micrometer
installation (zero):
28/06/98
Figure 11. Longitudinal displacements at the face
of Raticosa tunnel.
displacement during excavation, it was decided to
adopt a visco-elastic plastic law (CVISC) available
with the Flac code. The results obtained are
illustrated in the same Figure 11, where the
computed values are compared with the monitored
data. It is shown that by invoking a time-dependent
behaviour for the ground, once again with the in
situ parameters scaled up with respect to the
laboratory values (Tab. 4), the tunnel response is
simulated satisfactorily.
5. CONCLUSIONS
The difficulties in characterisation of Italian
clay shales have been discussed with reference to
laboratory testing and large size tunnel excavation,
assisted by systematic performance monitoring
during face advance. It has been shown that, in
general, the laboratory data cannot be used directly
to assess the tunnel behaviour and that the
parameters need to be scaled up significantly in
order to obtain an appropriate prediction.
Possible lines of action to overcome these
difficulties are: (a) the use of experience gained
during the excavation of large size tunnels in clay
shales, as a guidance to assess the ground response;
(b) the use of a test section, where systematic
observation and monitoring during face advance
takes place in conjunction with back analysis.
6. ACKNOWLEDGEMENTS
The work described in this paper was carried
out with the financial support of the Italian
Ministry for University and Research as part of the
Research Programme “Mechanised excavation of
CVISC
computed
values
Mohr-Coulomb
computed
values

Paper 1B 05A — SINOROCK2004 Symposium
Int. J. Rock Mech. Min. Sci. Vol. 41, No. 3, CD-ROM, © 2004 Elsevier Ltd.
7
tunnels”, co-ordinated by Prof. Giovanni Barla.
The authors are grateful to Geodes (Turin) for the
technical support, to Rocksoil (Milan) for the
monitoring data and to Fiat Engineering (Turin) for
providing the cubic samples.
7. REFERENCES
Barla, G. 2002. Tunnelling under squeezing rock
conditions. In D. Kolymbas (ed.),
Tunnelling
Mechanics, - Eurosummerschool, Innsbruck,
2001. Rotterdam: Balkema.
Barla, G. 2003. Large span tunnels by full face
excavation in poor ground conditions. DS 5.3 –
Invited Discussion –
XIII ECSMGE, Prague.
Barla, M. 1999.
Tunnels in swelling ground –
Simulation of 3D stress paths by triaxial
laboratory testing. Ph. D. Thesis, Politecnico di
Torino.
Bonini, M. 2003.
Mechanical behaviour of Clay-
Shales (Argille Scagliose) and implications on
the design of tunnels. Ph. D. Thesis, Politecnico
di Torino.
Itasca, 2000. Flac, Fast Lagrangian Analysis of
Continua, Version 3.4. Itasca Consulting Group
Inc., Minneapolis.
Labiouse, V., Giraud, A. 1998. Analytical solutions
for the undrained response of a poro-elasto-
plastic medium around a cylindrical opening.
Proc. of the Biot conference on poromechanics.
Louvain la Neuve. Rotterdam: Balkema.
Lunardi, P. 1995. Progetto e costruzione di gallerie
secondo il metodo basato sull’analisi delle
deformazioni controllate nelle rocce e nei suoli.
Quarry and Construction.
Ribacchi, R., Riccioni, R. 1977. Stato di sforzo e di
deformazione intorno ad una galleria circolare.
Gallerie e Grandi Opere Sotterranee, 4.
Madsen, F. T. 1999. Suggested methods for
laboratory testing of swelling rocks. ISRM
Suggested Methods.
Int. J. Rock Mech. Min.
Sci. & Geomech. Abstr., 36.
Wyszukiwarka
Podobne podstrony:
Advanced Methods for Development of Wind turbine models for control designe
Design of a 10 kW Inverter for a Fuel Cell
Rindel Computer Simulation Techniques For Acoustical Design Of Rooms How To Treat Reflections
Design and construction of three phase transformer for a 1 kW multi level converter
Rewicz, Tomasz i inni Isolation and characterization of 8 microsatellite loci for the ‘‘killer shri
Recommendations for the Design of Bridges [Benson]
Principles of Sigma Delta Conversion for Analog to Digital Converters
100108 nmea 0183 sentences not recommended for new designs
Bartom NMT support concepts for tunnel in weak rocks
iraq book of iraq dodipp intelligence for military personnel 543NE5VSFEJ27BZY4ZHZFOZ3PIEZBN7S3XKQI7
Drying, shrinkage and rehydration characteristics of kiwifruits during hot air and microwave drying
Types of A V Aids and relevance for LT
Improved Characterization of Nitromethane, Nitromethane Mixtures, and Shaped Charge Jet
więcej podobnych podstron