
How to plan capacity for embedded analytics with
Power BI Premium
By Aviv Ezrachi
Senior PM
Microsoft
©2017 Microsoft Corp. All rights reserved. This document is provided “as-is.” Information and views expressed in this document, including
URL and other internet website references, may change without notice. You bear the risk of using it.
Some examples are for illustration only and are fictitious. No real association is intended or inferred.
This document does not provide you with any legal rights to any intellectual property in any Microsoft product. You may copy and use this
document for your internal, reference purposes.

Introduction
Power BI Premium offers app developers/ISVs a predictable and affordable embedded analytics offering
with one API surface and a consistent set of Power BI capabilities. Power BI Premium addresses the
challenges of enterprise deployment workloads as well app developers/ISV multi-tenant solutions.
Power BI Premium provides an affordable entry point for app developers/ISVs, and allows businesses to
expand in a cost effective manner.
This paper provides guidance for the app developer/ISV to determine the most appropriate capacity for
its businesses. This guidance is specific for embedded analytics for app developers/ISVs who leverage a
multi-tenant system. Pricing information for organizational BI systems can be estimated through the
. Additional documentation and guidance is
Licensing requirements for embedded analytics
Two elements are required to take embedded analytics to production. First, Power BI Pro licenses are
required for administration, content publishing, and development. Then, Power BI Premium is required
for testing and deployment.
Development
Development requires a Power BI Pro license for each developer on the team. Anyone using the Power
BI APIs is required to have a Power BI Pro license. Power BI Pro licenses contain all APIs and can be used
to develop a full proof of concept.
Pre-production and production
For testing and deployment, Power BI Premium must be acquired. Power BI Premium enables full testing
of the solution with embed tokens that allow multi-user access to the embedded Power BI reports and
dashboards. When deploying to a production environment, options include using the same Power BI
Premium capacity used for pre-production or a dedicated capacity for pre-production and another for
production.
How much capacity do I need?
Calculating how much capacity is needed is based on multiple parameters like the specific data models
used, the number and complexity of queries, the hourly distribution of the usage of your SaaS
application, the data refresh rates, and other usage patterns that are hard to predict.
This paper serves as guidance when planning capacity. Capacity estimation is not an exact science and
performance cannot be guaranteed.
APP DVELOPER/ISVS SHOULD USE THE GUIDANCE IN THIS PAPER. PLAN ON PROVISIONING
ENOUGH CAPACITY TO COMFORTABLY HANDLE PEAK USAGE. IF SUFFICIENT CAPACITY IS
NOT RESERVED, CORES COULD BECOME OVERLOADED AND PERFORMANCE WILL SUFFER.
Dedicated capacity nodes: the v-Cores
Purchase enough capacity support the workload.
Power BI Premium planning for app developers/ISVs for embedded analytics
Plan on provisioning enough capacity to comfortably handle peak usage. Because embedded analytics is
a solution for report rendering and data querying, app developer/ISV capacity calculations are based on
a page renders’ range at peak hour.
We do not include data refresh as a parameter for the peak hour load. To keep data fresh without
affecting performance, run data refresh during off-peak hours.
What is a page render?
A page render is counted any time Power BI visuals are loaded on a page. A page refresh counts as a
page render, as does any other page interactivity, like slice and dice, filtering, etc. Typically, multiple
queries running on the backend cores
1
translate to a page render.
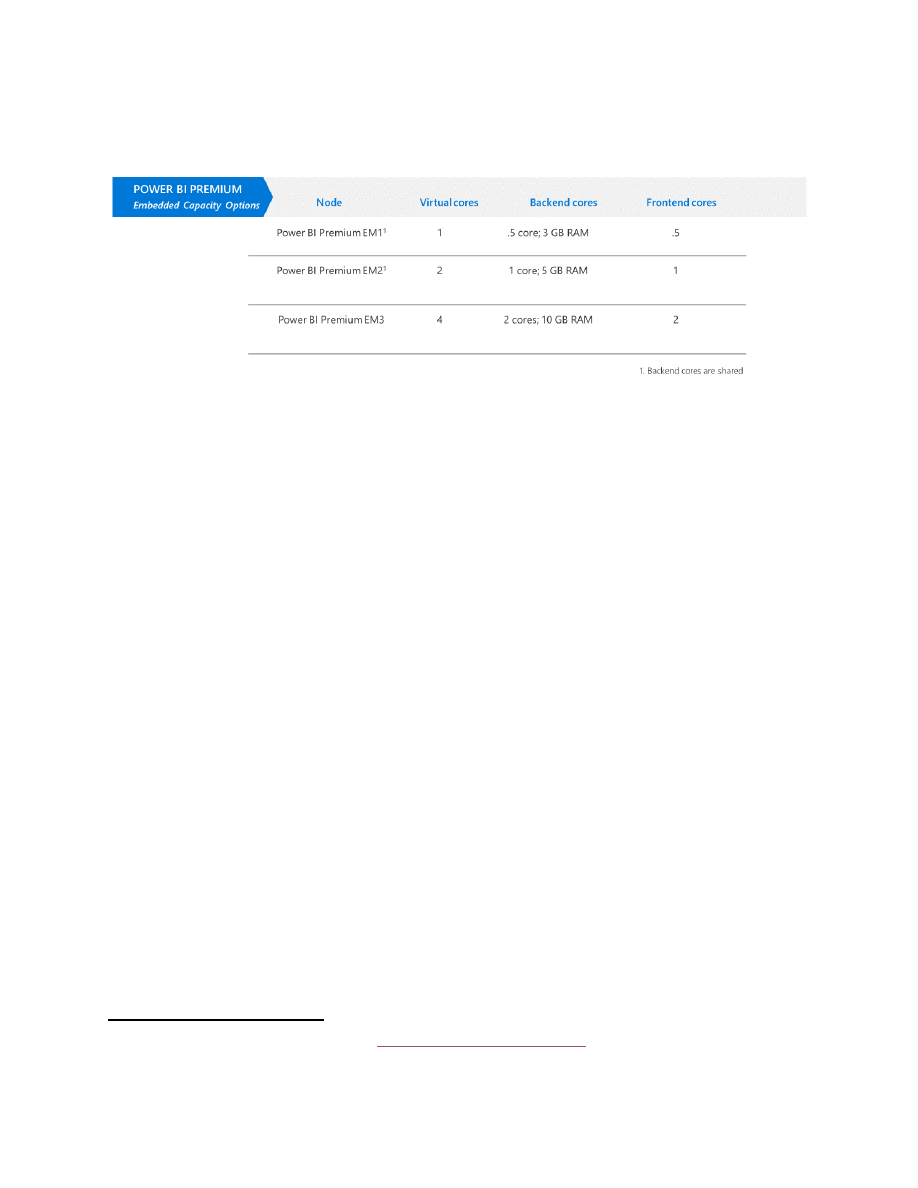
The load generated on the cores depends on the number of visual elements contained on a page. A
typical page contains up to 10 visual elements.
1
You can learn more about cores in the
Estimate your capacity
Examples
To help estimate the page renders at peak hour, here are some examples:
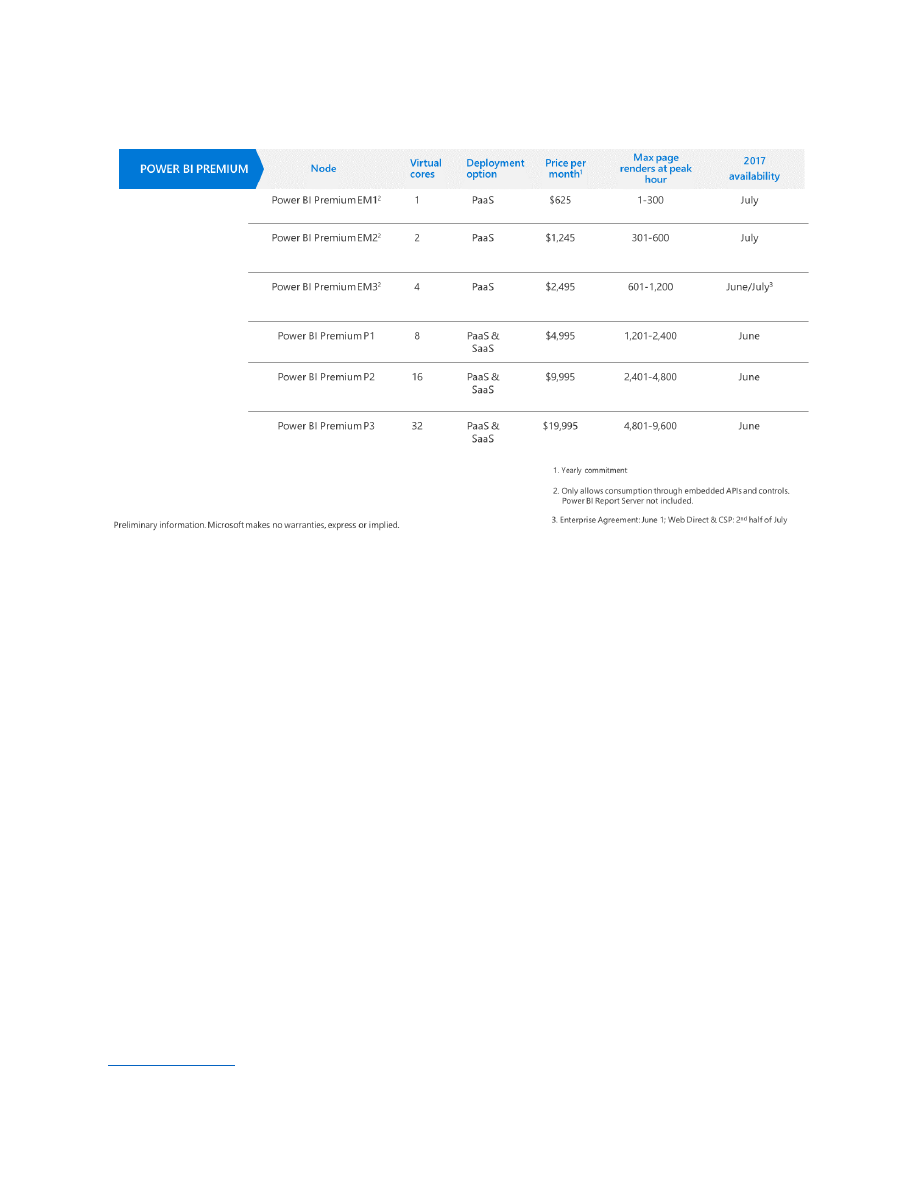
Example 1
The ISV knows that the SaaS App with embedded Power BI handles 100 users in the peak hour. It is
assumed that these users will trigger a total of 250 page renders for that hour because each user will
load a report and interact with it 2.5 times during the peak hour. Per the above table, the ISV should
choose Power BI Premium EM1.
Example 2
The ISV reading its telemetry data knows the App usage patterns of the application with Power BI
embedded reports. The ISV assumes there is potential for 100,000 monthly page renders. A month
consists of 220 hours of work which is spread across 22 days with 10 hours of work in a day.
By dividing the expected page renders in a month by the hours in a month, we show that an average
hour handles 455 page renders. From telemetry data, the ISV knows the ratio between peak and
average use is 4:1. Using this ratio they calculate page renders at the busiest hour in the month as
1820, for which the ISV should choose Power BI Premium P1.
Capacity monitoring
Once in production, Power BI Premium CPU, memory, and direct query utilization can be monitored
through the Power BI admin portal, under Power BI Premium settings. For more information, see
Wyszukiwarka
Podobne podstrony:
4133 Power BI mobile apps�enabling data analytics on the go Article 2
280 small hydro power plant v1 Nieznany (2)
6624 Getting started with the Power BI for Android app WSG 2
6623 Getting started with the Power BI mobile app for Windows 10 WSG 2
6625 Configuring Power BI mobile apps with Microsoft Intune WSG 2
6628 Getting started with Power BI PG 2
6482 Ask find and act�harnessing the power of Cortana and Power BI Article
6622 Getting started with the Power BI for iOS app WSG 2
H B Gilmour Twitches 1 Power of Two (v1 0)
Sociology The Economy Of Power An Analytical Reading Of Michel Foucault I Al Amoudi
Analytical Method To Estimate The Maximum Power For A Photovoltaic Inverter System
PO wyk07 v1
prezentacja power media
s10 v1
Power D, zebranie zarządu
karty płatnicze (power point)
elastyczność popytu (power point)
kryptologia w bankowości (power point)
więcej podobnych podstron