Introduction to Spectroscopy
In previous sections of this text the structural formulas of hundreds of organic compounds have been reported, often with very little supporting evidence. These structures, and millions of others described in the scientific literature, are in fact based upon sound experimental evidence, which was omitted at the time in order to focus on other aspects of the subject. Much of the most compelling evidence for structure comes from spectroscopic experiments, as will be demonstrated in the following topics.
The Light of Knowledge is an often used phrase, but it is particularly appropriate in reference to spectroscopy. Most of what we know about the structure of atoms and molecules comes from studying their interaction with light (electromagnetic radiation). Different regions of the electromagnetic spectrum provide different kinds of information as a result of such interactions. Realizing that light may be considered to have both wave-like and particle-like characteristics, it is useful to consider that a given frequency or wavelength of light is associated with a "light quanta" of energy we now call a photon. As noted in the following equations, frequency and energy change proportionally, but wavelength has an inverse relationship to these quantities.
In order to "see" a molecule, we must use light having a wavelength smaller than the molecule itself (roughly 1 to 15 angstrom units). Such radiation is found in the X-ray region of the spectrum, and the field of X-ray crystallography yields remarkably detailed pictures of molecular structures amenable to examination. The chief limiting factor here is the need for high quality crystals of the compound being studied. The methods of X-ray crystallography are too complex to be described here; nevertheless, as automatic instrumentation and data handling techniques improve, it will undoubtedly prove to be the procedure of choice for structure determination.
The spectroscopic techniques described below do not provide a three-dimensional picture of a molecule, but instead yield information about certain characteristic features. A brief summary of this information follows:
• Mass Spectrometry: Sample molecules are ionized by high energy electrons. The mass to charge ratio of these ions is measured very accurately by electrostatic acceleration and magnetic field perturbation, providing a precise molecular weight. Ion fragmentation patterns may be related to the structure of the molecular ion.
• Ultraviolet-Visible Spectroscopy: Absorption of this relatively high-energy light causes electronic excitation. The easily accessible part of this region (wavelengths of 200 to 800 nm) shows absorption only if conjugated pi-electron systems are present.
• Infrared Spectroscopy: Absorption of this lower energy radiation causes vibrational and rotational excitation of groups of atoms. within the molecule. Because of their characteristic absorptions identification of functional groups is easily accomplished.
• Nuclear Magnetic Resonance Spectroscopy: Absorption in the low-energy radio-frequency part of the spectrum causes excitation of nuclear spin states. NMR spectrometers are tuned to certain nuclei (e.g. 1H, 13C, 19F & 31P). For a given type of nucleus, high-resolution spectroscopy distinguishes and counts atoms in different locations in the molecule.
Mass Spectrometry
1. The Mass Spectrometer
In order to measure the characteristics of individual molecules, a mass spectrometer converts them to ions so that they can be moved about and manipulated by external electric and magnetic fields. The three essential functions of a mass spectrometer, and the associated components, are:
1. A small sample of compound is ionized, usually to cations by loss of an electron. The Ion Source
2. The ions are sorted and separated according to their mass and charge. The Mass Analyzer
3. The separated ions are then detected and tallied, and the results are displayed on a chart. The Detector
Because ions are very reactive and short-lived, their formation and manipulation must be conducted in a vacuum. Atmospheric pressure is around 760 torr (mm of mercury). The pressure under which ions may be handled is roughly 10-5 to 10-8 torr (less than a billionth of an atmosphere). Each of the three tasks listed above may be accomplished in different ways. In one common procedure, ionization is effected by a high energy beam of electrons, and ion separation is achieved by accelerating and focusing the ions in a beam, which is then bent by an external magnetic field. The ions are then detected electronically and the resulting information is stored and analyzed in a computer. A mass spectrometer operating in this fashion is outlined in the following diagram. The heart of the spectrometer is the ion source. Here molecules of the sample (black dots) are bombarded by electrons (light blue lines) issuing from a heated filament. This is called an EI (electron-impact) source. Gases and volatile liquid samples are allowed to leak into the ion source from a reservoir (as shown), but non-volatile solids and liquids may be introduced directly. Cations formed by the electron bombardment (red dots) are pushed away by a charged repellor plate (anions are attracted to it), and accelerated toward other electrodes, having slits through which the ions pass as a beam. Some of these ions fragment into smaller cations and neutral fragments. When the ion beam experiences a strong magnetic field perpendicular to its direction of motion, the ions are deflected in an arc whose radius is inversely proportional to the mass of the ion. Lighter ions are deflected more than heavier ions. By varying the strength of the magnetic field, ions of different mass can be focused progressively on a detector fixed at the end of a curved tube (also under a high vacuum).
When a high energy electron collides with a molecule it often ionizes it by knocking away one of the molecular electrons (either bonding or non-bonding). This leaves behind a molecular ion (colored red in the following diagram). Residual energy from the collision may cause the molecular ion to fragment into neutral pieces (colored green) and smaller fragment ions (colored pink and orange). The molecular ion is a radical cation, but the fragment ions may either be radical cations (pink) or carbocations (orange), depending on the nature of the neutral fragment. An animated display of this ionization process will appear if you click on the ion source of the mass spectrometer diagram.
2. The Nature of Mass Spectra
A mass spectrum will usually be presented as a vertical bar graph, in which each bar represents an ion having a specific mass-to-charge ratio (m/z) and the length of the bar indicates the relative abundance of the ion. The most intense ion is assigned an abundance of 100, and it is referred to as the base peak. Most of the ions formed in a mass spectrometer have a single charge, so the m/z value is equivalent to mass itself. Modern mass spectrometers easily distinguish (resolve) ions differing by only a single atomic mass unit (amu), and thus provide completely accurate values for the molecular mass of a compound. The highest-mass ion in a spectrum is normally considered to be the molecular ion, and lower-mass ions are fragments from the molecular ion, assuming the sample is a single pure compound.
The following diagram displays the mass spectra of three simple gaseous compounds, carbon dioxide, propane and cyclopropane. The molecules of these compounds are similar in size, CO2 and C3H8 both have a nominal mass of 44 amu, and C3H6 has a mass of 42 amu. The molecular ion is the strongest ion in the spectra of CO2 and C3H6, and it is moderately strong in propane. The unit mass resolution is readily apparent in these spectra (note the separation of ions having m/z=39, 40, 41 and 42 in the cyclopropane spectrum). Even though these compounds are very similar in size, it is a simple matter to identify them from their individual mass spectra. By clicking on each spectrum in turn, a partial fragmentation analysis and peak assignment will be displayed. Even with simple compounds like these, it should be noted that it is rarely possible to explain the origin of all the fragment ions in a spectrum. Also, the structure of most fragment ions is seldom known with certainty.
Since a molecule of carbon dioxide is composed of only three atoms, its mass spectrum is very simple. The molecular ion is also the base peak, and the only fragment ions are CO (m/z=28) and O (m/z=16). The molecular ion of propane also has m/z=44, but it is not the most abundant ion in the spectrum. Cleavage of a carbon-carbon bond gives methyl and ethyl fragments, one of which is a carbocation and the other a radical. Both distributions are observed, but the larger ethyl cation (m/z=29) is the most abundant, possibly because its size affords greater charge dispersal. A similar bond cleavage in cyclopropane does not give two fragments, so the molecular ion is stronger than in propane, and is in fact responsible for the the base peak. Loss of a hydrogen atom, either before or after ring opening, produces the stable allyl cation (m/z=41). The third strongest ion in the spectrum has m/z=39 (C3H3). Its structure is uncertain, but two possibilities are shown in the diagram. The small m/z=39 ion in propane and the absence of a m/z=29 ion in cyclopropane are particularly significant in distinguishing these hydrocarbons.
Most stable organic compounds have an even number of total electrons, reflecting the fact that electrons occupy atomic and molecular orbitals in pairs. When a single electron is removed from a molecule to give an ion, the total electron count becomes an odd number, and we refer to such ions as radical cations. The molecular ion in a mass spectrum is always a radical cation, but the fragment ions may either be even-electron cations or odd-electron radical cations, depending on the neutral fragment lost. The simplest and most common fragmentations are bond cleavages producing a neutral radical (odd number of electrons) and a cation having an even number of electrons. A less common fragmentation, in which an even-electron neutral fragment is lost, produces an odd-electron radical cation fragment ion. Fragment ions themselves may fragment further. As a rule, odd-electron ions may fragment either to odd or even-electron ions, but even-electron ions fragment only to other even-electron ions.
The masses of molecular and fragment ions also reflect the electron count, depending on the number of nitrogen atoms in the species.
Ions with no nitrogen |
odd-electron ions |
even-electron ions |
Ions having an |
odd-electron ions |
even-electron ions |
This distinction is illustrated nicely by the follwing two examples. The unsaturated ketone, 4-methyl-3-pentene-2-one, on the left has no nitrogen so the mass of the molecular ion (m/z = 98) is an even number. Most of the fragment ions have odd-numbered masses, and therefore are even-electron cations. Diethylmethylamine, on the other hand, has one nitrogen and its molecular mass (m/z = 87) is an odd number. A majority of the fragment ions have even-numbered masses (ions at m/z = 30, 42, 56 & 58 are not labeled), and are even-electron nitrogen cations. The weak even -electron ions at m/z=15 and 29 are due to methyl and ethyl cations (no nitrogen atoms). The fragmentations leading to the chief fragment ions will be displayed by clicking on the appropriate spectrum. Repeated clicks will cycle the display.
|
||
4-methyl-3-pentene-2-one |
|
N,N-diethylmethylamine |
When non-bonded electron pairs are present in a molecule (e.g. on N or O), fragmentation pathways may sometimes be explained by assuming the missing electron is partially localized on that atom. A few such mechanisms are shown above. Bond cleavage generates a radical and a cation, and both fragments often share these roles, albeit unequally.
3. Isotopes
Since a mass spectrometer separates and detects ions of slightly different masses, it easily distinguishes different isotopes of a given element. This is manifested most dramatically for compounds containing bromine and chlorine, as illustrated by the following examples. Since molecules of bromine have only two atoms, the spectrum on the left will come as a surprise if a single atomic mass of 80 amu is assumed for Br. The five peaks in this spectrum demonstrate clearly that natural bromine consists of a nearly 50:50 mixture of isotopes having atomic masses of 79 and 81 amu respectively. Thus, the bromine molecule may be composed of two 79Br atoms (mass 158 amu), two 81Br atoms (mass 162 amu) or the more probable combination of 79Br-81Br (mass 160 amu). Fragmentation of Br2 to a bromine cation then gives rise to equal sized ion peaks at 79 and 81 amu.
|
|
|
|
|
bromine |
|
vinyl chloride |
|
methylene chloride |
The center and right hand spectra show that chlorine is also composed of two isotopes, the more abundant having a mass of 35 amu, and the minor isotope a mass 37 amu. The precise isotopic composition of chlorine and bromine is:
Chlorine: 75.77% 35Cl and 24.23% 37Cl
Bromine: 50.50% 79Br and 49.50% 81Br
The presence of chlorine or bromine in a molecule or ion is easily detected by noticing the intensity ratios of ions differing by 2 amu. In the case of methylene chloride, the molecular ion consists of three peaks at m/z=84, 86 & 88 amu, and their diminishing intensities may be calculated from the natural abundances given above. Loss of a chlorine atom gives two isotopic fragment ions at m/z=49 & 51amu, clearly incorporating a single chlorine atom. Fluorine and iodine, by contrast, are monoisotopic, having masses of 19 amu and 127 amu respectively. It should be noted that the presence of halogen atoms in a molecule or fragment ion does not change the odd-even mass rules given above.
To make use of a calculator that predicts the isotope clusters for different combinations of chlorine, bromine and other elements Click Here. This application was developed at Colby College.
Two other common elements having useful isotope signatures are carbon, 13C is 1.1% natural abundance, and sulfur, 33S and 34S are 0.76% and 4.22% natural abundance respectively. For example, the small m/z=99 amu peak in the spectrum of 4-methyl-3-pentene-2-one (above) is due to the presence of a single 13C atom in the molecular ion. Although less important in this respect, 15N and 18O also make small contributions to higher mass satellites of molecular ions incorporating these elements.
The calculator on the right may be used to calculate the isotope contributions to ion abundances 1 and 2 amu greater than the molecular ion (M). Simply enter an appropriate subscript number to the right of each symbol, leaving those elements not present blank, and press the "Calculate" button. The numbers displayed in the M+1 and M+2 boxes are relative to M being set at 100%.
4. Fragmentation Patterns
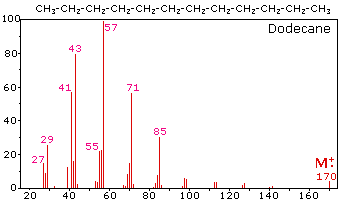
The fragmentation of molecular ions into an assortment of fragment ions is a mixed blessing. The nature of the fragments often provides a clue to the molecular structure, but if the molecular ion has a lifetime of less than a few microseconds it will not survive long enough to be observed. Without a molecular ion peak as a reference, the difficulty of interpreting a mass spectrum increases markedly. Fortunately, most organic compounds give mass spectra that include a molecular ion, and those that do not often respond successfully to the use of milder ionization conditions. Among simple organic compounds, the most stable molecular ions are those from aromatic rings, other conjugated pi-electron systems and cycloalkanes. Alcohols, ethers and highly branched alkanes generally show the greatest tendency toward fragmentation.
The mass spectrum of dodecane on the right illustrates the behavior of an unbranched alkane. Since there are no heteroatoms in this molecule, there are no non-bonding valence shell electrons. Consequently, the radical cation character of the molecular ion (m/z = 170) is delocalized over all the covalent bonds. Fragmentation of C-C bonds occurs because they are usually weaker than C-H bonds, and this produces a mixture of alkyl radicals and alkyl carbocations. The positive charge commonly resides on the smaller fragment, so we see a homologous series of hexyl (m/z = 85), pentyl (m/z = 71), butyl (m/z = 57), propyl (m/z = 43), ethyl (m/z = 29) and methyl (m/z = 15) cations. These are accompanied by a set of corresponding alkenyl carbocations (e.g. m/z = 55, 41 &27) formed by loss of 2 H. All of the significant fragment ions in this spectrum are even-electron ions. In most alkane spectra the propyl and butyl ions are the most abundant.
The presence of a functional group, particularly one having a heteroatom Y with non-bonding valence electrons (Y = N, O, S, X etc.), can dramatically alter the fragmentation pattern of a compound. This influence is thought to occur because of a "localization" of the radical cation component of the molecular ion on the heteroatom. After all, it is easier to remove (ionize) a non-bonding electron than one that is part of a covalent bond. By localizing the reactive moiety, certain fragmentation processes will be favored. These are summarized in the following diagram, where the green shaded box at the top displays examples of such "localized" molecular ions. The first two fragmentation paths lead to even-electron ions, and the elimination (path #3) gives an odd-electron ion. Note the use of different curved arrows to show single electron shifts compared with electron pair shifts.
The charge distributions shown above are common, but for each cleavage process the charge may sometimes be carried by the other (neutral) species, and both fragment ions are observed. Of the three cleavage reactions described here, the alpha-cleavage is generally favored for nitrogen, oxygen and sulfur compounds. Indeed, in the previously displayed spectra of 4-methyl-3-pentene-2-one and N,N-diethylmethylamine the major fragment ions come from alpha-cleavages. Further examples of functional group influence on fragmentation are provided by a selection of compounds that may be examined by clicking the left button below. Useful tables of common fragment ions and neutral species may be viewed by clicking the right button.
The complexity of fragmentation patterns has led to mass spectra being used as "fingerprints" for identifying compounds. Environmental pollutants, pesticide residues on food, and controlled substance identification are but a few examples of this application. Extremely small samples of an unknown substance (a microgram or less) are sufficient for such analysis. The following mass spectrum of cocaine demonstrates how a forensic laboratory might determine the nature of an unknown street drug. Even though extensive fragmentation has occurred, many of the more abundant ions (identified by magenta numbers) can be rationalized by the three mechanisms shown above. Plausible assignments may be seen by clicking on the spectrum, and it should be noted that all are even-electron ions. The m/z = 42 ion might be any or all of the following: C3H6, C2H2O or C2H4N. A precise assignment could be made from a high-resolution m/z value (next section).
Odd-electron fragment ions are often formed by characteristic rearrangements in which stable neutral fragments are lost. Mechanisms for some of these rearrangements have been identified by following the course of isotopically labeled molecular ions. A few examples of these rearrangement mechanisms may be seen by clicking the following button.
5. High Resolution Mass Spectrometry
Formula |
C6H12 |
C5H8O |
C4H8N2 |
Mass |
84.0939 |
84.0575 |
84.0688 |
In assigning mass values to atoms and molecules, we have assumed integral values for isotopic masses. However, accurate measurements show that this is not strictly true. Because the strong nuclear forces that bind the components of an atomic nucleus together vary, the actual mass of a given isotope deviates from its nominal integer by a small but characteristic amount (remember E = mc2). Thus, relative to 12C at 12.0000, the isotopic mass of 16O is 15.9949 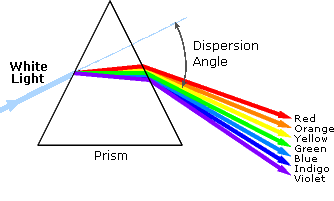
amu (not 16) and 14N is 14.0031 amu (not 14). By designing mass spectrometers that can determine m/z values accurately to four decimal places, it is possible to distinguish different formulas having the same nominal mass. The table on the right illustrates this important feature, and a double-focusing high-resolution mass spectrometer easily distinguishes ions having these compositions. Mass spectrometry therefore not only provides a specific molecular mass value, but it may also establish the molecular formula of an unknown compound.
Tables of precise mass values for any molecule or ion are available in libraries; however, the mass calculator provided below serves the same purpose. Since a given nominal mass may correspond to several molecular formulas, lists of such possibilities are especially useful when evaluating the spectrum of an unknown compound.
Visible and Ultraviolet Spectroscopy
1. Background
An obvious difference between certain compounds is their color. Thus, quinone is yellow; chlorophyll is green; the 2,4-dinitrophenylhydrazone derivatives of aldehydes and ketones range in color from bright yellow to deep red, depending on double bond conjugation; and aspirin is colorless. In this respect the human eye is functioning as a spectrometer analyzing the light reflected from the surface of a solid or passing through a liquid. Although we see sunlight (or white light) as uniform or homogeneous in color, it is actually composed of a broad range of radiation wavelengths in the ultraviolet (UV), visible and infrared (IR) portions of the spectrum. As shown on the right, the component colors of the visible portion can be separated by passing sunlight through a prism, which acts to bend the light in differing degrees according to wavelength. Electromagnetic radiation such as visible light is commonly treated as a wave phenomenon, characterized by a wavelength or frequency. Wavelength is defined on the left below, as the distance between adjacent peaks (or troughs), and may be designated in meters, centimeters or nanometers (10-9 meters). Frequency is the number of wave cycles that travel past a fixed point per unit of time, and is usually given in cycles per second, or hertz (Hz). Visible wavelengths cover a range from approximately 400 to 800 nm. The longest visible wavelength is red and the shortest is violet. Other common colors of the spectrum, in order of decreasing wavelength, may be remembered by the mnemonic: ROY G BIV. The wavelengths of what we perceive as particular colors in the visible portion of the spectrum are displayed and listed below. In horizontal diagrams, such as the one on the bottom left, wavelength will increase on moving from left to right.
|
|
|
|
When white light passes through or is reflected by a colored substance, a characteristic portion of the mixed wavelengths is 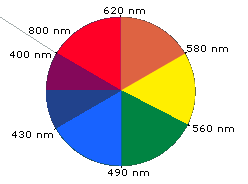
absorbed. The remaining light will then assume the complementary color to the wavelength(s) absorbed. This relationship is demonstrated by the color wheel shown on the right. Here, complementary colors are diametrically opposite each other. Thus, absorption of 420-430 nm light renders a substance yellow, and absorption of 500-520 nm light makes it red. Green is unique in that it can be created by absoption close to 400 nm as well as absorption near 800 nm.
Early humans valued colored pigments, and used them for decorative purposes. Many of these were inorganic minerals, but several important organic dyes were also known. These included the crimson pigment, kermesic acid, the blue dye, indigo, and the yellow saffron pigment, crocetin. A rare dibromo-indigo derivative, punicin, was used to color the robes of the royal and wealthy. The deep orange hydrocarbon carotene is widely distributed in plants, but is not sufficiently stable to be used as permanent pigment, other than for food coloring. A common feature of all these colored compounds, displayed below, is a system of extensively conjugated pi-electrons.
2. The Electromagnetic Spectrum
The visible spectrum constitutes but a small part of the total radiation spectrum. Most of the radiation that surrounds us cannot be seen, but can be detected by dedicated sensing instruments. This electromagnetic spectrum ranges from very short wavelengths (including gamma and x-rays) to very long wavelengths (including microwaves and broadcast radio waves). The following chart displays many of the important regions of this spectrum, and demonstrates the inverse relationship between wavelength and frequency (shown in 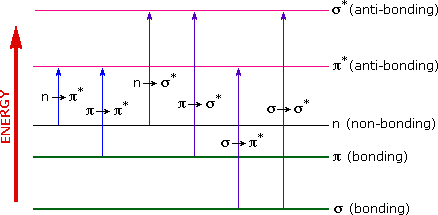
the top equation below the chart).
The energy associated with a given segment of the spectrum is proportional to its frequency. The bottom equation describes this relationship, which provides the energy carried by a photon of a given wavelength of radiation.
3. UV-Visible Absorption Spectra
To understand why some compounds are colored and others are not, and to determine the relationship of conjugation to color, we must make accurate measurements of light absorption at different wavelengths in and near the visible part of the spectrum. Commercial optical spectrometers enable such experiments to be conducted with ease, and usually survey both the near ultraviolet and visible portions of the spectrum.
The visible region of the spectrum comprises photon energies of 36 to 72 kcal/mole, and the near ultraviolet region, out to 200 nm, extends this energy range to 143 kcal/mole. Ultraviolet radiation having wavelengths less than 200 nm is difficult to handle, and is seldom used as a routine tool for structural analysis.
The energies noted above are sufficient to promote or excite a molecular electron to a higher energy orbital. Consequently, absorption spectroscopy carried out in this region is sometimes called "electronic spectroscopy". A diagram showing the various kinds of electronic excitation that may occur in organic molecules is shown on the left. Of the six transitions outlined, only the two lowest energy ones (left-most, colored blue) are achieved by the energies available in the 200 to 800 nm spectrum. As a rule, energetically favored electron promotion will be from the highest occupied molecular orbital (HOMO) to the lowest unoccupied molecular orbital (LUMO), and the resulting species is called an excited state. For a review of molecular orbitals click here.
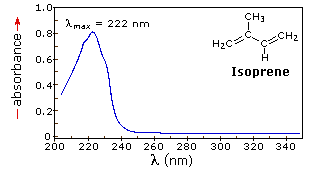
When sample molecules are exposed to light having an energy that matches a possible electronic transition within the molecule, some of the light energy will be absorbed as the electron is promoted to a higher energy orbital. An optical spectrometer records the wavelengths at which absorption occurs, together with the degree of absorption at each wavelength. The resulting spectrum is presented as a graph of absorbance (A) versus wavelength, as in the isoprene spectrum shown below. Since isoprene is colorless, it does not absorb in the visible part of the spectrum and this region is not displayed on the graph. Absorbance usually ranges from 0 (no absorption) to 2 (99% absorption), and is precisely defined in context with spectrometer operation.
Because the absorbance of a sample will be proportional to the number of absorbing molecules in the spectrometer light beam (e.g. their molar concentration in the sample tube), it is necessary to correct the absorbance value for this and other operational factors if the spectra of different compounds are to be compared in a meaningful way. The corrected absorption value is called "molar absorptivity", and is particularly useful when comparing the spectra of different compounds and determining the relative strength of light absorbing functions (chromophores). Molar absorptivity (ε) is defined as:
Molar Absorptivity, ε = A / c l |
(where A= absorbance, c = sample concentration in moles/liter & l = length of light path through the sample in cm.) |
If the isoprene spectrum on the right was obtained from a dilute hexane solution (c = 4 * 10-5 moles per liter) in a 1 cm sample cuvette, a simple calculation using the above formula indicates a molar absorptivity of 20,000 at the maximum absorption wavelength. Indeed the entire vertical absorbance scale may be changed to a molar absorptivity scale once this information about the sample is in hand. Clicking on the spectrum will display this change in units.
|
From the chart above it should be clear that the only molecular moieties likely to absorb light in the 200 to 800 nm region are pi-electron functions and hetero atoms having non-bonding valence-shell electron pairs. Such light absorbing groups are referred to as chromophores. A list of some simple chromophores and their light absorption characteristics is provided on the left above. The oxygen non-bonding electrons in alcohols and ethers do not give rise to absorption above 160 nm. Consequently, pure alcohol and ether solvents may be used for spectroscopic studies.
The presence of chromophores in a molecule is best documented by UV-Visible spectroscopy, but the failure of most instruments to provide absorption data for wavelengths below 200 nm makes the detection of isolated chromophores problematic. Fortunately, conjugation generally moves the absorption maxima to longer wavelengths, as in the case of isoprene, so conjugation becomes the major structural feature identified by this technique.
Molar absorptivities may be very large for strongly absorbing chromophores (>10,000) and very small if absorption is weak (10 to 100). The magnitude ofε reflects both the size of the chromophore and the probability that light of a given wavelength will be absorbed when it strikes the chromophore.
4. The Importance of Conjugation
A comparison of the absorption spectrum of 1-pentene, λmax = 178 nm, with that of isoprene (above) clearly demonstrates the importance of chromophore conjugation. Further evidence of this effect is shown below. The spectrum on the left illustrates that conjugation of double and triple bonds also shifts the absorption maximum to longer wavelengths. From the polyene spectra displayed in the center diagram, it is clear that each additional double bond in the conjugated pi-electron system shifts the absorption maximum about 30 nm in the same direction. Also, the molar absorptivity (ε) roughly doubles with each new conjugated double bond. Spectroscopists use the terms defined in the table on the right when describing shifts in absorption. Thus, extending conjugation generally results in bathochromic and hyperchromic shifts in absorption.
The appearance of several absorption peaks or shoulders for a given chromophore is common for highly conjugated systems, and is often solvent dependent. This fine structure reflects not only the different conformations such systems may assume, but also electronic transitions between the different vibrational energy levels possible for each electronic state. Vibrational fine structure of this kind is most pronounced in vapor phase spectra, and is increasingly broadened and obscured in solution as the solvent is changed from hexane to methanol.
|
|
Terminology for Absorption Shifts Nature of Shift Descriptive Term
To Longer Wavelength Bathochromic
To Shorter Wavelength Hypsochromic
To Greater Absorbance Hyperchromic
To Lower Absorbance Hypochromic
|
To understand why conjugation should cause bathochromic shifts in the absorption maxima of chromophores, we need to look at the relative energy levels of the pi-orbitals. When two double bonds are conjugated, the four p-atomic orbitals combine to generate four pi-molecular orbitals (two are bonding and two are antibonding). This was described earlier in the section concerning diene chemistry. In a similar manner, the three double bonds of a conjugated triene create six pi-molecular orbitals, half bonding and half antibonding. The energetically most favorable π __> π* excitation occurs from the highest energy bonding pi-orbital (HOMO) to the lowest energy antibonding pi-orbital (LUMO).
The following diagram illustrates this excitation for an isolated double bond (only two pi-orbitals) and, on clicking the diagram, for a conjugated diene and triene. In each case the HOMO is colored blue and the LUMO is colored magenta. Increased conjugation brings the HOMO and LUMO orbitals closer together. The energy (ΔE) required to effect the electron promotion is therefore less, and the wavelength that provides this energy is increased correspondingly (remember λ = h • c/ΔE ).
Examples of π __> π* Excitation |
Many other kinds of conjugated pi-electron systems act as chromophores and absorb light in the 200 to 800 nm region. These include unsaturated aldehydes and ketones and aromatic ring compounds. A few examples are displayed below. The spectrum of the unsaturated ketone (on the left) illustrates the advantage of a logarithmic display of molar absorptivity. The π __> π* absorption located at 242 nm is very strong, with an ε = 18,000. The weak n __> π* absorption near 300 nm has an ε = 100.
|
|
|
Benzene exhibits very strong light absorption near 180 nm (ε > 65,000) , weaker absorption at 200 nm (ε = 8,000) and a group of much weaker bands at 254 nm (ε = 240). Only the last group of absorptions are completely displayed because of the 200 nm cut-off characteristic of most spectrophotometers. The added conjugation in naphthalene, anthracene and tetracene causes bathochromic shifts of these absorption bands, as displayed in the chart on the left below. All the absorptions do not shift by the same amount, so for anthracene (green shaded box) and tetracene (blue shaded box) the weak absorption is obscured by stronger bands that have experienced a greater red shift. As might be expected from their spectra, naphthalene and anthracene are colorless, but tetracene is orange.
|
|
|
The spectrum of the bicyclic diene (above right) shows some vibrational fine structure, but in general is similar in appearance to that of isoprene, shown above. Closer inspection discloses that the absorption maximum of the more highly substituted diene has moved to a longer wavelength by about 15 nm. This "substituent effect" is general for dienes and trienes, and is even more pronounced for enone chromophores.
Infrared Spectroscopy
1. Introduction
As noted in a previous chapter, the light our eyes see is but a small part of a broad spectrum of electromagnetic radiation. On the immediate high energy side of the visible spectrum lies the ultraviolet, and on the low energy side is the infrared. The portion of the infrared region most useful for analysis of organic compounds is not immediately adjacent to the visible spectrum, but is that having a wavelength range from 2,500 to 16,000 nm, with a corresponding frequency range from 1.9*1013 to 1.2*1014 Hz.
Photon energies associated with this part of the infrared (from 1 to 15 kcal/mole) are not large enough to excite electrons, but may induce vibrational excitation of covalently bonded atoms and groups. The covalent bonds in molecules are not rigid sticks or rods, such as found in molecular model kits, but are more like stiff springs that can be stretched and bent. The mobile nature of organic molecules was noted in the chapter concerning conformational isomers. We must now recognize that, in addition to the facile rotation of groups about single bonds, molecules experience a wide variety of vibrational motions, characteristic of their component atoms. Consequently, virtually all organic compounds will absorb infrared radiation that corresponds in energy to these vibrations. Infrared spectrometers, similar in principle to the UV-Visible spectrometer described elsewhere, permit chemists to obtain absorption spectra of compounds that are a unique reflection of their molecular structure. An example of such a spectrum is that of the flavoring agent vanillin, shown below.
The complexity of this spectrum is typical of most infrared spectra, and illustrates their use in identifying substances. The gap in the spectrum between 700 & 800 cm-1 is due to solvent (CCl4) absorption. Further analysis (below) will show that this spectrum also indicates the presence of an aldehyde function, a phenolic hydroxyl and a substituted benzene ring. The inverted display of absorption, compared with UV-Visible spectra, is characteristic. Thus a sample that did not absorb at all would record a horizontal line at 100% transmittance (top of the chart).
The frequency scale at the bottom of the chart is given in units of reciprocal centimeters (cm-1) rather than Hz, because the numbers are more manageable. The reciprocal centimeter is the number of wave cycles in one centimeter; whereas, frequency in cycles per second or Hz is equal to the number of wave cycles in 3*1010 cm (the distance covered by light in one second). Wavelength units are in micrometers, microns (μ), instead of nanometers for the same reason. Most infrared spectra are displayed on a linear frequency scale, as shown here, but in some older texts a linear wavelength scale is used. A calculator for interconverting these frequency and wavelength values is provided on the right. Simply enter the value to be converted in the appropriate box, press "Calculate" and the equivalent number will appear in the empty box.
Infrared spectra may be obtained from samples in all phases (liquid, solid and gaseous). Liquids are usually examined as a thin film sandwiched between two polished salt plates (note that glass absorbs infrared radiation, whereas NaCl is transparent). If solvents are used to dissolve solids, care must be taken to avoid obscuring important spectral regions by solvent absorption. Perchlorinated solvents such as carbon tetrachloride, chloroform and tetrachloroethene are commonly used. Alternatively, solids may either be incorporated in a thin KBr disk, prepared under high pressure, or mixed with a little non-volatile liquid and ground to a paste (or mull) that is smeared between salt plates.
2. Vibrational Spectroscopy
A molecule composed of n-atoms has 3n degrees of freedom, six of which are translations and rotations of the molecule itself. This leaves 3n-6 degrees of vibrational freedom (3n-5 if the molecule is linear). Vibrational modes are often given descriptive names, such as stretching, bending, scissoring, rocking and twisting. The four-atom molecule of formaldehyde, the gas phase spectrum of which is shown below, provides an example of these terms. If a ball & stick model of formaldehyde is not displayed to the right of the spectrum, press the view ball&stick model button at the lower right. We expect six fundamental vibrations (12 minus 6), and these have been assigned to the spectrum absorptions. To see the formaldehyde molecule display a vibration, click one of the buttons under the spectrum.
Gas Phase Infrared Spectrum of Formaldehyde, H2C=O |
|
|
|
The exact frequency at which a given vibration occurs is determined by the strengths of the bonds involved and the mass of the component atoms. For a more detailed discussion of these factors Click Here. In practice, infrared spectra do not normally display separate absorption signals for each of the 3n-6 fundamental vibrational modes of a molecule. The number of observed absorptions may be increased by additive and subtractive interactions leading to combination tones and overtones of the fundamental vibrations, in much the same way that sound vibrations from a musical instrument interact. Furthermore, the number of observed absorptions may be decreased by molecular symmetry, spectrometer limitations, and spectroscopic selection rules. One selection rule that influences the intensity of infrared absorptions, is that a change in dipole moment should occur for a vibration to absorb infrared energy. Absorption bands associated with C=O bond stretching areusually very strong because a large change in the dipole takes place in that mode.
Some General Trends:
i) Stretching frequencies are higher than corresponding bending frequencies. (It is easier to bend a bond than to stretch or compress it.)
ii) Bonds to hydrogen have higher stretching frequencies than those to heavier atoms.
iii) Triple bonds have higher stretching frequencies than corresponding double bonds, which in turn have higher frequencies than single bonds.
(Except for bonds to hydrogen).
The general regions of the infrared spectrum in which various kinds of vibrational bands are observed are outlined in the following chart. Note that the blue colored sections above the dashed line refer to stretching vibrations, and the green colored band below the line encompasses bending vibrations. The complexity of infrared spectra in the 1450 to 600 cm-1 region makes it difficult to assign all the absorption bands, and because of the unique patterns found there, it is often called the fingerprint region. Absorption bands in the 4000 to 1450 cm-1 region are usually due to stretching vibrations of diatomic units, and this is sometimes called the group frequency region.
3. Group Frequencies
Detailed information about the infrared absorptions observed for various bonded atoms and groups is usually presented in tabular form. The following table provides a collection of such data for the most common functional groups. Following the color scheme of the chart, stretching absorptions are listed in the blue-shaded section and bending absorptions in the green shaded part. More detailed descriptions for certain groups (e.g. alkenes, arenes, alcohols, amines & carbonyl compounds) may be viewed by clicking on the functional class name. Since most organic compounds have C-H bonds, a useful rule is that absorption in the 2850 to 3000 cm-1 is due to sp3 C-H stretching; whereas, absorption above 3000 cm-1 is from sp2 C-H stretching or sp C-H stretching if it is near 3300 cm-1.
Typical Infrared Absorption Frequencies |
||||||
|
Stretching Vibrations |
Bending Vibrations |
||||
Functional Class |
Range (cm-1) |
Intensity |
Assignment |
Range (cm-1) |
Intensity |
Assignment |
Alkanes |
2850-3000 |
str |
CH3, CH2 & CH |
1350-1470 |
med |
CH2 & CH3 deformation |
3020-3100 |
med |
=C-H & =CH2 (usually sharp) |
880-995 |
str |
=C-H & =CH2 |
|
Alkynes |
3300 |
str |
C-H (usually sharp) |
600-700 |
str |
C-H deformation |
3030 |
var |
C-H (may be several bands) |
690-900 |
str-med |
C-H bending & |
|
3580-3650 |
var |
O-H (free), usually sharp |
1330-1430 |
med |
O-H bending (in-plane) |
|
3400-3500 (dil. soln.) |
wk |
N-H (1°-amines), 2 bands |
1550-1650 |
med-str |
NH2 scissoring (1°-amines) |
|
2690-2840(2 bands) 1690 1675 1745 1780 |
med |
C-H (aldehyde C-H) |
|
|
|
|
2500-3300 (acids) overlap C-H 1785-1815 ( acyl halides) 1750 & 1820 (anhydrides) 1040-1100 1735-1750 (esters) 1000-1300 1630-1695(amides) |
str |
O-H (very broad) |
1395-1440 |
med |
C-O-H bending |
|
Nitriles |
2240-2260 |
med |
C≡N (sharp) |
|
||
To illustrate the usefulness of infrared absorption spectra, examples for five C4H8O isomers are presented below their corresponding structural formulas. The five spectra may be examined in turn by clicking the "Toggle Spectra" button. Try to associate each spectrum (A - E) with one of the isomers in the row above it. When you have made assignments check your answers by clicking on the structure or name of each isomer.
4. Other Functional Groups
Infrared absorption data for some functional groups not listed in the preceding table are given below. Most of the absorptions cited are associated with stretching vibrations. Standard abbreviations (str = strong, wk = weak, brd = broad & shp = sharp) are used to describe the absorption bands.
Functional Class |
Characteristic Absorptions |
Sulfur Functions |
|
S-H thiols |
2550-2600 cm-1 (wk & shp) |
S-OR esters |
700-900 (str) |
S-S disulfide |
500-540 (wk) |
C=S thiocarbonyl |
1050-1200 (str) |
S=O sulfoxide sulfone sulfonic acid sulfonyl chloride sulfate |
1030-1060 (str) |
Phosphorous Functions |
|
P-H phosphine |
2280-2440 cm-1 (med & shp) |
(O=)PO-H phosphonic acid |
2550-2700 (med) |
P-OR esters |
900-1050 (str) |
P=O phosphine oxide phosphonate phosphate phosphoramide |
1100-1200 (str) |
Silicon Functions |
|
Si-H silane |
2100-2360 cm-1 (str) |
Si-OR |
1000-11000 (str & brd) |
Si-CH3 |
1250± 10 (str & shp) |
Oxidized Nitrogen Functions |
|
=NOH oxime O-H (stretch) C=N N-O |
|
N-O amine oxide aliphatic aromatic |
|
N=O nitroso nitro |
1550± 50 (str) |
Nuclear Magnetic Resonance Spectroscopy
1. Background
Over the past fifty years nuclear magnetic resonance spectroscopy, commonly referred to as nmr, has become the preeminent technique for determining the structure of organic compounds. Of all the spectroscopic methods, it is the only one for which a complete analysis and interpretation of the entire spectrum is normally expected. Although larger amounts of sample are needed than for mass spectroscopy, nmr is non-destructive, and with modern instruments good data may be obtained from samples weighing less than a milligram. To be successful in using nmr as an analytical tool, it is necessary to understand the physical principles on which the methods are based.
The nuclei of many elemental isotopes have a characteristic spin (I). Some nuclei have integral spins (e.g. I = 1, 2, 3 ....), some have fractional spins (e.g. I = 1/2, 3/2, 5/2 ....), and a few have no spin, I = 0 (e.g. 12C, 16O, 32S, ....). Isotopes of particular interest and use to organic chemists are 1H, 13C, 19F and 31P, all of which have I = 1/2. Since the analysis of this spin state is fairly straightforeward, our discussion of nmr will be limited to these and other I = 1/2 nuclei.
The following features lead to the nmr phenomenon:
1. A spinning charge generates a magnetic field, as shown by the animation on the right. |
|
2. In the presence of an external magnetic field (B0), two spin states exist, +1/2 and -1/2. |
|
3. The difference in energy between the two spin states is dependent on the external magnetic field strength, and is always very small. The following diagram illustrates that the two spin states have the same energy when the external field is zero, but diverge as the field increases. At a field equal to Bx a formula for the energy difference is given (remember I = 1/2 and μ is the magnetic moment of the nucleus in the field). |
|
Strong magnetic fields are necessary for nmr spectroscopy. The international unit for magnetic flux is the tesla (T). The earth's magnetic field is not constant, but is approximately 10-4 T at ground level. Modern nmr spectrometers use powerful magnets having fields of 1 to 20 T. Even with these high fields, the energy difference between the two spin states is less than 0.1 cal/mole. To put this in perspective, recall that infrared transitions involve 1 to 10 kcal/mole and electronic transitions are nearly 100 time greater. |
|
4. For spin 1/2 nuclei the energy difference between the two spin states at a given magnetic field strength will be proportional to their magnetic moments. For the four common nuclei noted above, the magnetic moments are: 1H μ = 2.7927, 19F μ = 2.6273, 31P μ = 1.1305 & 13C μ = 0.7022. These moments are in nuclear magnetons, which are 5.05078•10-27 JT-1. The following diagram gives the approximate frequencies that correspond to the spin state energy separations for each of these nuclei in an external magnetic field of 2.35 T. The formula in the colored box shows the direct correlation of frequency (energy difference) with magnetic moment (h = Planck's constant = 6.626069•10-34 Js). |
|
|
|
2. Proton NMR Spectroscopy
This important and well-established application of nuclear magnetic resonance will serve to illustrate some of the novel aspects of this method. To begin with, the nmr spectrometer must be tuned to a specific nucleus, in this case the proton. The actual procedure for obtaining the spectrum varies, but the simplest is referred to as the continuous wave (CW) method. A typical CW-spectrometer is shown in the following diagram. A solution of the sample in a uniform 5 mm glass tube is oriented between the poles of a powerful magnet, and is spun to average any magnetic field variations, as well as tube imperfections. Radio frequency radiation of appropriate energy is broadcast into the sample from an antenna coil (colored red). A receiver coil surrounds the sample tube, and emission of absorbed rf energy is monitored by dedicated electronic devices and a computer. An nmr spectrum is acquired by varying or sweeping the magnetic field over a small range while observing the rf signal from the sample. An equally effective technique is to vary the frequency of the rf radiation while holding the external field constant.
As an example, consider a sample of water in a 2.3487 T external magnetic field, irradiated by 100 MHz radiation. If the magnetic field is smoothly increased to 2.3488 T, the hydrogen nuclei of the water molecules will at some point absorb rf energy and a resonance signal will appear. An animation showing this may be activated by clicking the Show Field Sweep button. The field sweep will be repeated three times, and the resulting resonance trace is colored red. For visibility, the water proton signal displayed in the animation is much broader than it would be in an actual experiment.
Since protons all have the same magnetic moment, we might expect all hydrogen atoms to give resonance signals at the same field / frequency values. Fortunately for chemistry applications, this is not true. By clicking the Show Different Protons button under the diagram, a number of representative proton signals will be displayed over the same magnetic field range. It is not possible, of course, to examine isolated protons in the spectrometer described above; but from independent measurement and calculation it has been determined that a naked proton would resonate at a lower field strength than the nuclei of covalently bonded hydrogens. With the exception of water, chloroform and sulfuric acid, which are examined as liquids, all the other compounds are measured as gases.
Why should the proton nuclei in different compounds behave differently in the nmr experiment ?
The answer to this question lies with the electron(s) surrounding the proton in covalent compounds and ions. Since electrons are charged particles, they move in response to the external magnetic field (Bo) so as to generate a secondary field that opposes the much stronger applied field. This secondary field shields the nucleus from the applied field, so Bo must be increased in order to achieve resonance (absorption of rf energy). As illustrated in the drawing on the right, Bo must be increased to compensate for the induced shielding field. In the upper diagram, those compounds that give resonance signals at the higher field side of the diagram (CH4, HCl, HBr and HI) have proton nuclei that are more shielded than those on the lower field (left) side of the diagram.
The magnetic field range displayed in the above diagram is very small compared with the actual field strength (only about 0.0042%). It is customary to refer to small increments such as this in units of parts per million (ppm). The difference between 2.3487 T and 2.3488 T is therefore about 42 ppm. Instead of designating a range of nmr signals in terms of magnetic field differences (as above), it is more common to use a frequency scale, even though the spectrometer may operate by sweeping the magnetic field. Using this terminology, we would find that at 2.34 T the proton signals shown above extend over a 4,200 Hz range (for a 100 MHz rf frequency, 42 ppm is 4,200 Hz). Most organic compounds exhibit proton resonances that fall within a 12 ppm range (the shaded area), and it is therefore necessary to use very sensitive and precise spectrometers to resolve structurally distinct sets of hydrogen atoms within this narrow range. In this respect it might be noted that the detection of a part-per-million difference is equivalent to detecting a 1 millimeter difference in distances of 1 kilometer.
Chemical Shift
Unlike infrared and uv-visible spectroscopy, where absorption peaks are uniquely located by a frequency or wavelength, the location of different nmr resonance signals is dependent on both the external magnetic field strength and the rf frequency. Since no two magnets will have exactly the same field, resonance frequencies will vary accordingly and an alternative method for characterising and specifying the location of nmr signals is needed. This problem is illustrated by the eleven different compounds shown in the following diagram. Although the eleven resonance signals are distinct and well separated, an unambiguous numerical locator cannot be directly assigned to each.
One method of solving this problem is to report the location of an nmr signal in a spectrum relative to a reference signal from a standard compound added to the sample. Such a reference standard should be chemically unreactive, and easily removed from the sample after the measurement. Also, it should give a single sharp nmr signal that does not interfere with the resonances normally observed for organic compounds. Tetramethylsilane, (CH3)4Si, usually referred to as TMS, meets all these characteristics, and has become the reference compound of choice for proton and carbon nmr.
Since the separation (or dispersion) of nmr signals is magnetic field dependent, one additional step must be taken in order to provide an unambiguous location unit. This is illustrated for the acetone, methylene chloride and benzene signals by clicking on the previous diagram. To correct these frequency differences for their field dependence, we divide them by the spectrometer frequency (100 or 500 MHz in the example), as shown in a new display by again clicking on the diagram. The resulting number would be very small, since we are dividing Hz by MHz, so it is multiplied by a million, as shown by the formula in the blue shaded box. Note that νref is the resonant frequency of the reference signal and νsamp is the frequency of the sample signal. This operation gives a locator number called the Chemical Shift, having units of parts-per-million (ppm), and designated by the symbol δ Chemical shifts for all the compounds in the original display will be presented by a third click on the diagram.
The compounds referred to above share two common characteristics:
• The hydrogen atoms in a given molecule are all structurally equivalent, averaged for fast conformational equilibria.
• The compounds are all liquids, save for neopentane which boils at 9 °C and is a liquid in an ice bath.
The first feature assures that each compound gives a single sharp resonance signal. The second allows the pure (neat) substance to be poured into a sample tube and examined in a nmr spectrometer. In order to take the nmr spectra of a solid, it is usually necessary to dissolve it in a suitable solvent. Early studies used carbon tetrachloride for this purpose, since it has no hydrogen that could introduce an interfering signal. Unfortunately, CCl4 is a poor solvent for many polar compounds and is also toxic. Deuterium labeled compounds, such as deuterium oxide (D2O), chloroform-d (DCCl3), benzene-d6 (C6D6), acetone-d6 (CD3COCD3) and DMSO-d6 (CD3SOCD3) are now widely used as nmr solvents. Since the deuterium isotope of hydrogen has a different magnetic moment and spin, it is invisible in a spectrometer tuned to protons.
From the previous discussion and examples we may deduce that one factor contributing to chemical shift differences in proton resonance is the inductive effect. If the electron density about a proton nucleus is relatively high, the induced field due to electron motions will be stronger than if the electron density is relatively low. The shielding effect in such high electron density cases will therefore be larger, and a higher external field (Bo) will be needed for the rf energy to excite the nuclear spin. Since silicon is less electronegative than carbon, the electron density about the methyl hydrogens in tetramethylsilane is expected to be greater than the electron density about the methyl hydrogens in neopentane (2,2-dimethylpropane), and the characteristic resonance signal from the silane derivative does indeed lie at a higher magnetic field. Such nuclei are said to be shielded. Elements that are more electronegative than carbon should exert an opposite effect (reduce the electron density); and, as the data in the following tables show, methyl groups bonded to such elements display lower field signals (they are deshielded). The deshielding effect of electron withdrawing groups is roughly proportional to their electronegativity, as shown by the left table. Furthermore, if more than one such group is present, the deshielding is additive (table on the right), and proton resonance is shifted even further downfield.
Proton Chemical Shifts of Methyl Derivatives Compound (CH3)4C (CH3)3N (CH3)2O CH3F
δ 0.9 2.1 3.2 4.1
Compound (CH3)4Si (CH3)3P (CH3)2S CH3Cl
δ 0.0 0.9 2.1 3.0
|
|
Proton Chemical Shifts (ppm) Cpd. / Sub. X=Cl X=Br X=I X=OR X=SR
CH3X 3.0 2.7 2.1 3.1 2.1
CH2X2 5.3 5.0 3.9 4.4 3.7
CHX3 7.3 6.8 4.9 5.0
|
The general distribution of proton chemical shifts associated with different functional groups is summarized in the following chart. Bear in mind that these ranges are approximate, and may not encompass all compounds of a given class. Note also that the ranges specified for OH and NH protons (colored orange) are wider than those for most CH protons. This is due to hydrogen bonding variations at different sample concentrations.
Proton Chemical Shift Ranges* |
||
Low Field |
|
High Field |
|
* For samples in CDCl3 solution. The δ scale is relative to TMS at δ = 0. |
|
Signal Strength
The magnitude or intensity of nmr resonance signals is displayed along the vertical axis of a spectrum, and is proportional to the molar concentration of the sample. Thus, a small or dilute sample will give a weak signal, and doubling or tripling the sample concentration increases the signal strength proportionally. If we take the nmr spectrum of equal molar amounts of benzene and cyclohexane in carbon tetrachloride solution, the resonance signal from cyclohexane will be twice as intense as that from benzene because cyclohexane has twice as many hydrogens per molecule. This is an important relationship when samples incorporating two or more different sets of hydrogen atoms are examined, since it allows the ratio of hydrogen atoms in each distinct set to be determined. To this end it is necessary to measure the relative strength as well as the chemical shift of the resonance signals that comprise an nmr spectrum. Two common methods of displaying the integrated intensities associated with a spectrum are illustrated by the following examples. In the three spectra in the top row, a horizontal integrator trace (light green) rises as it crosses each signal by a distance proportional to the signal strength. Alternatively, an arbitrary number, selected by the instrument's computer to reflect the signal strength, is printed below each resonance peak, as shown in the three spectra in the lower row. From the relative intensities shown here, together with the previously noted chemical shift correlations, the reader should be able to assign the signals in these spectra to the set of hydrogens that generates each. If you click on one of the spectrum signals (colored red) or on hydrogen atom(s) in the structural formulas the spectrum will be enlarged and the relationship will be colored blue.
Hint: When evaluating relative signal strengths, it is useful to set the smallest integration to unity and convert the other values proportionally.
Hydroxyl Proton Exchange and the Influence of Hydrogen Bonding
The last two compounds in the lower row are alcohols. The OH proton signal is seen at 2.37 δ in 2-methyl-3-butyne-2-ol, and at 3.87 δ in 4-hydroxy-4-methyl-2-pentanone, illustrating the wide range over which this chemical shift may be found. A six-membered ring intramolecular hydrogen bond in the latter compound is in part responsible for its low field shift, and will be shown by clicking on the hydroxyl proton. We can take advantage of rapid OH exchange with the deuterium of heavy water to assign hydroxyl proton resonance signals . As shown in the following equation, this removes the hydroxyl proton from the sample and its resonance signal in the nmr spectrum disappears. Experimentally, one simply adds a drop of heavy water to a chloroform-d solution of the compound and runs the spectrum again. The result of this exchange is displayed below.
R-O-H + D2O |
||
|
||
Hydrogen bonding shifts the resonance signal of a proton to lower field ( higher frequency ). Numerous experimental observations support this statement, and a few of these will be described here. |
||
i) The chemical shift of the hydroxyl hydrogen of an alcohol varies with concentration. Very dilute solutions of 2-methyl-2-propanol, (CH3)3COH, in carbon tetrachloride solution display a hydroxyl resonance signal having a relatively high-field chemical shift (< 1.0 δ ). In concentrated solution this signal shifts to a lower field, usually near 2.5 δ. |
||
ii) The more acidic hydroxyl group of phenol generates a lower-field resonance signal, which shows a similar concentration dependence to that of alcohols. OH resonance signals for different percent concentrations of phenol in chloroform-d are shown in the following diagram (C-H signals are not shown). |
||
|
||
iii) Because of their favored hydrogen-bonded dimeric association, the hydroxyl proton of carboxylic acids displays a resonance signal significantly down-field of other functions. For a typical acid it appears from 10.0 to 13.0 δ and is often broader than other signals. The spectra shown below for chloroacetic acid (left) and 3,5-dimethylbenzoic acid (right) are examples. |
||
|
||
iv) Intramolecular hydrogen bonds, especially those defining a six-membered ring, generally display a very low-field proton resonance. The case of 4-hydroxypent-3-ene-2-one (the enol tautomer of 2,4-pentanedione) not only illustrates this characteristic, but also provides an instructive example of the sensitivity of the nmr experiment to dynamic change. In the nmr spectrum of the pure liquid, sharp signals from both the keto and enol tautomers are seen, their mole ratio being 4 : 21 (keto tautomer signals are colored purple). Chemical shift assignments for these signals are shown in the shaded box above the spectrum. The chemical shift of the hydrogen-bonded hydroxyl proton is δ 14.5, exceptionally downfield. We conclude, therefore, that the rate at which these tautomers interconvert is slow compared with the inherent time scale of nmr spectroscopy. |
||
|
||
Two structurally equivalent structures may be drawn for the enol tautomer (in magenta brackets). If these enols were slow to interconvert, we would expect to see two methyl resonance signals associated with each, one from the allylic methyl and one from the methyl ketone. Since only one strong methyl signal is observed, we must conclude that the interconversion of the enols is very fast-so fast that the nmr experiment detects only a single time-averaged methyl group (50% α-keto and 50% allyl). |
||
Although hydroxyl protons have been the focus of this discussion, it should be noted that corresponding N-H groups in amines and amides also exhibit hydrogen bonding nmr shifts, although to a lesser degree. Furthermore, OH and NH groups can undergo rapid proton exchange with each other; so if two or more such groups are present in a molecule, the nmr spectrum will show a single signal at an average chemical shift. For example, 2-hydroxy-2-methylpropanoic acid, (CH3)2C(OH)CO2H, displays a strong methyl signal at δ 1.5 and a 1/3 weaker and broader OH signal at δ 7.3 ppm. Note that the average of the expected carboxylic acid signal (ca. 12 ) and the alcohol signal (ca. 2 ) is 7. Rapid exchange of these hydrogens with heavy water, as noted above, would cause the low field signal to disappear.
π-Electron Functions
An examination of the proton chemical shift chart (above) makes it clear that the inductive effect of substituents cannot account for all the differences in proton signals. In particular the low field resonance of hydrogens bonded to double bond or aromatic ring carbons is puzzling, as is the very low field signal from aldehyde hydrogens. The hydrogen atom of a terminal alkyne, in contrast, appears at a relatively higher field. All these anomalous cases seem to involve hydrogens bonded to pi-electron systems, and an explanation may be found in the way these pi-electrons interact with the applied magnetic field.
Pi-electrons are more polarizable than are sigma-bond electrons, as addition reactions of electrophilic reagents to alkenes testify. Therefore, we should not be surprised to find that field induced pi-electron movement produces strong secondary fields that perturb nearby nuclei. The pi-electrons associated with a benzene ring provide a striking example of this phenomenon, as shown below. The electron cloud above and below the plane of the ring circulates in reaction to the external field so as to generate an opposing field at the center of the ring and a supporting field at the edge of the ring. This kind of spatial variation is called anisotropy, and it is common to nonspherical distributions of electrons, as are found in all the functions mentioned above. Regions in which the induced field supports or adds to the external field are said to be deshielded, because a slightly weaker external field will bring about resonance for nuclei in such areas. However, regions in which the induced field opposes the external field are termed shielded because an increase in the applied field is needed for resonance. Shielded regions are designated by a plus sign, and deshielded regions by a negative sign.
The anisotropy of some important unsaturated functions will be displayed by clicking on the benzene diagram below. Note that the anisotropy about the triple bond nicely accounts for the relatively high field chemical shift of ethynyl hydrogens. The shielding & deshielding regions about the carbonyl group have been described in two ways, which alternate in the display.
Sigma bonding electrons also have a less pronounced, but observable, anisotropic influence on nearby nuclei. This is seen in the small deshielding shift that occurs in the series CH3-R, R-CH2-R, R3CH; as well as the deshielding of equatorial versus axial protons on a fixed cyclohexane ring.
Solvent Effects
Chloroform-d (CDCl3) is the most common solvent for nmr measurements, thanks to its good solubilizing character and relative unreactive nature ( except for 1º and 2º-amines). As noted earlier, other deuterium labeled compounds, such as deuterium oxide (D2O), benzene-d6 (C6D6), acetone-d6 (CD3COCD3) and DMSO-d6 (CD3SOCD3) are also available for use as nmr solvents. Because some of these solvents have π-electron functions and/or may serve as hydrogen bonding partners, the chemical shifts of different groups of protons may change depending on the solvent being used. The following table gives a few examples, obtained with dilute solutions at 300 MHz.
Some Typical 1H Chemical Shifts (δ values) in Selected Solvents |
||||||
|
CDCl3 |
C6D6 |
CD3COCD3 |
CD3SOCD3 |
CD3C≡N |
D2O |
(CH3)3C-O-CH3 |
1.19 |
1.07 |
1.13 |
1.11 |
1.14 |
1.21 |
(CH3)3C-O-H |
1.26 |
1.05 |
1.18 |
1.11 |
1.16 |
--- |
C6H5CH3 |
2.36 |
2.11 |
2.32 |
2.30 |
2.33 |
--- |
(CH3)2C=O |
2.17 |
1.55 |
2.09 |
2.09 |
2.08 |
2.22 |
For most of the above resonance signals and solvents the changes are minor, being on the order of ±0.1 ppm. However, two cases result in more extreme changes and these have provided useful applications in structure determination. First, spectra taken in benzene-d6 generally show small upfield shifts of most C-H signals, but in the case of acetone this shift is about five times larger than normal. Further study has shown that carbonyl groups form weak π-π collision complexes with benzene rings, that persist long enough to exert a significant shielding influence on nearby groups. In the case of substituted cyclohexanones, axial α-methyl groups are shifted upfield by 0.2 to 0.3 ppm; whereas equatorial methyls are slightly deshielded (shift downfield by about 0.05 ppm). These changes are all relative to the corresponding chloroform spectra.
The second noteworthy change is seen in the spectrum of tert-butanol in DMSO, where the hydroxyl proton is shifted 2.5 ppm down-field from where it is found in dilute chloroform solution. This is due to strong hydrogen bonding of the alcohol O-H to the sulfoxide oxygen, which not only deshields the hydroxyl proton, but secures it from very rapid exchange reactions that prevent the display of spin-spin splitting. Similar but weaker hydrogen bonds are formed to the carbonyl oxygen of acetone and the nitrogen of acetonitrile. A useful application of this phenomenon is described elsewhere in this text.
Spin-Spin Interactions
The nmr spectrum of 1,1-dichloroethane (below right) is more complicated than we might have expected from the previous examples. Unlike its 1,2-dichloro-isomer (below left), which displays a single resonance signal from the four structurally equivalent hydrogens, the two signals from the different hydrogens are split into close groupings of two or more resonances. This is a common feature in the spectra of compounds having different sets of hydrogen atoms bonded to adjacent carbon atoms. The signal splitting in proton spectra is usually small, ranging from fractions of a Hz to as much as 18 Hz, and is designated as J (referred to as the coupling constant). In the 1,1-dichloroethane example all the coupling constants are 6.0 Hz, as illustrated by clicking on the spectrum.
|
|
|
1,2-dichloroethane |
|
1,1-dichloroethane |
The splitting patterns found in various spectra are easily recognized, provided the chemical shifts of the different sets of hydrogen that generate the signals differ by two or more ppm. The patterns are symmetrically distributed on both sides of the proton chemical shift, and the central lines are always stronger than the outer lines. The most commonly observed patterns have been given descriptive names, such as doublet (two equal intensity signals), triplet (three signals with an intensity ratio of 1:2:1) and quartet (a set of four signals with intensities of 1:3:3:1). Four such patterns are displayed in the following illustration. The line separation is always constant within a given multiplet, and is called the coupling constant (J). The magnitude of J, usually given in units of Hz, is magnetic field independent.
The splitting patterns shown above display the ideal or "First-Order" arrangement of lines. This is usually observed if the spin-coupled nuclei have very different chemical shifts (i.e. Δν is large compared to J). If the coupled nuclei have similar chemical shifts, the splitting patterns are distorted (second order behavior). In fact, signal splitting disappears if the chemical shifts are the same. Two examples that exhibit minor 2nd order distortion are shown below (both are taken at a frequency of 90 MHz). The ethyl acetate spectrum on the left displays the typical quartet and triplet of a substituted ethyl group. The spectrum of 1,3-dichloropropane on the right demonstrates that equivalent sets of hydrogens may combine their influence on a second, symmetrically located set.
Even though the chemical shift difference between the A and B protons in the 1,3-dichloroethane spectrum is fairly large (140 Hz) compared with the coupling constant (6.2 Hz), some distortion of the splitting patterns is evident. The line intensities closest to the chemical shift of the coupled partner are enhanced. Thus the B set triplet lines closest to A are increased, and the A quintet lines nearest B are likewise stronger. A smaller distortion of this kind is visible for the A and C couplings in the ethyl acetate spectrum.
|
|
|
What causes this signal splitting, and what useful information can be obtained from it ?
If an atom under examination is perturbed or influenced by a nearby nuclear spin (or set of spins), the observed nucleus responds to such influences, and its response is manifested in its resonance signal. This spin-coupling is transmitted through the connecting bonds, and it functions in both directions. Thus, when the perturbing nucleus becomes the observed nucleus, it also exhibits signal splitting with the same J. For spin-coupling to be observed, the sets of interacting nuclei must be bonded in relatively close proximity (e.g. vicinal and geminal locations), or be oriented in certain optimal and rigid configurations. Some spectroscopists place a number before the symbol J to designate the number of bonds linking the coupled nuclei (colored orange below). Using this terminology, a vicinal coupling constant is 3J and a geminal constant is 2J.
The following general rules summarize important requirements and characteristics for spin 1/2 nuclei :
1) Nuclei having the same chemical shift (called isochronous) do not exhibit spin-splitting. They may actually be spin-coupled, but the splitting cannot be observed directly.
2) Nuclei separated by three or fewer bonds (e.g. vicinal and geminal nuclei ) will usually be spin-coupled and will show mutual spin-splitting of the resonance signals (same J's), provided they have different chemical shifts. Longer-range coupling may be observed in molecules having rigid configurations of atoms.
3) The magnitude of the observed spin-splitting depends on many factors and is given by the coupling constant J (units of Hz). J is the same for both partners in a spin-splitting interaction and is independent of the external magnetic field strength.
4) The splitting pattern of a given nucleus (or set of equivalent nuclei) can be predicted by the n+1 rule, where n is the number of neighboring spin-coupled nuclei with the same (or very similar) Js. If there are 2 neighboring, spin-coupled, nuclei the observed signal is a triplet ( 2+1=3 ); if there are three spin-coupled neighbors the signal is a quartet ( 3+1=4 ). In all cases the central line(s) of the splitting pattern are stronger than those on the periphery. The intensity ratio of these lines is given by the numbers in Pascal's triangle. Thus a doublet has 1:1 or equal intensities, a triplet has an intensity ratio of 1:2:1, a quartet 1:3:3:1 etc. To see how the numbers in Pascal's triangle are related to the Fibonacci series click on the diagram.
|
|
If a given nucleus is spin-coupled to two or more sets of neighboring nuclei by different J values, the n+1 rule does not predict the entire splitting pattern. Instead, the splitting due to one J set is added to that expected from the other J sets. Bear in mind that there may be fortuitous coincidence of some lines if a smaller J is a factor of a larger J. |
|
|
|
Magnitude of Some Typical Coupling Constants |
|
Spin 1/2 nuclei include 1H, 13C, 19F & 31P. The spin-coupling interactions described above may occur between similar or dissimilar nuclei. If, for example, a 19F is spin-coupled to a 1H, both nuclei will appear as doublets having the same J constant. Spin coupling with nuclei having spin other than 1/2 is more complex and will not be discussed here.
Some Examples
Test your ability to interpret 1H nmr spectra by analyzing the seven examples presented below. The seven spectra may be examined in turn by clicking the "Toggle Spectra" button. Try to associate each spectrum with a plausible structural formula.
Although the first four cases are relatively simple, keep in mind that the integration values provide ratios, not absolute numbers. In two cases additional information from infrared spectroscopy is provided. When you have made an assignment you may check your answer by clicking on the spectrum itself. In the sixth example, a similar constitutional isomer cannot be ruled out by the data given.
3. Carbon NMR Spectroscopy
The power and usefulness of 1H nmr spectroscopy as a tool for structural analysis should be evident from the past discussion. Unfortunately, when significant portions of a molecule lack C-H bonds, no information is forthcoming. Examples include polychlorinated compounds such as chlordane, polycarbonyl compounds such as croconic acid, and compounds incorporating triple bonds (structures below, orange colored carbons).
Even when numerous C-H groups are present, an unambiguous interpretation of a proton nmr spectrum may not be possible. The following diagram depicts three pairs of isomers (A & B) which display similar proton nmr spectra. Although a careful determination of chemical shifts should permit the first pair of compounds (blue box) to be distinguished, the second and third cases (red & green boxes) might be difficult to identify by proton nmr alone.
These difficulties would be largely resolved if the carbon atoms of a molecule could be probed by nmr in the same fashion as the hydrogen atoms. Since the major isotope of carbon (12C) has no spin, this option seems unrealistic. Fortunately, 1.1% of elemental carbon is the 13C isotope, which has a spin I = 1/2, so in principle it should be possible to conduct a carbon nmr experiment. It is worth noting here, that if much higher abundances of 13C were naturally present in all carbon compounds, proton nmr would become much more complicated due to large one-bond coupling of 13C and 1H.
Many obstacles needed to be overcome before carbon nmr emerged as a routine tool : |
The most important operational technique that has led to successful and routine 13C nmr spectroscopy is the use of high-field pulse technology coupled with broad-band heteronuclear decoupling of all protons. The results of repeated pulse sequences are accumulated to provide improved signal strength. Also, for reasons that go beyond the present treatment, the decoupling irradiation enhances the sensitivity of carbon nuclei bonded to hydrogen.
When acquired in this manner, the carbon nmr spectrum of a compound displays a single sharp signal for each structurally distinct carbon atom in a molecule (remember, the proton couplings have been removed). The spectrum of camphor, shown on the left below, is typical. Furthermore, a comparison with the 1H nmr spectrum on the right illustrates some of the advantageous characteristics of carbon nmr. The dispersion of 13C chemical shifts is nearly twenty times greater than that for protons, and this together with the lack of signal splitting makes it more likely that every structurally distinct carbon atom will produce a separate signal. The only clearly identifiable signals in the proton spectrum are those from the methyl groups. The remaining protons have resonance signals between 1.0 and 2.8 ppm from TMS, and they overlap badly thanks to spin-spin splitting.
|
|
Unlike proton nmr spectroscopy, the relative strength of carbon nmr signals are not normally proportional to the number of atoms generating each one. Because of this, the number of discrete signals and their chemical shifts are the most important pieces of evidence delivered by a carbon spectrum. The general distribution of carbon chemical shifts associated with different functional groups is summarized in the following chart. Bear in mind that these ranges are approximate, and may not encompass all compounds of a given class. Note also that the over 200 ppm range of chemical shifts shown here is much greater than that observed for proton chemical shifts.
13C Chemical Shift Ranges* |
||
Low Field |
|
High Field |
|
* For samples in CDCl3 solution. The δ scale is relative to TMS at δ=0. |
|
The isomeric pairs previously cited as giving very similar proton nmr spectra are now seen to be distinguished by carbon nmr. In the example on the left below (blue box), cyclohexane and 2,3-dimethyl-2-butene both give a single sharp resonance signal in the proton nmr spectrum (the former at δ 1.43 ppm and the latter at 1.64 ppm). However, in its carbon nmr spectrum cyclohexane displays a single signal at δ 27.1 ppm, generated by the equivalent ring carbon atoms (colored blue); whereas the isomeric alkene shows two signals, one at δ 20.4 ppm from the methyl carbons (colored brown), and the other at 123.5 ppm (typical of the green colored sp2 hybrid carbon atoms).
The C8H10 isomers in the center (red) box have pairs of homotopic carbons and hydrogens, so symmetry should simplify their nmr spectra. The fulvene (isomer A) has five structurally different groups of carbon atoms (colored brown, magenta, orange, blue and green respectively) and should display five 13C nmr signals (one near 20 ppm and the other four greater than 100 ppm). Although ortho-xylene (isomer B) will have a proton nmr very similar to isomer A, it should only display four 13C nmr signals, originating from the four different groups of carbon atoms (colored brown, blue, orange and green). The methyl carbon signal will appear at high field (near 20 ppm), and the aromatic ring carbons will all give signals having δ > 100 ppm. Finally, the last isomeric pair, quinones A & B in the green box, are easily distinguished by carbon nmr. Isomer A displays only four carbon nmr signals (δ 15.4, 133.4, 145.8 & 187.9 ppm); whereas, isomer B displays five signals (δ 15.9, 133.3, 145.8, 187.5 & 188.1 ppm), the additional signal coming from the non-identity of the two carbonyl carbon atoms (one colored orange and the other magenta).
Wyszukiwarka
Podobne podstrony:
Introduction to VHDL
268257 Introduction to Computer Systems Worksheet 1 Answer sheet Unit 2
Introduction To Scholastic Ontology
Evans L C Introduction To Stochastic Differential Equations
Zizek, Slavoj Looking Awry An Introduction to Jacques Lacan through Popular Culture
Introduction to Lagrangian and Hamiltonian Mechanics BRIZARD, A J
Introduction to Lean for Poland
An Introduction to the Kabalah
Introduction to Apoptosis
Syzmanek, Introduction to Morphological Analysis
Brief Introduction to Hatha Yoga
0 Introduction to?onomy
Introduction to politics szklarski pytania
INTRODUCTION TO VERBS
An Introduction to USA 6 ?ucation
introdution to capabilities classes 5WEH7OVOF6IJEZ7SO6GMF63NSJPWSXDLGIJQTMA
An Introduction to Database Systems, 8th Edition, C J Date
Introduction to the MOSFET and MOSFET Inverter(1)
więcej podobnych podstron