THE GMMA - TRADING THE BREAKOUT
The Guppy Multiple Moving Average (GMMA) indicator was first mentioned in Trading Tactics in 1997. Since then the use and application of the indicator has been refined. In response to requests from readers, this series of notes brings together these modifications and improvements.
Aggressive traders attempt to identify a change in the downtrend - an up trend breakout - as soon as it happens, or even before it happens. This is aggressive trading because it carries a higher level of failure. Unless the trader has excellent trading discipline there is the danger of holding onto a stock as it continues to go down in the hope that it will eventually rebound.
A more common, and in some ways, safer approach, is to trade the trend breakout in the days or weeks after it has happened. This does reduce profits when compared with an earlier entry, but this reduction is counterbalanced by the increased probability that the trend break will develop into a sustainable new trend. Few traders are content with joining these trends at any price point. Most try to get the best entry possible, based on a pullback in price. If we understand the nature of the trend and the breakout using the techniques discussed last week, then we can take advantage of these points of price weakness because we are confident in our analysis of the developing trend.
The GMMA is applied in real time to assess the best entry opportunities after the breakout is confirmed. It gives us an answer to the question: Is this price collapse part of a general new trend collapse, or an entry opportunity? This is a significant question because young trends are weak. There is a higher probability of trend collapse.
Breakouts come in two important formats. The most common is the “V” shaped breakout where a clear downtrend develops into a clear up trend. This is clear retrospectively, although at the time the process can be frightening and many traders delay the entry because they are worried about a trend collapse.
The less common is a breakout from a trading range, or a prolonged sideways movement. This is an important characteristic of bear market recoveries and it presented a common pattern in the first months of 2003. It also applied to stocks that have been locked in a downtrend for extended periods. These rarely bounce in a “V” recovery. Instead they drift sideways for months. When they do break out they can deliver very attractive profits. We start with this pattern.
In assessing the GMMA relationships in breakout trades we consider four relationships. The first two apply to the longer term group of averages, and the second group to the short term group of averages. We look for:
Compression. Early in the breakout the long term group compresses as investors reach agreement on the value of the stock.
Direction. Compression indicates agreement. The direction of the compression provides clues to the future development of the trend. We look for compression and an upwards bias.
Collapse. It takes a lot of effort to break out of a downtrend. These rallies are short lived, and we expect them to collapse. The nature of the collapse in the short term group provides clues to the strength of trader activity.
Rapid bounce. A fast bounce and recovery in the short term group confirms increased trading activity and this forces interested investors to bid higher to get stock.
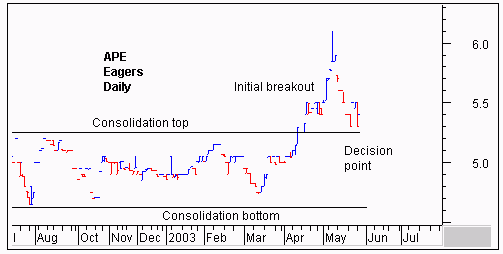
The APE bar chart highlights the problems we face in many breakout trades. First, we probably missed the initial breakout. By the time it shows up on a once a week search of the database, the initial opportunity has passed. We leave it on our watch list to see how it behaves when prices collapse after the initial rally. At the decision point shown we need to decide on the probability of a bounce occurring. Get this correct and we can trade from around $5.40 to $6.10 or even higher if a full trend develops.
The GMMA indicator help us to make a better decision at the decision point shown by the vertical line. We start with the analysis of the long term group. No trend can survive without buying support from long term investors. We may intend to take a trading approach to this opportunity, but unless investors are there to lend a helping hand, we do not get the opportunity to join a prolonged trend.
Compression is an easy question to answer. Already the long term group is well separated. It shows no sign of compression in response to the drop in prices seen on the bar chart and shown here by the collapse of the short term group of averages.
The direction of the long term group is still upwards, even though the speed of the rise has slowed slightly. The compression and direction suggest this trend has strength so we can trade with increased confidence and take advantage of this temporary low in prices.
This analysis is confirmed when we turn our attention to the short term group. Trader activity always leads investor activity as traders probe for weakness in down trends, and test the strength of up trends. This has been a orderly collapse in prices. Traders are not panicked. It does not take long before new traders come into the market and start buying. They see the fall in prices as an opportunity rather than an alert signal to abandon a weak trend. The period of compression and agreement is short, and the expansion starts quickly.
If we choose to wait a few days, the rapid compression that precedes a rapid bounce is revealed. At this decision point many traders will buy APE in anticipation of this type of rebound because the first three factors - compression, direction and collapse - are consistent with a breakout developing into a longer term trend.
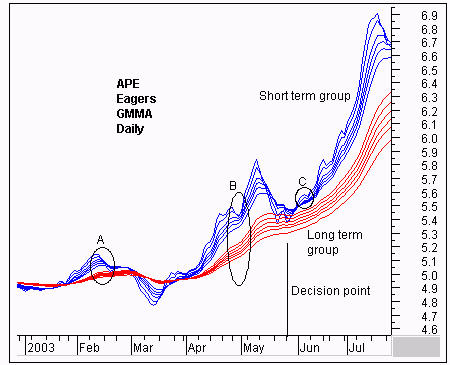
This conclusion does beg the question of how we decide that this is a real breakout from the sideways pattern. The answer comes from the comparison of area A and area B. We start with the pullback in the short term group. In area A this pullback never develops into a rebound. In area B, the degree of pullback is smaller, and the pullback quickly develops into a rebound that carries the short term group to new highs.
This is further confirmed by the long term group. In area A this group does not get a chance to separate. They do not expand. At the time of the pullback in the short term group, the long term group is just a thick red line. Compare this with the pullback relationship in area B. The long term group is well separated and clearly moving upwards.
This analysis confirms the breakout spike to $6.10 shown on the bar chart has a higher probability of becoming part of a broad up trend development rather than just a temporary rally or spike.
It is easier to apply GMMA analysis to the classic “V” shaped trend breakout where a downtrend quickly develops into a new up trend. The danger in these young trends is that the breakout may turn out to be just a short lived rally. Our fears are confirmed when the breakout falters and prices dip back from the initial highs. Is this a buy point, or an exit signal?
In a classic, text book example of the “V” shaped trend reversal this question does not arise. Price simply clearly change direction, and do not look back. There is no point in waiting for a price pullback, or a rally collapse so it is important to recognize these breakout characteristics early. We can reach some initial conclusions at the decision point shown. Wait a week or so, and the conclusions are clearly confirmed.
The key is the behavior of the long term group. They have gone from separated and down to compressed and up. The direction of the long term group has changed rapidly. Remember that the longest average in this group is a 60 day calculation. Yet by the time of the decision point all the long term group of averages have turned up. This is an early confirmation of the trend break and of the strength of the trend. You cannot get this type of information from any other indicator, and certainly not from just two moving averages using a crossover signal.
The long term group has also compressed and this tells us that the investors are in agreement about the value of the stock. They are not waiting for a pullback before taking action. They are worried they are going to miss out, so they are aggressively starting to outbid each other to establish a position.
Traders see this and they choose not to sell. Look at the character of the short term group of averages. They compress a few days before the decision point line, and then move upwards and spread out quickly. There is a lot of steady buying activity here. Compare this relationship with area C on the APE GMMA display. We are being aggressive at this decision point, but the nature of this expansion suggests strong trader and investor support. When traders come to sell, there are other traders who are prepared to buy at these prices. They are not waiting for a price pullback to get an entry. As a result there is no compression in the short term group. They quickly move into a parallel relationship. The circled area A is further confirmation of this. See this pattern and you know you have no choice but to take the current price if you want to join this robust trend.
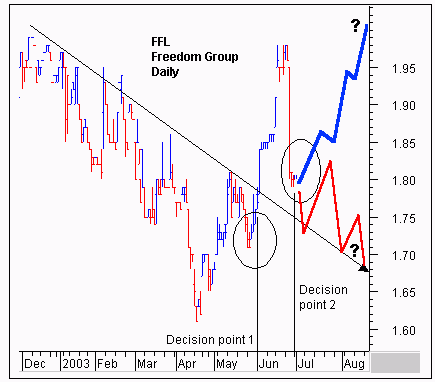
Most time a trend breakout follows a series of attempted breakouts - the rally and retreat behavior discussed last week. When the breakout develops we see a pattern of rallies and retreats and rebounds. The FFL chart illustrates how these occur and shows how we apply GMMA analysis to make a better judgment about the advisability of an entry at decision point 1 and 2. Although we are cautious in applying the GMMA as a means of anticipating a trend break, the FFL display shows how this can be achieved.
The bar chart shows a downtrend defined by the straight edge trend line. Prices have consistently moved up to the line, and then dropped down. This pattern of rise and retreat has defined the downtrend so there is no obvious reason why we would be interested in decision point 1. There has been no break above the trend line. Decision point 2 which follows the collapse of the initial breakout rally is the more traditional application of the GMMA to breakout trading. Our concern is that if we buy in this area that prices may drop to the trend line, rebound, then retreat to the trend line again as shown by the thick red line. We use the GMMA to decide whether this is a likely outcome, or if prices are likely to rebound in a new up trend as shown by the thicker blue line.
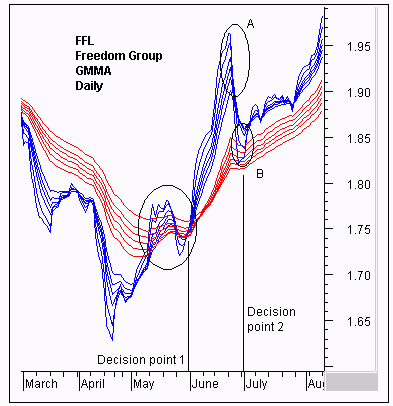
The GMMA provides answers to both decision points. The key analysis that favors an entry at decision point one starts with the long term group of averages. Traders need investors, so we need to understand their behavior. We start with the compression and directional behavior shown in the area circled. The long term group is beginning to compress. Some investors are beginning to think that FFL has a brighter future. Compression tells us that investors are not taking advantage of temporarily higher prices to sell. It tells us they are beginning to buy as prices rise. Some of them are beginning to worry that they might miss out on an opportunity.
Their action is most likely driven by fundamental analysis. We do not need to read their analysis to know that it is bullish because the direction of the compression is upwards. This is a bullish signal in a downtrend from the most conservative market participants.
Shift our attention to the trader activity and it is the rally collapse and rebound behavior that attracts our interest. This is not a sharp rally. The collapse does not resemble that shown in area A. This is a slower decline. Traders are not in a rush to take profits.
The short term group does slip below the long term group, and then it rebounds as shown by the rapid compression. There is a lot of excitement here as traders jostle each other to buy stock. They believe FFL is going to lift.
And the investors also believe this. The long term group continues to compress and the direction is up, even after the minor stumble in late May. This is a very bullish environment. Aggressive traders have no hesitation in buying at decision point 1 because of the developing investor activity. Traders lead the way, but we only follow when investors are showing increased willingness to become buyers. This GMMA analysis signal leads the price break above the trend line by several days.
The FFL bar chart presents a different set of problems at decision point 2. We have the opportunity to join a developing trend at a point of price weakness. We have to know that this is not a point of trend weakness. The important relationship is shown by the long term group. The group is not compressed. The wide spread that developed at the top of this initial rise is largely maintained as the long term group begins to turn down slightly. This degree of spread is also maintained as we move beyond decision point 2.
The underlying feature of the GMMA is the compression and expansion relationship. Compression shows agreement. Expansion shows disagreement. If the long term group turned down, and began to compress we would infer that investors are selling. When the long term group slows, move sideways, or takes a slight dip and remains well separated then we infer that investors are still buying stock. They are not fools. They will not pay more than they have to, so as prices dip, driven by trader selling, the investors do not have to pay as much to buy. In unison, they lower their bid prices and we see a dip in the long term group but the averages remain parallel with each other.
It is the move towards compression which shows some investors are selling into the price rise, and selling into the price dip, that is a cause for concern. This does not happen at decision point 2.
The direction of the long term group is not down. This is certainly a pause, and a broad move sideways, but it is not a reversal. We can be confident this trend is intact, and strong.
Knowing the ground is firm underfoot. We can then turn to understanding how traders are reacting. The price collapse is sudden, but so is the rebound. There is a significant gap between the 3 and 5 day averages and the rest of the averages in the short term average group. Short term traders have sold down the stock aggressively, but those with a slightly longer time frame are not so eager to sell. The most aggressive sellers dip into the long term group of averages, but the least aggressive see the price dip as a buying opportunity. The rebound starts quickly as the shorter averages turn up in a scramble to buy back into the stock.
A successful breakout quickly drags the long term investors with it. This group separates rapidly and does not react significantly to the inevitable breakout rally collapse. It is this relationship that confirms that decision point 2 is a safe entry point and that there is a strong probability that this new up trend will continue.
It is the activity of investors that help us as traders to better understand the nature of the breakout opportunity and to asses the probability of a young trend continuing. Typically traders spend a lot of time on an entry decision and less time on the exit. The GMMA is a useful exit tool because it helps us to understand the nature of the developing trend failure so we can select the most appropriate exit indicators and apply them at the most appropriate time. We look at these application next week.
TRADERS GLOSSARY
BREAKOUTS
A breakout takes place when price moves away from its existing pattern. This can be the change from a downtrend to an up trend, or from an up trend to a downtrend. It can also be a price move above a well established support or resistance level. A breakout is price activity that is different from the general pattern of price activity that has existed for days or weeks previous.
Breakout trading carries high risk because there is no guarantee that the breakout will persist. Many breakouts are false, so traders look for other indicators to confirm that the breakout is for real. Real breakouts are very profitable. Conservative traders look for breakouts, but then look for confirmation that the trend has changed.
Wyszukiwarka
Podobne podstrony:
THE GMMA Bubble Trading
Beating The Bear Short Term Trading Tactics for Difficult Markets with Jea Yu
[Trading Forex] The Forex Profit System
Level II Trading Warfare The Underground Trader's Powerful Weapons for Winning
Getting the GMMA right
Identifying Active Trading Strategies in the Bitcoin Market
[Форекс] The Cost of Technical Trading Rules in the Forex Market
(Trading) Paul Counsel Towards An Understanding Of The Psychology Of Risk And Succes
Thomas M Truxes Defying Empire, Trading with the Enemy in Colonial New York (2008)
Hamao And Hasbrouck Securities Trading In The Absence Of Dealers Trades, And Quotes On The Tokyo St
Jankovsky Jason Alan Trading Rules That Work The 28 Essential Lessons Every Trader Must Master
Forex24 lv Copy Trading The Ultimate Guide Into Social Investment Networks
[Trading ebook] The Art Of Surviving Through Money Management
(eBook) The Best Intraday Forex Trading System EVER
Levin Larry Larry Levin s One Time Framing Trading Technique To Be Used For Trading The E Mini S&P
Eleswarapu And Venkataraman The Impact Of Legal And Political Institutions On Equity Trading Costs A
więcej podobnych podstron