00253 &2b0db1857da3a70a010483c267f6f1
255
Statistical Process Monitoring
ARL (|i *4) ARL (n =2) ARL (ji >0.5)

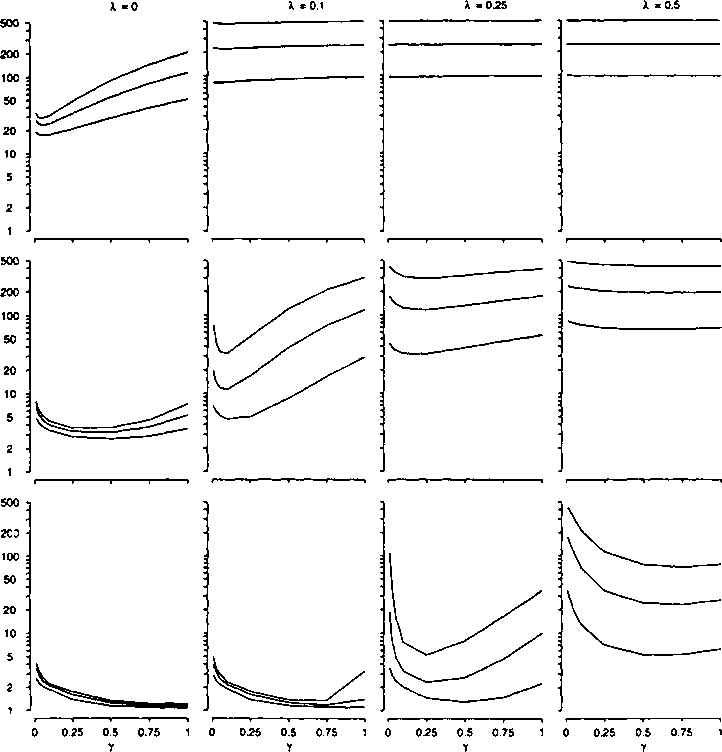
Figurę 6. ARLs for EWMA charts when an IMA(X) process experiences a step shift of p (innovation) standard deviations—p increases down the columns; X increases across the rows. The top, middle, and bottom curves in each panel correspond EWMAs with ARL„ values of 500, 250, and 100 respectively. To
choose a value for y, use the column with X closest to the estimated value and focus on the curves corresponding to the desired ARL0. Sometimes it will be
necessary to sacrifice ARL performance for one value of p to get better performance at another value.
Wyszukiwarka
Podobne podstrony:
00239 H0d76bba03e1acaa04165650d291f64 241 Statistical Process Monitoring noisy. Laser power wanders
00241 tbbf0afd5fc79c2ad0c3ecbce2b5261 Statistical Process Monitoring 243 0 20 40 60 Batch Number 0
00243 qeba09294a7c4e7be519dcac12e96db Statistical Process Monitoring with Integrated Moving Average
00245 ?f7c8f2fa9aad4150428b54cab4aa7e 247 Statistical Process Monitoring IMA x«o IMA with step X-
00247 ?afe0de1a29bbbc351bff1de393896b Statistical Process Monitoring with Integrated Moving Average
00249 ?617936bffdbbd14d2d86b9ecea0ccd Statistical Process Monitoring with Integrated Moving Average
00255 ?46f70ebf83d1195ed563865fc41c46 Statistical Process Monitoring with Integrated Moying Average
00257 ?7d3fbe299da615921484efa7ec143e Statistical Process Monitoring with Integrated Moring Ayerage
00259 >3777e2c66e87259144d3f5270c7d7a Statistical Process Monitoring with Integrated Moving Average
00261 ?23fd2fbf60262c650b896b720ccb0b Statistical Process Monitoring with Integrated Moving Average
00263 ?e449a653da457dfe3c42bd2915b13d Statistical Process Monitoring with Integrated Moring Average
00265 ?c44a3575504351098cf3798ec605dd Statistical Process Monitoring with Integrated Moving Ayerage
00251 B00da211d971f7696f3d99113607f66 ARl(n«4) ARL (m *2)
00021 80eda6b328d385a75ba377310f280a 20 Woodall & Faltin Wetherill, G. B., and Brown, D. W. (1
00058 *78c8eee8ef03439be90f7a748f77a0 57Adaptive Hierarchical Bayesian Kalman FilteringRelation to
00213 ?63458cc28250959e6eae16310a0980 11Applications of the EWMA for Algorithmic Statistical Proces
00236 ?44d42d312bc68c022745b1ad4e5b39 238 Baxley Yourstone, S. A., and Montgomery, D. C. (1990). “D
00237 ?3a2cd55f933cd1339eaf57acb97da5 12Statistical Process Monitoring with Integrated Moving Avera
00262 ?413be7c4ce1ddbc14b936c76bfc658 264Yander WielReferences Alwan, L. C. and Roberts, H. V. (198
więcej podobnych podstron