3582427133
Department of Surface and Nanostructures Physics Institute of Physics UMCS

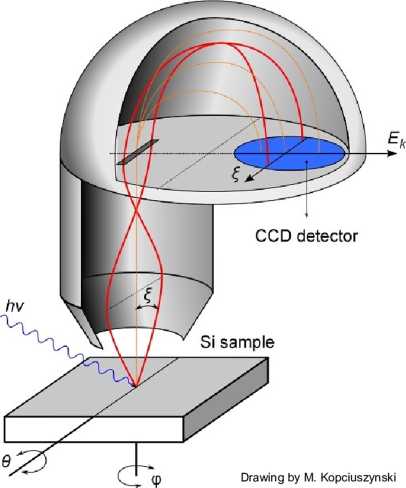
Analyzer with energy and momentum dispersion

Thick red lines show trajectories of two photoelectrons emitted at two different angles and with the same energy.
Emission angle dispersion is along the ę-axis.
Three thin lines mark trajectories of photoelectrons emitted normal to the sample surface, with different kinetic energies.
Energy dispersion is along the Ek -axis.
A slice determines energy resolution (desired effect) but simultaneously reduces intensity (not desired).
In this manner, each pair of coordinates on channelplate carries information on kinetic energy and emission angle of the detected photoelectron.
These parameters further allow determination parallel momentum componentand binding energy of the electron inside the crystal.
Wyszukiwarka
Podobne podstrony:
Department of Surface and Nanostructures Physics Institute of Physics UMCSS&NP ARPES apparatus w
Department of Surface and Nanostructures Physics Institute of Physics UMCSS&NPMinimal (required)
Department of Surface and Nanostructures Physics Institute of Physics UMCSS&NPElectronic feed-ba
Department of Surface and Nanostructures Physics Institute of Physics UMCSS&NPThermal drift and
Department of Surface and Nanostructures Physics Institute of Physics UMCSS&NPTunneling spectros
Department of Surface and Nanostructures Physics Institute of Physics UMCSSpectroscopy: normalized
Department of Surface and Nanostructures Physics Institute of Physics UMCSS&NPPhotoemission from
Department of Surface and Nanostructures Physics Institute of Physics UMCSS&NPEwald
406 ABOUT THE CONTRIBUTORS associated professor of thc Depart. of Praxiology of the Institute of Phi
DEPARTMENT OF DIPLOMACY AND INTERNATIONAL INSTITUTIONS POLISH - GERMAN ROUNDTABLE ACADEMIC DISCUSSIO
Department of Medical Physics and BiophysicsKatedra Fizyki Medycznej i Biofizyki STAFFHEAD prof. dr
PROFILE The Department of Medical Physics and Biophysics consists of four research groups. The resea
Department ot American Literaturę and Culture ^ Institute of English Studies Department of American
PROFILE The Department of Medical Physics and Biophysics consists of four research groups. The resea
PRIOR TO DEPARTURE, UNBERTHING, BERTHING AND NAVIGATION WITH PILOT EMBARKED - RIGHT SIDE OF “LOG BOO
BAHęESEHIR UNIVERSITY FACULTY OF ARCHITECTURE AND DESIGN DEPARTMENT OF ARCHITECTURE II oiift 10 (III
Sri Yldya College of Engfneering and Technology Department of ECE SUB. CODĘ: EC6311 SUB. NAME: ANALO
więcej podobnych podstron