117828225
522 M. Daszykowski eł al.
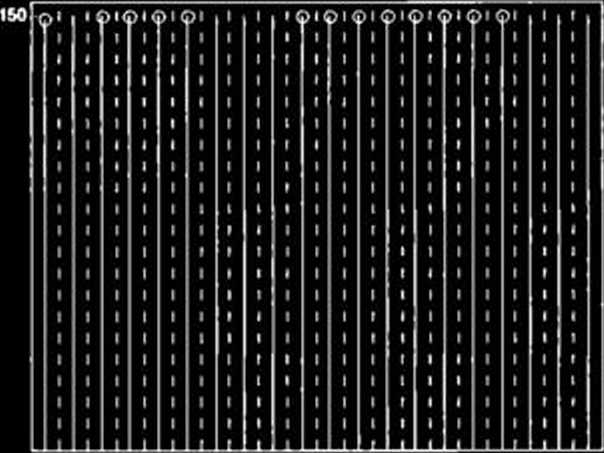
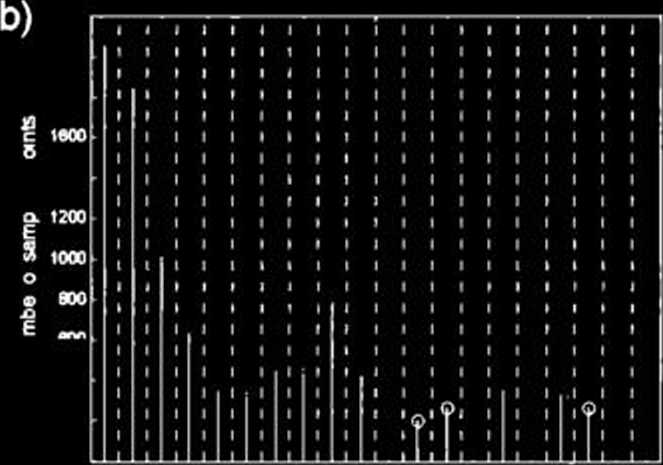
To illustrate this, Fig. la shows the original chromatogram of sample 12 (extract of S. tńloba), divided into twenty time intervals of 4 min each. In each time section, the number of the sampling points was determined and is visualized in Fig. Ib.
From this figurę, it can easily be understood that each section consists of a different number of sampling points. In terms of the number of points, the width of individual sections can be relatively large, and rangę from 110 to 2048 sampling points. As shown in Fig. Ic, linear interpolation enables adjustment of the acquisition ratę and, finally, each section has the same number of sampling points.


40 50
time [min]

ttme (mm)
Fig. 1. (a) Original HPLC chromatogram of sample 12 (extract of S. triloba) divided into twenty time sections of 4 min each; (b) number of sampling points in each time window; (c) number of points in each time window after linear interpolation of a signal
to a length of 3000 sampling points
Moreover, linear interpolation preserves the peak shapes. It seems the best option to adjust the number of points on the new time axis in accor-dance with the shortest chromatogram. Linear interpolation can also be used to reduce the length of a chromatogram. Very often, the number of the data points in a chromatogram can be much reduced, virtually without any
Wyszukiwarka
Podobne podstrony:
518 M. Daszykowski et al. nal vectors, and thus each consecutive PC models a part of the Information
95 (2) Add file to project □ Do you want to add this new file in the active project (has to be saved
tmta 9 Platę 8 Back view of doublet This shows the characteristic V-back of the collar, sometimes ma
dpp62 HOLDING AT ARM S LENGTH The illustration shows the Continental method of holding at arm’s leng
Entrelac Patterns This child s sweater can be worked in any size. The diagram shows the differe
On the complex o-ineąualityPiotr Nayar. Tomasz Tkocz Abstract In this notę we prove the complex coun
24 Urbańczyk: Ch. P. the smali opening, large of 1 to 2 centi-meters and situated in the pariet
labirynty (34) The alligator wants to visit her turtle friend on the other side of the swamp. H
Norway92 has been found to be too high by using the sounding eąuipment of to-day. Plans are alr
Elephant A littie info about the copyrights of this pattern... Please respect the originality I put
Bavarian Loco Eng Inst 1 This assembly instruction follows the original german wording as strictly a
więcej podobnych podstron