2949775347

3.3 TREPORTI (VENICE, ITALY) (JULY 2001)
As a matter of experimentation, one vertical CPTWD, was carried out down to 110 m, in mainly sandy zonę, starting from 50 m.
Due to very high resistance of the sand (sometimes Qc greater than 50 Mpa) , some intervals were carried out at continuous core drilling (also in order to verify and calibrate the static test) and non coring drilling with MWD.
In order to keep a constant ratę of penetration, having high density sandy intervals, the Operator sometimes increased the pressure of the mud injection at intervals in order to allow a 2 cm/s ratę (Ref 5 ). Therefore, in order to evaluate the potential effects of such pressure in the penetrometric parameters, another pressure sensor has been added to the current model, just above the friction sleeve ("U3" according to the recent nomenclature).
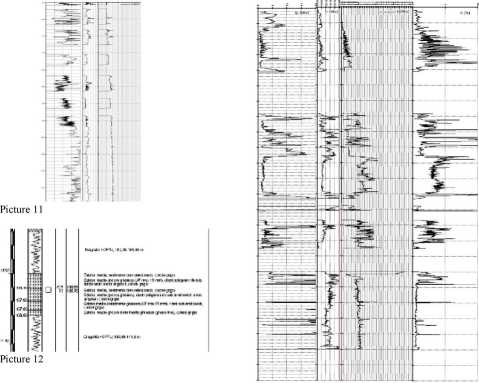
The diagram below shows the penetrometric graphic (Qc, Fs, U, Fr) from 0 to 110 m.
4 COMMENTS ON THE RESULTS
Actually, the amount of current available data to be compared with CPTWD is relatively smali and at present, comparative tests with other testing methods have not been carried out.
Accordingly, it would therefore be necessary, to perform a morę extensive validation of the obtained results with the following procedures:
* To execute comparative tests with CPTU and CPTWD at a depth which is achievable by the normal penetrometers. Such tests should be carried out in different types of soils in order to establish the correct testing procedures, in terms of the length of the cone, thrust calibration, pressure and volume of the injected fluid.
* To establish the cone’s optimum length below the drill-bit by testing in different types of soil also at great depth, analyzing the variations of U2 and U3 as
Wyszukiwarka
Podobne podstrony:
3 UN DEBAT : LES MENTAUTtS COLLECTIYES 559 a śp^cific literały genie or an aidistic style. As a
mbs 062 MY BREATHING SYSTEM inhalation, as a part of " my complete breath,” no attention should
S5002146 gp c [1 frag., Fig. 20:6), D [4 1 Fig. 20:2,3], H [1 frag.]. >n was carried out in the a
NPL Report MATC(A) 164 Finał polishing of the samples was carried out by hand using a gamma aluminid
S5002146 gp c [1 frag., Fig. 20:6), D [4 1 Fig. 20:2,3], H [1 frag.]. >n was carried out in the a
16 K. Damaziak et al. The statistical analysis of results was carried out using the statistical pack
Karta pracy 4 Lista gości 1. The most beautiful of all the Goddesses. She was born
wykonanych na powierzchni promenady Table 6. Results of Ihe gamma dose ratę measurement carried out
Installation steps Step 1 open the parking cases, the machinę carried out, according to the directio
70 Ontario, Canada) was carried out at 37° C in a Coplin jar placed in a moist chamber as described
więcej podobnych podstron