6781096813
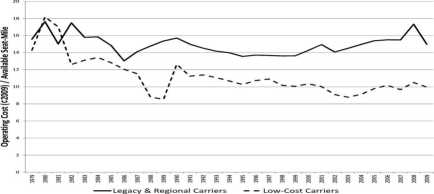
Figurę 7: Average Operating Costs per Available Seat-Mile
as well as relationships with airports that allow large incumbents to restrict the availability of gates, landing slots and other resources to potential entrants.
LCCs have been growing steadily sińce the early 1990s. Figurę 6 shows their domestic market share, by revenue passenger-miles sińce 1979.1 2 LCCs now compete (defined as at least 10% passenger share) on over 60% of all airport pairs, and over 80% of all city-pairs if one assumes that the different airports in Dallas, Houston, Chicago, San Francisco, Los Angeles, New York, and Washington DC are in the same markets.
And LCCs have much lower costs than the legacy carriers. Figurę 7 shows the operating cost per available seat-mile of the legacy plus regional carriers and the LCCs sińce deregulation. In the earliest years of deregulation, the very smali LCC carriers (primarily Southwest and PSA) flew very short routes - less than half the average haul length of legacy plus regionals - which drove up their cost per ASM to near the industry average. LCCs flights have sińce lengthened relative to other airlines and for the last decade have been only slightly shorter than industry average. For nearly comparable average flight distances, non-LCCs now have an average cost per ASM that is about 50% higher than LCCs.
While the cost differential between LCCs and non-LCCs has expanded, the average price differential has been shrinking, as shown in figurę 8, and is now much smaller than the cost differential. LCC fares have declined much less than those of legacy carriers in the
9
detail. Lederman (2007, 2008) presents evidence on the impact of FFPs.
The downticks in 1986, 1987 and 2008 are from legacy carriers absorbing the operations LCCs.
Wyszukiwarka
Podobne podstrony:
Figurę 9: Net Income per Available Seat-Mile for Legacy/Regionals and LCCs exogenous demand and cost
Figurę 1: Net Income per Available Seat-Mile: U.S. Domestic Markets measured by aircraft and 3.6% pe
00358 zf32813afb540cc5d33f56bd2d2e5e9 362 Prairie & Zimmer Perccnt Figurę 10. Percent Produced
76 Tomasz Sobestianczyk "The total cost of ownership of IT assets is reduced cm average of $761
Figurę 7.1. Economic growth In per cent 10 12---- - 12 ““ OECD members acceeded before 1990 “ “
a.2. support Staff 2 480 000,00 620 000,00 b. operating costs b.l. Utilities 2 600
Drivers in wind energy maintcnancc costs per year Sooroe: The Eoononicsol Wind Energy. EWEA
23 operating costs. To support Guinea worm eradication activities, the project would finance the rec
USE OUR TOOLS TO FIND THE BEST CREDIT CARD FOR YOU $22,000 - Average credit limit per family in th
50’ Hourly operating costs: Total costs 119,24 $ Hourly maint. costs: Total costs 68,78 $Estimated c
Klasyfikacja kosztów Przeciętne koszty całkowite (ATC i wielkości produkcji. average total costs) to
ang US$000s Operating Costs Jan. Feb. Mar. Apr. May Jun. Jul. Aug. Sep. Oct Nov. D
ATC = AFC + AVC ATC - przeciętne koszty całkowite (Average Total Costs) - są to średnie koszty przyp
Figurę 2. Decomplementation mcreases NK celi availabihty without affecting their effector function.
POLSKIE ECHO-LEEDS-BRADFORD BRADFORD-LEEDS-HUDDERSFIELD PRODUCTION OPERATIVE ■ 37.5 PER WEEK 5 DAYS
więcej podobnych podstron