
GIS and Business Intelligence:
The Geographic Advantage
An ESRI
®
White Paper • September 2006
ESRI 380 New York St., Redlands, CA 92373-8100 USA • TEL 909-793-2853 • FAX 909-793-5953 • E-MAIL info@esri.com • WEB www.esri.com

Copyright © 2006 ESRI
All rights reserved.
Printed in the United States of America.
The information contained in this document is the exclusive property of ESRI. This work is protected under United States
copyright law and other international copyright treaties and conventions. No part of this work may be reproduced or
transmitted in any form or by any means, electronic or mechanical, including photocopying and recording, or by any
information storage or retrieval system, except as expressly permitted in writing by ESRI. All requests should be sent to
Attention: Contracts and Legal Services Manager, ESRI, 380 New York Street, Redlands, CA 92373-8100 USA.
The information contained in this document is subject to change without notice.
U.S. GOVERNMENT RESTRICTED/LIMITED RIGHTS
Any software, documentation, and/or data delivered hereunder is subject to the terms of the License Agreement. In no event
shall the U.S. Government acquire greater than RESTRICTED/LIMITED RIGHTS. At a minimum, use, duplication, or
disclosure by the U.S. Government is subject to restrictions as set forth in FAR §52.227-14 Alternates I, II, and III (JUN
1987); FAR §52.227-19 (JUN 1987) and/or FAR §12.211/12.212 (Commercial Technical Data/Computer Software); and
DFARS §252.227-7015 (NOV 1995) (Technical Data) and/or DFARS §227.7202 (Computer Software), as applicable.
Contractor/Manufacturer is ESRI, 380 New York Street, Redlands, CA 92373-8100 USA.
ESRI, the ESRI globe logo, The Geographic Advantage, ArcGIS, ArcView, ArcIMS, ArcWeb, www.esri.com, and
@esri.com are trademarks, registered trademarks, or service marks of ESRI in the United States, the European Community,
or certain other jurisdictions. Other companies and products mentioned herein are trademarks or registered trademarks of
their respective trademark owners.

J-9586
ESRI White Paper
i
GIS and Business Intelligence:
The Geographic Advantage
An ESRI White Paper
Contents Page
GIS Overview ....................................................................................... 1
Business Intelligence Overview............................................................ 1
The Intersection of GIS and BI............................................................. 2
Integration Strategies ...................................................................... 3
Business Cases for Integration.................................................. 8
Business Case 1................................................................... 8
Business Case 2................................................................... 8
Business Case 3................................................................... 8
Business Case 4................................................................... 8
Business Case 5................................................................... 8
Integrated Application Examples.............................................. 9
Insurance ............................................................................. 9
Retail and Services.............................................................. 9
Manufacturing Warranty Analysis...................................... 10
Sales Force Efficiency ........................................................ 10
Supply Chain Management................................................. 10
Product/Service Delivery .................................................... 10
Fraud Detection................................................................... 10
Resources .............................................................................................. 11

J-9586
ESRI White Paper
GIS and Business Intelligence:
The Geographic Advantage
Historically, business intelligence (BI) and geographic information system
(GIS) technology have followed separate development and
implementation paths. Customer requests for a more complete operational
picture and the ability to be more proactive have led to the combination of
these two technologies. Regulatory requirements have also raised the
visibility of both technologies within many organizations. In response to
BI and GIS users, leading BI providers have been integrating the two
technologies and providing innovative solutions to a growing number of
end users. The users are responding with new applications that leverage
the synergy of the combined technologies.
This white paper describes the purpose and benefits of both GIS and BI, the technological
advancements that have fostered their integration, and the synergistic benefits of
integrated applications that can benefit the entire organization without disrupting existing
IT environments.
GIS Overview
GIS is a mature technology that began in university computer science departments in the
late 1960s. The seminal idea was associating data with geographically referenced map
graphics to allow an understanding of the influence of geography on behaviors and
outcomes.
Today's GIS recognizes the location component of data and associates data with
geographic features maintained in a GIS. Features in a GIS are graphic representations of
actual features, such as roads, rivers, and forests, and conceptual features such as political
boundaries or service areas. Associating data with features lets users organize data based
on the geographic location of each record in the data. This geographic organization,
presented as a map, reveals spatial relationships and influences that cannot be identified
in traditional tabular views of data.
Geographically organizing data allows the utilization of new data that may not have
anything in common with existing data other than location. For instance, GIS analysts for
insurance companies can map the addresses of insured structures and overlay floodplain
boundaries to identify all structures within the floodplain. With this information, they can
calculate the total financial impact on reserves from a potential catastrophic flood. Other
organizations, private and public, can perform this same analysis to determine potential
impact on facilities, supply chain, and employees.
Business Intelligence
Overview
The term business intelligence was coined in the mid-1990s to describe the emerging
practice of transforming raw data from an organization's disparate operational data into a
common data warehouse that could be used for discovering and reporting information.
Users interact with an easy-to-use interface that exposes the results of the extraction,
transformation, and loading (ETL) process used to populate the data warehouse. The

GIS and Business Intelligence: The Geographic Advantage
J-9586
September 2006
2
same interface is also the gateway into a structured reporting environment that distributes
operational reports and business decision results throughout the organization.
Recently, service-oriented architecture (SOA) has begun supplanting or augmenting data
warehousing in BI implementations. One of the business advantages of this platform is
that reporting and decision making are based on a common operational picture, or "single
version of the truth."
Reporting, a mainstay of BI, has become more graphics intensive. Business graphics,
typically charts, are now a common component of reports. As access to BI data became
more timely, graphic dashboards were developed to monitor key business processes.
Dashboards, named for their similarity to automobile dashboards, convey operational
information at a glance.
The Intersection of
GIS and BI
GIS and BI were being implemented as the IT landscape was evolving to embrace
common ways of compiling, storing, using, and distributing data. Proprietary systems,
used by both private and public organizations, had become a hindrance in a business
environment that demanded agility to operate effectively.
To address this issue, standards and common ways of interacting with data were proposed
by various organizations and IT providers. When these standards were adopted by IT
providers, it became easier for applications to interact because they shared common
technology foundations. During this time, Internet technology matured and had become a
viable communication protocol for exchanging information between the operational units
of an organization.
During the adoption of standards, BI and GIS application providers were concentrating
on working with the data that was most important to current core users. The BI providers
were creating connectors for the most common file formats used by business
applications, and ESRI, a GIS provider, was creating connections and transformations for
the geographic feature formats then in use worldwide.
The adoption of standards and the rise of the Internet as a data and information exchange
medium led, in part, to the vision of enterprise implementations of applications. While
ESRI and BI application providers have technology platforms and applications that can
meet the needs of enterprise implementations, BI and GIS applications are commonly
implemented in unrelated operational units within an organization.
Knowing how BI and GIS were actually deployed in organizations presented
opportunities for the proliferation of these technologies. If BI and GIS applications could
work together, the benefits of these respective technologies could be realized by
operational units not currently using both technologies. This would result in integrated
applications expanding throughout the enterprise.
Innovators in the public sector who wanted to extract more actionable information from
existing data came to the same conclusion. Exposure to "new" technologies in the context
of homeland security raised interesting possibilities for improving processes not directly
related to homeland security. The fact that public agencies were looking at BI with the
idea of integrating it with GIS was not lost on the BI providers whose success in the
private sector had not been matched in the public sector.

GIS and Business Intelligence: The Geographic Advantage
J-9586
ESRI White Paper
3
ESRI and various BI providers realized that the earlier adoption of standard technology
architectures would make integrating GIS and BI much easier. Furthermore, each
discipline brought solutions to problems that were perceived as major obstacles to
enterprise implementations of the respective applications.
For a GIS provider, using tabular data from hundreds of database and file systems could
be difficult and expensive. This was a problem addressed by BI providers by using the
ETL process or connectors that allow BI applications to use native file formats.
Conversely, BI providers were hard-pressed to deal with the variety of geographic data
formats, CAD data, and imagery. The myriad of projections and datums used in GIS
maps were also challenging. The GIS sector had addressed these issues by adopting
standards for the interoperability of GIS data. Two of the major obstacles to integration
had already been addressed but had not been effectively communicated between the two
application environments.
Integration Strategies
A typical BI implementation consists of applications selected from a suite of applications
comprising the entire BI technology stack. This ability to "pick and choose" applications
results in solutions tailored to the specific needs of end users. However, there are
applications that tend to be common to nearly all implementations by a given provider.
These common applications are the most cost-effective points of integration for GIS. The
ArcGIS
®
family of products is well suited to this implementation environment, and BI
providers have been quick to see the value in the integration options offered by ArcGIS.
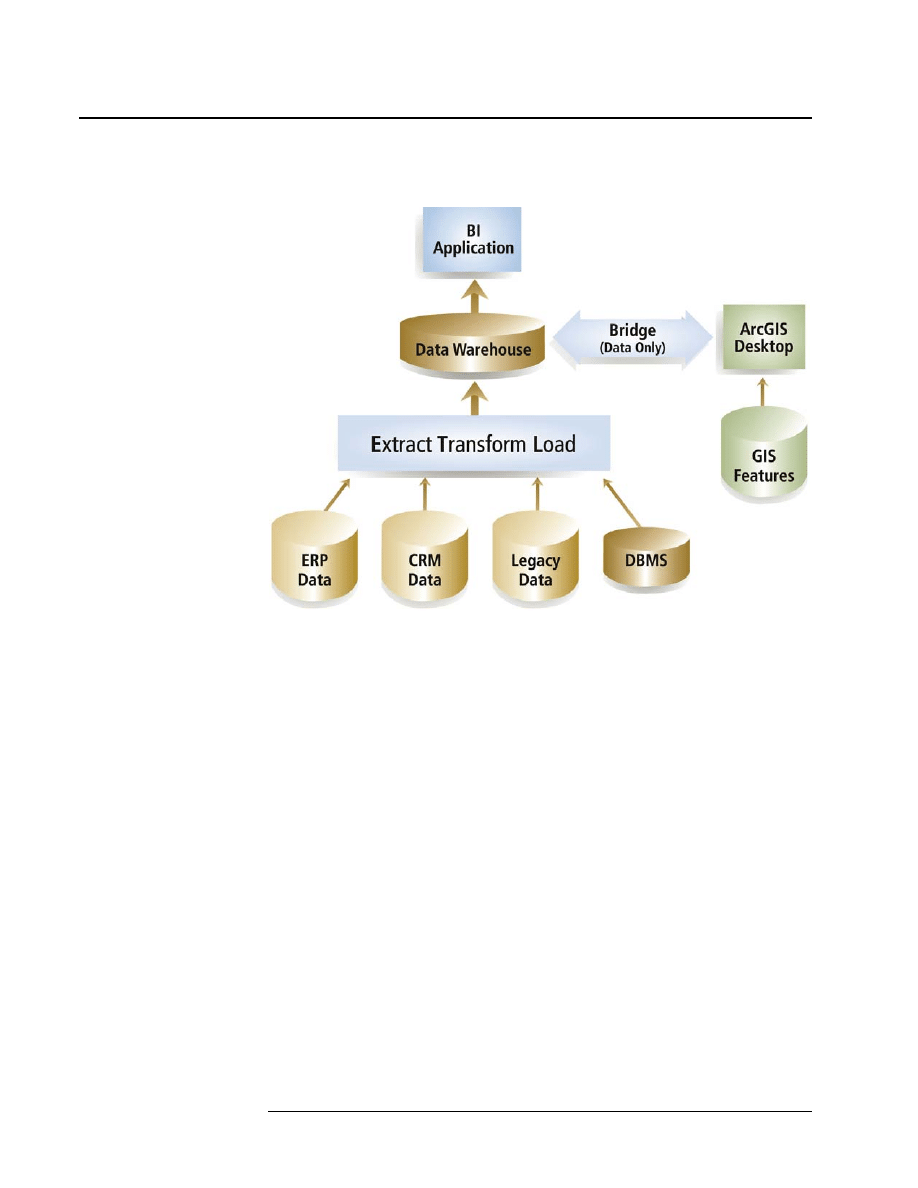
Desktop Integration
⎯Early adopters of GIS-enabled BI most often used an ArcGIS
Desktop application such as ArcView
®
. Connector, or "bridge," applications
permitted the GIS application to access and geographically analyze data directly
from the BI data repository. Results of geographic analysis could be passed back to
the BI data repository for eventual reporting or further nongeographic analysis.
While this model supports sophisticated analytics, it has one glaring BI
shortcoming
⎯no actual maps are created in the BI reporting environment. Maps
presenting analytic results must be composed and published entirely within the GIS
environment. As Jack Dangermond, president of ESRI, stated, "While business
intelligence platforms provide access to data across the enterprise, GIS is able to
present this aggregated data as context-rich maps. These maps give organizations a
powerful new tool to proactively manage their operations."
GIS and Business Intelligence: The Geographic Advantage
J-9586
Figure 1
A simple example of using a bridge to integrate GIS and business intelligence applications via a data
warehouse. The user interface is either ArcGIS or the BI application; there is no integrated user interface.
There has been recent renewed interest in bridging applications as rapid development
and proof-of-concept tools. Also, as server-based integrations make mapping more
visible throughout organizations, demand has risen for more cartographically
pleasing maps for formal presentations.
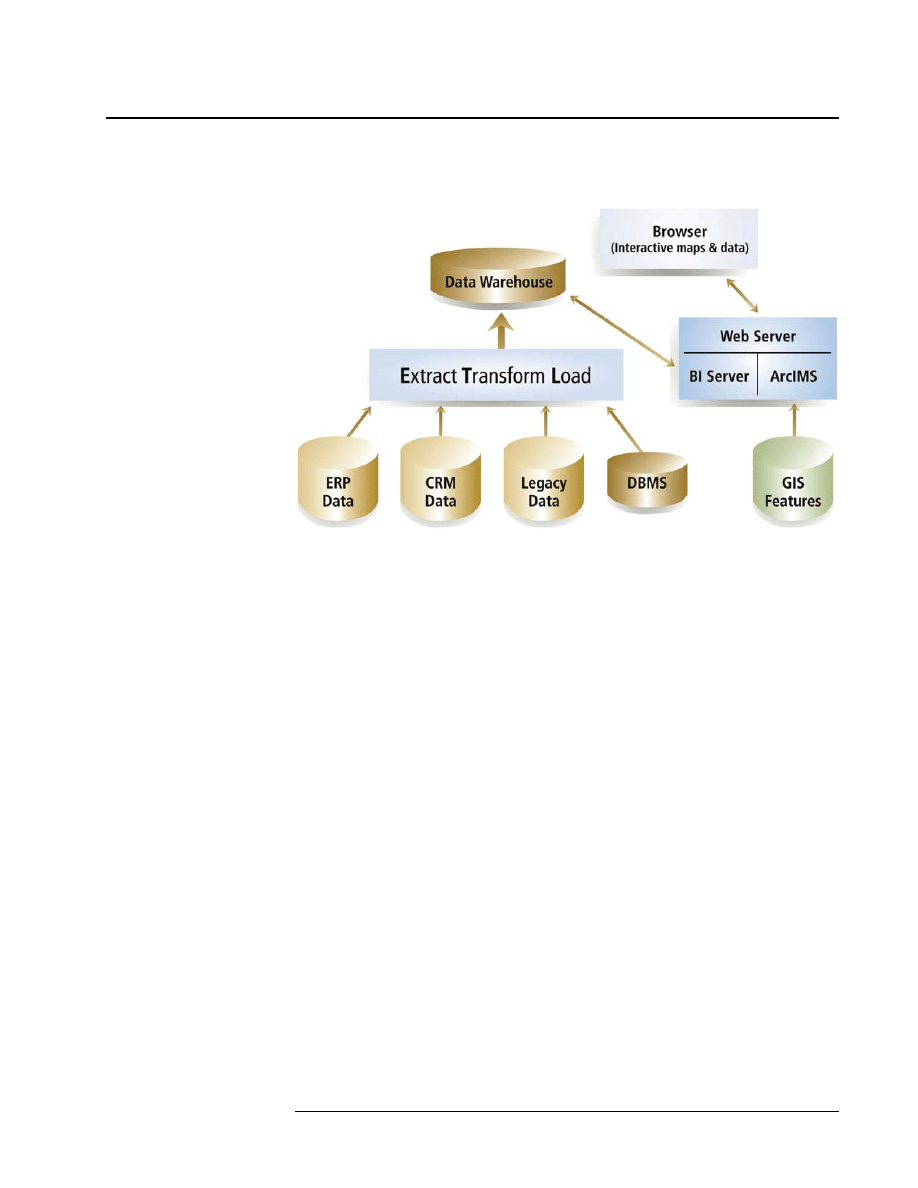
Server Integration
⎯Server-based BI and GIS integration efforts were driven by
end users wanting to utilize the BI reporting environment to distribute GIS-generated
maps.
ESRI's ArcIMS
®
fulfills this requirement with a Web-based application that is easily
integrated with today's BI Web-based reporting environments. Publishing a thematic
map as a business graphic in a report, a low level of GIS functionality, met the early
requirements of the BI community.
However, BI developers exposed to the capabilities of ArcIMS expanded the scope
of their efforts to allow bidirectional interaction with BI data via the map interface of
ArcIMS. A user can now select areas on the map and have those selections be
reflected in the table portion of the report.
Conversely, records in the table portion can be selected and appear as selections on
the map. The latest ArcIMS integrations permit map layers to be turned on and off;
map feature identification by clicking; and the addition of transparent, or acetate,
layers that superimpose pertinent business data over the appropriate map feature.
September 2006
4
GIS and Business Intelligence: The Geographic Advantage
J-9586
Figure 2
In this example, the BI application and ArcIMS are integrated via one or more Web servers. The user
experiences an integrated map and data application within a Web browser.
While ArcIMS was being implemented to meet the map reporting needs of the BI
community, the BI landscape was shifting. Reporting and dashboard applications had
been successful in providing consistent visibility into operations and timely
performance monitoring but were not forward looking. The ability to more
successfully plot the future course of business has increased demand for predictive
analytics in BI implementations. GIS has long been used for predictive analytics.
Urban planners have been using GIS for decades to predict population growth and
migration patterns to effectively plan infrastructure projects. Reinsurers have long
used GIS to analyze environmental risks, such as flood and wildfire zones, to
determine if there are sufficient reserves to meet potential needs.
However, these analyses have historically been done by trained GIS technicians
using powerful desktop GIS applications. This domain expertise-intensive approach
to analytics is the antithesis of what end users expect of BI applications.
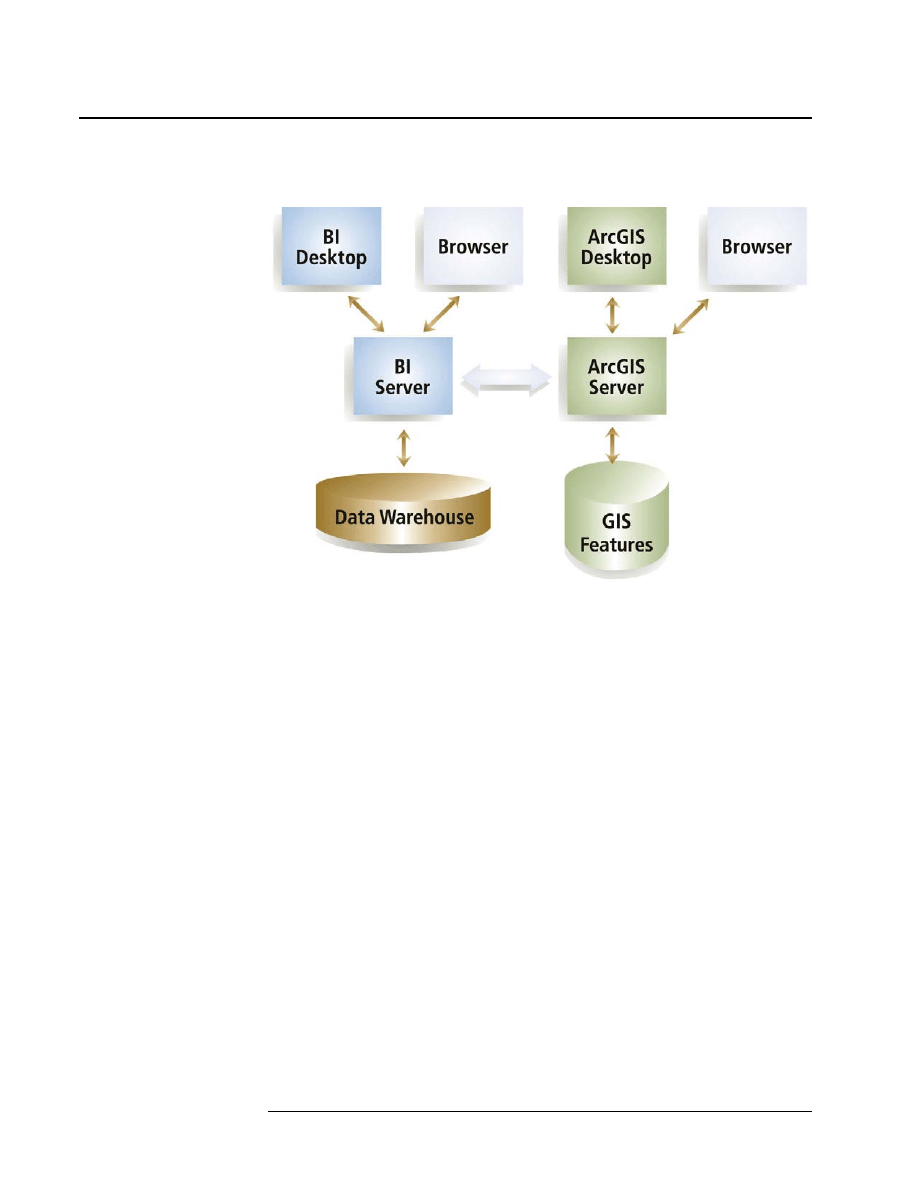
BI providers adopted ArcGIS Server integration to provide sophisticated GIS
analysis in a user-friendly format. ESRI and BI providers work closely with the user
to define a set of persistent analytic requirements that can be initiated with very little
input from the user. In essence, the end user runs a preconfigured model that does the
heavy business and geographic analysis on the server and returns the results to the
user in the form of a Web report. Because ArcGIS Server takes a centralized
approach to GIS management and application support, it requires that an
organization either has GIS expertise available in-house or can access outside GIS
application support.
ESRI White Paper
5
GIS and Business Intelligence: The Geographic Advantage
J-9586
Figure 3
In this example, the BI application and ArcGIS Server are integrated to expose GIS functionality, or the
results of geographic analysis, in the BI user interface. Conversely, BI functionality, or the results of
statistical business analytics, can be exposed in the GIS user interface.
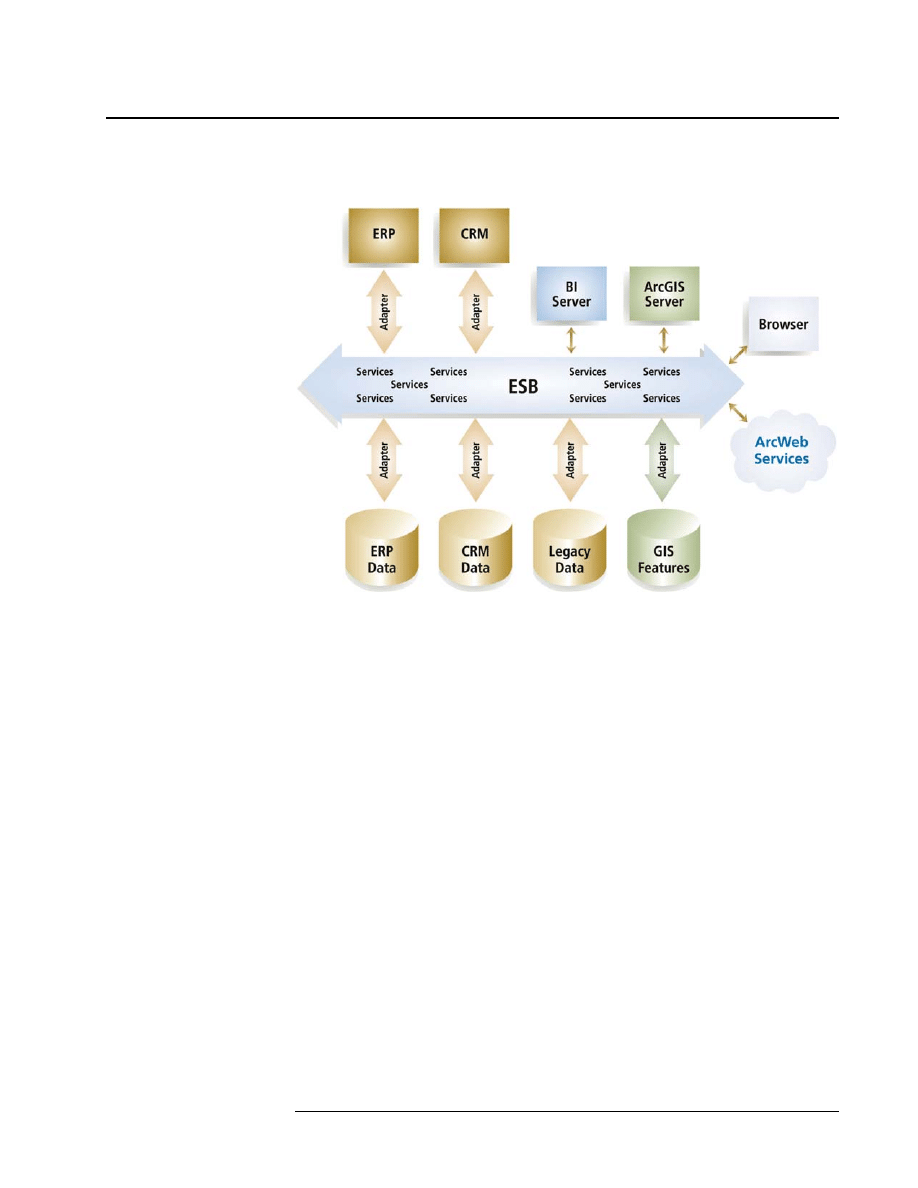
The recent adoption of SOA by organizations has expedited the utilization of server-
based BI and GIS. Early BI providers excelled in developing connections to
disparate operational data assets. However, these connections can be more than just
connectors or data translators for populating a data warehouse; they can sense
activity in the parent data store and initiate higher-level services.
SOA can take advantage of these sophisticated connections, or adapters, to
periodically update a higher level of data aggregation, such as an online analytical
processing (OLAP) cube, and/or run a persistent model in real time. An example of
this could be the adapter detecting a new customer record in the customer
relationship management (CRM) system and initiating a geocoding service that
would in turn populate the features data with a new customer location or point. This
ability is now available to all participants in the SOA environment, not just the BI
server.
September 2006
6
GIS and Business Intelligence: The Geographic Advantage
J-9586
Figure 4
A simplified view of service-oriented architecture utilizing the enterprise service bus (ESB) to pass services
between various applications. Applications in ArcGIS Server can use aggregated data managed by the BI server
and utilize its reporting platform. The ArcGIS Server could also use enterprise resource planning (ERP) or
CRM data via a service independent of the BI server.
While both BI servers and the ArcGIS Server are well suited to participate in an
SOA environment, it is not required for their implementation. Most organizations
will meet the need for BI and GIS analytics by linking the BI and GIS servers with
an adapter, independent of an enterprise SOA.
ArcWeb
SM
Services
⎯A number of issues concerning GIS data have been obstacles
to wider adoption of GIS in the business community. While the value of GIS can be
grasped by nearly all businesspeople, data issues can have a very negative impact on
IT personnel tasked with researching an implementation.
Traditionally, GIS data providers or GIS application providers have addressed many
of these issues by providing packages of data tailored to the user. However, when
data is provided, the user needs some understanding of GIS to get the data into the
system without disrupting operations.
The cost of purchased data can also be prohibitive when large geographic areas are
being analyzed at a detailed level. High-resolution imagery for large areas also
requires a tremendous amount of storage capacity.
ArcWeb Services addresses these issues by making GIS-ready data available as a
service on a subscription basis. ESRI hosts the data, maintains currency, and
cartographically enhances it for seamless incorporation into ArcGIS software-
ESRI White Paper
7

GIS and Business Intelligence: The Geographic Advantage
J-9586
September 2006
8
enabled BI applications. Among the many types of data available from ArcWeb
Services are those most commonly used in BI applications: demographics, streets,
aerial imagery, and Federal Emergency Management Administration floodplain
boundaries.
While this integration overview suggests that an organization needs to identify a
single way of integrating GIS into BI implementations, this is not necessarily the
case. Some organizations will choose a bridge application to build models and
geographic datasets with the intent of migrating them into an ArcGIS Server or
ArcIMS environment. Other organizations may choose to have an ArcIMS
integration to serve map-enabled reports to a large audience and an ArcGIS Server
implementation to serve applications to a smaller audience of analysts.
Business Cases for
Integration
Business Case 1
Organizations that have implemented large BI systems are looking for ways to extract
more value from their significant investments. Incorporating GIS to analyze and display
existing but underutilized location data is a relatively inexpensive approach to improved
return on investment (ROI).
Business Case 2
The power of BI to provide specific reports to select audiences at specified times is a
powerful communication and decision-making capability not available to today's GIS
applications. By implementing BI reporting systems, the proven analytic capabilities of
GIS can be made available to a wider audience in an organization.
Business Case 3
Many organizations have implemented both BI and GIS but in different operational
departments. ESRI and ESRI's BI business partners have compared customers and found
50 to 80 percent of BI customers also have ESRI
®
GIS somewhere in the organization.
These "shared customer" sites can realize the benefits of integration by obtaining an
integration application and not an entire GIS or BI package.
Business Case 4
Multiple GIS and BI implementations from various vendors can produce different
answers to the same question. There is no consistent repository of data, applications, or
domain expertise across the organization on which to base decisions. This information
anarchy reduces the confidence decision makers have in processes they rely on to run
their organizations. A lack of confidence in business processes can lead to decisions that
are overly influenced by risk aversion and not adequately responsive to dynamic markets.
Furthermore, regulatory compliance regulations have made consistent and replicable
business process and activity reporting a necessity for publicly traded organizations.
The selection of a particular integration strategy often leads to an examination of the
entire organization's current GIS and BI implementations. This invariably leads to a
consolidation of applications from different providers and a reduction in overall annual
software maintenance fees. These fee reductions effectively lower the costs of the BI/GIS
integration.
Business Case 5
Combining BI and GIS capabilities results in greater value from both applications. The
rudimentary (by business standards) charting capability of GIS is vastly improved by the

GIS and Business Intelligence: The Geographic Advantage
J-9586
ESRI White Paper
9
business charting abilities of BI applications. Conversely, GIS brings unique charting
capabilities to BI in the form of spatial relationship and distribution charts. The portrayal
of BI data as maps addresses a recognized shortcoming in BI graphics—the lack of
context needed for informed decisions. For example, node-to-node supply chain
performance data presented as bar charts or dashboards does not supply the location
information needed for planning improvements. The same performance report presented
as a map immediately shows spatial relationships between nodes that could explain
variations in performance.
Many organizations, both public and private, have come to understand the business cases
for integrating BI and GIS and are actively exploring integration strategies. In recognition
of this shift in the BI marketplace, the latest product releases from leading BI providers,
such as Business Objects
™
, Information Builders
®
, and SAS
®
, were built to take
advantage of ESRI ArcGIS applications. ESRI business partners, such as Integeo,
Galigeo, and APOS Systems, have built products that bring ArcGIS mapping and other
business visualization tools to BI applications from other providers. The open
architecture of ArcGIS has also allowed leading system integrators, such as
BearingPoint
®
and Accenture, to easily integrate ArcGIS with BI applications from a
number of BI providers.
Integrated
Application Examples
Insurance
Rate areas for properties are typically defined by artificial boundaries such as ZIP Codes.
ZIP Code boundaries were created to meet the business needs of the U.S. Postal Service
and do not reflect the economic reality of the locations within a particular ZIP Code. Real
estate agents understand the profound effect precise location has on property value.
However, this view of property value is lost on most of the insurance industry.
GIS is used by some forward-looking insurance companies to create continuous rating
surfaces based on economic reality across the entire area of interest, no artificial
boundaries. This rating methodology results in realistically comparable values for similar
properties on opposing sides of a ZIP Code boundary. When this geographic rate analysis
is performed in the BI environment, with access to other operational data, results can be
quickly distributed to those making decisions on issuing a policy, making the process
more efficient.
Retail and Services
Siting of goods and services outlets has traditionally been performed at a departmental
level, and the process was not visible throughout the organization. In many cases, the
methodology used was known to a few individuals in the real estate department and was
not necessarily replicable.
When an established GIS/BI siting model is used in the greater BI environment, it not
only becomes replicable but can be used as a collaboration tool, inviting input from those
in an organization that may have firsthand knowledge of a potential location.
Furthermore, with International Convergence of Capital Measurement and Capital
Standards
⎯A Revised Framework (Basel II) compliance expected to become a reality,
the need to accurately account for current real estate asset value can be more easily
accomplished in a GIS. Value affecting data such as demographics and geographically
influenced risk can easily be updated in GIS models.

GIS and Business Intelligence: The Geographic Advantage
J-9586
September 2006
10
Manufacturing
Warranty Analysis
Automakers and some home improvement materials suppliers have added GIS
capabilities to existing BI-based warranty analysis applications. An automaker discovered
previously unrecognized geographical patterns in its BI-based warranty claims system
that identified factors other than manufacturing as the cause of some component failures.
When a building material manufacturer GIS enabled its BI-based warranty system, it
became apparent that the claims related to premature product degradation were clustered.
The location of these customers shared some unusual climate characteristics that were not
considered in the formulation and design of the product. Using historic climate data from
the government and its own sales history, it was then able to predict future areas of
product failure and proactively address the problem. Map-based reports showing the
progress of the remediation campaign were regularly distributed throughout the
organization.
Sales Force Efficiency
The balancing of sales territories has traditionally been map based but only at a very
rudimentary level. In the worst case, a sales area might be divided into territories by
equal geographic size or by assigning the same number of cities or counties to each
salesperson. Now forward-looking companies are applying GIS analysis to BI-managed
CRM software, facilities, and personnel information to balance sales territories. By
considering the locations of the salesperson and targeted customers in the context of drive
time, territories can be much more realistically tailored and more efficiently served.
Supply Chain
Management
Presenting supply chain performance data in the form of a spreadsheet neglects the real-
world influence of geography on transportation. One retailer knew the nodes of the
supply chain (rows on a spreadsheet) well, but when the routes between the
manufacturers and distribution warehouses were actually mapped, it was discovered that
every shipment ended up crossing the same bridge. The entire company's operation
would be negatively impacted if this particular bridge was closed.
The graphing and network display capabilities of GIS are particularly well suited to
supply chain management. Manufacturing and distribution centers can be represented on
a map as charts showing product supply or manufacturing capability. The route can
indicate volume (by using line thickness) and whether products at different places on the
route will be delivered on time (by using different colored route segments). When supply
chain performance is mapped in this way, problems are immediately apparent and
alternatives, such as rerouting production from another facility, are much easier to
explore.
Product/Service
Delivery
The use of GIS for optimizing routes for the efficient delivery of goods and services is
not new. However, getting product and destination data into these applications can be
difficult given the variety of input data needed to effectively deploy the solution. The
ability of BI to provide seamless access to inventory and CRM data is making the
implementation of such applications much simpler and less expensive. Organizations are
now using the route optimization capabilities of GIS in conjunction with facilities data to
streamline the loading of delivery trucks and more efficiently manage interfacility
shipments of inventory.
Fraud Detection
Issuers of credit are validating identification of customers calling for assistance by
displaying a map identifying the customer's address and nearby landmarks. Call center

GIS and Business Intelligence: The Geographic Advantage
J-9586
ESRI White Paper
11
personnel can then ask questions that can only be answered by someone familiar with the
customer's neighborhood. Some of these questions might be, What is the nearest cross
street to your house? What is the name of the nearest lake or river? What is the nearest
highway? Which direction do you drive to get to the airport? or Where is the nearest
school? The detail of questions is only limited by the richness of the GIS data.
Resources
Business Objects and GIS
Information Builders and GIS
SAS and GIS
GIS Business Solutions
GIS in Financial Services
GIS in Insurance
GIS in Federal Government
GIS in State and Local Government
Australia
www.esriaustralia.com.au
Belgium/Luxembourg
www.esribelux.com
Bulgaria
www.esribulgaria.com
Canada
www.esricanada.com
Chile
www.esri-chile.com
China (Beijing)
www.esrichina-bj.cn
China (Hong Kong)
www.esrichina-hk.com
Finland
www.esri-finland.com
France
www.esrifrance.fr
Germany/Switzerland
www.esri-germany.de
www.esri-suisse.ch
Hungary
www.esrihu.hu
India
www.esriindia.com
Indonesia
62-21-527-1023
Italy
www.esriitalia.it
Japan
www.esrij.com
Korea
www.esrikr.co.kr
Malaysia
www.esrisa.com.my
Netherlands
www.esrinl.com
Poland
www.esripolska.com.pl
Portugal
www.esri-portugal.pt
No. GS-35F-5086H
Printed in USA
ESRI International Offices
ESRI Regional Offices
Olympia
360-754-4727
St. Louis
636-949-6620
Minneapolis
651-454-0600
Philadelphia
610-644-3374
Boston
978-777-4543
Washington, D.C.
703-506-9515
Charlotte
704-541-9810
San Antonio
210-499-1044
Denver
303-449-7779
California
909-793-2853
ext. 1-1906
Romania
www.esriro.ro
Singapore
www.esrisa.com
Spain
www.esri-es.com
Sweden
www.esri-sweden.com
Thailand
www.esrith.com
United Kingdom
www.esriuk.com
Venezuela
www.esriven.com
1-800-GIS-XPRT
(1-800-447-9778)
www.esri.com
Locate an ESRI value-added reseller
near you at
www.esri.com/resellers
Outside the United States,
contact your local ESRI distributor.
For the number of your distributor,
call ESRI at 909-793-2853,
ext. 1-1235, or visit our Web site at
www.esri.com/distributors
For More Information
ESRI
380 New York Street
Redlands, California
92373-8100 USA
Phone: 909-793-2853
Fax: 909-793-5953
E-mail: info@esri.com
For more than 35 years, ESRI has
been helping people make better
decisions through management
and analysis of geographic
information. A full-service GIS
company, ESRI offers a framework
for implementing GIS technology
and business logic in any
organization from personal GIS on
the desktop to enterprise-wide GIS
servers (including the Web) and
mobile devices. ESRI GIS solutions
are flexible and can be customized
to meet the needs of our users.
Wyszukiwarka
Podobne podstrony:
Getting Started with Data Warehouse and Business Intelligence
Business Intelligence id 95573 Nieznany (2)
Aging skin and food suplements Nieznany (2)
05 Culture and cognitionid 5665 Nieznany
Patriarchy and Gender Inequalit Nieznany
Local and general anaesthetics Nieznany
2 Vitamin D and asthmaid 19707 Nieznany
Physical and chemical character Nieznany
Mathematical and technical opti Nieznany
First 2015 Reading and Use of E Nieznany
algorithms and complexity DMQPR Nieznany
English for CE EE and water id Nieznany
Business Intelligence w zarządzaniu bartini W1
Applications of Robotics and Artificial Intelligence
How to speak and write correctl Nieznany
Past Simple and Past Continuous Nieznany (2)
więcej podobnych podstron