
Getting Started
with MetaStock
®
End of Day and MetaStock
®
Professional
Version 10.0
Printed in the USA
All Rights Reserved
Copyright © 1985-2006
Equis International
90 South 400 West
Suite 620
Salt Lake City, UT 84101
http://www.equis.com

Except as permitted by law, no part of this document may be reproduced or
transmitted by any process or means without the prior written consent of Equis.
Equis, by publishing this document, does not guarantee that any information
contained herein is and will remain accurate or that use of the information will
ensure correct and faultless operation of the relevant product or service. Equis
provides its products and services as tools to be used by investors who are
aware of the risk inherent in securities trading, not as recommendations to buy
or sell. Equis, its agents, affiliates, and employees shall not be held liable to or
through any user for any loss or damage whatsoever resulting from reliance on
the information contained within this document or through the use of Equis
products or services.
September 2006
0 9 8 7 6 5 4 3 2 1 IP

Getting Started with MetaStock 10.0
Installing MetaStock
❖ i
Contents
Introduction 1
Welcome to MetaStock ..............................................................................................................1
About this Manual......................................................................................................................1
Chapter 1 - Installing MetaStock
3
Chapter 2 - The Basics
4
Before We Begin........................................................................................................................4
Open a Chart ..............................................................................................................................5
Plot an Indicator .........................................................................................................................8
Drawing a Line Study...............................................................................................................11
Deleting Line Studies and Indicators .........................................................................12
This is Only the Beginning.......................................................................................................12
Chapter 3 - Security Files
14
Why Use Security Files? ..........................................................................................................15
Create a New Security File.......................................................................................................15
Create Multiple Security Files..................................................................................................17
Create a Few Security Files One by One ...................................................................17
Create Many Security Files At the Same Time ..........................................................18
Save Security Files in Different Folders...................................................................................19
Place Security Files in an Existing Folder .................................................................19
Create a New Folder ..................................................................................................19
Chapter 4 - The DownLoader
22
Your Data Vendor User ID and Password ...............................................................................22
Download Data Into a Security File .........................................................................................23
Chapter 5 - Charts 28
Working With Charts ...............................................................................................................28
Change the Price Plot Style........................................................................................29
Zooming In and Out on a Chart .................................................................................29
Change the Beginning or End Date............................................................................30

ii
❖ Installing MetaStock
Getting Started with MetaStock 10.0
Chapter 6 - Indicators and Line Studies
32
What are Indicators and Line Studies? .....................................................................................32
Indicators ...................................................................................................................32
Line Studies ...............................................................................................................33
Chapter 7 - Power Tools
36
MetaStock’s Power Tools ........................................................................................................36
The Enhanced System Tester ...................................................................................................36
The Explorer ............................................................................................................................42
The Expert Advisor ..................................................................................................................47
Chapter 8 - Getting Help
49
Five ways to access the Help system: .......................................................................................49
More Places to Get Help ..........................................................................................................51
Technical Support Contact Information .....................................................................51
Chapter 9 - QuoteCenter Features
53
MetaStock Application Properties............................................................................................53
QuoteCenter Symbols...............................................................................................................55
Chapter 10 - Reuters DataLink Features
56
Choosing a Service Package.....................................................................................................56
Reuters DataLink Application Properties.................................................................................57
Reuters DataLink Symbols .......................................................................................................58
Chapter 11 - eSignal Features
60
eSignal Application Properties .................................................................................................60
Using the eSignal Data Manager ..............................................................................................62
Shutting Down the eSignal Data Manager .................................................................62
The Equis Services Bit...............................................................................................63
eSignal Symbols .......................................................................................................................65
Symbol Database Updates..........................................................................................66

Getting Started with MetaStock 10.0
Installing MetaStock
❖ 1
Introduction
Welcome to MetaStock
Congratulations! You are about to learn how to use MetaStock, voted best
trading software nine years in a row by Stocks and Commodities magazine,
and considered an essential tool by thousands of successful traders.
So why is everybody so excited about MetaStock? What’s so great about it?
Well, compare trading in the stock market to flying a plane. It’s risky, but
rewarding. You define goals and you set out to achieve them. So if trading in
the stock market is like flying a plane, then MetaStock is your radar screen…
and more!
Here are just a few of the things you can do with MetaStock:
Analyze thousands of stocks with the touch of a button
Create, update and customize charts for all the securities you’re following
Apply line studies and indicators to your charts
Watch for automatic buy/sell signals
Get expert advice for any security you want
Make emotion-free decisions based on data and past performance
The possibilities are limited only by your desire to get the most out of
MetaStock. This manual is designed to help you do just that.
About this Manual
This manual is designed to get you up and running with MetaStock as quickly
as possible. So if you’re ready to start right now (and you’ve already installed
MetaStock), jump to Chapter 2 - The Basics on page 4.
This chapter will walk you through the tasks that are at the heart
of MetaStock. These step-by-step instructions leave out a lot of details and
background information so you can get started using MetaStock right now.
The details and background information are still important, though, so they’re
explained in chapters three through seven.

2
❖ Installing MetaStock
Getting Started with MetaStock 10.0

Getting Started with MetaStock 10.0
Installing MetaStock
❖ 3
Chapter 1 – Installing MetaStock
Installing MetaStock is a simple process that should take most people less
than ten minutes.
To install MetaStock from a CD
1. Insert the MetaStock Program CD into your drive. The setup should start
automatically if the Windows “auto run” feature is enabled on your computer.
Note: If the autorun feature of Windows is not enabled on your computer:
a) Click the Windows Start button and choose the
Run
command.
b) Type “D:\SETUP.EXE” in the
Open
box and click OK.
(“D” represents the letter assigned to your CD ROM drive.
If this drive has a different letter, use that letter instead of “D”.)
2. Follow the on screen instructions. You will be prompted for a Setup key.
Your Setup key is included on the order invoice form that was sent to you via
email, as well as on the CD case.
To install MetaStock from a download
Once you have downloaded the MetaStock installation application, you will
need to complete the following steps:
1. Locate the program using the Windows File Manager.
2. Double-click on the program name. The setup will start automatically.
3. Follow the on-screen instructions. You will be prompted for a Setup key.
Your Setup key is included on the order invoice form that was sent to you via
email and on the “My Downloads” web page accessible by logging into your
www.equis.com
web account.
To activate your MetaStock license
1. The first time you run MetaStock after you install it, you will be asked to
activate your license. Although this process is self explanatory, the document
“License Manager.pdf” located in the MetaStock installation directory,
and the FAQ located at www.equis.com/activationfaq provide
additional explanations if you require them.
2. To activate your MetaStock license, you will need the License number
included on the order confirmation form that was sent to you via email.
IMPORTANT: While you can install the MetaStock software without
activating it using your license number, you will not be
able to use MetaStock beyond the demonstration
period if you do not activate it.
4
❖ The Basics
Getting Started with MetaStock 10.0
Chapter 2 – The Basics
Before We Begin
Make sure you’re connected to the Internet.
Make sure MetaStock knows your user ID and password for your data
provider. If you’re not sure how to enter your user ID and password, refer to
the procedure on page 22 once MetaStock is open (explained next).
To run MetaStock:
1. Click the Windows Start button, and select
Programs
2. Select the
Equis International
group.
3. Select
MetaStock Professional
or
MetaStock
Note: From here on, menu selections will be indicated by a “>”. As an example,
the above instructions would be presented as:
Start>
Programs> Equis International> MetaStock Professional
.
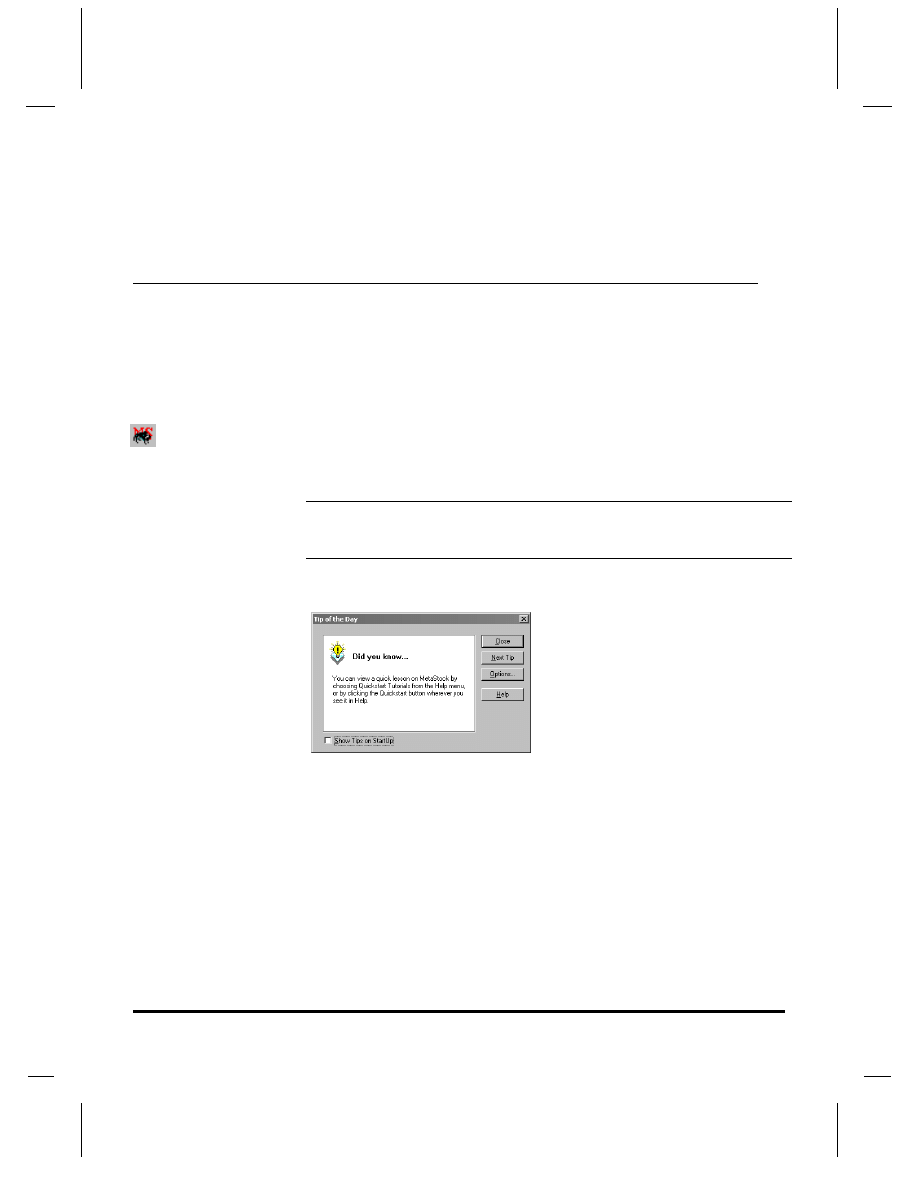
The first time you run MetaStock, you’ll see a Tip of the Day that advises you
to read this manual. Just click Close to get it out of the way for now.
After you close the Tip of the Day, you’ll see a message box asking you if you
want to run through the MetaStock tutorials. Click Later. You can always go
back to the tutorials.
MetaStock icon
Getting Started with MetaStock 10.0
The Basics
❖ 5
Open a Chart
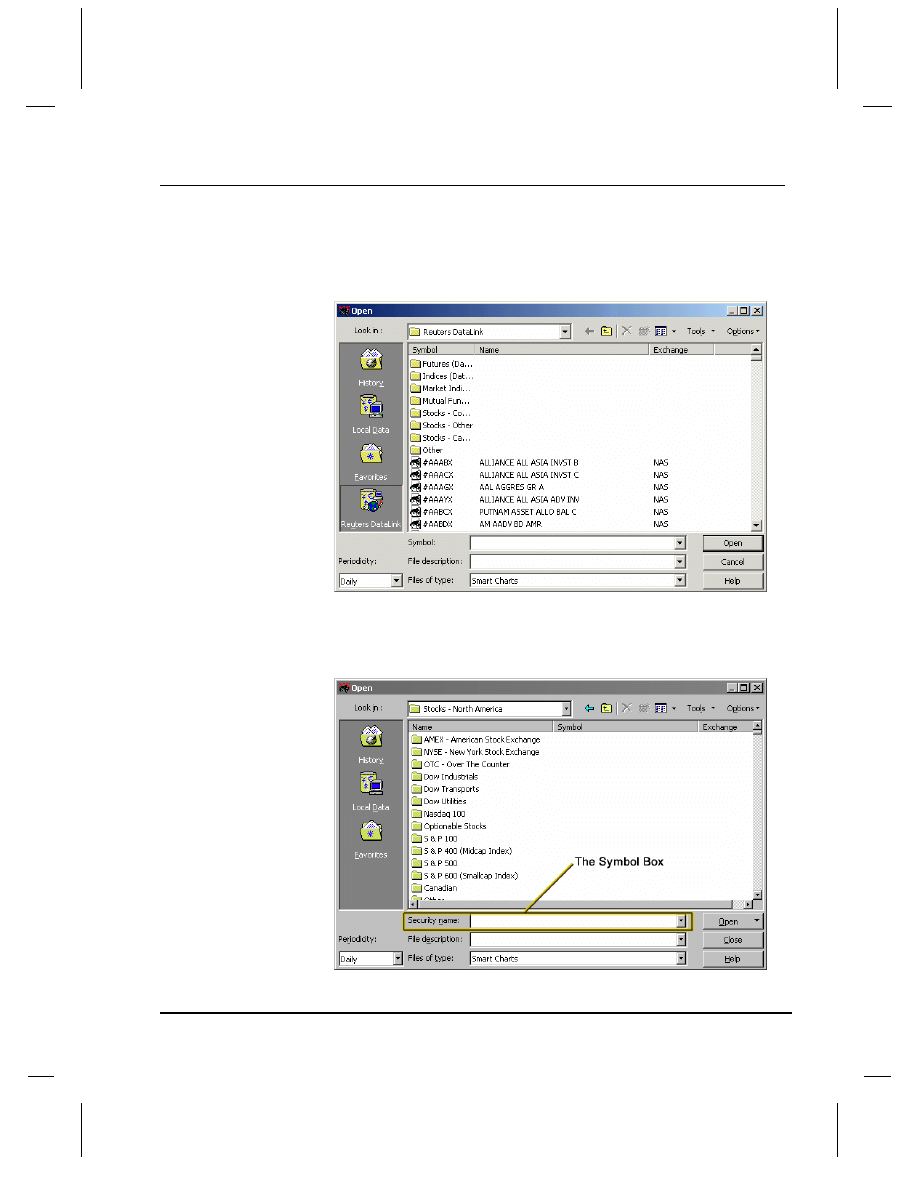
1. In MetaStock, select File>
Open
. The Open dialog appears.
2. In the list at the left of the dialog, click the icon with your data vendor’s name
on it. A list of securities appears, including stocks, indices, and mutual funds.
There are also some folders at the top of the list. Ignore the folders for now.
3. Scroll down to find some common stocks (no symbol before the name) and
click one.
OR
Type a stock’s symbol in the Symbol box.
6
❖ The Basics
Getting Started with MetaStock 10.0
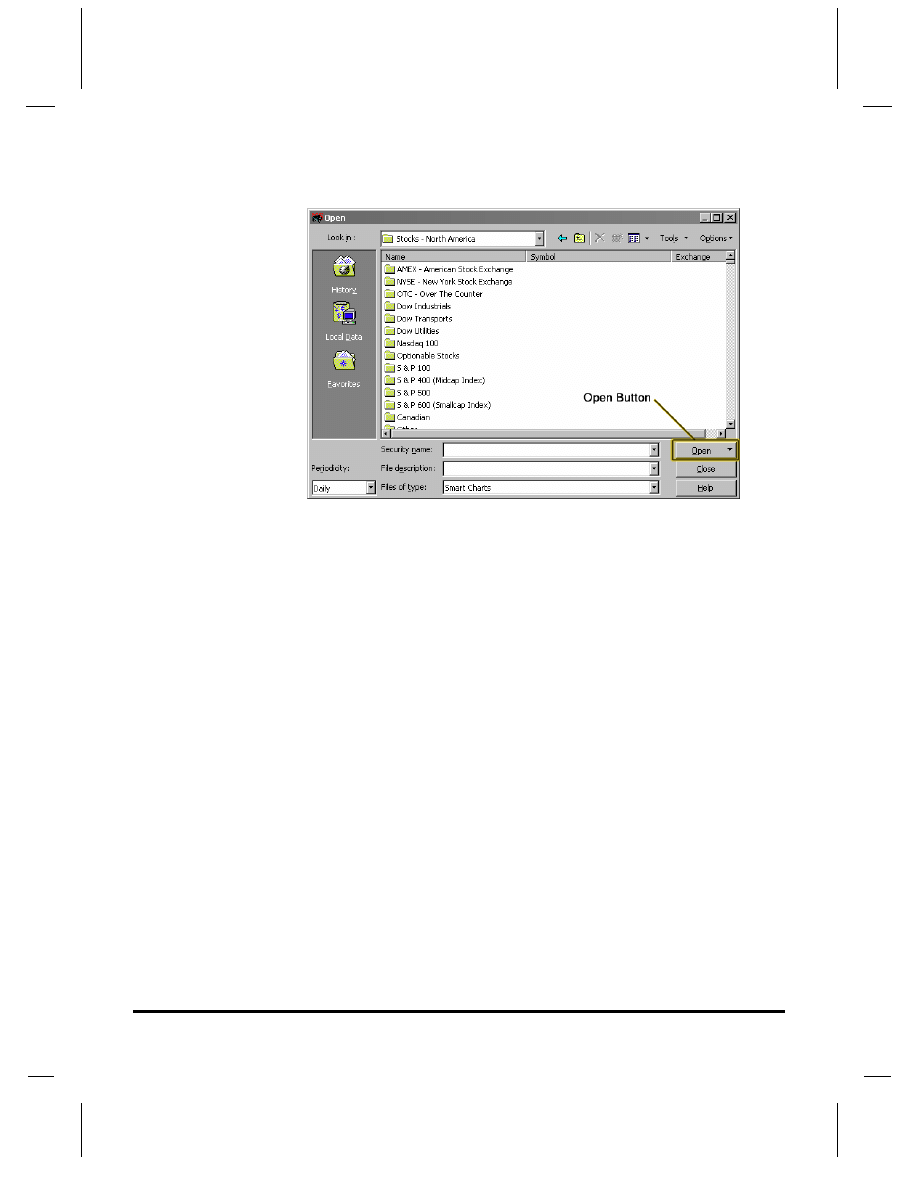
4. Click the Open button.
5. The stock’s chart appears, with the most recent data available to you. That’s
it. Now that we’ve got a chart open, let’s plot an indicator on it, and then draw
a line study on it.
Getting Started with MetaStock 10.0
The Basics
❖ 7
Plot an Indicator
Indicators are explained in more detail in Chapter 6: Indicators and
Line Studies (page 32).
The following procedure explains how to apply an indicator to a chart.
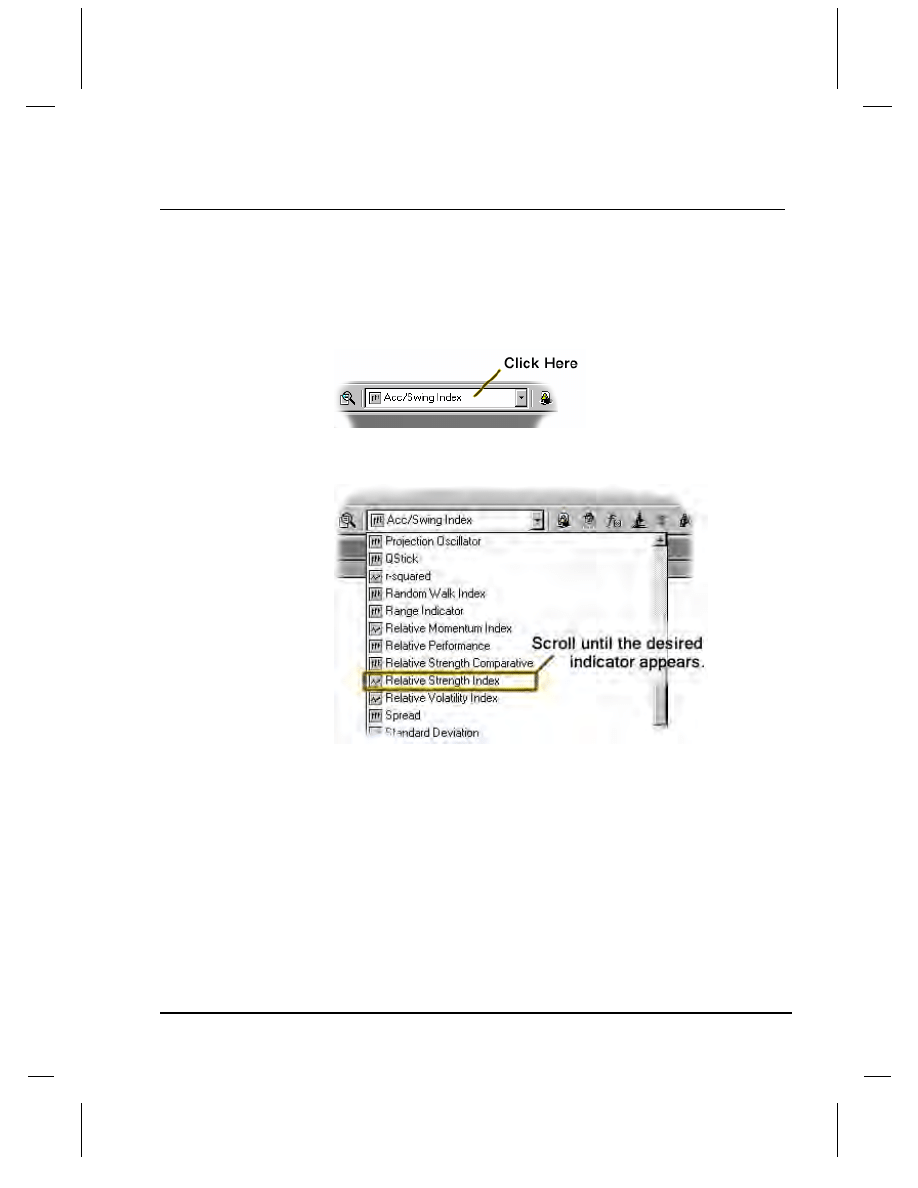
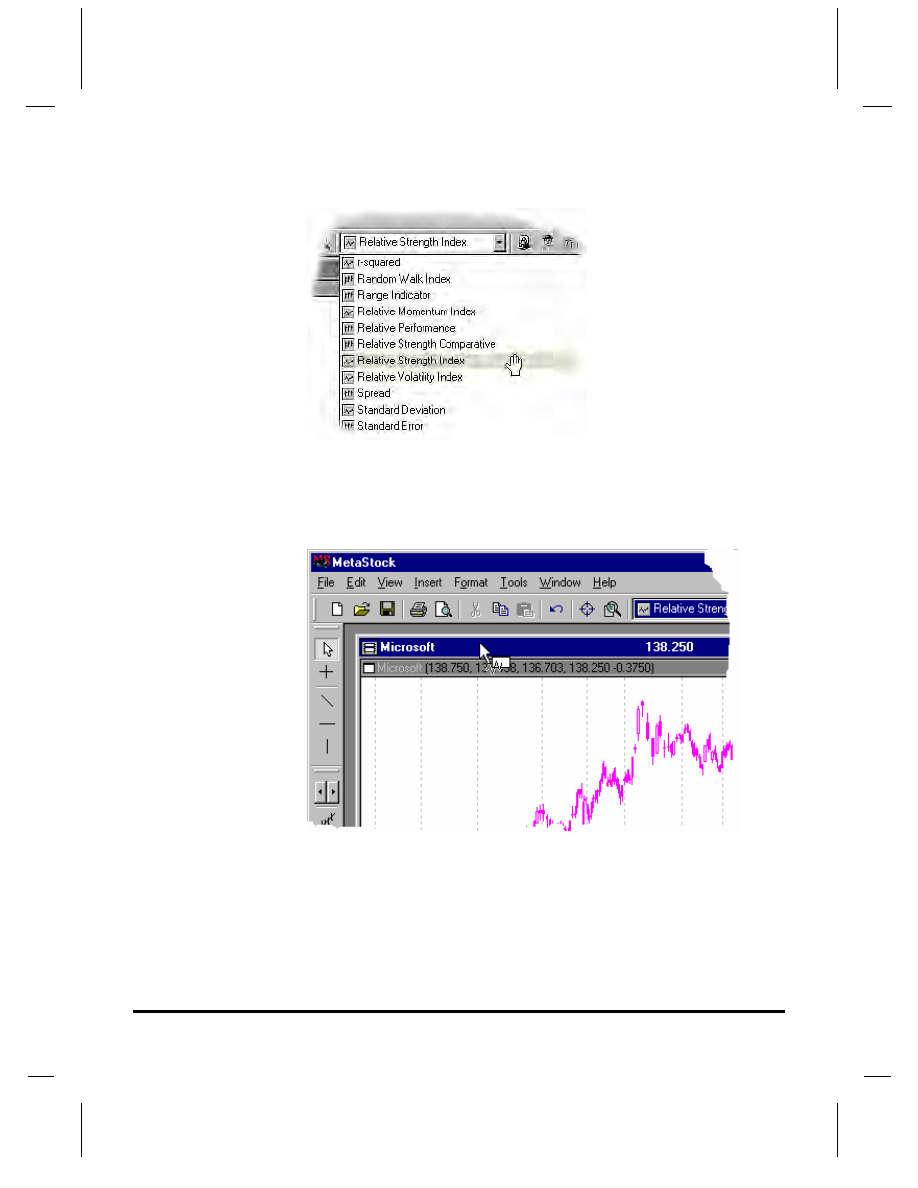
1. With a chart open, click the Indicator QuickList (centered at the top of the
screen).
The list expands to show several indicators.
2. Scroll down until you see the
Relative Strength Index
.
8
❖ The Basics
Getting Started with MetaStock 10.0
3. Hold the cursor over the QuickList; it changes from an arrow to a hand.
4. Now click and hold the left mouse button on the Relative Strength Index.
The hand closes, like it’s holding on to something.
5. While still holding the left mouse button down, move the cursor out of the
QuickList, and position the tip of the cursor over the title bar at the top of the
chart (where the security’s name appears).
Getting Started with MetaStock 10.0
The Basics
❖ 9
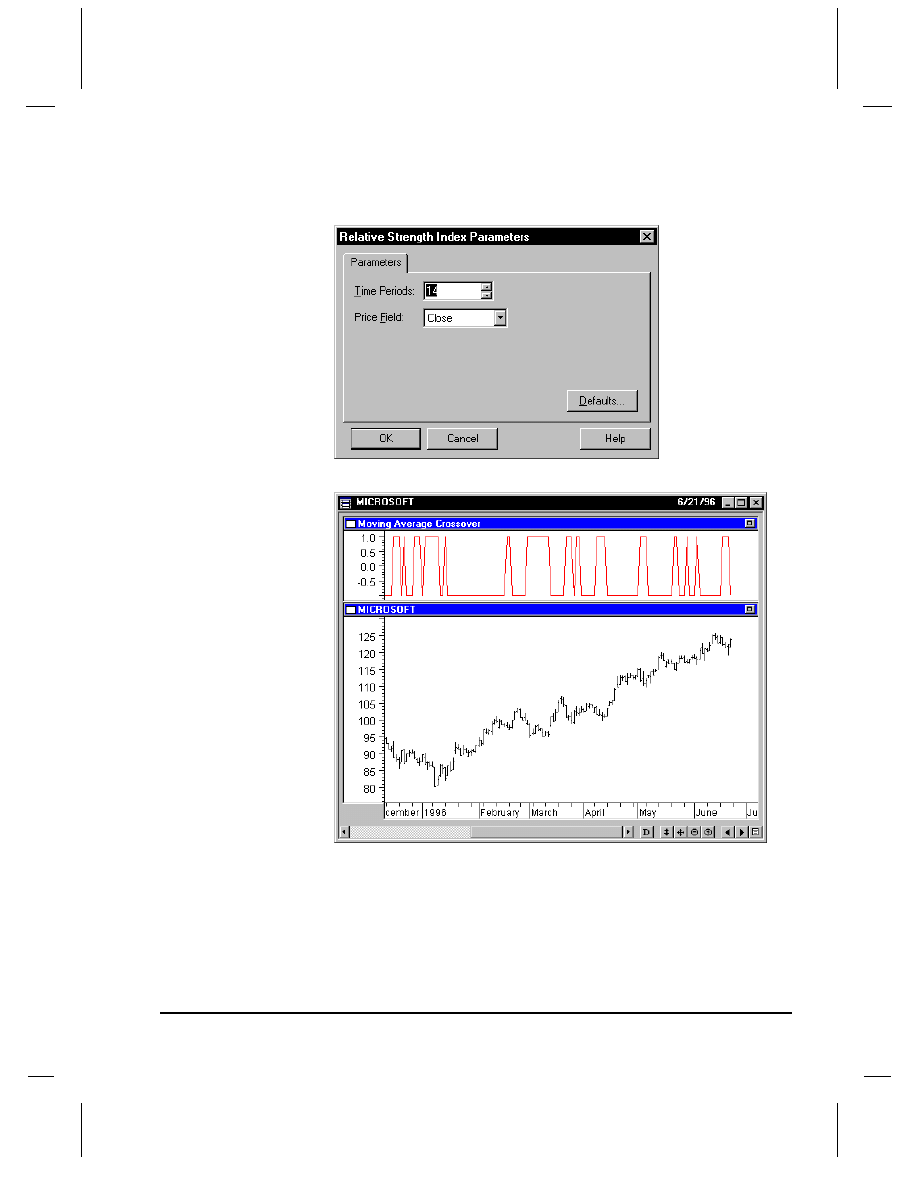
6. Let go of the mouse button. The Relative Strength Index Properties dialog
appears. Click OK.
7. The indicator appears directly above the chart.
Don’t worry about what the indicator means for now.
Indicators are explained in more detail in Chapter 6: Indicators and Line
Studies (page 32).
10
❖ The Basics
Getting Started with MetaStock 10.0
Drawing a Line Study
Lines studies are one of the most popular tools in MetaStock. They help you
see trends and patterns in a chart, which can give you an edge when making
trading decisions.
Line studies are described in detail in Chapter 6: Indicators and
Line Studies (page 32).
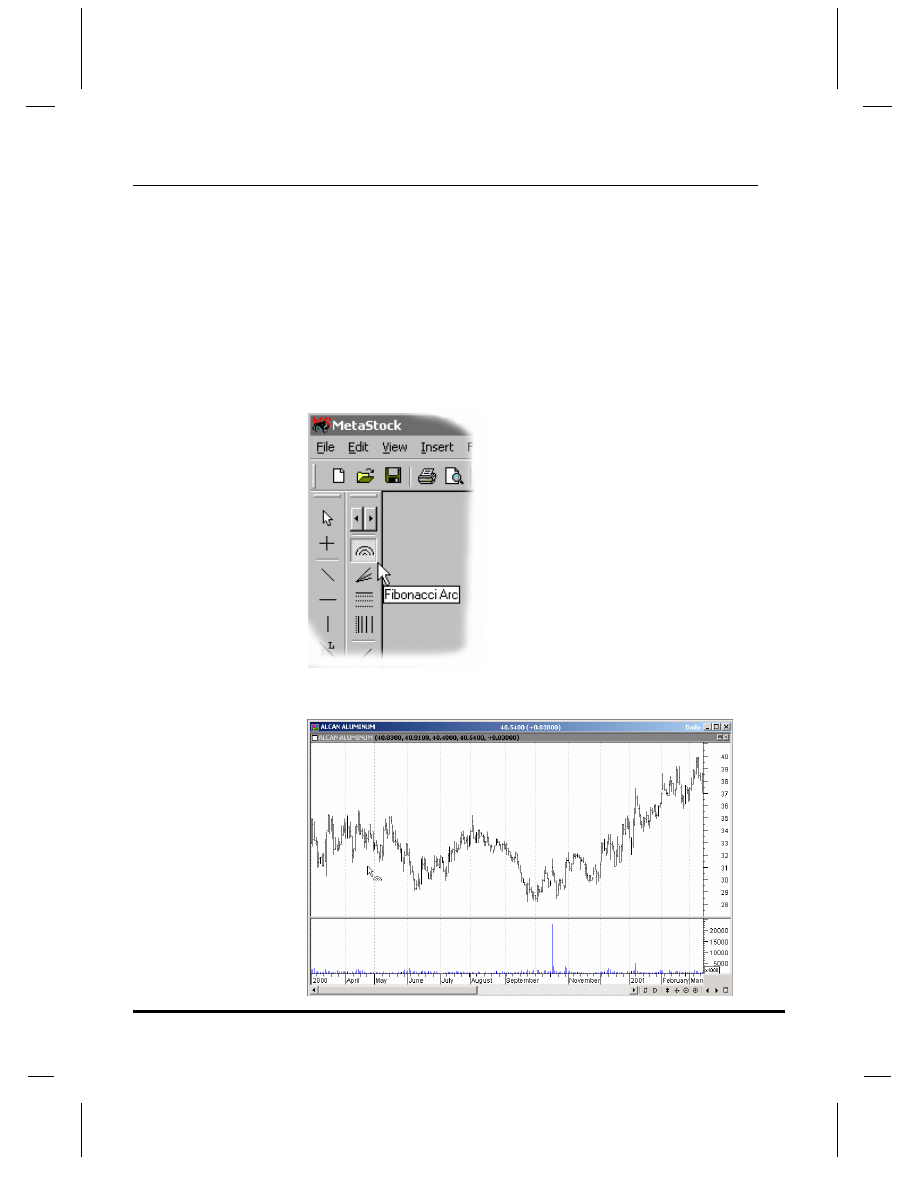
To Draw a Line Study
1. Open a chart (if one isn’t already open).
2. On the left side of your screen you’ll see a vertical row of buttons. Click the
one that looks like a rainbow (the Fibonacci Arc).
3. In the chart, click and hold the left mouse button down anywhere in the left
side of the chart.
Getting Started with MetaStock 10.0
The Basics
❖ 11
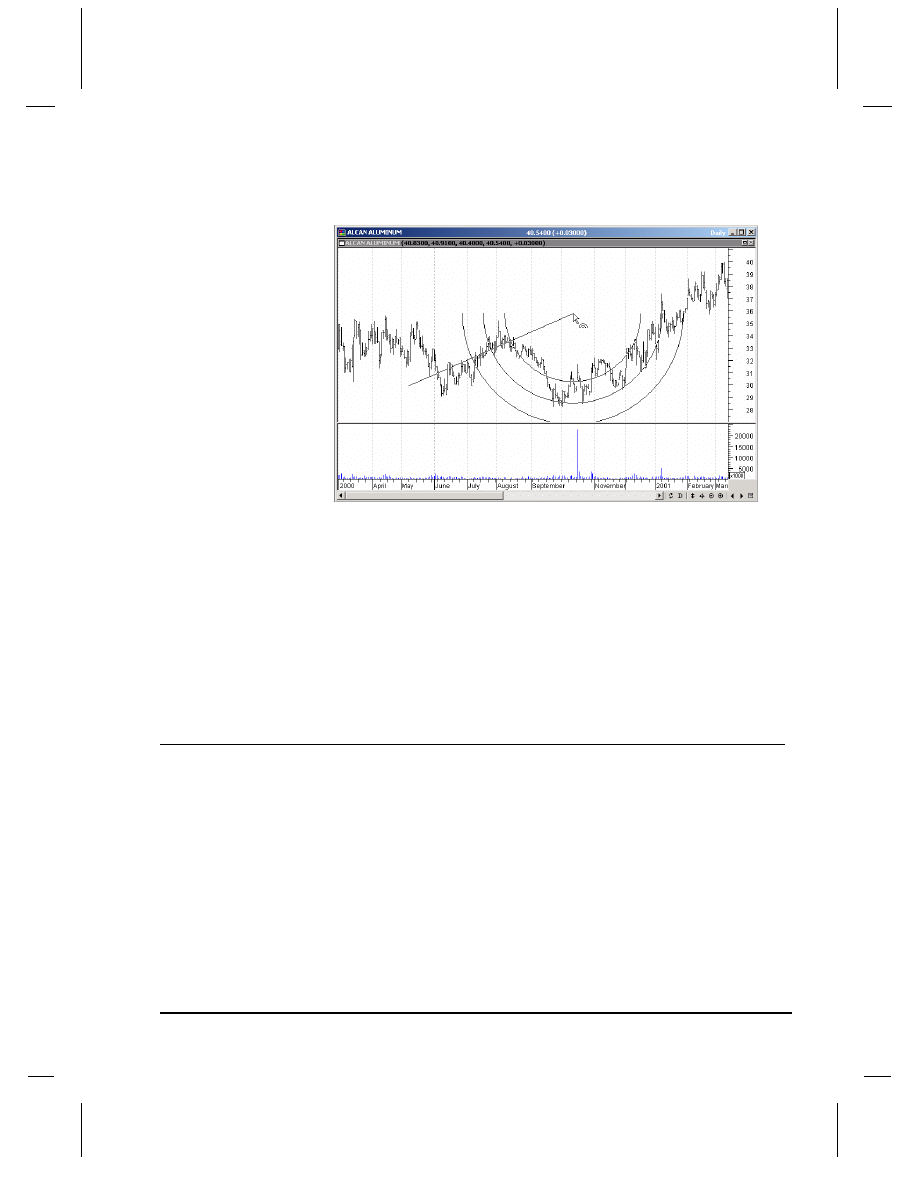
4. While holding the mouse button down, move the cursor to the right. A series
of three arcs appears as you drag the cursor.
5. Release the mouse button; the arcs remain where you drew them.
And that’s how you draw a line study. There are several other line studies you
can use. Line studies in general are described in detail in Chapter 6:
Indicators and Line Studies (page 32).
Deleting Line Studies and Indicators
What if you want to get rid of all the lines you’ve drawn all over your chart?
1. Select
Edit>
Delete All
. The Delete All dialog appears.
2. Click OK in the Delete All dialog and your chart goes back to how it looked
before you added any lines or indicators.
This is Only the Beginning
The tasks described in this chapter are designed to give you some basic skills
to start using MetaStock right away. As you use MetaStock, you’ll learn and
develop new skills through trial and error, experimentation, and referring to
the online help system, the big reference manual, and this getting started
manual.
This manual also describes several other tasks, like exploring hundreds of
securities for good fits with different systems (the Enhanced System Tester,
page 36), and getting advice from the Expert Advisor (page 47).

12
❖ The Basics
Getting Started with MetaStock 10.0
Getting Started with MetaStock 10.0
Security Files
❖ 13
Chapter 3 – Security Files
MetaStock uses two basic building blocks: security files and charts.
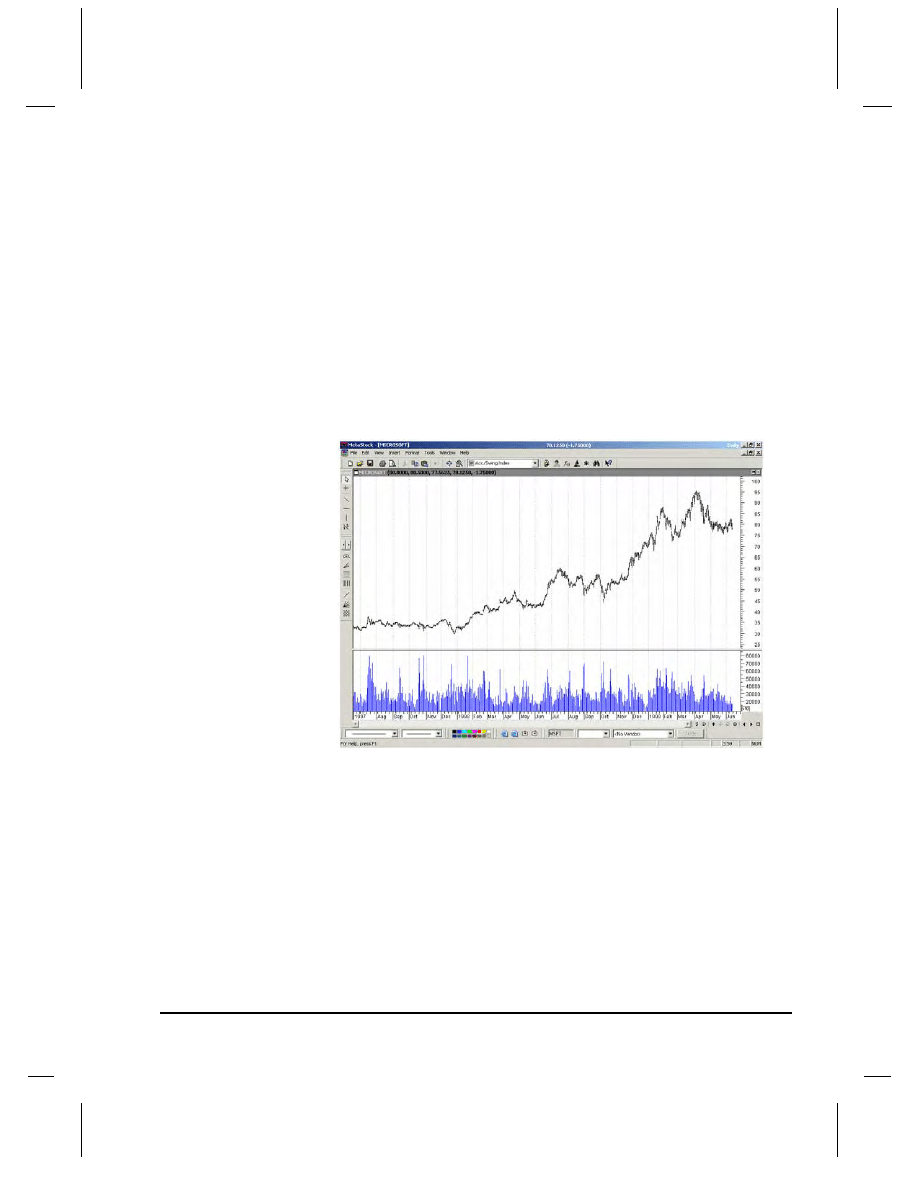
You know what a file is; a Microsoft Word document is a file, the picture you
use for your desktop wallpaper is a file. And a security file is just a file that
contains information about a security. For example, a security file for
Microsoft could contain the high, low, close, and volume information for
MSFT between June 18, 1997 and June 13, 1999.
And you’re probably already familiar with charts. A chart in MetaStock is just
a graph that shows all the information contained in a security file. So the chart
for the Microsoft security file described above would look like this:
Now that you understand what security files and charts are, here are two very
important concepts:
The information you see on a chart comes from a security file.
The information in the security file comes from a data vendor.
The rest of this chapter deals with security files, including how to create them
and where to put them. For more information about charts, refer to Chapter 5
(page 28).
14
❖ Security Files
Getting Started with MetaStock 10.0
Why Use Security Files?
In chapter 2, you learned how to open a chart online, via your data vendor.
But there’s another way to open a chart. You can:
1. Create a new security file.
2. Download data into the security file.
3. Open the security file to display it as a chart.
So why would anybody go through the trouble of creating a security and then
downloading information into it, when they can just open the chart online?
Well, one way MetaStock really shows its strength is by analyzing hundreds
of securities, looking for patterns and applying tests and systems in a matter of
seconds. Alternatively, you could analyze all the charts you have open at a
given moment, but that limits you to a relatively small number of securities.
The best way to analyze hundreds of securities is to create security files for
each of them, and then to analyze them without opening their charts.
Fortunately you can easily create security files for hundreds of securities
simultaneously.
Create a New Security File
The process of creating a new security file is divided into two parts:
Creating the file (naming it, deciding where to save it, what its first date
is)
Downloading data into the file (connecting to a data vendor)
1. Once you’ve opened MetaStock, select
Tools>
The DownLoader
. This opens
The DownLoader, which is a separate program (included with MetaStock and
described in Chapter 4 of this manual) that is very useful for creating security
files.
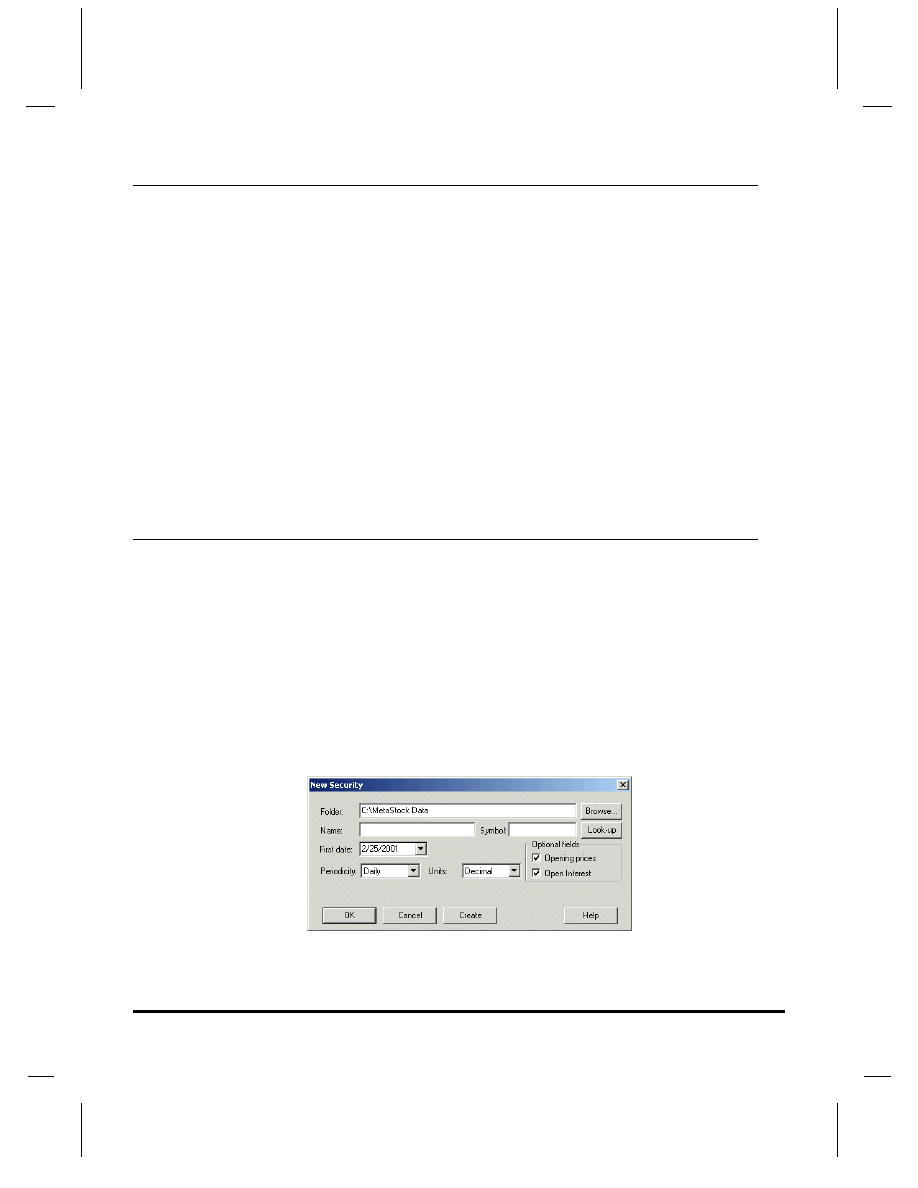
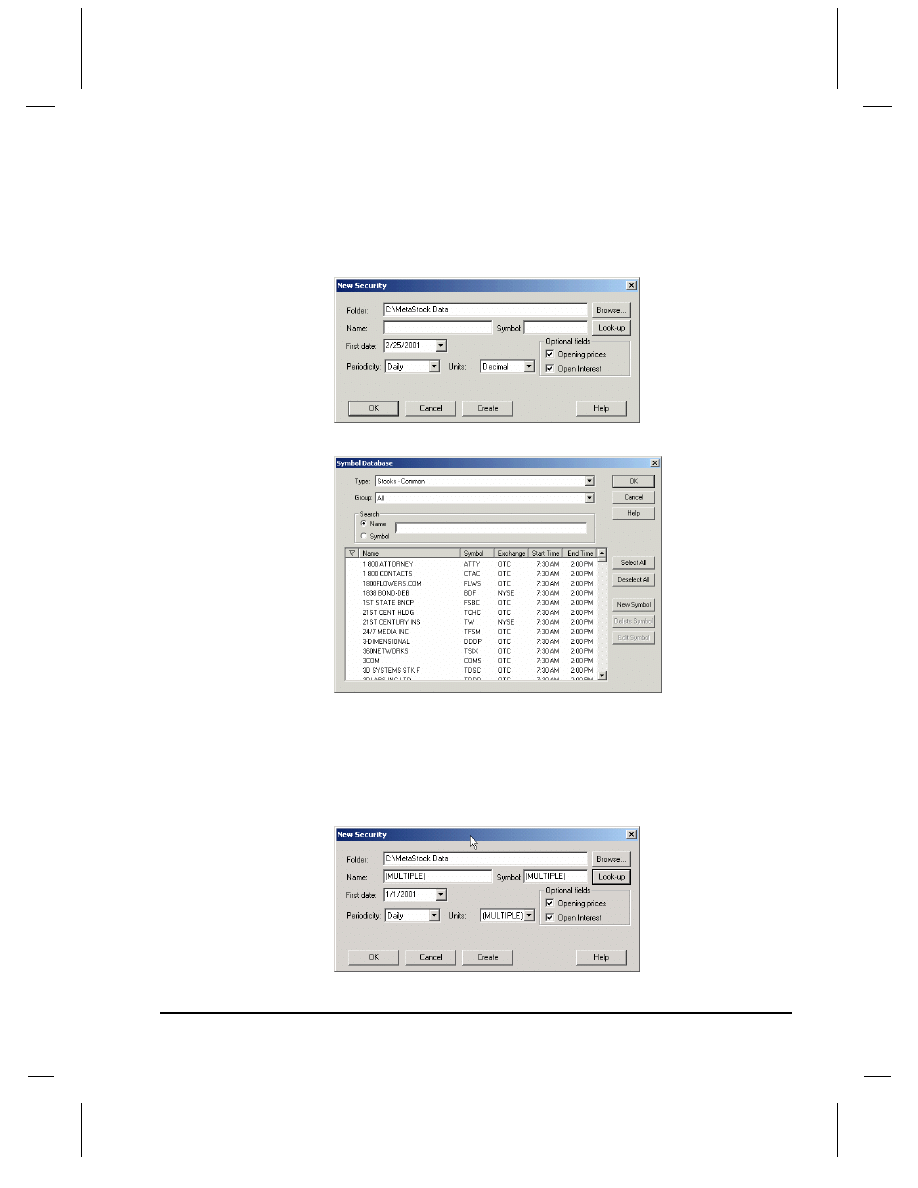
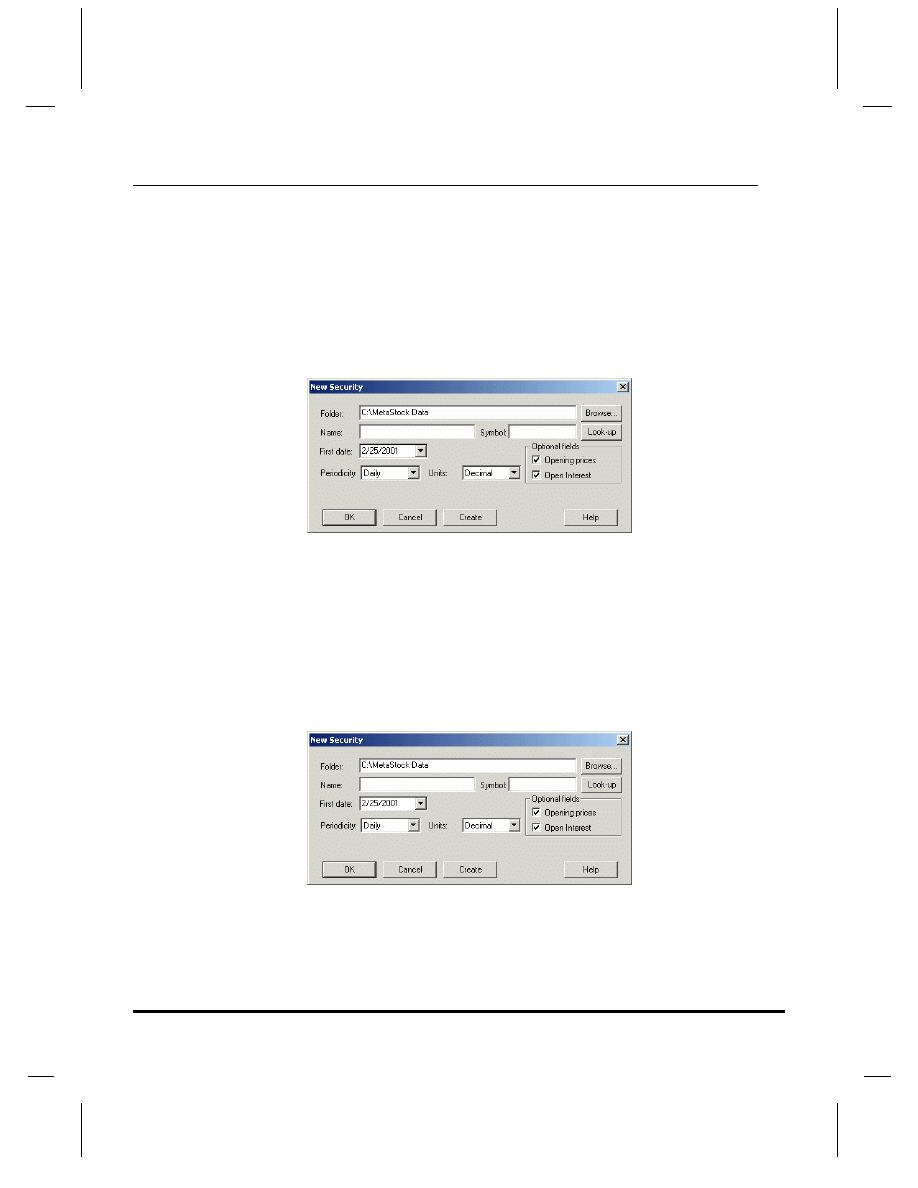
2. In The DownLoader, select
File>
New>
Security
. The New Security dialog
appears.
Getting Started with MetaStock 10.0
Security Files
❖ 15
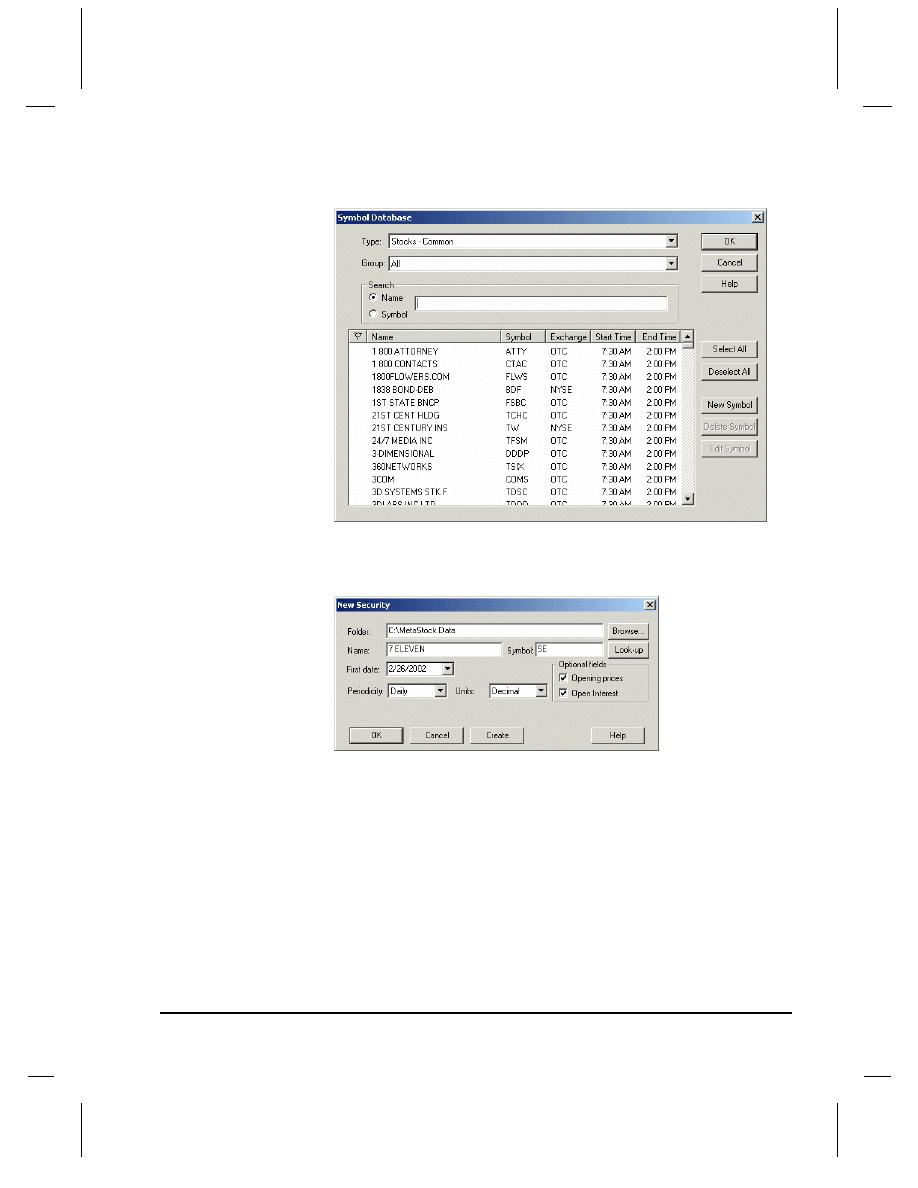
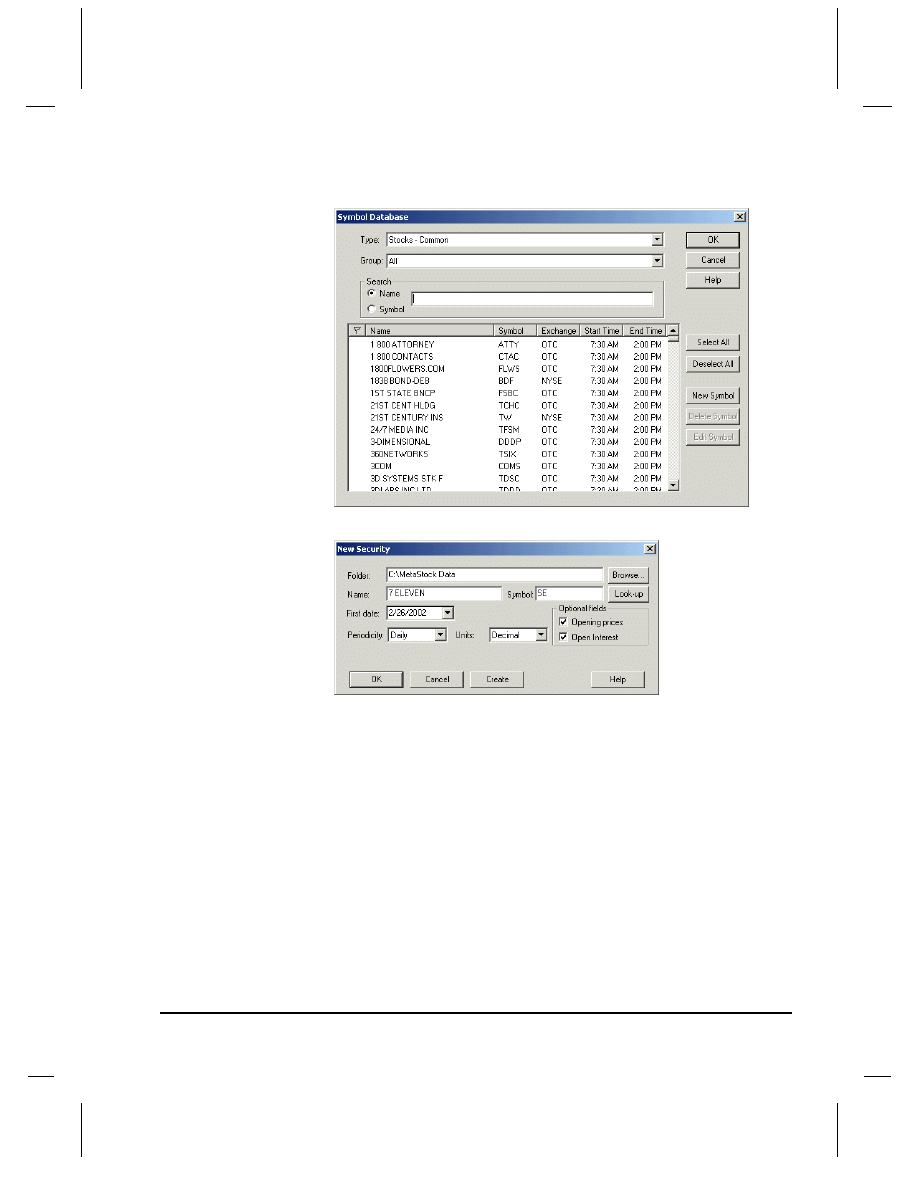
3. Click the Look-up button. The Symbol Database dialog appears.
4. Scroll through the list of securities until you see
7 Eleven
in the
Name
column.
5. Double-click the
7 Eleven
entry to return to the New Security dialog.
6. In the
First date
box, change the date to one year prior to today.
7. Click OK. You just created an empty security file. You can now download
data into the security file (explained on page 23), or read on in this chapter to
learn how to create many security files at once.
16
❖ Security Files
Getting Started with MetaStock 10.0
Create Multiple Security Files
What if you want to create more than one security file? There are a couple of
options.
Create a Few Security Files One by One
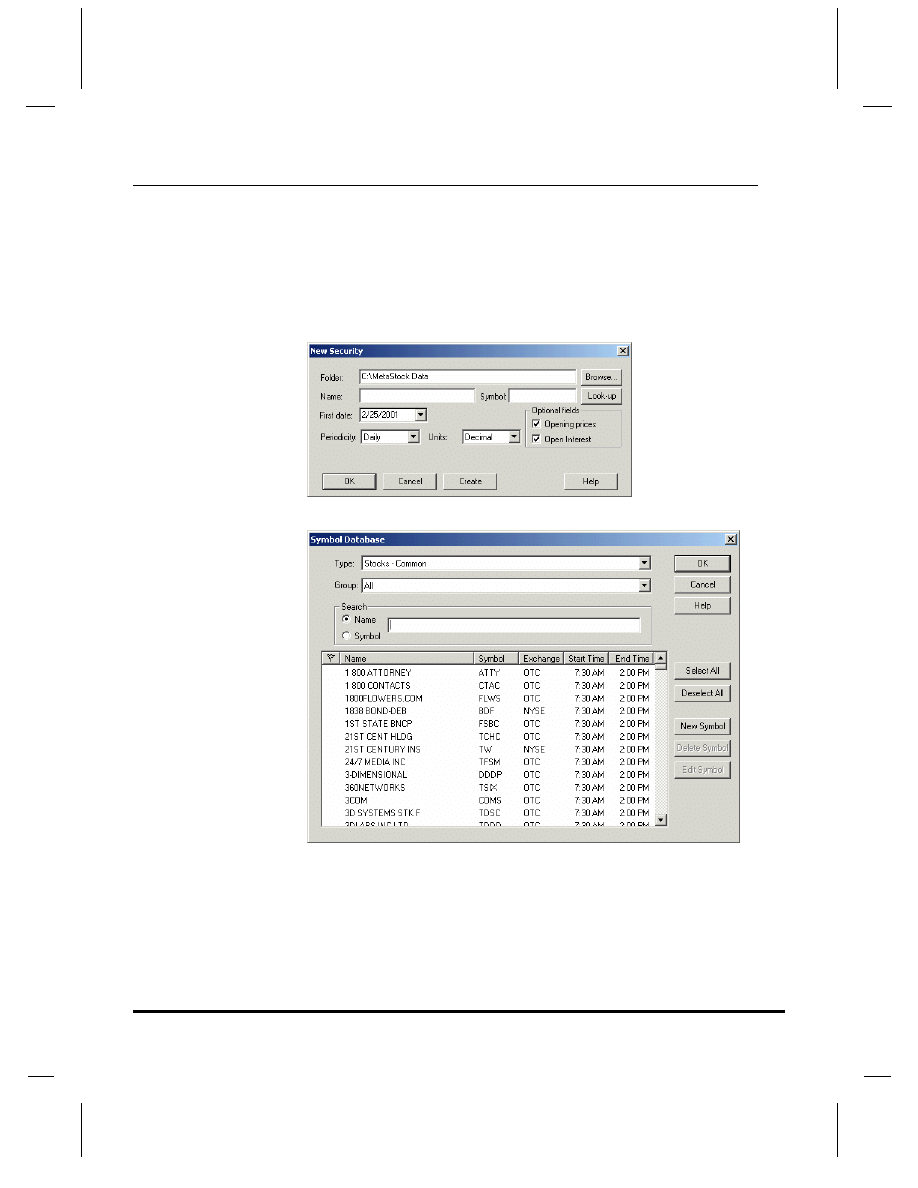
1. In The DownLoader, select
File>
New>
Security
. The New Security dialog
appears.
2. Click the Look-up button. The Symbol Database dialog appears.
3. Double-click on the security you want to create a security file for. You return
to the New Security dialog, with your security’s name and symbol entered.
4. Click Create. A message window appears (very briefly) and disappears. The
New Security dialog now appears with the
Name
and
Symbol
boxes empty.
Your new security file now exists, and you can repeat steps 1 through 4 for as
many new security files as you like.
Getting Started with MetaStock 10.0
Security Files
❖ 17
Create Many Security Files At the Same Time
If you want to create dozens or hundreds of new security files, here’s how:
1. In The DownLoader, select
File>
New>
Security
to open the New Security
dialog.
2. Click the Look-up button. The Symbol Database dialog appears.
3. Click the security at the top of the list, and scroll down to the first security that
begins with the letter “A”.
4. Hold down the
S
HIFT
key and click the first security that begins with the letter
“A”. Several securities are selected.
5. Click OK. The New Security dialog appears, with the word “
MULTIPLE
” in
the
Name
and
Symbol
boxes.
6. Click OK. The security files are created.
18
❖ Security Files
Getting Started with MetaStock 10.0
Save Security Files in Different Folders
So far, every security file we’ve created has been placed in a folder called
“MetaStock Data” located on your C: drive (or wherever you installed
MetaStock). But you can place security files in any folder that exists on your
computer, or you can create a new folder and place the security files there.
Place Security Files in an Existing Folder
1. In The DownLoader, select
File>
New>
Security
to open the New Security
dialog.
2. Click the Browse button. The Browse for Folder dialog appears.
3. Select the desired folder and click OK. The New Security dialog now contains
the existing folder’s information in the
Folder
box.
4. You can now enter the security’s name and symbol (or select one or more
securities with the Symbol Database dialog) and click OK.
Create a New Folder
1. In The DownLoader, select
File
>
New
>
Security
to open the New Security
dialog.
Getting Started with MetaStock 10.0
Security Files
❖ 19
2. Click the Look-up button. The Symbol Database dialog appears.
3. Double-click a security in the list. You return to the New Security dialog.
4. In the
Folder
box, click to the right of “
C:\MetaStock Data
”.
A cursor appears next to the word “
Data
”.
5. Type \new folder. (Don’t forget the backslash.)
6. Click OK. A dialog appears asking if you want to create the new folder.
7. Click Yes. The security file is placed in the folder you just created.

20
❖ Security Files
Getting Started with MetaStock 10.0
Getting Started with MetaStock 10.0
The DownLoader
❖ 21
Chapter 4 – The DownLoader
Your Data Vendor User ID and Password
If you didn’t enter your User ID and Password when you installed MetaStock,
this procedure shows you how to enter them now.
To Enter Your Data Vendor User ID and Password
1. In MetaStock, select
Tools> Options
. The Application Properties dialog
appears.
OR
If you’re running MetaStock Professional, select
Tools>
The DownLoader
,
then in the DownLoader, select
Tools>
Vendor Options…
.
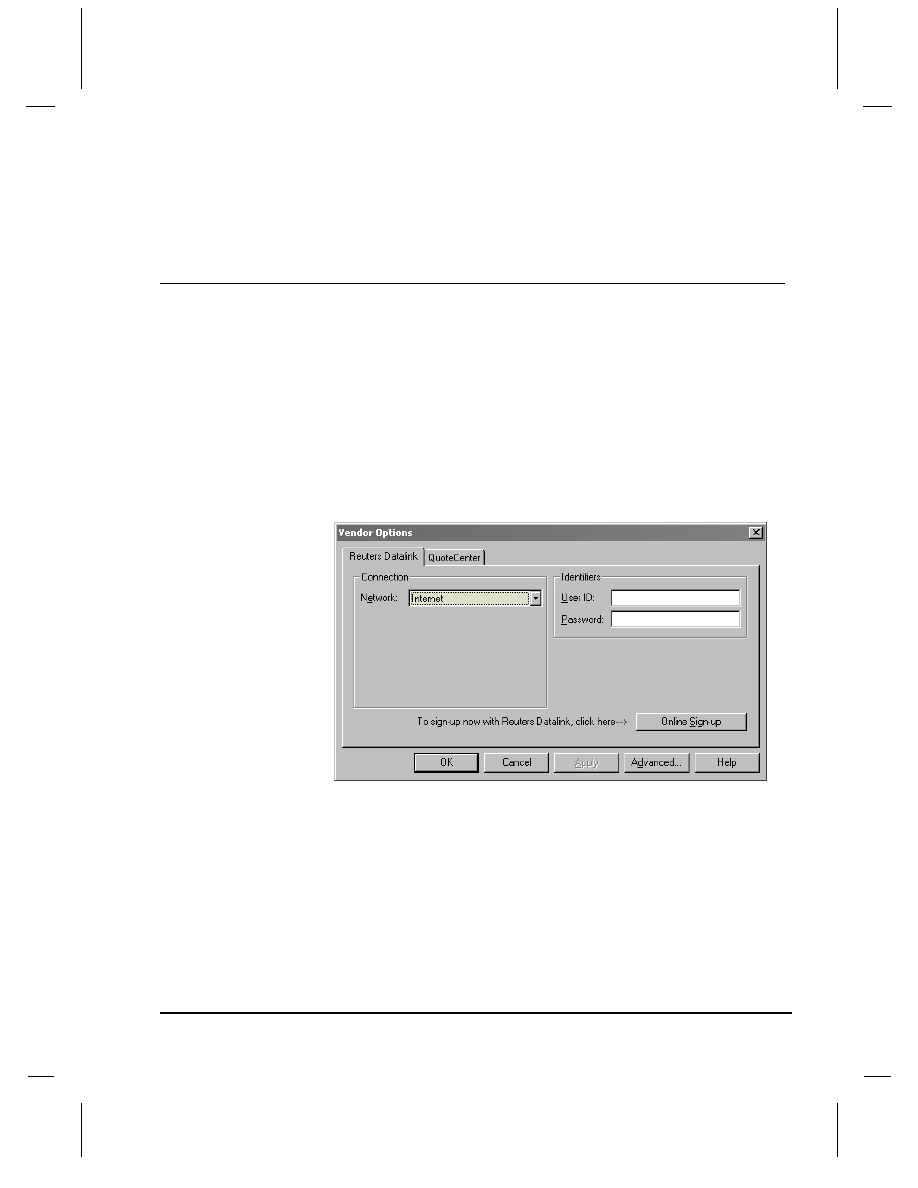
2. Click the tab that has your data vendor’s name on it. You’ll see a dialog
similar to the one below.
3. Enter your User ID and Password in the
User ID
and
Password
boxes.
4. Click OK.
22
❖ The DownLoader
Getting Started with MetaStock 10.0
Download Data Into a Security File
In order to fill a security file with the most recent information, you must
download that data. This is done using The DownLoader. This is a separate
program included with MetaStock for the specific purpose of downloading
security file data.
To open The DownLoader, you can use the Windows Start button
(Start>
Program Files> Equis International> The DownLoader
), or you can
open it from inside MetaStock by selecting
Tools
>
The DownLoader
or
clicking on The DownLoader icon in the toolbar.
To Download Data
1. Make sure you’re connected to the Internet.
2. In MetaStock, select
Tools
>
The DownLoader
. The DownLoader opens.
(The DownLoader is a separate program that you can launch from inside
MetaStock.)
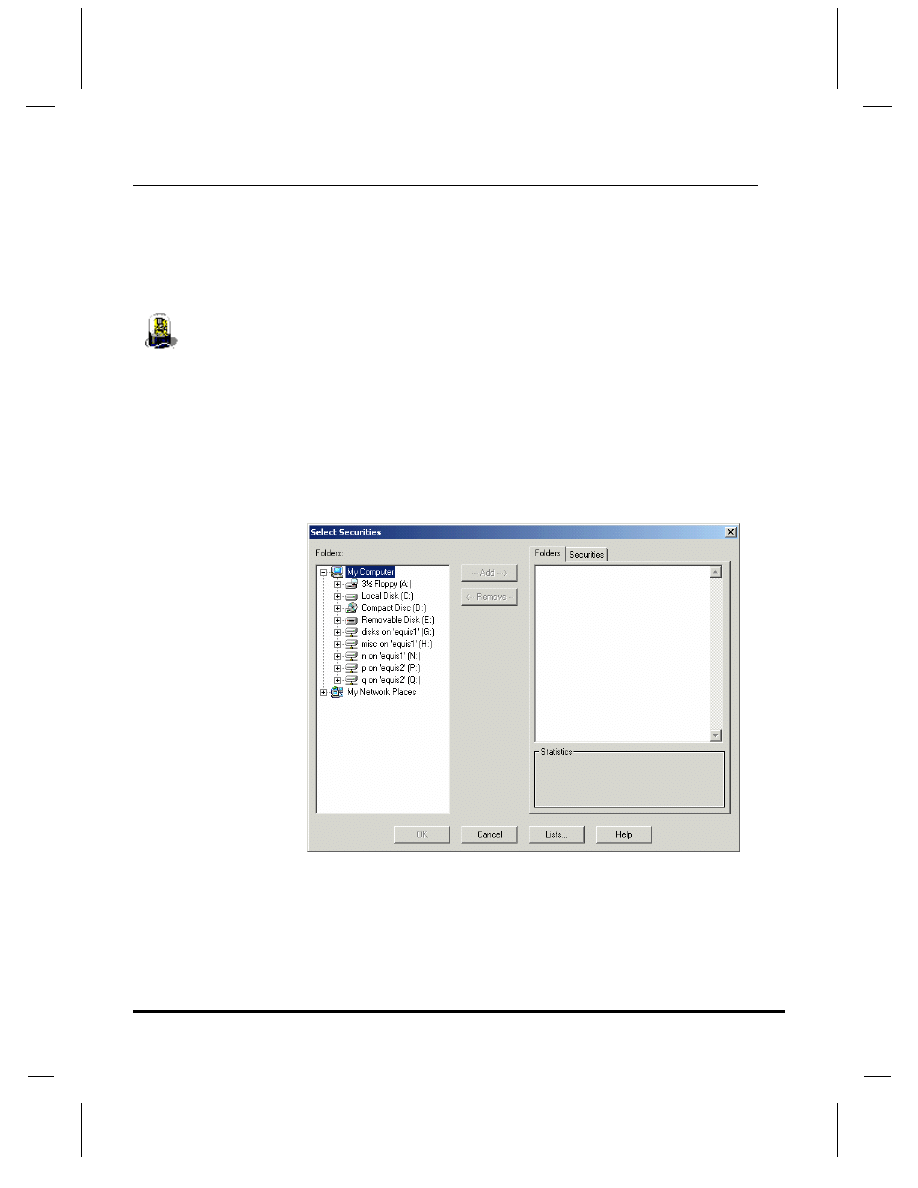
3. In The DownLoader, select
Tools
>
Download Prices
. The Select Securities
dialog appears.
4. In the
Folders
window (the left window of the dialog), click on the plus sign
next to
Local Disk (C:)
. The C: drive expands to reveal several folders.
DownLoader icon
Getting Started with MetaStock 10.0
The DownLoader
❖ 23
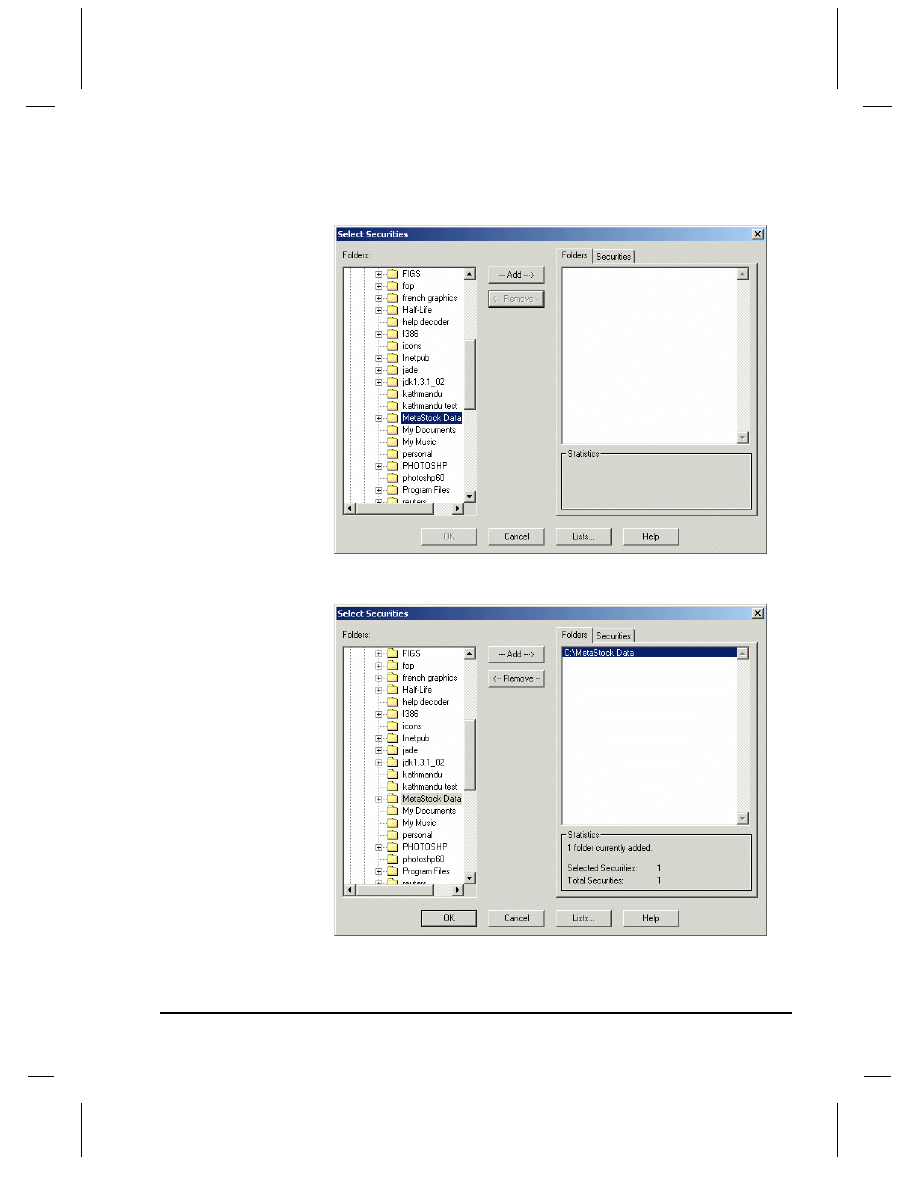
5. Scroll down (if necessary) until you see the folder named “
MetaStock Data
”,
and click it.
6. Click the Add button (at the top center of the dialog). The MetaStock Data
folder appears in the right window of the dialog.
24
❖ The DownLoader
Getting Started with MetaStock 10.0
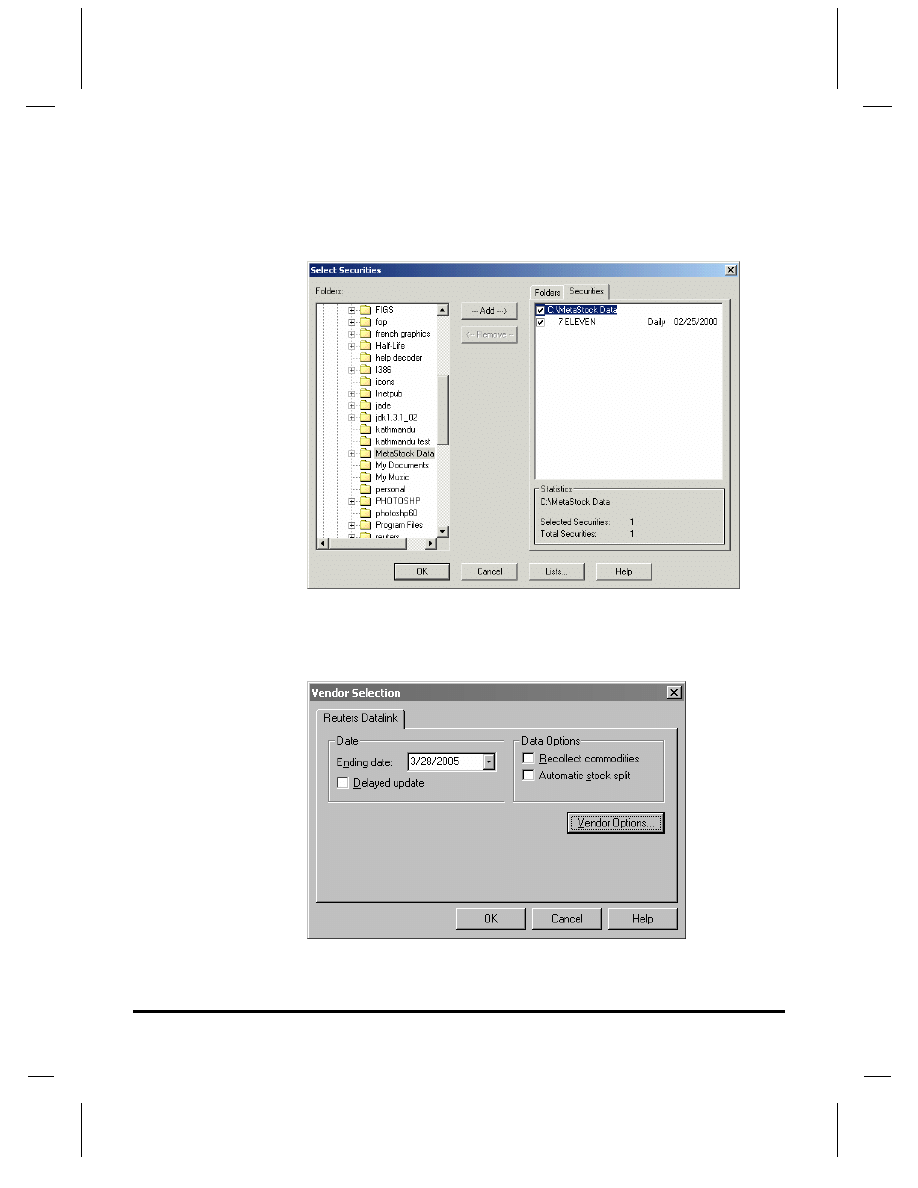
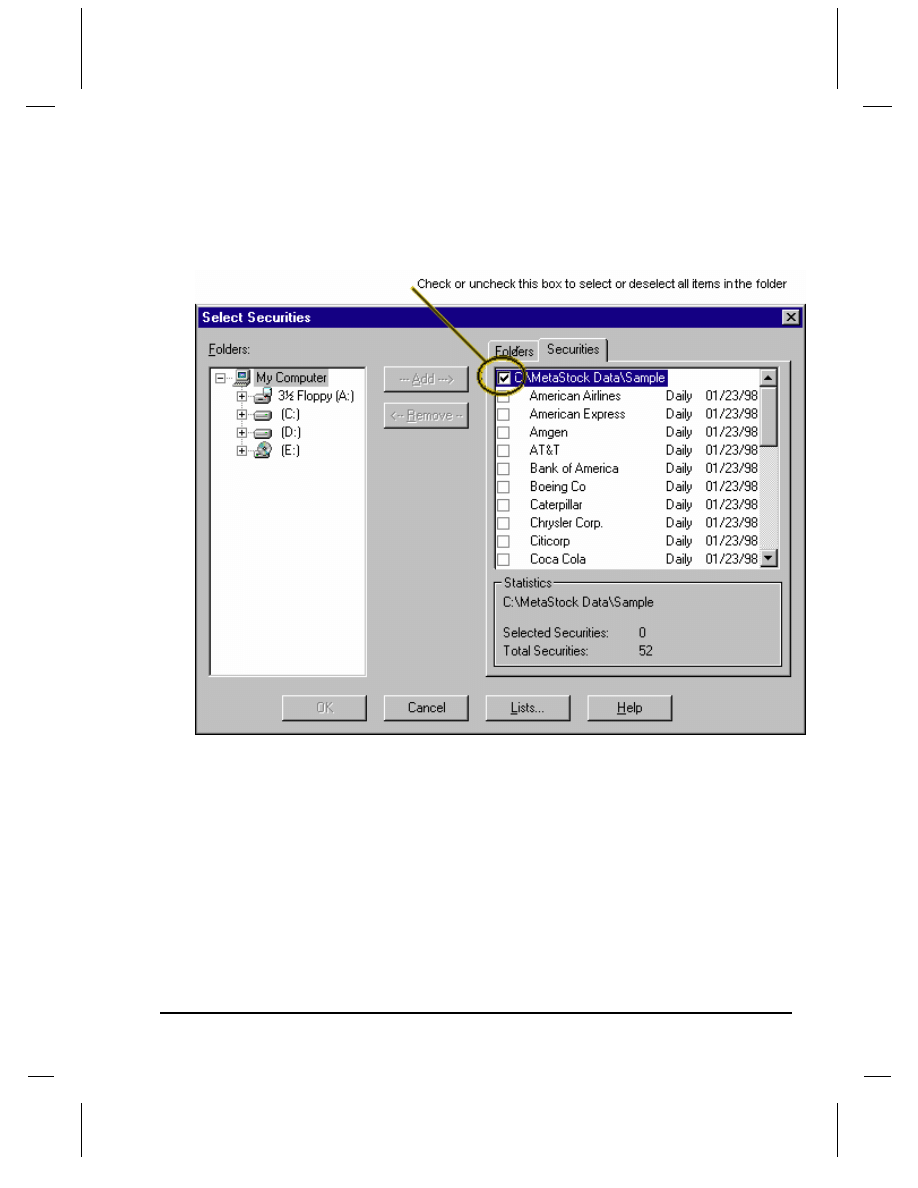
7. Click the
Securities
tab. Now you can see the securities contained in the
MetaStock Data folder. In this case (if you completed the “Create a New
Security” procedure starting on page 15), the only security in the folder is
7 Eleven
.
8. Click OK. The Vendor Selection dialog appears.
9. Click the tab with your data vendor’s name on it. For this example, click
Reuters DataLink
. Notice that today’s date appears in the Ending date box.
That’s the last date for which we’ll collect data.
Getting Started with MetaStock 10.0
The DownLoader
❖ 25
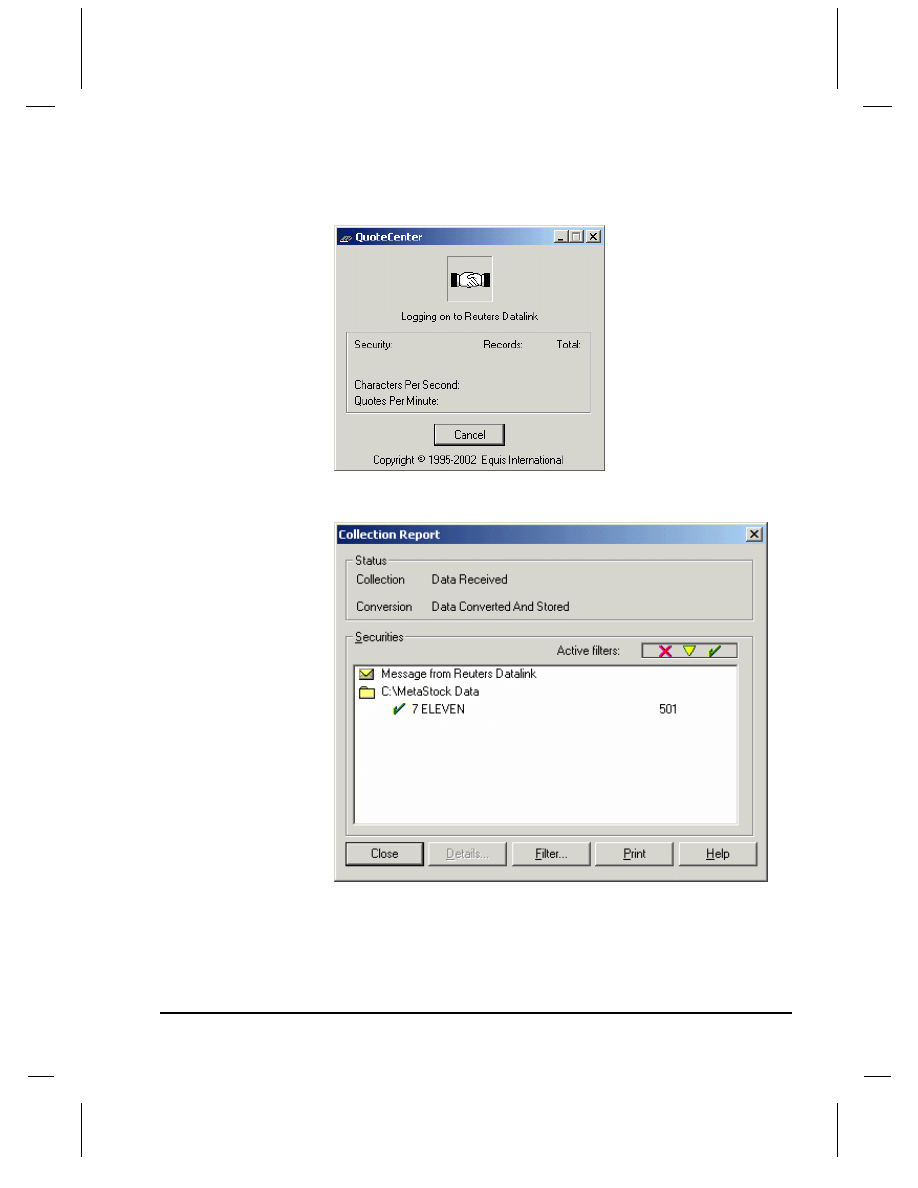
10. Click OK. The QuoteCenter message box appears, showing you the status of
the download as it progresses.
11. When the download is complete, the message box disappears and the
Collection Report dialog appears. Click Close.
12. In the DownLoader, select
File> Exit
.

26
❖ The DownLoader
Getting Started with MetaStock 10.0
Getting Started with MetaStock 10.0
Charts
❖ 27
Chapter 5 – Charts
Charts are the most integral and visible components of MetaStock. And
MetaStock’s charts come equipped with many useful tools. Indicators and
Line Studies are two of the most popular tools people use with charts, and
they have their own chapter (on page 32). This chapter covers some of the
other things you can do.
Working With Charts
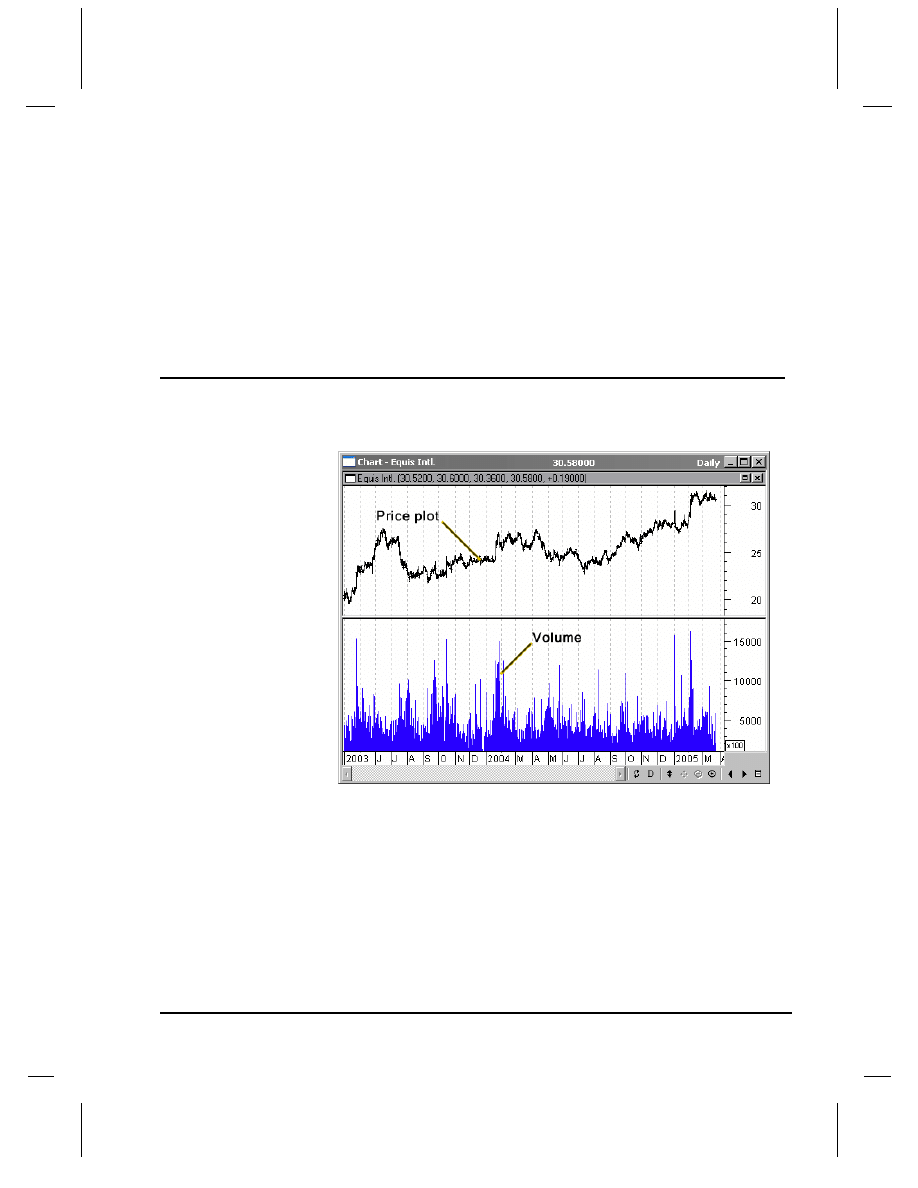
By default, charts are divided into two main parts. The bigger part shows the
security’s price plot, and the smaller part shows the volume.
28
❖ Charts
Getting Started with MetaStock 10.0
Change the Price Plot Style
The price plot is the line formed on the chart by the security’s price
information. You can change many aspects of the price plot’s appearance,
including style (line, bar, candlestick, etc.), color, and line thickness.
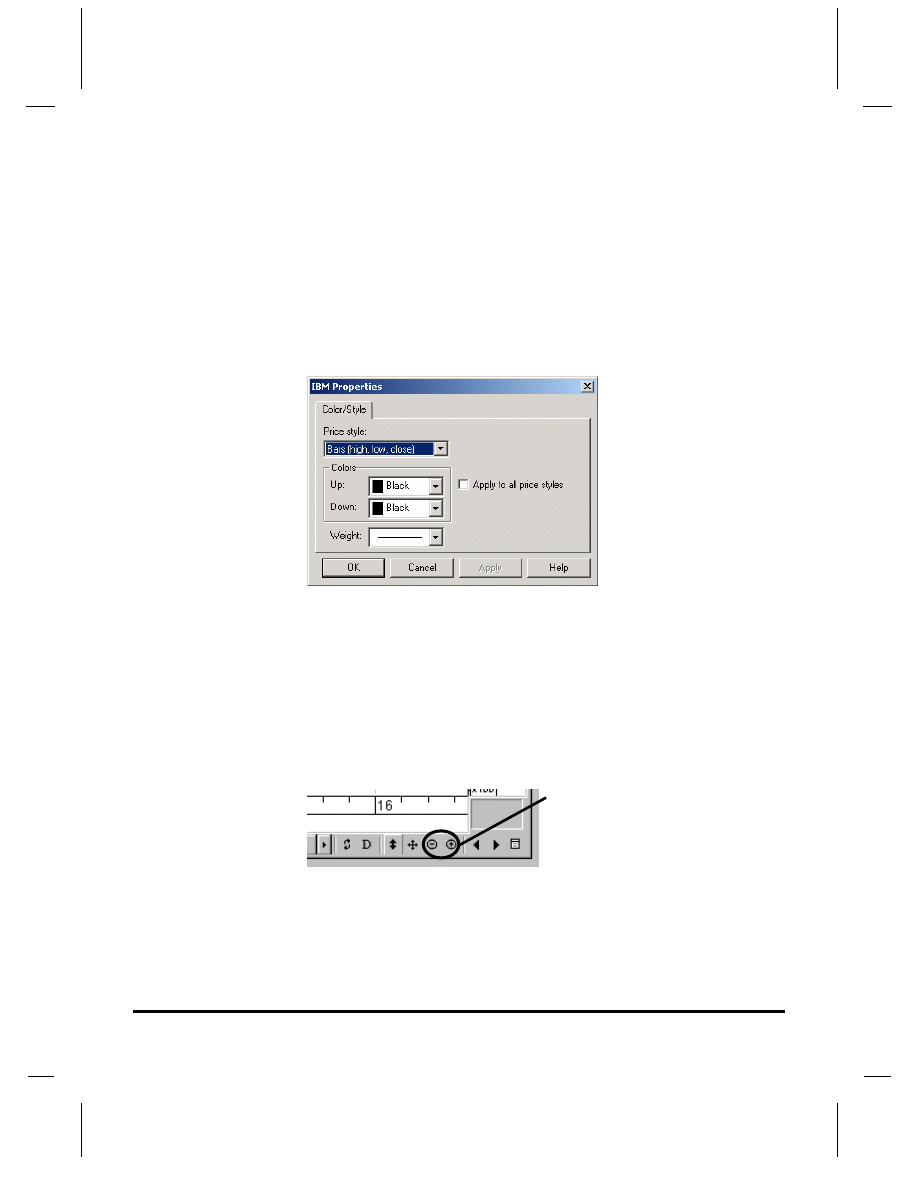
To Change the Price Plot Style
1. With a chart open in MetaStock, select
Format> Prices
.
OR
Right-click on the price plot and select “
<security name> Properties
”.
The security’s Properties dialog appears.
2. Change the
Price style
,
Colors
, or line
Weight
settings to the values you want,
and click OK.
Zooming In and Out on a Chart
Sometimes you want to see a small section of a chart up close. There are
several ways to zoom in.
Using the Zoom in and Zoom out buttons
Clicking the Zoom in and Zoom out buttons in the lower right corner of the
chart zooms the entire chart.
Alternatively, you can hold down the
C
TRL
key on your keyboard and roll
your mouse wheel up or down.
Zoom in/Zoom Out Buttons
Getting Started with MetaStock 10.0
Charts
❖ 29
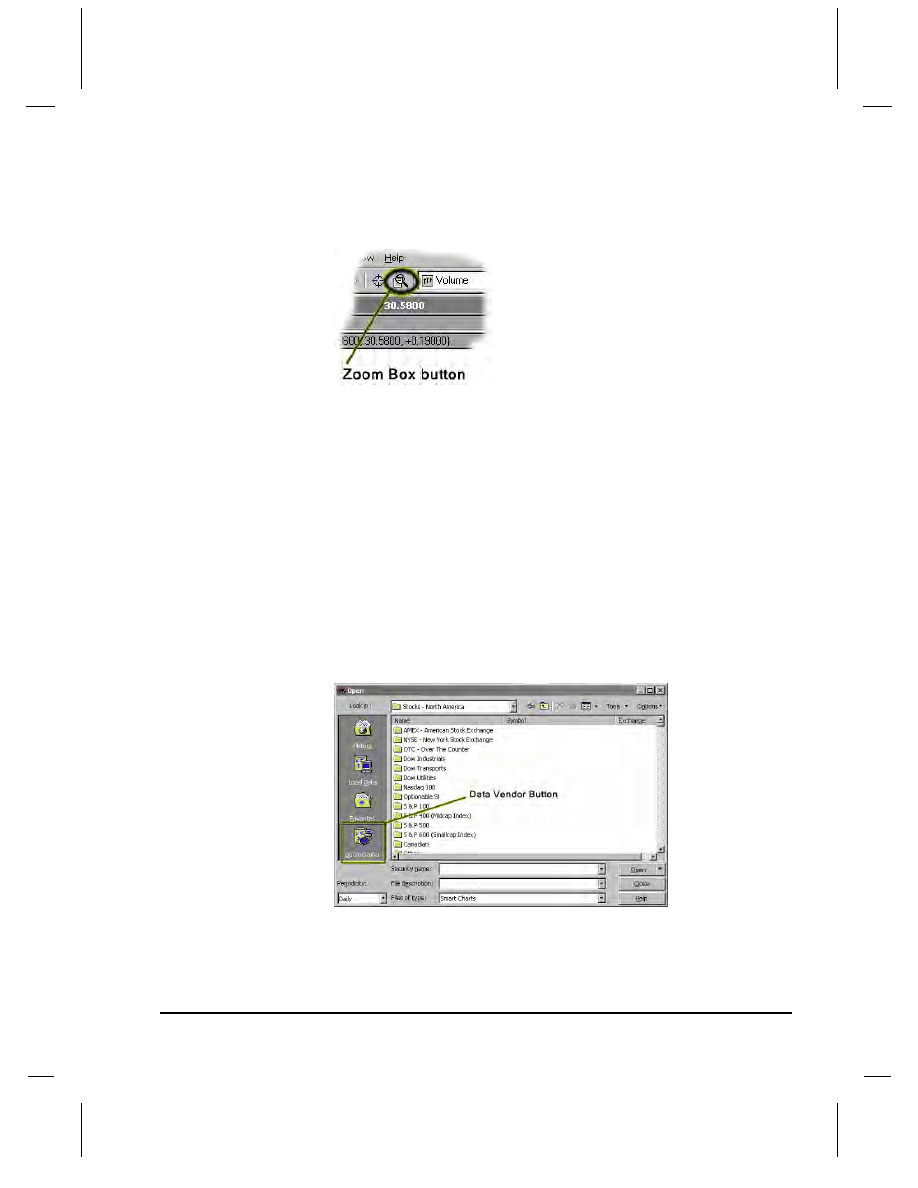
Using the Zoom Box button
To zoom in on a particular section of the chart, click the Zoom Box button,
then click and drag a rectangle around the area you want to zoom in on.
Change the Beginning or End Date
Suppose you’re looking at a chart, and you want to see data from a date before
the earliest date on the chart. The easiest way to do this is to right-click on the
X-axis (the line of dates/times at the bottom of the chart), select X-axis
properties, and then enter the desired dates.
Alternatively, you can close the chart, then reopen it. You can give it a new
start date in the Open dialog. Anything you’ve added to the chart (line studies,
for example) will still be there when you re-open it.
To Change the Chart dates
1. Close the chart you’re working in.
2. Click Select
File> Open
. The Open dialog appears. Make sure your data
vendor button is pressed (on the left side of the dialog, below the Favorites
button).
Notice the box in the lower left corner of the Open dialog, the box named
Periodicity
. This box determines what each bar represents in a chart’s price plot.
For example, if the periodicity is set to
Daily
, each bar (or candlestick, or
line segment, etc.) represents one day.
30
❖ Charts
Getting Started with MetaStock 10.0
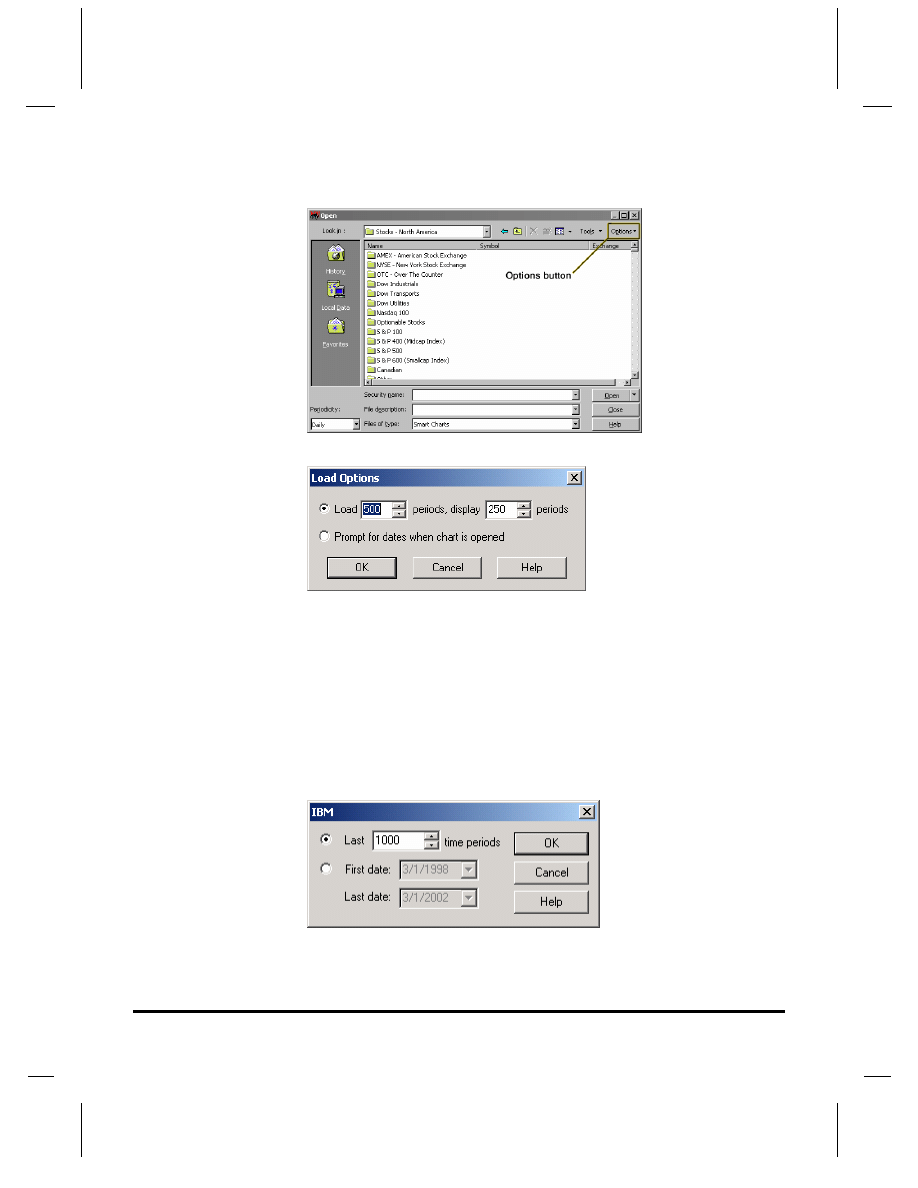
3. In the Open dialog, click Options. A menu opens.
4. Select Load. The Load Options dialog appears.
5. Increase the number in the
Load
box to include the date you want to see.
For example, if you want to see 100 days before the first day shown
(assuming the periodicity is
Daily
), change the
500
in the
Load
box to 600.
6. Click OK. Type the security’s name in the
Security Name
box.
7. Click Open. The security’s chart opens with more periods displayed on the
chart. (You may have to scroll left to see the new periods.)
Another approach is to tell MetaStock how many periods to show (or what
start and end dates to use) each time you open a chart. In the Load Options
dialog, select “
Prompt for dates when chart is opened
”. Then, whenever you
open a chart, you’ll get this dialog:
8. Choose to enter either a specific numbers of periods (based on the periodicity,
which you can change in the Open dialog), or specific first and last dates.

Getting Started with MetaStock 10.0
Charts
❖ 31
Chapter 6 – Indicators and Line Studies
What are Indicators and Line Studies?
Indicators
An indicator is a mathematical formula that uses a security’s data to generate
a numerical outcome, which you can then use to anticipate future changes in
price. For example, let’s look at the Average True Range indicator. Its
formula just calculates the average of these three values over a range of dates:
The distance from today’s high to today’s low.
The distance from yesterday’s close to today’s high.
The distance from yesterday’s close to today’s low.
The result is just a number plotted on a graph. So what do you do with that
graph once you’ve got it? You interpret it. You can find several books about
technical analysis at your bookstore, and most of them will contain
information about interpreting volatility indicators. (The Average True Range
indicator is a volatility indicator.)
Interpreting indicators is a mixture of art and science, and is too involved for
this manual to cover. But MetaStock’s help system includes help topics for
each indicator provided, and some suggested reading materials to satisfy your
curiosity.
For step-by-step instructions that show you how to plot an indicator,
see page 8.
32
❖ Charts
Getting Started with MetaStock 10.0
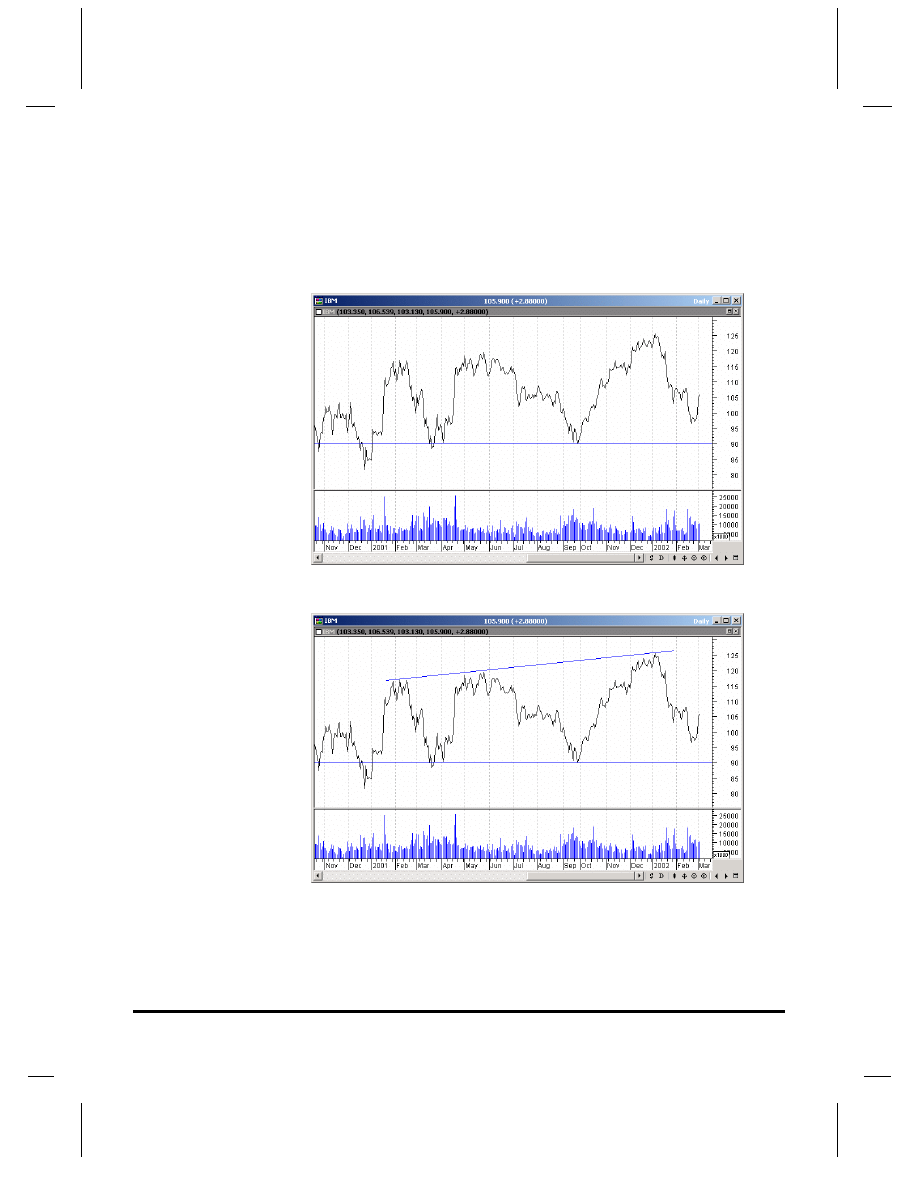
Line Studies
Line studies are shapes and lines you draw on a chart to help identify patterns
and interpret price or indicator movement. A simple example is the trendline,
which we can use to identify a security’s resistance level.
Take a look at the following chart:
Where’s the resistance level? You can see it’s somewhere between 115 and
125, but a trendline really highlights it for you:
This is just one example of a line study. There are dozens more, with dozens
of ways to interpret them. Again, describing how to interpret line studies in
detail is beyond this manual, but MetaStock’s online help is a great place to
start. And there are lots of technical analysis books that will help, too.

Getting Started with MetaStock 10.0
Charts
❖ 33
There are two types of line studies: those that are line-based and those that
aren’t. Line studies that are line based require you to click and drag a line
between a starting and ending point to draw the line study. Those that aren’t
line based appear as soon as the mouse pointer is inside an inner window.
A mouse click anchors the line study. For step-by-step instructions that show
you how to draw a line study, see page 11.

34
❖ Charts
Getting Started with MetaStock 10.0

Getting Started with MetaStock 10.0
Power Tools
❖ 35
Chapter 7 – Power Tools
MetaStock’s Power Tools
MetaStock offers a set of Power Tools that make the most of MetaStock’s
number-crunching power. The Power Tools are:
The Enhanced System Tester
The Explorer
The Expert Advisor
They’re called Power Tools for a reason. They do a lot of work for you and
generate lots of information you can use to make more informed decisions.
Sometimes MetaStock’s Power Tools are a little overwhelming for beginners.
With that in mind, this chapter introduces you to the general idea and purpose
behind each Power Tool, and walks you through a simple tutorial for each one
as well. When you’re ready to roll up your sleeves and get into some serious
backtesting and writing your own formulas, consult the big MetaStock manual
and the online help system. They contain lots of detailed information to help
you on your way.
The Enhanced System Tester
System testing involves the development and testing of trading systems to
determine the systems’ historical profitability. System testing helps answer the
question, “If I had traded this security using these trading rules, how much
money would I have made or lost?” The Enhanced System Tester also shows
you which securities work well with which systems.
MetaStock comes with dozens of ready-made systems you can use to backtest
against securities. With the Enhanced System Tester, you can:
Test one system on one security
Test many systems on one security
Test one system on many securities
Test many systems on many securities
The following tutorial shows you how to test many systems on many
securities. It’s pretty easy once you know how, and the other scenarios
described above are even easier by comparison.
36
❖ Power Tools
Getting Started with MetaStock 10.0
To use the Enhanced System Tester
1. Click the Enhanced System Tester button or select
Tools
>
Enhanced System
Tester
. The Enhanced System Tester appears.
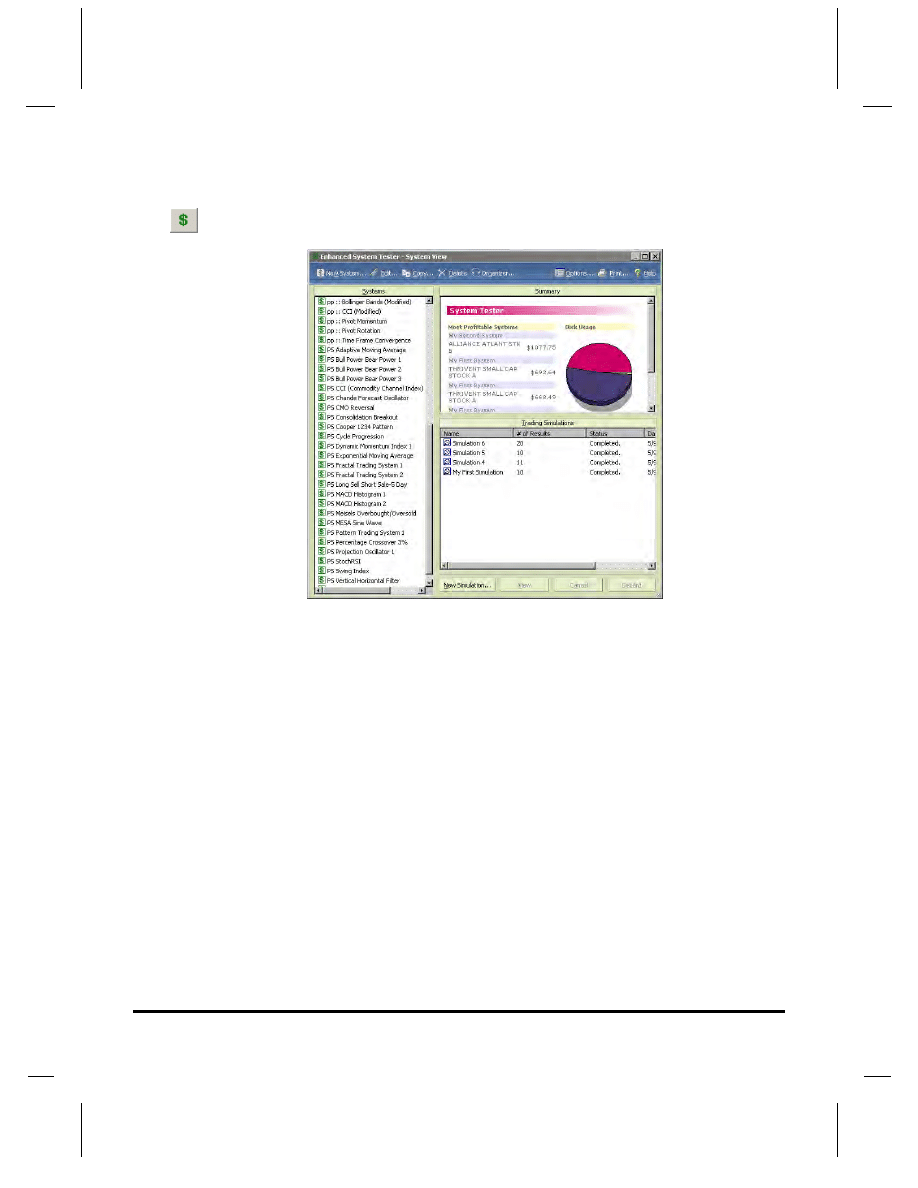
2. The Enhanced System Tester is divided into three main sections: the systems
list (on the left side), the summary (upper right), and the simulations list
(lower right).
3. In the systems list, scroll down until you see “
PS StochRSI
”, and click on it.
4. Hold the
C
TRL
key and click "
PS Swing Index
" (just below
PS StochRSI
).
Enhanced System
Tester button
Getting Started with MetaStock 10.0
Power Tools
❖ 37
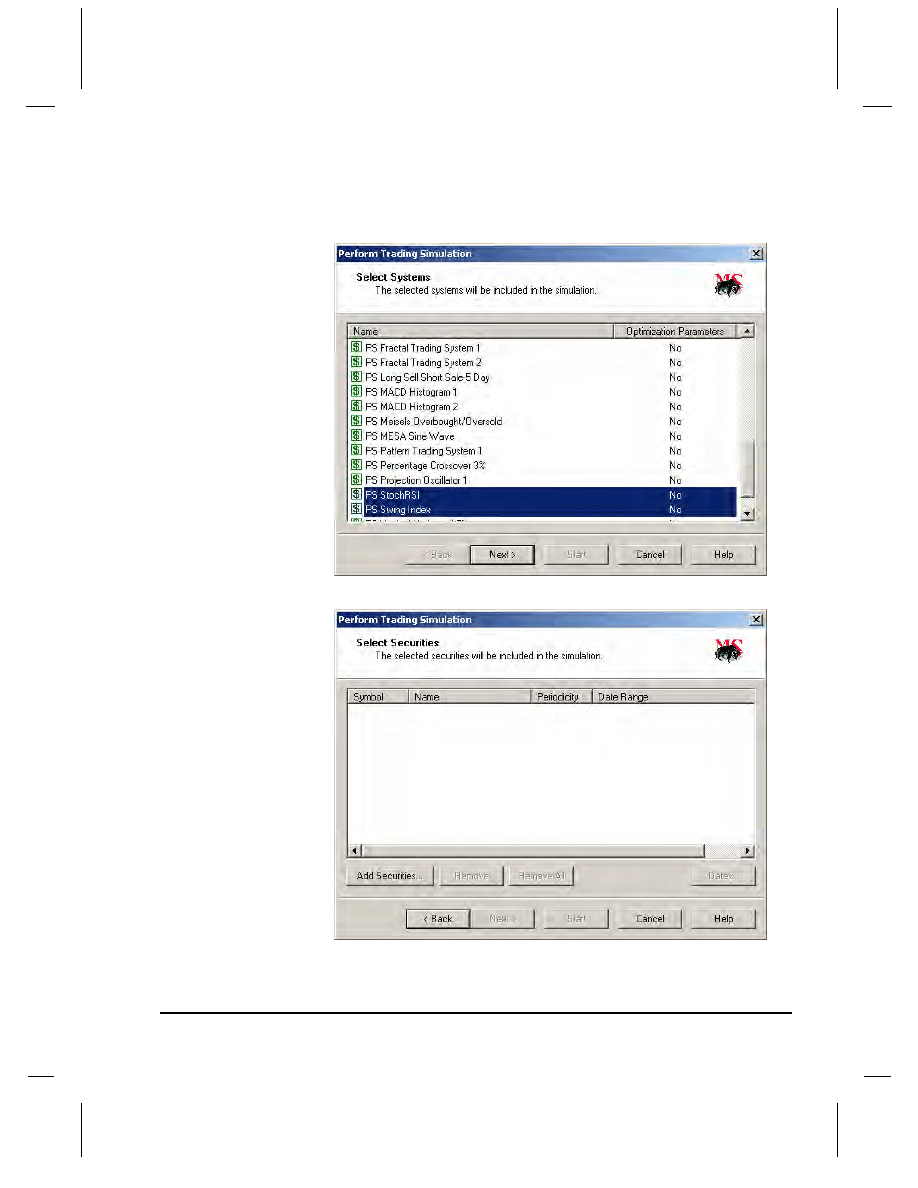
5. Click the New Simulation button at the bottom of the Enhanced System
Tester. The “Select Systems” screen of the Perform Trading Simulation
wizard appears with PS StochRSI and PS Swing Index already highlighted.
6. Click Next. The “Select Securities” screen appears.
38
❖ Power Tools
Getting Started with MetaStock 10.0
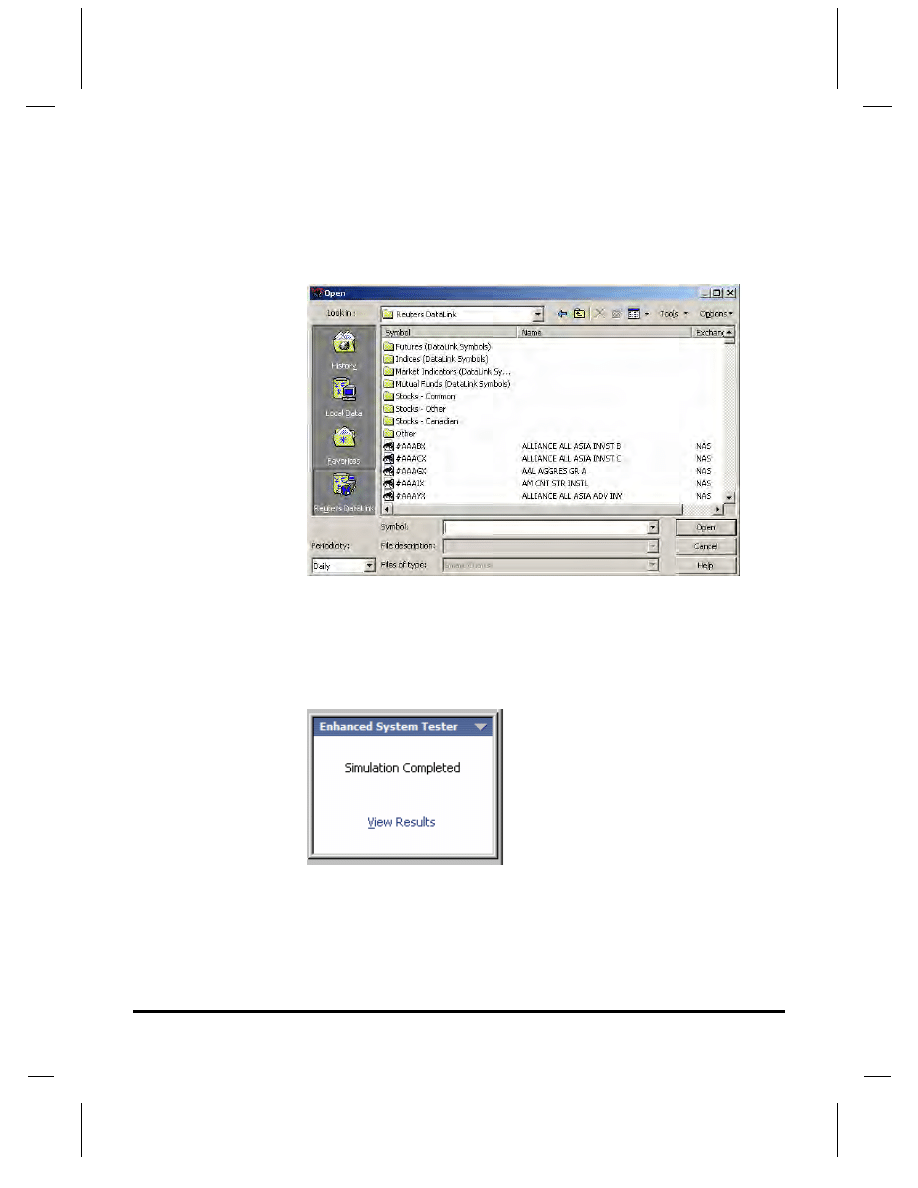
7. Click Add Securities.
The Add Securities dialog appears. It looks and works just like the Open
dialog described on page 5.
8. Double-click the
Stocks - Common
folder, and then double-click the
S & P 100
folder.
9. Hold the
C
TRL
key and click the first five securities in the list.
10. Click Open. You’re back in Perform Trading Simulation wizard.
11. Click Start. The Enhanced System Tester disappears, and a little window
appears in the lower right corner of the screen. It shows you some information
about the test being performed: how long it’s been going, the most recent
result, and the most profitable result.
When the test is complete, a button that says "View Results" appears in the
little window.
12. Click View Results.
Getting Started with MetaStock 10.0
Power Tools
❖ 39
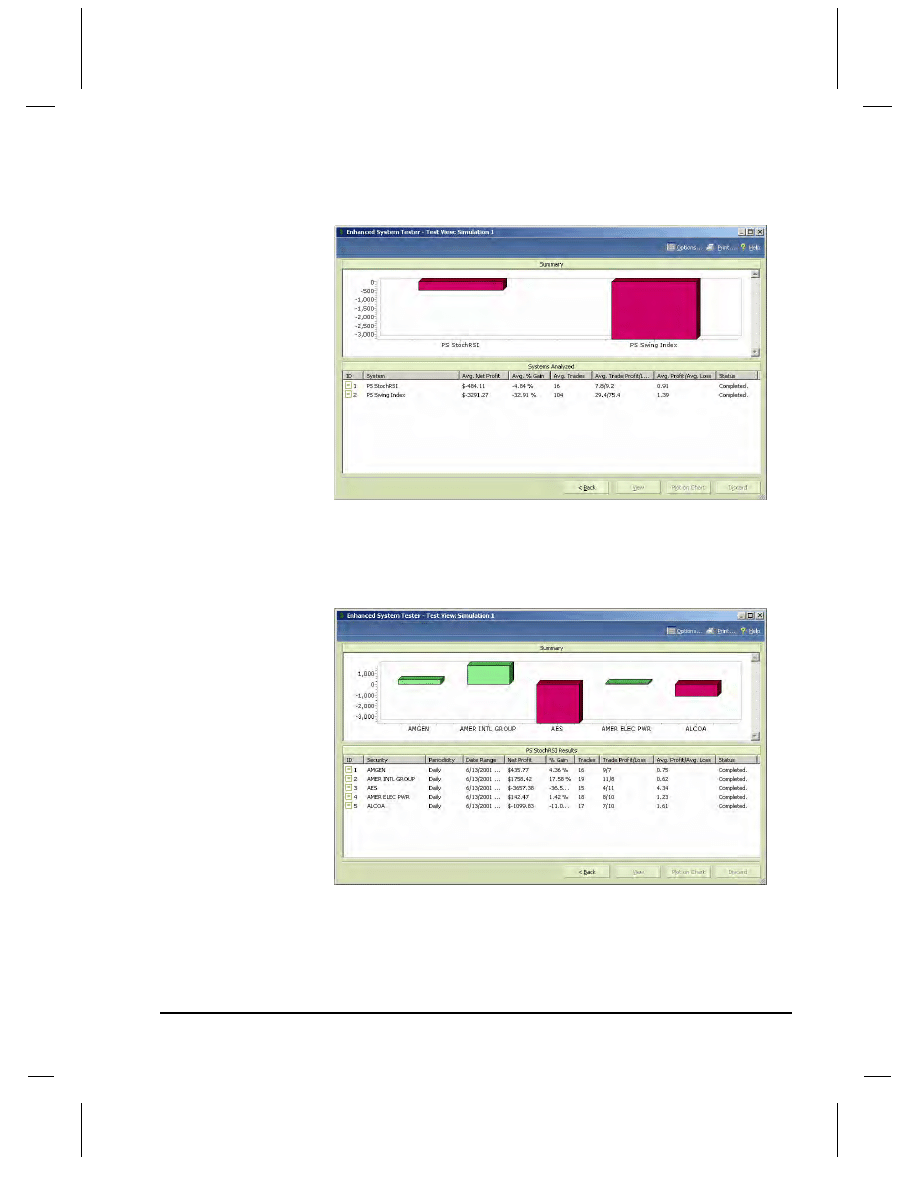
13. The Test View appears. The graph at the top shows each system’s average net
profit.
In this example (run in February 2002), notice that
PS StochRSI
had the
highest average net profit (even though it’s negative).
14. Double-click
PS StochRSI
(in the lower half of the screen). PS StochRSI’s
Test View appears. The graph at the top shows the net profit for each security
tested with the StochRSI system.
15. In the example,
Amer Intl Group
had the best net profit, so double-click it in
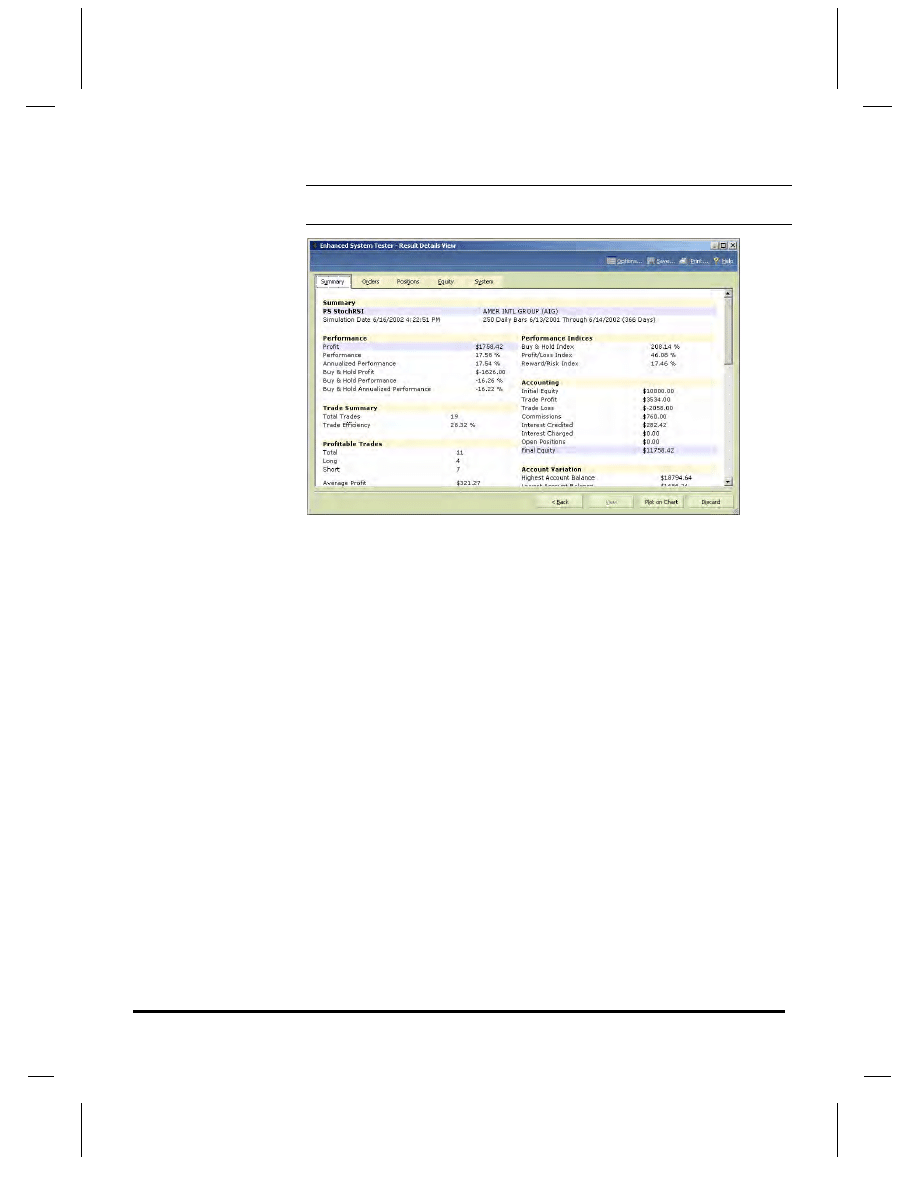
the lower half of the screen.
The Result Details View appears.
40
❖ Power Tools
Getting Started with MetaStock 10.0
Note: Your results may be different than what’s shown here. If so, just pick the
stock that had the best net profit.
The Result Details View contains five reports full of detailed information
about how the stock performed using the StochRSI system. To learn what all
these reports mean, refer to the Enhanced System Tester section of the big
MetaStock manual or search MetaStock’s online help system for keyword
Enhanced System Tester.
16. Close the Enhanced System Tester by clicking the "X" in the upper right
corner.
Getting Started with MetaStock 10.0
Power Tools
❖ 41
The Explorer
The Explorer finds good matches between systems and securities. It actually
does a lot more (explained in the MetaStock User Manual’s “Ranking and
Screening Securities” chapter), but the following tutorial will get you started.
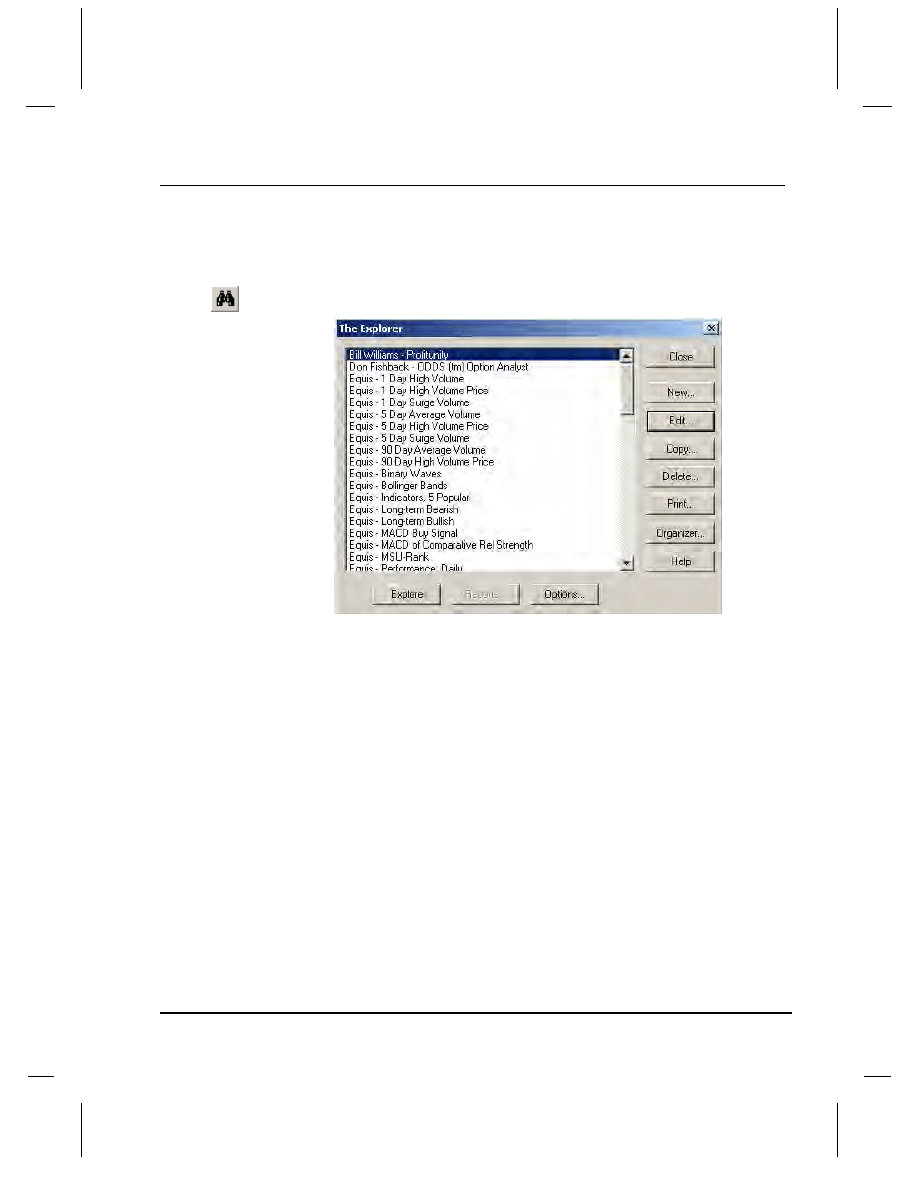
1. In MetaStock, select Tools>
The Explorer
, or click the Explorer button. The
Explorer dialog appears.
You see a list of explorations, but how do you know what they’re supposed
to do?
Explorer button
42
❖ Power Tools
Getting Started with MetaStock 10.0
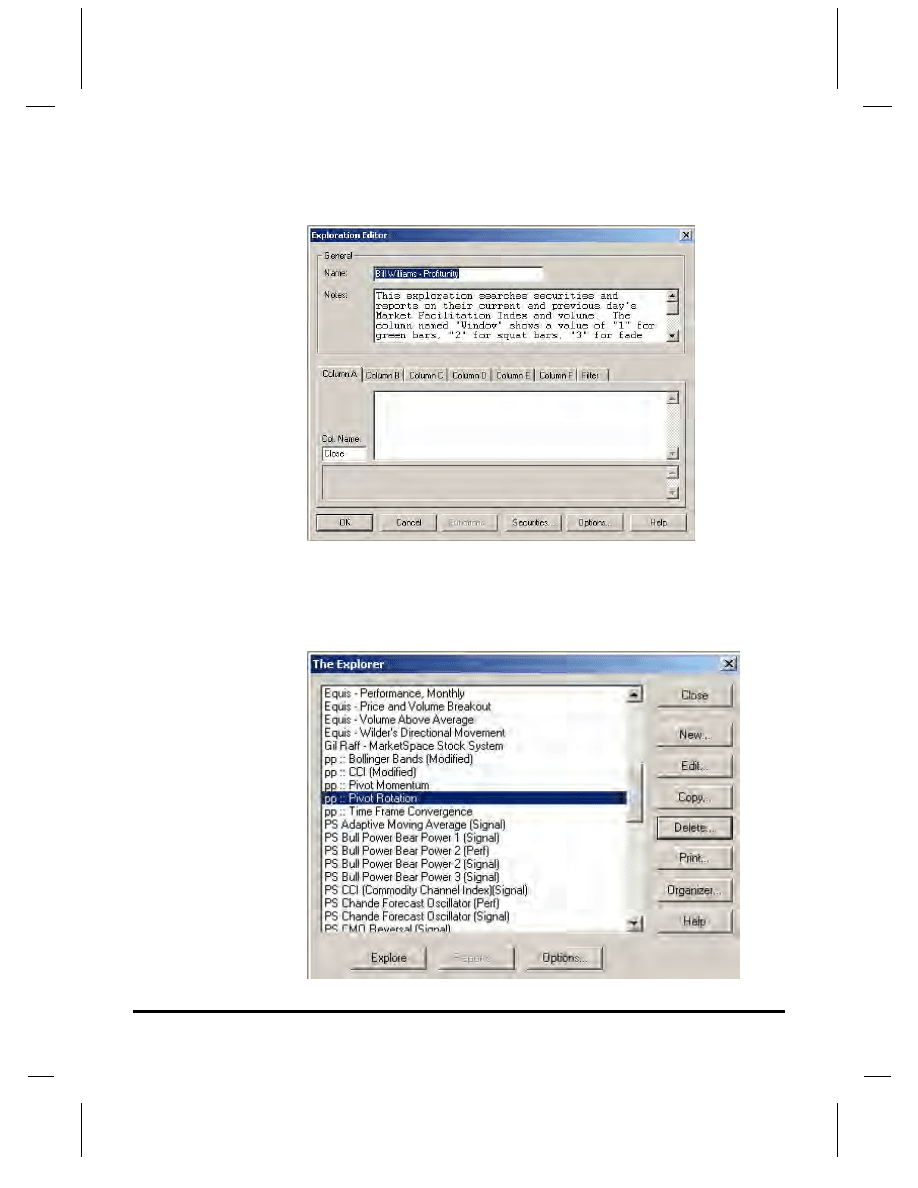
2. Click Edit to find out more about an exploration.
(If something asks you for a password, just click Cancel.)
3. Clicking Edit opens the Exploration Editor dialog, where a brief description
of the exploration appears in the
Notes
section. When you’re finished reading
the description, click Cancel.
4. Back in The Explorer dialog, scroll down in the list, and select
PP::Pivot Rotation
.
Getting Started with MetaStock 10.0
Power Tools
❖ 43
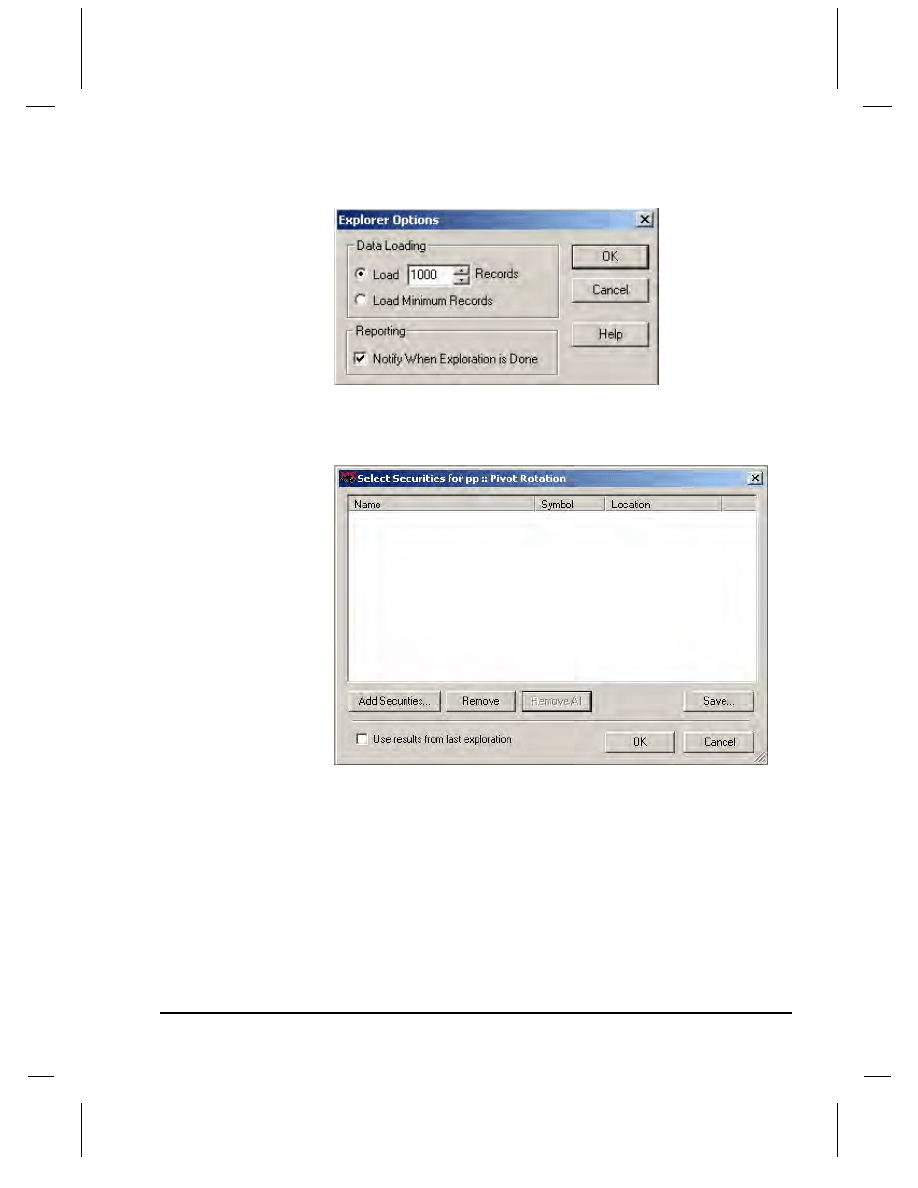
5. Click Options. The Explorer Options dialog appears.
6. In the Explorer Options dialog, select
Load _____ Records
and enter “1000”.
7. Click OK.
8. Click Explore. The Select Securities dialog appears.
9. In the Select Securities dialog, click Add Securities.
The Add Securities dialog appears.
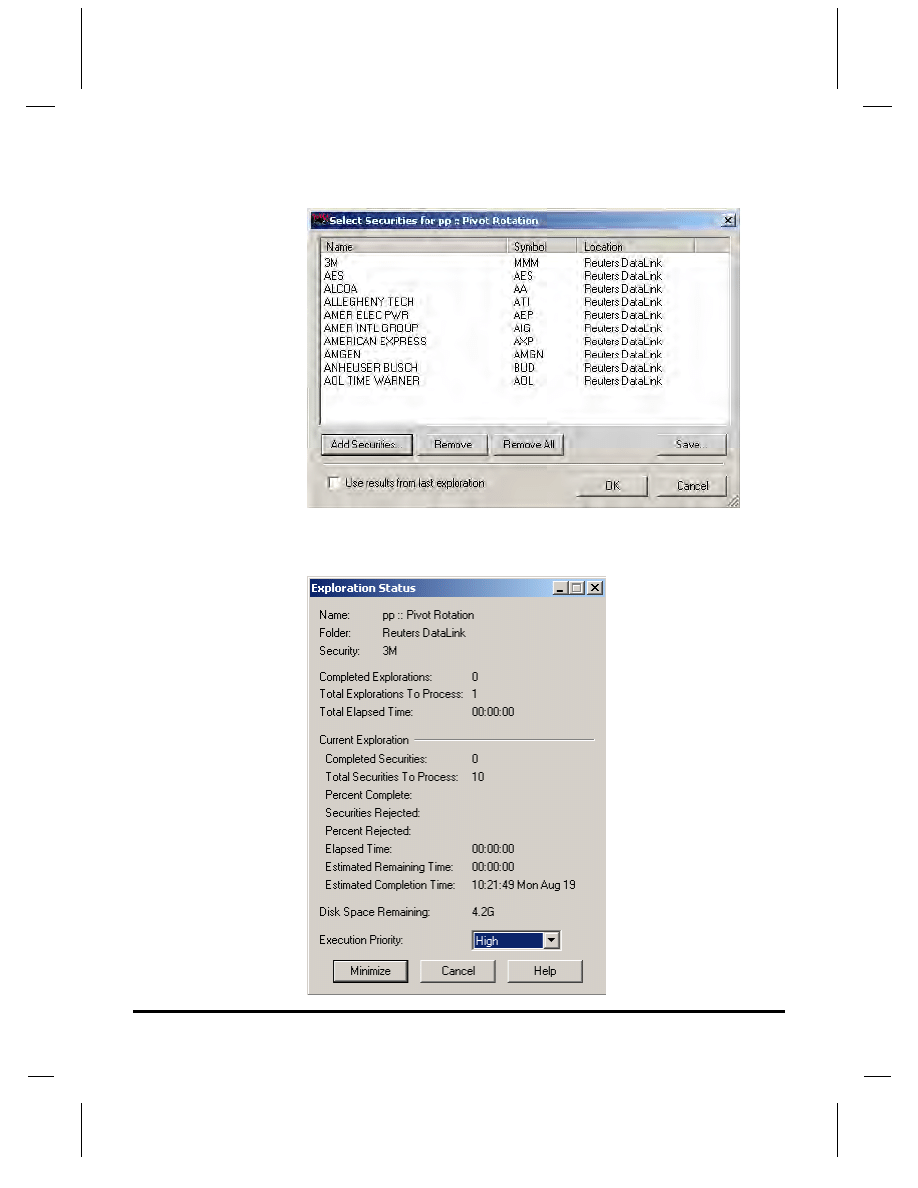
10. Click the Options button and select View by Name.
11. Double-click the
Stocks - Common
folder to open it.
12. Double-click the
S & P 100
folder to open it.
13. Highlight the security at the top of the list.
14. Hold the
S
HIFT
key and click the tenth security down on the list.
Now ten securities are selected. (You can select more or fewer securities if
you want to.)
44
❖ Power Tools
Getting Started with MetaStock 10.0
15. Click Open. You return to the Select Securities dialog.
16. Click OK. The exploration begins, and you see the Exploration Status dialog.
It shows you how much time the exploration will take to complete, plus lots of
other useful information.
Getting Started with MetaStock 10.0
Power Tools
❖ 45
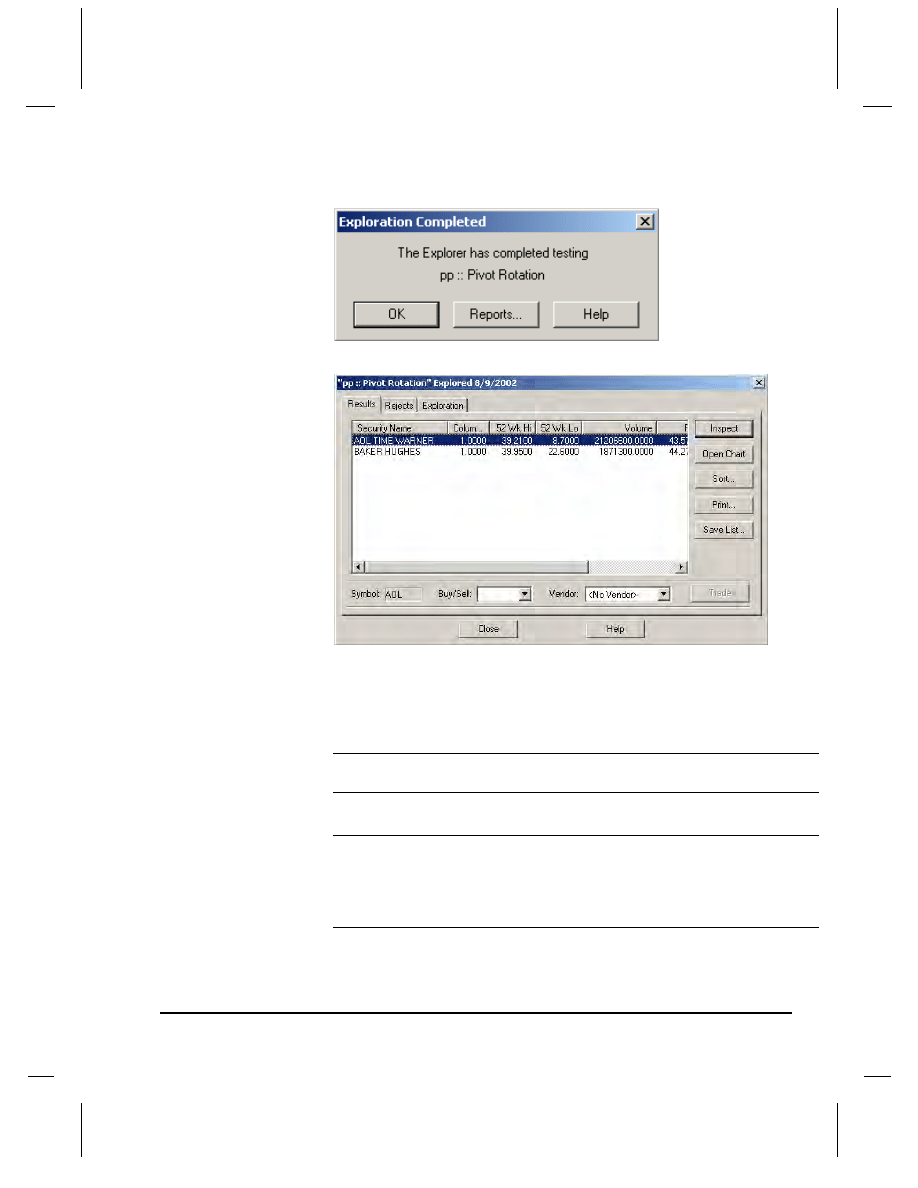
When the Exploration is complete, a notification dialog appears.
17. Click the Reports button to see the exploration’s results.
Each security has a set of results organized into columns. You can sort the
results by any of these values by clicking on the column’s heading.
For example, click the column heading
52 Wk. High
. The lowest value now
appears at the top of the list. Click the heading again, and the highest value
appears at the top of the list.
Note: Different explorations have different values for these columns.
Click the
Exploration
tab to see what the values are.
18. Click
AOL TIME WARNER
in the
Results
list.
Note: The results you get may be different than the results shown here. If AOL
isn’t in your results list, select any security you like. If there are no
results in the list, run the exploration again and include more securities.
You could also increase the number of records loaded with the
Explorer Options dialog (step 5 on page 44).
19. Click the Open Chart button. AOL Time Warner’s chart opens in the
background.
20. Click Close and click Close again to get to the chart.
46
❖ Power Tools
Getting Started with MetaStock 10.0
The Expert Advisor
The Expert Advisor offers advice, commentary, and suggestions when to buy
or sell a stock. Most systems have a companion expert advisor that works well
with the securities chosen by that system. For example, the previous section
shows how to use the PP::Pivot Rotation exploration in the Explorer. We’ll
use the PP::Pivot Rotation expert advisor on AOL, since our PP::Pivot
Rotation exploration returned AOL as a result.
Note: Any security/expert combination will work with this example.
1. In MetaStock, open a chart for AOL Time Warner (AOL).
2. Right-click anywhere in the chart. The shortcut menu opens.
3. In the shortcut menu, select Expert Advisor>
Attach
.
The Attach Expert dialog appears.
4. In the Attach Expert dialog, scroll down and click
PP::Pivot Rotation
.
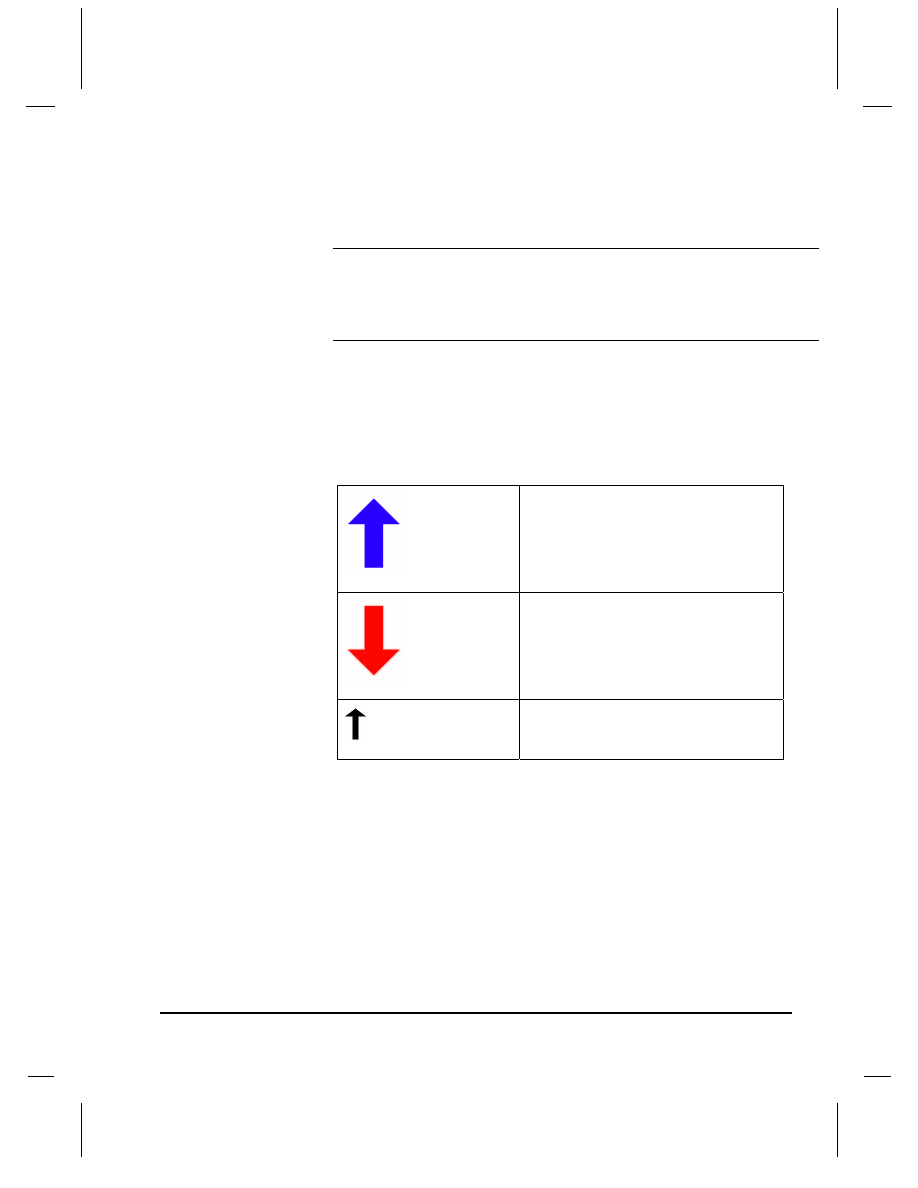
5. Click OK. The chart now has some red and blue arrows on it, and some of the
bars are red and some are blue. All these graphics are described at the end of
this tutorial. For now, let’s move forward and see what else the Expert does.
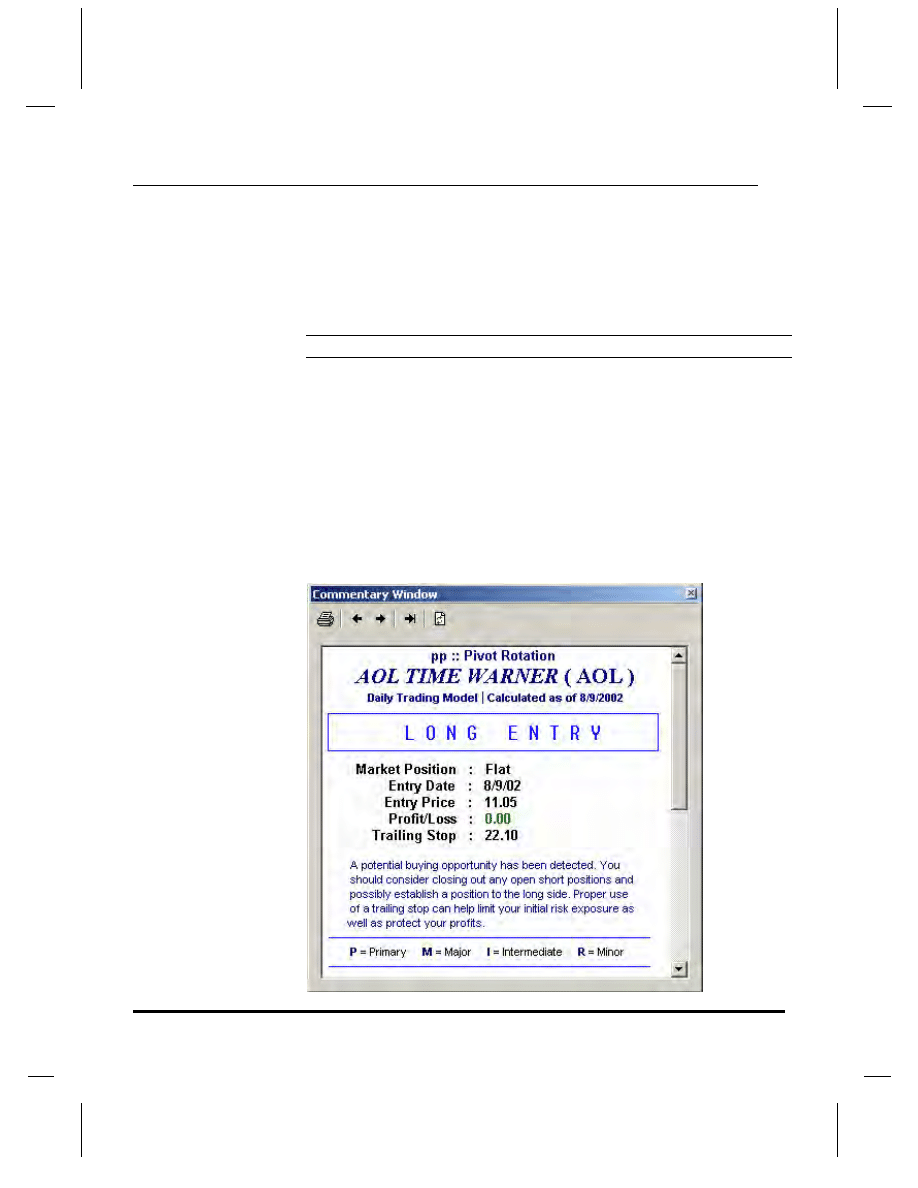
6. Right-click in the chart again to open the shortcut menu. This time, select
Expert Advisor>
Commentary
. The Commentary window appears.
Getting Started with MetaStock 10.0
Power Tools
❖ 47
7. Resize the Commentary Window to make it bigger, or scroll down to the
Summary
section. This section tells you if a buy or sell signal was generated
today, or when the last signal was generated.
IMPORTANT: Remember that buy and sell signals aren’t gospel. They’re just
suggestions. The obvious question then is "How reliable are
these suggestions?" To find out, use the Enhanced System
Tester (page 36) to test how well this expert’s system works
when used with this security.
You can see commentary for any bar on the chart by clicking the left and
right arrows at the top of the Commentary Window.
8. Once you have the expert attached, view the chart daily to see if the expert
generates a buy or sell signal. If you’ve tested the system with the security and
they work well together (the system produced a steadily rising equity line),
you may want to buy or sell shares as the expert suggests.
Blue "up" arrow
Long Entry Signal. The system
suggested entering a long position on
this date.
Red "down" arrow
Short Entry. The system suggested
entering a short position on this date.
Small Arrow (can be red or blue).
The system suggested adding to an
existing position on this date.
48
❖ Getting Help
Getting Started with MetaStock 10.0
Chapter 8 – Getting Help
There will be times when you need help with a certain feature. Several sources
are readily available. Perhaps the quickest way to find an answer is with the
online help system. If you need help on a certain dialog or command, click the
dialog’s Help button and obtain instant access to information about the task at
hand. It’s like having a user’s manual that automatically turns its pages based
on what you’re doing.
Five ways to access the Help system:
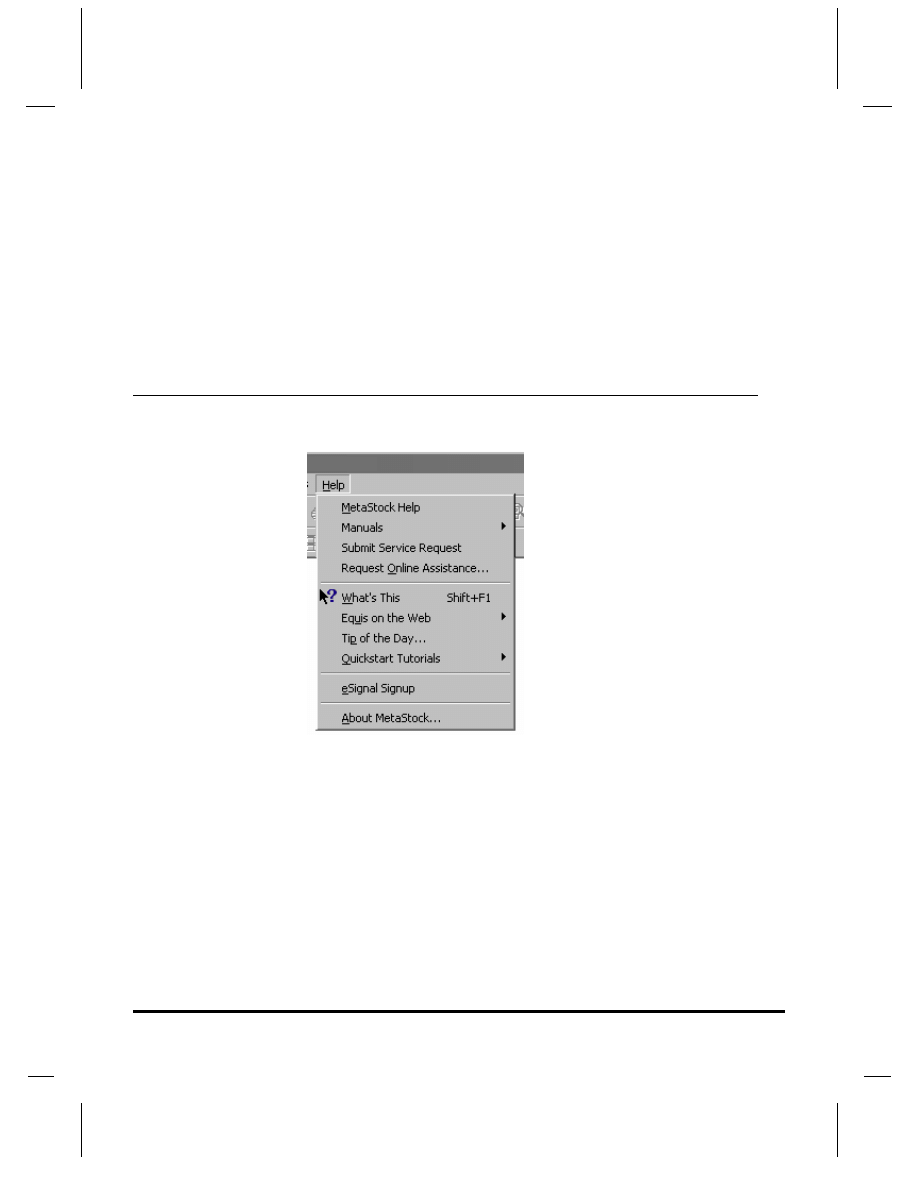
Use the Help menu in the main toolbar.
The Help menu gives you access to:
The standard online help system by choosing MetaStock Help
Context Sensitive Help (see below)
Equis resources on the Internet
The Tip of the Day window
The QuickStart Tutorials
and information about your MetaStock program and your computer
system by choosing About MetaStock.
Press the
F1
key. Pressing the
F1
key from anywhere in MetaStock displays
the help screen for the current task, including menu items.
For example, select File>
Open
, then press the
F1
key. Help for the Open
dialog will appear.

Getting Started with MetaStock 10.0
Getting Help
❖ 49
Click on the Help button within any dialog. Every dialog in MetaStock
contains a Help button.
Right-click on any object to display the object’s shortcut menu.
Every shortcut menu contains a Help command.
Click the Context-sensitive Help button on the toolbar to find out about an
item on the screen. When the mouse pointer changes to a question mark,
choose a menu command or click on an item on your screen.
For example, to learn how to interpret the Relative Strength Index, click the
Context Sensitive Help button, and then click on the Relative Strength Index
plot in an open chart.
To search the Help system:
1. Select Help>
MetaStock Help
.
2. Click the
Index
tab and type the topic word you wish to search for.
For example, if you wanted to know more about Candlestick charts, type the
word “candlestick” in the box. The list will automatically scroll to the
correct topic as you type.
3. When the topic for which you want information appears, click it, and then
click Display.
To get help on a chart feature:
Right-click the feature (trendline, indicator, etc.) and choose
Help
from
the shortcut menu.
Help button
Context Sensitive Help
button

50
❖ Getting Help
Getting Started with MetaStock 10.0
More Places to Get Help
Technical Support Contact Information
For your convenience, many of the answers to your support questions can be
found in the manuals and help files. Additional information is provided on our
web site, in the Customer Zone.
Note: If you purchased MetaStock directly from a MetaStock Reseller, they will
provide your first line of support. Please contact them for assistance.
When you contact Equis Support, please be prepared to provide your
customer number or name and address to enable us to locate your account
information.
Our Support Team strives to respond to written responses (emails, faxes, and
service requests) within the first business day we receive them. Support
queries are addressed during the support hours listed on our web site. Please
note that if you post a request outside of the listed support hours, we will
address your request on the following business day in the order that it was
received. Please be aware that the volume of requests fluctuates and on
occasion it may take longer to receive a response.
For current support hours, please visit www.equis.com and go to the
About Equis page. Select Contact Information there to get this information.
Due to the inherent complexity, design, and creation of custom indicators,
explorations, system tests, and experts, Equis cannot provide free
development for these tools. However, development is available for a
reasonable fee. Fill out the FORMULA HELP.DOC file found in the
MetaStock folder. This file is viewable with WordPad. Email the form to
formulas@equis.com. You will receive a quote before the development will
be completed.
MetaStock End-of-Day and MetaStock Professional Product Support
Phone:
+1 (801) 265-9998
Fax:
+1 (801) 265-2114
Email:
support@equis.com
Mail:
Equis International, Technical Support Dept.
90 South 400 West
Suite 620
Salt Lake City, UT USA 84101

Getting Started with MetaStock 10.0
Getting Help
❖ 51
Service Request: Service requests can be accessed directly from
MetaStock by selecting Help>
Submit Service Request
; you can also access
the same resource through the Customer Zone area of www.equis.com.
You will be notified by email when your service request is updated/resolved.
Online Chat
You can exchange instant messages with a support representative from within
MetaStock using the online chat feature.
To do so, select Help>
Request Online Assistance
.
Reuters DataLink Support
Note: In order to provide better service, the following telephone numbers and
email address will only provide support for Reuters DataLink; support
for MetaStock will not be provided. MetaStock questions must be
directed to the MetaStock Product Support channels as described above.
Phone:
+1 (800) 842-3045 (Sales and Billing Questions)
+1 (801) 270-3298 (Support Questions)
Email:
support@reutersdatalink.com
QuoteCenter Data Feed Product Support
Note: In order to provide better service, the following telephone number and
email address will only provide support for the QuoteCenter Data Feed;
support for MetaStock will not be provided. MetaStock questions must
be directed to the MetaStock Product Support as described above.
Phone:
+1 (801) 270-3290
Email: msqcsupport@equis.com
52
❖ QuoteCenter Features
Getting Started with MetaStock 10.0
Chapter 9 – QuoteCenter Features
IMPORTANT: You must have successfully installed the QuoteCenter
software before you can receive online or real-time
quotes from QuoteCenter.
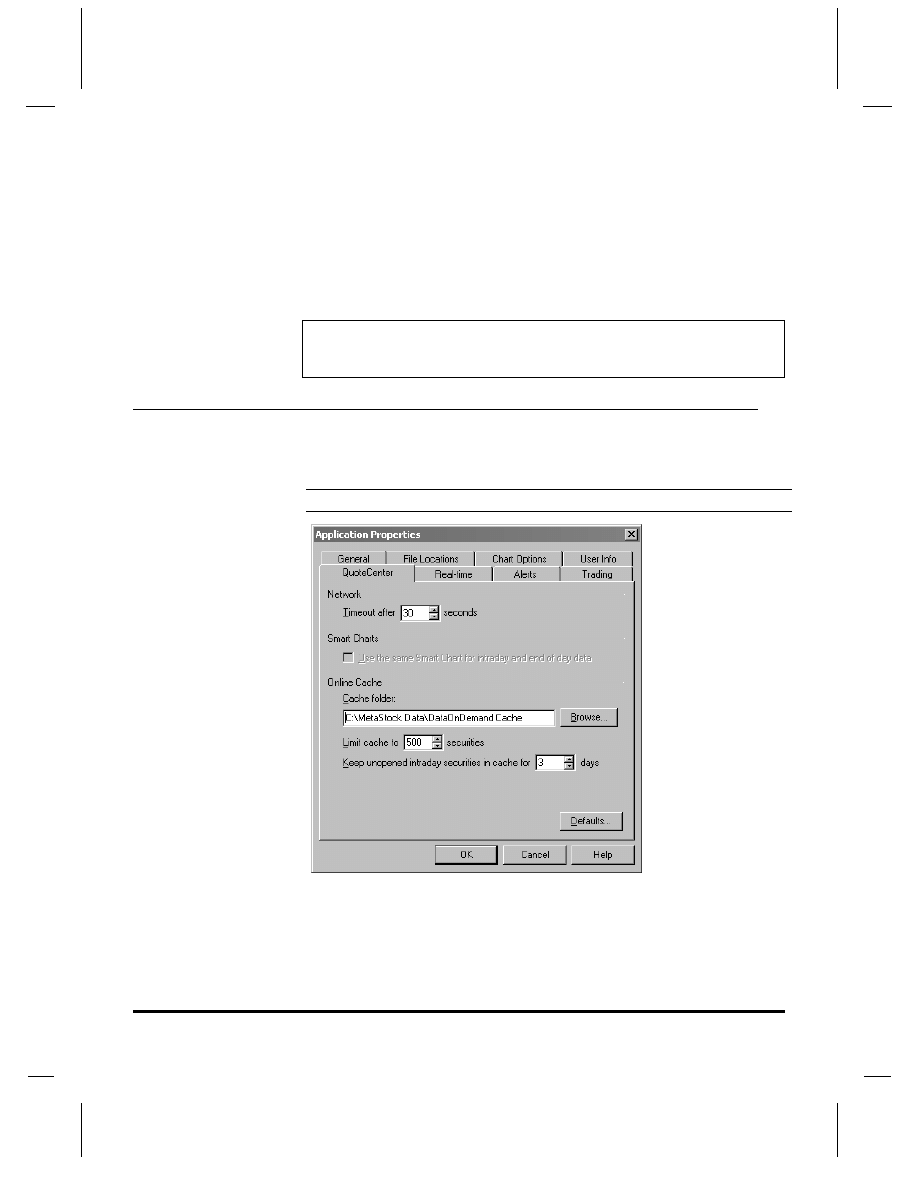
MetaStock Application Properties
Some options available to QuoteCenter users can be accessed by selecting
Tools>
Options
, and then clicking on the
QuoteCenter
tab.
Note: These options are used only with DataOnDemand™.
Network
Timeout. When a request for data is sent to QuoteCenter, MetaStock will
wait this number of seconds for the data before displaying a Timeout error
message.

Getting Started with MetaStock 10.0
QuoteCenter Features
❖ 53
Smart Charts
Use the same Smart Chart for intraday and end of day data.
Check this box to maintain one Smart Chart per security. This can increase the
available space on your hard drive.
Online Cache
Security data can be stored on your local system for quick access. Each time
you request a new chart through DataOnDemand, the data will be stored in
your online cache folder. The next time you request the same security, the
data stored in the cache will be displayed first, then the new data will be
requested from QuoteCenter. If changes have been made to the data since the
data was stored in the online cache, a split for example, you need only to click
on the Refresh button to re-request all data from QuoteCenter.
Cache Folder. This is the location on your hard drive where your online
cache will be stored.
The default is C:\MetaStock Data\DataOnDemand Cache.
Limit Cache to ____ Securities. You may store any number of securities
between 0 and 6000. The default number is 500. When the limit has been
reached, the oldest entry will be deleted, and the newly requested security will
be stored.
Keep unopened intraday securities in cache for __ days. MetaStock
will wait this number of days for the securities to be opened before deleting
them. This can increase the available space on your hard drive.
54
❖ QuoteCenter Features
Getting Started with MetaStock 10.0
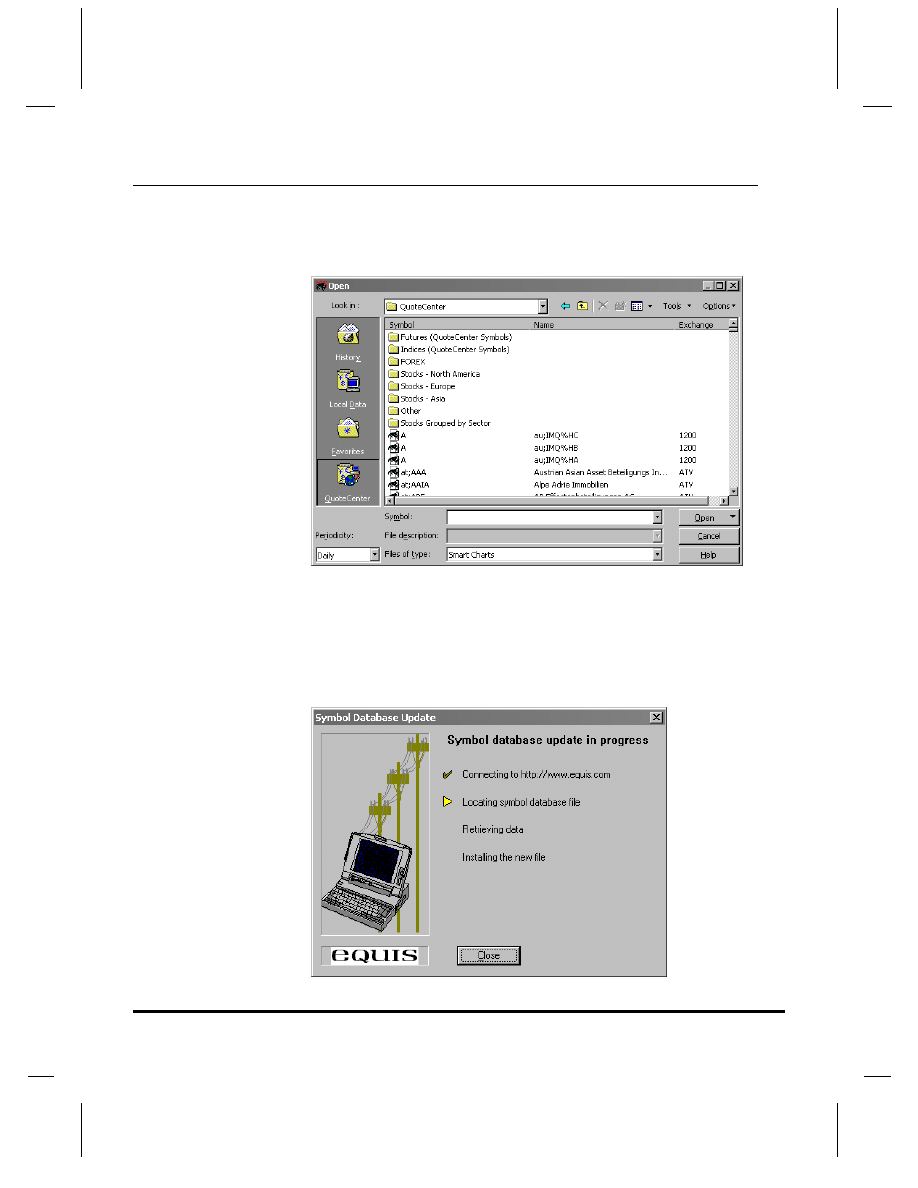
QuoteCenter Symbols
If you are using DataOnDemand™ with QuoteCenter, you can find a list of all
securities available for charting by choosing the QuoteCenter shortcut from
the shortcut bar in the Open dialog of MetaStock.
Symbols available for real-time or end-of-day collection can be found in the
Symbol Database. Select File>
New> Security
in MetaStock or
The DownLoader. In the New Security dialog, click the Look-up button to
display the Symbol Database.
Each month, the Symbol Database is updated on the Equis International web
site. You can update this list automatically by selecting
Tools>
Update Symbol Database
in either MetaStock or The DownLoader.

Getting Started with MetaStock 10.0
Reuters DataLink Features
❖ 55
Chapter 10 – Reuters DataLink Features
(MetaStock End-of-Day)
Choosing a Service Package
Reuters DataLink offers a service that allows you to sign up over the Internet
at http://www.reutersdatalink.com/signup. The sign-up process is completely
secure. If you do not have access to the Internet you can sign up by calling
1-800-842-3045.
If you already have an account with Reuters DataLink and would like to
change it, call them directly at 1-800-842-3045. If you are located outside of
North America, dial +1 801-265-8886.
To sign up with Reuters DataLink on the Internet
1. Click the Online Sign-up button in the Vendor Selection dialog, or run your
web browser and go to:
http://www.reutersdatalink.com/signup
2. Fill out the secure web form.
Note: Reuters DataLink accepts both credit card and checking account debit
payments.
3. When the form is complete, click the Submit button at the bottom of the
page.
You will receive, by email, confirmation of your sign-up within one business
day. The confirmation will include your User ID and selected password.
56
❖ Reuters DataLink Features
Getting Started with MetaStock 10.0
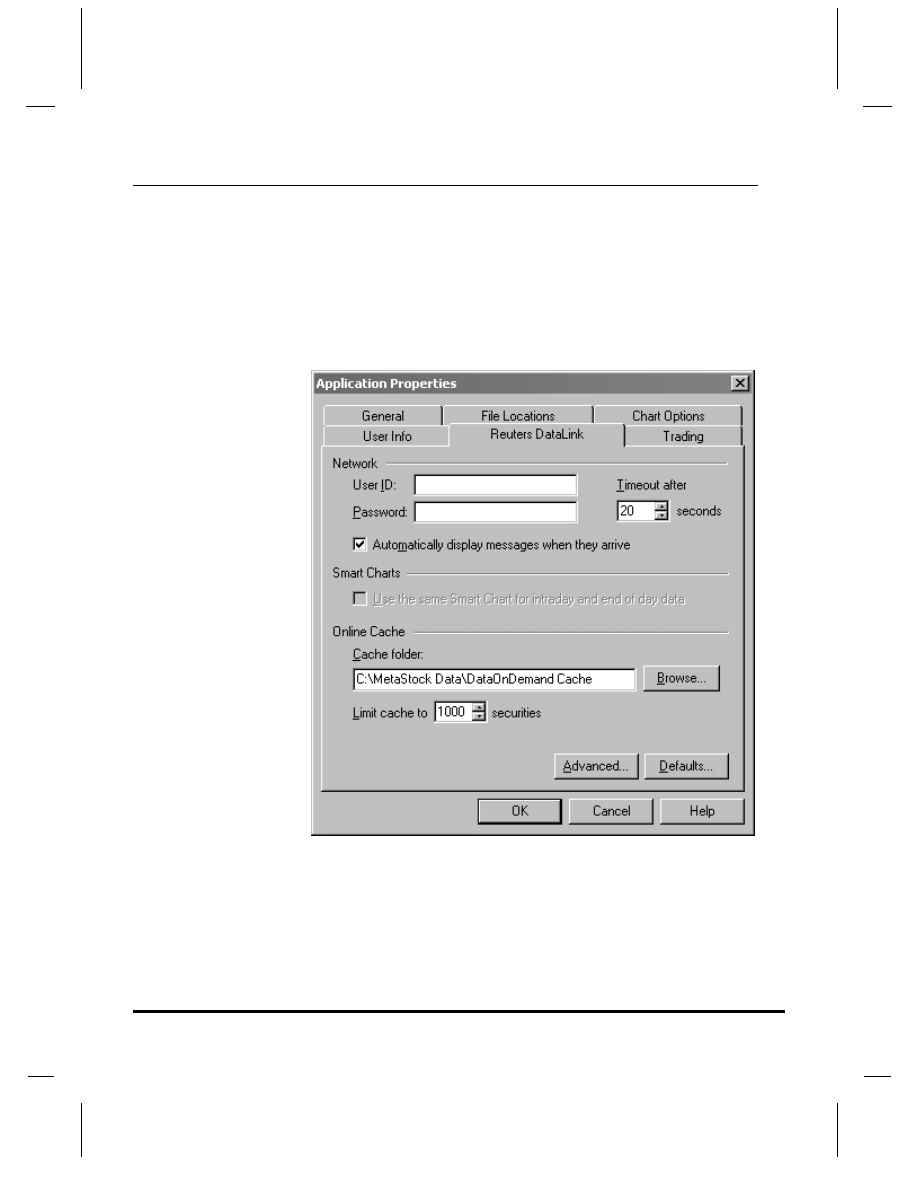
Reuters DataLink Application Properties
Some options available only to Reuters DataLink users can be accessed by
selecting Tools>
Options
, and then clicking on the
Reuters DataLink
tab.
These options are used only with DataOnDemand™.
If you signed up with Reuters DataLink after installing MetaStock, you may
enter your User ID and Password here. After you have entered your
information, close down and restart MetaStock for the change to take effect.
You should then see the
Reuters DataLink
shortcut on the shortcut bar in the
Open dialog.
User ID. Enter your Reuters DataLink User ID in this box. This information
is used only with DataOnDemand™. To download end-of-day data with The
DownLoader, you need to enter this information in the DownLoader's Vendor
Options.
Password. Enter your Reuters DataLink Password in this box. This
information is used only with DataOnDemand™. To download end-of-day
data with The DownLoader, you need to enter this information in the
DownLoader's Vendor Options.
Getting Started with MetaStock 10.0
Reuters DataLink Features
❖ 57
Cache Folder. Enter the path to your online cache folder. This is usually
C:\MetaStock Data\DataOnDemand Cache
.
Number of Securities to Cache. Enter the number of securities to store
in the online cache folder. When a security is requested after the maximum
number of securities is reached, the oldest security will be deleted before
adding the new security to the online cache folder.
Seconds until Timeout. Enter the number of seconds for MetaStock to
wait for data after sending a request to Reuters DataLink for online data.
Automatically display messages when they arrive. Check this box if
you want the messages from Reuters DataLink to be displayed automatically
when they arrive.
Advanced. Click the Advanced button to access the Advanced options for
DataOnDemand with Reuters DataLink. You should not change these options
unless instructed to do so by a Reuters DataLink technical support
representative.
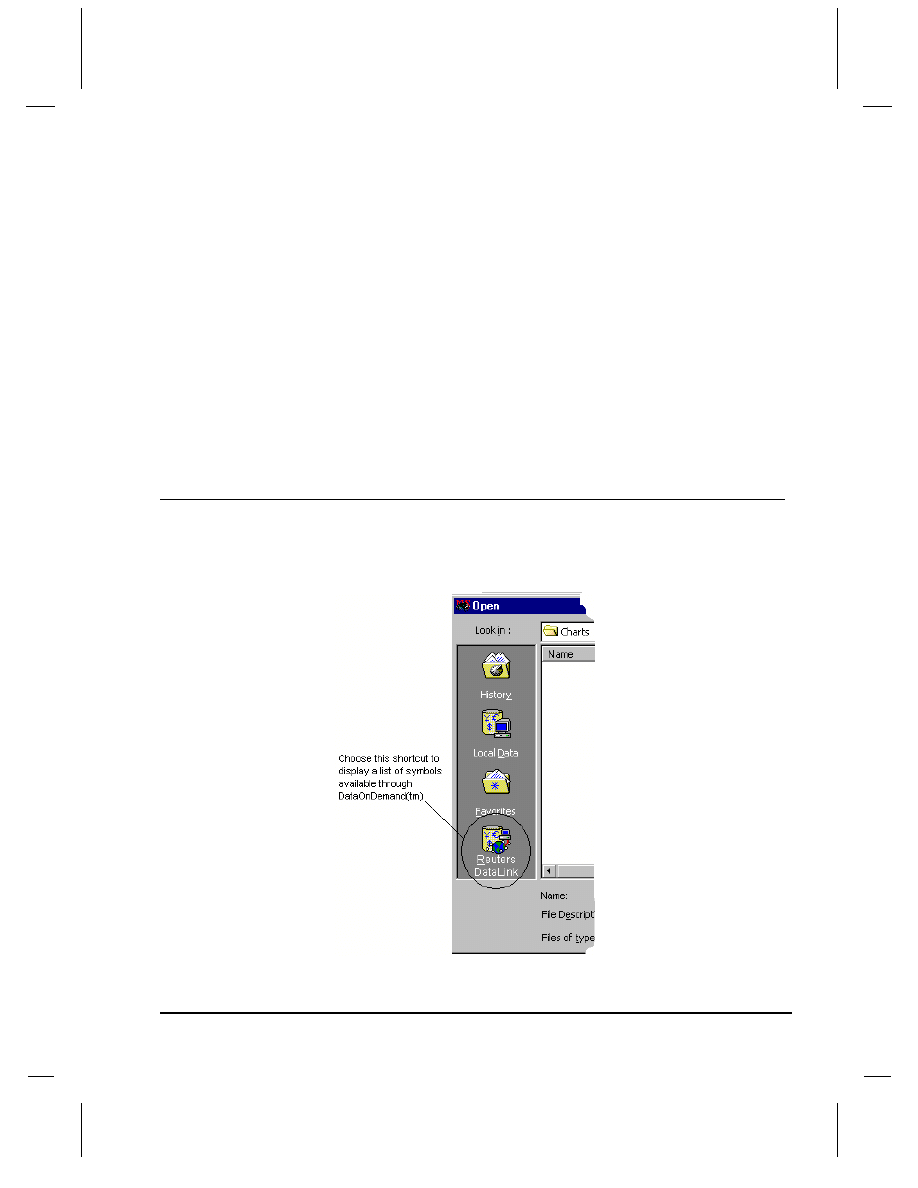
Reuters DataLink Symbols
You can find a list of all securities available for charting through
DataOnDemand by choosing the Reuters DataLink shortcut from the shortcut
bar in MetaStock’s Open dialog.
58
❖ Reuters DataLink Features
Getting Started with MetaStock 10.0
Symbols available for end-of-day collection can be found in the Symbol
Database. To view them, select File>
New>
Security
in either MetaStock or
The DownLoader. In the New Security dialog, click Look-up to display the
Symbol Database. For more information on creating symbols for Reuters
DataLink, please refer to the “Reuters DataLink” section of the Symbols
Appendix in the MetaStock Users’ Manual.
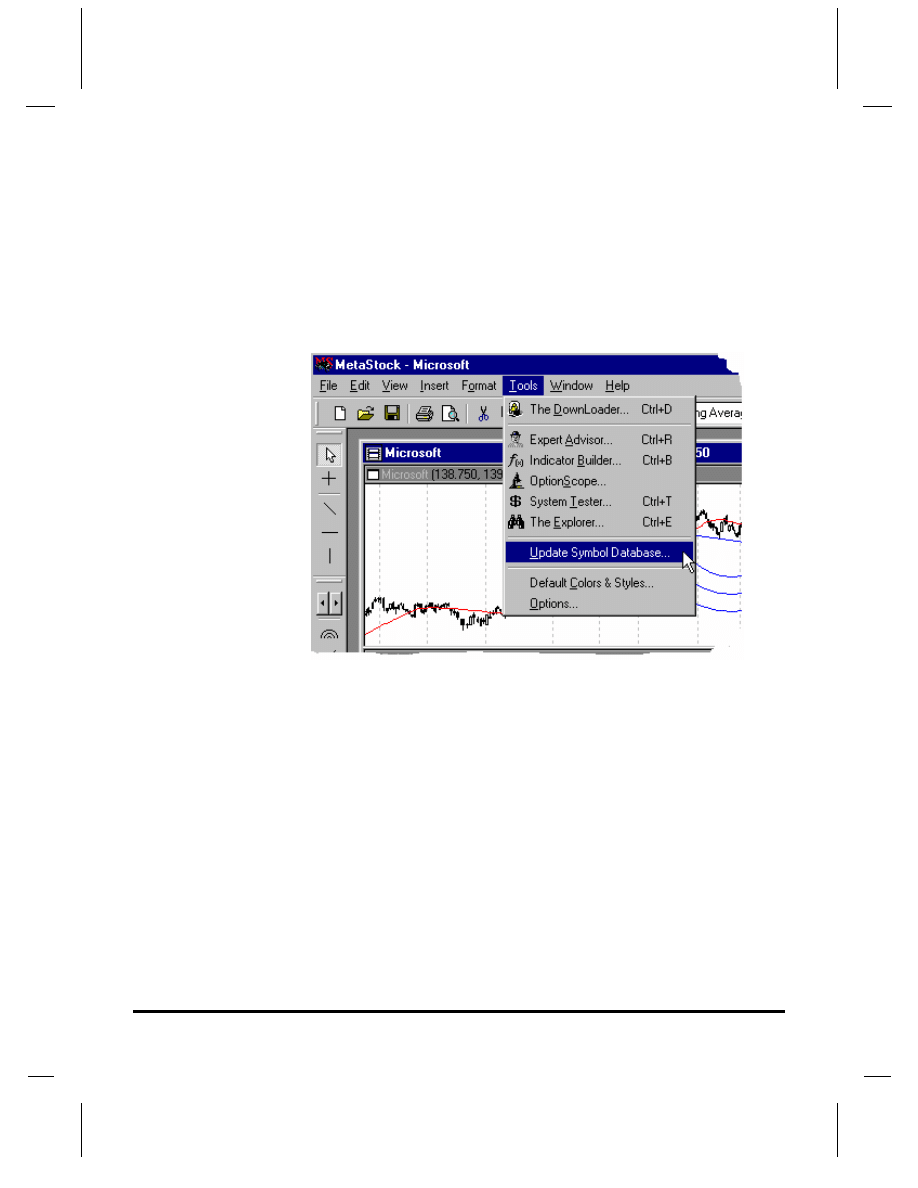
Each month, the Symbol Database is updated on the Equis International web
site. You can update this list automatically by choosing
Tools>
Update Symbol Database
in either MetaStock or The DownLoader.
The Symbol Database is as accurate as possible, but new symbols may not be
added in time for the monthly publication on the web site. If you are unable to
find a specific symbol in the Symbol Database, you can create a local security
by typing the symbol into the New Security dialog.
You can also add the symbol to the Symbol Database by choosing
New Symbol while the Symbol Database dialog is displayed. If you have a
chart open and type a symbol that is not in the database, the New Symbol
dialog will appear automatically.
The next time you update the Symbol Database by using the Update Symbol
Database command, any new symbols you have added will not be removed
from the database.
Getting Started with MetaStock 10.0
eSignal Features
❖ 59
Chapter 11 – eSignal Features
(MetaStock Professional)
Note: This data service requires an internet connection. Any internet service
provider will work, as long as you have some way of avoiding
disconnects due to inactivity. America Online (AOL), EarthLink, AT&T
Worldnet, cable modems, ISDN, and DSL are examples of compatible
internet connections.
eSignal is a data service compatible with MetaStock’s DataOnDemand™
technology. With DataOnDemand, you do not need to store any data on your
own hard drive. The data remains on the computer at eSignal, but can be
remotely accessed and displayed in a chart in MetaStock. The entire eSignal
database is available for charting.
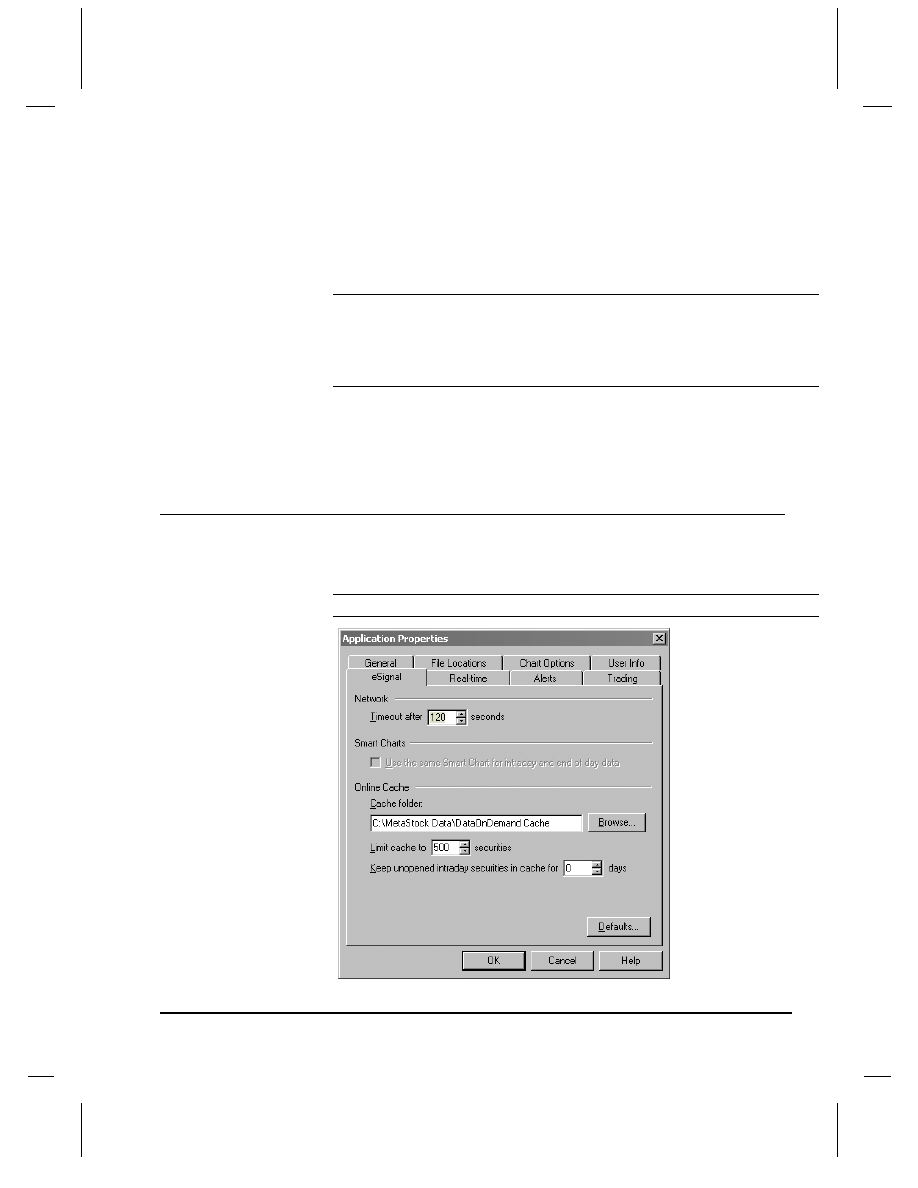
eSignal Application Properties
Some options available only to eSignal users can be accessed by choosing
Tools>
Options
, then clicking on the
eSignal
tab.
Note: These options are used only with DataOnDemand™.

60
❖ eSignal Features
Getting Started with MetaStock 10.0
Network
Timeout. When a request for data is sent to eSignal, MetaStock will wait this
number of seconds for the data before displaying a Timeout error message.
Smart Charts
Use the same Smart Chart for intraday and end of day data.
Check this box to maintain one Smart Chart per security. This can increase the
available space on your hard drive.
Online Cache
Security data can be stored on your local system for quick access. Each time
you request a new chart through DataOnDemand, the data will be stored in
your online cache folder. The next time you request the same security, the
data stored in the cache will be displayed first, then the new data will be
requested from eSignal. If changes have been made to the data since the data
was stored in the online cache, a split for example, you need only to click on
the Refresh button to re-request all data from eSignal.
Cache Folder. This is the location on your hard drive where your online
cache will be stored.
The default is C:\MetaStock Data\DataOnDemand Cache.
Limit Cache to ____ Securities. You may store any number of securities
between 0 and 6000. The default number is 500. When the limit has been
reached, the oldest entry will be deleted, and the newly requested security will
be stored.
Keep unopened intraday securities in cache for __ days. MetaStock
will wait this number of days for the securities to be opened before deleting
them. This can increase the available space on your hard drive.
Getting Started with MetaStock 10.0
eSignal Features
❖ 61
Using the eSignal Data Manager
You must have your Data Manager software running successfully before you
can receive online or real-time quotes from eSignal. If you are receiving
quotes, your Data Manager is working correctly.
When you install your Data Manager software, be sure to select the
appropriate data type – delayed or real-time. If you select the wrong type of
data feed, your data collection will be unreliable.
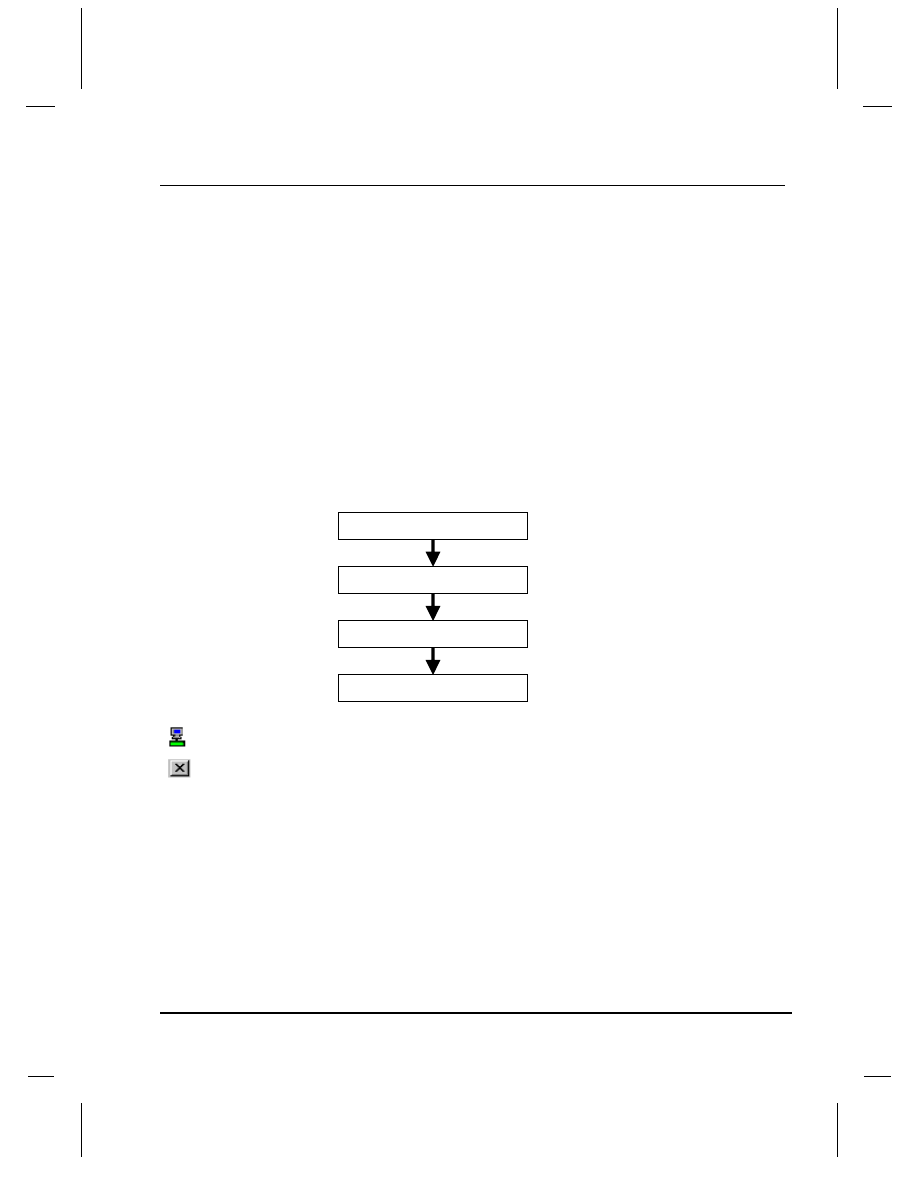
Shutting Down the eSignal Data Manager
When you start MetaStock, all other software that MetaStock needs to collect
online and real-time data is started automatically. Likewise, if any of the
necessary programs are shut down while MetaStock is running, they are
restarted automatically. The following diagram represents the relationship
between these programs.
Each program detects whether or not the next program is running, and
launches it if it is not.
When you exit MetaStock, you are asked if you want to shut down the File
Server. If you choose Yes to shut down the File Server, the Data Server will
be shut down also. The Data Manager will remain running, however, so your
other eSignal software can continue to receive data. To shut down the Data
Manager, double-click the Data Manager icon on the task bar, then click the
Close button in the top right corner of the Data Manager window.
MetaStock
MetaStock File Server
Equis Data Server
Data Manager
Data Manager icon
Close button
62
❖ eSignal Features
Getting Started with MetaStock 10.0
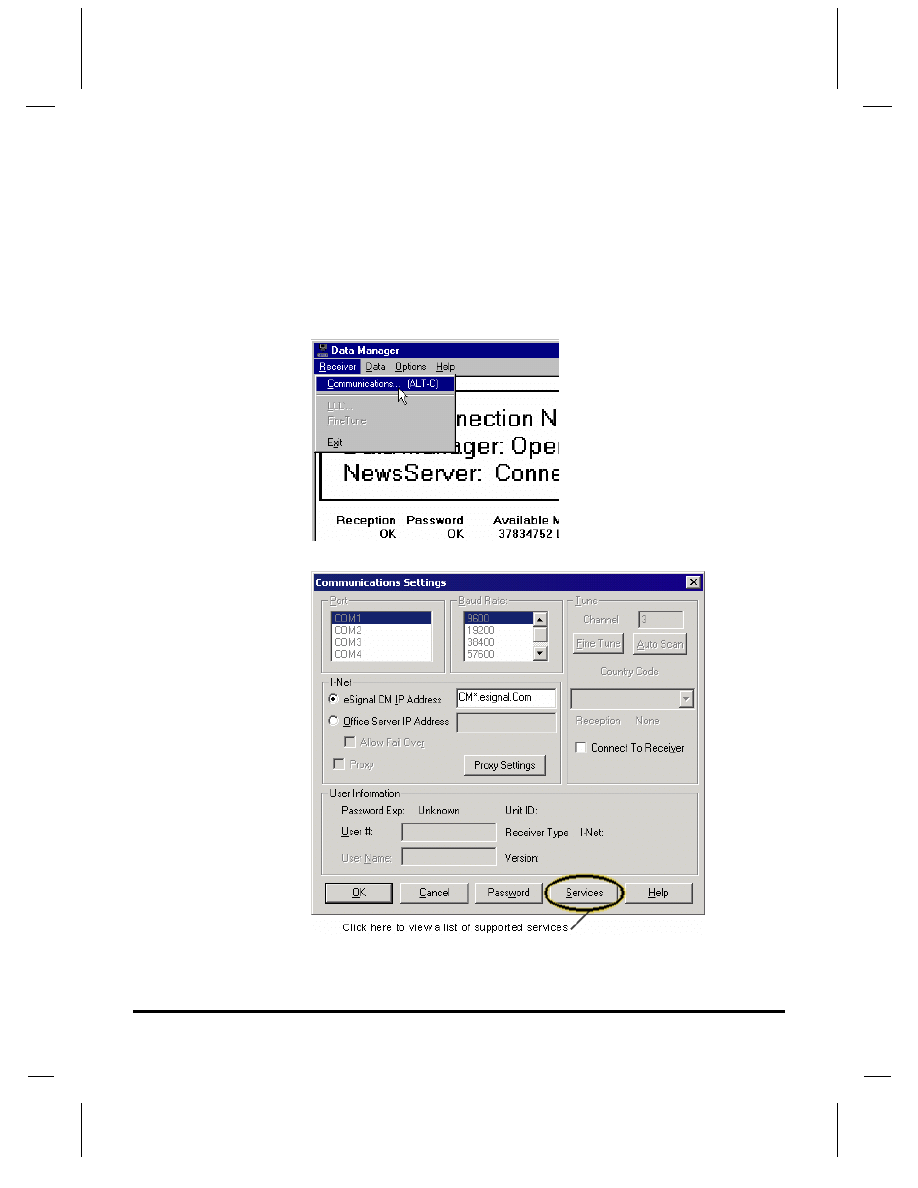
The Equis Services Bit
When you subscribe to the eSignal data service, you choose what services you
will be using. One of those is Equis Services. There is no additional charge
for this service, but it must be enabled before you can receive quotes in
MetaStock.
To verify that Equis Services has been enabled:
1. Open the eSignal Data Manager and select Receiver>
Communications
.
2. Click Services to view the list of services that have been enabled.
Getting Started with MetaStock 10.0
eSignal Features
❖ 63
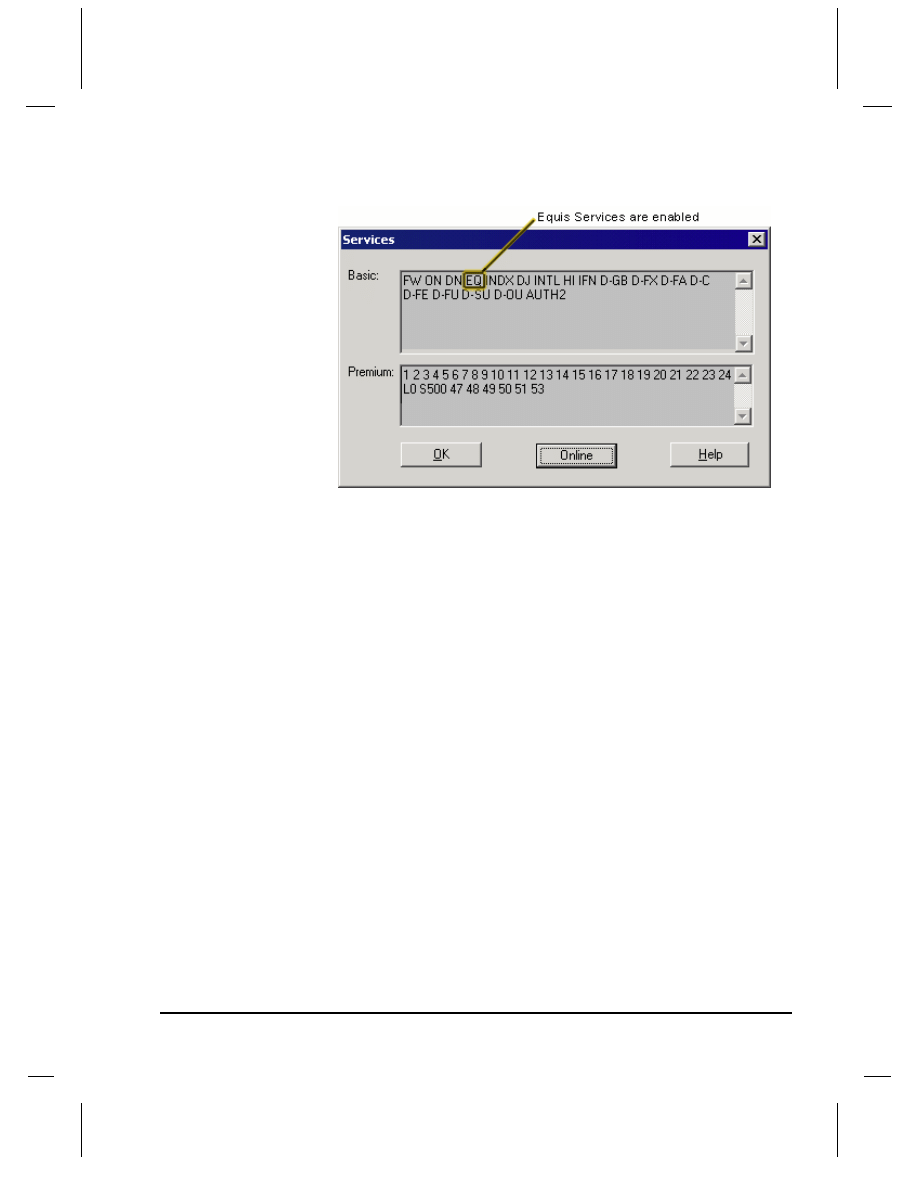
3. Look for the letters EQ in the
Basic services
box at the top of the dialog.
If you do not see the letters EQ in your basic services box, you should contact
eSignal and ask them to enable Equis Services on your account. You may
also add services to your account using the eSignal web site:
www.eSignal.com.
64
❖ eSignal Features
Getting Started with MetaStock 10.0
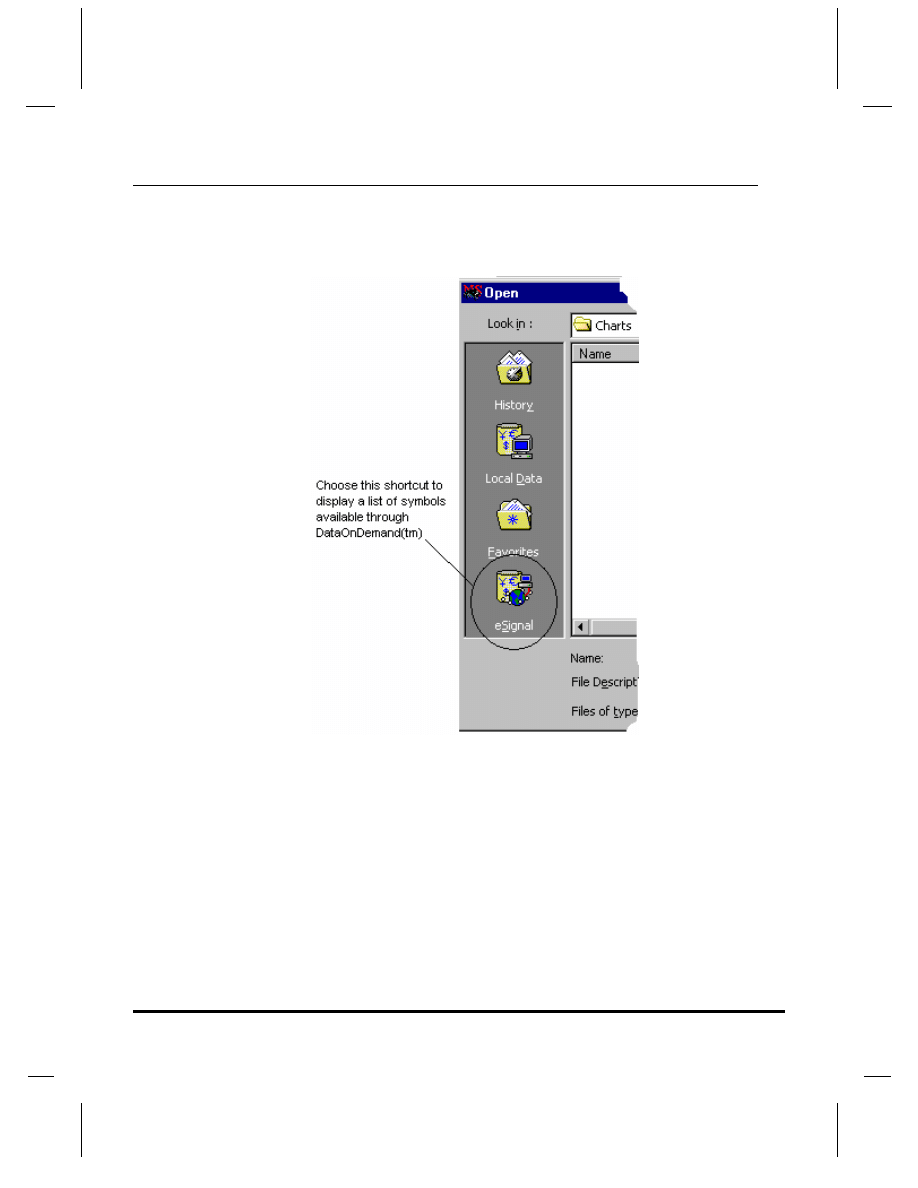
eSignal Symbols
If you are using DataOnDemand™ with eSignal, you can find a list of all
securities available for charting by choosing the eSignal shortcut in the Open
dialog of MetaStock.
Symbols available for real-time or end-of-day collection can be found in the
Symbol Database. Choose File>
New> Security
in MetaStock or
The DownLoader. In the New Security dialog, click Look-up to display the
Symbol Database.
Getting Started with MetaStock 10.0
eSignal Features
❖ 65
Symbol Database Updates
Each month, the Symbol Database is updated on the Equis International web
site. To automatically update this list, select Tools>
Update Symbol
Database
in either MetaStock or The DownLoader.
Wyszukiwarka
Podobne podstrony:
Strona tytułowa, Finanse, Metastock, Manual Metastock 7.2 PL
manual metastock
PRO LAT31 10 03 09A ppt
OptionScope, Finanse, Metastock, Manual Metastock 7.2 PL
Suplement, Finanse, Metastock, Manual Metastock 7.2 PL
Strona tytułowa, Finanse, Metastock, Manual Metastock 7.2 PL
New major data package version 10 0 (MCU SW 5 03 21) for T Mobile
manual smash pro v1 0 1
manual isone pro surround v1 0 1
FileMaker Pro Advanced 10 SN
Korg Trinity Manual Operating System version 2
manual barricade pro v1 0 3
manual fsynth pro v1 0 2
Korg SQ 10 Service Manual
Regul przedm Dr Uk Kom II Pro 10, Regulamin przedmiotu RUCH DROGOWY dla specjalności LTS
10 TRIHAL TECHN MANUAL
KG 659E Updated version Programming manual
Epson Stylus Pro 9000 Auto Take Up Reel Unit Manual
10 secrets de traders pro
więcej podobnych podstron