Grid Impact of a 20 kW Variable Speed Wind Turbine
T. Thiringer, W. Hesse, A. Grauers, R. Ottersten, T. Petru
torbjorn.thiringer, wolfgang.hesse, anders.grauers, rolf.ottersten, tomas.petru@elkraft.chalmers.se
Department of Electric Power Engineering
Chalmers University of Technology, S-412 96 Gšteborg, Sweden
Abstract:
The power quality impact of a 20 kW direct-driven variable speed wind turbine equipped with passive blade
pitching has been investigated. The electrical system of the turbine consists of a 66-pole permanent magnet synchronous
generator, a diode rectifier and a thyristor inverter. The turbine causes a relatively high flicker in the medium wind
speed range, but small changes in the dc-link can reduce this. The voltage distortion is small while the harmonic
current injection reaches 10Ê% at rated wind speed. The investigation also shows that the passive pitch system allows
high power quality.
1. INTRODUCTION
One very important issue when wind turbines are
installed, is the power quality influence that the wind
turbine has on the grid. Fixed-speed wind turbines often
produce a large power pulsation [1-2] which may cause
flicker on the grid.
The fact that some wind turbines produce strongly
varying output power has lead to high connection costs
for wind turbines. Today, in Sweden, the cost for grid
connection is up to 20 % of the total cost of the wind
turbine. By using more grid-friendly turbines and
demonstrating that these can be connected to weaker grids
would, in many cases, give a substantial cost reduction
for the connection of wind turbines to the grid and
probably make variable-speed wind turbines more cost
competitive.
Variable-speed wind turbines have the drawback that
they have been too expensive. One of the reasons for this
is that active pitch control is needed in order to operate at
variable speed at higher wind speeds. Especially for small
turbines, the cost for an active pitch mechanism is high.
The Pitch Wind turbine is equipped with a special
pitching concept, passive pitching, which makes it
possible to operate this turbine at variable speed at all
wind speeds, although this turbine lacks an active pitch.
The pitching is obtained by pre-strengthened springs that
make the blades pitch as the speed of the turbine
increases.
The purpose of the investigation is to evaluate the
power quality impact of the 20 kW PitchWind wind
turbine. The interesting power quality aspects are the
grid voltage influence, flicker contribution and harmonic
current injection.
2. THE PITCHWIND TURBINE
The investigated turbine is equipped with a passive
pitching mechanism. The blade tips are pitchable and
mounted with a pre-tensioned torsion spring on the inner
blade. At rated turbine speed, the forces on the blade tips
exceed the torque of the torsion springs and the blade tip
starts to pitch. The pitching mechanism is designed to
keep the turbine speed almost constant above rated wind
speed.
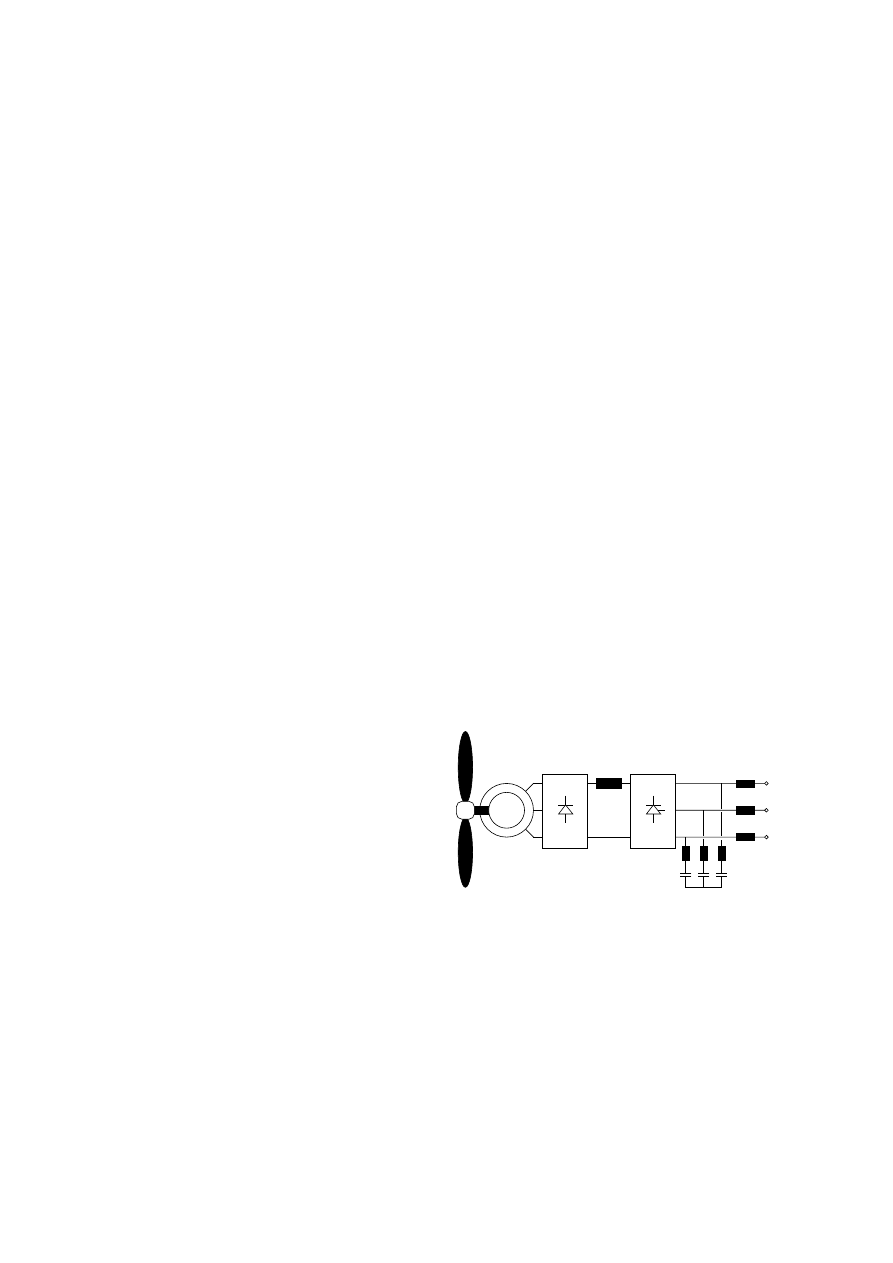
The electrical system of the PitchWind turbine is
presented in Figure 1. It has been designed for a
permanent magnet direct-drive generator. To allow
variable speed, a diode rectifier is used. The dc current is
smoothed by a dc inductor and then the dc current is
inverted into 50 Hz by a thyristor inverter. Since the
thyristor inverter consumes reactive power and produces
current harmonics a combined phase compensation and
5:th harmonic filter is used. This electrical system has
been used because it can easily be made of standard parts,
it is cheap and efficient. In the future, a PWM inverter
system will be developed to improve power quality.
Diode
rectifier
Thyristor
inverter
DC
inductor
66-pole
generator
PM
Harmonic
filter
400 V grid
Figure 1. The electrical system of the Pitch Wind
turbine.
At low wind speeds the generator current, and
thereby, the power, is controlled as a function of the
generator speed. At 8 m/s the turbine reaches 75 rpm.
Above rated wind speed, the generator current is kept
constant, which leads to a power which varies slightly
with the turbine speed, even above rated wind speed. If
perfectly smooth power is desired above rated speed, it
can be obtained by controlling the power instead of the
generator current.
3. THE MEASUREMENT SYSTEM
The instantaneous values of the three phase currents
and voltages, the rotor speed and the wind speed are
recorded on a rapid data acquisition system. The rotor
speed is obtained by measuring the generator frequency.
The wind speed is measured using a wind speed sensor at
hub height, 40 m west of the wind turbine.
The signals are filtered and sampled simultaneously by
the data acquisition system. For the flicker evaluation, a
sampling frequency of 250 and 700 Hz is used with a
104ÊHz filter and for the harmonic analysis a sampling
frequency of 10ÊkHz with a 2ÊkHz filter is used.
4. MEASUREMENTS
Power quality is a very broad concept. For wind
turbine applications, three aspects are of particular
interest: voltage level influence, flicker contribution and
harmonic current injection.
4.1 Steady-state performance
In Figures 2 and 3, the 1 minute average values of the
power versus wind speed and the reactive power versus
active power are presented. It can be noted that the
turbine only reaches 16 kW, which indicates the need of
pitch-spring adjustment. However, as the maximum
power level is reached, the turbine sticks to it very well.
Compared with a fixed-speed stall regulated turbine, the
average value is much more constant above rated wind
speed. Compared with fixed-speed turbines and especially
pitch-regulated such, the ratio of instantaneous peak
power values to mean power is much lower for this
turbine. From Figure 3 it can be observed that the
harmonic filter produces 10 kVA which gives a very
good power factor at wind speeds above 5 m/s. As the
power increases, the reactive power surplus produced by
the harmonic filter decreases and for power levels above
10ÊkW, the turbine starts to consume reactive power.
This has the advantage that the voltage influence is
reduced on most grids, since the voltage increase due to
0
5
10
15
20
0
2
4
6
8
10
12
14
16
18
Wind speed (m/s)
Electric Power (kW)
Figure 2. Steady-state performance of the turbine.
0
5
10
15
20
-15
-10
-5
0
5
10
Electric Power (kW)
Reactive Power (kVA)
Figure 3. Reactive versus active power (circles are
without grid filter and stars with grid filter)
active power is somewhat compensated by the voltage
drop caused by the reactive power. In Figure 4, the
steady-state voltage level influenced by the wind turbines
for various different grids is presented. The short-ciruit
capacity of the grid used in this calculation is 340 kVA,
20 times the maximum average production of the turbine.
2
4
6
8
10
12
14
16
18
20
0
1
2
3
4
5
Wind speed (m/s)
Voltage variation (%)
X/R=0.33
X/R=1
X/R=5
Figure 4. Steady-state voltage level influence by the Pitch
Wind Turbine on various grids.
As can be noted in Figure 4, the turbine has the
highest influence on the grid voltage at low X/R-ratios.
This is a typical situation if we have long cables. In the
case of the present location of the turbine, the
transformer is located after 420 m of cables which gives
an X/R-ratio of 1. The variation in voltage level is, for
the grid with an X/R-ratio equal to 1, only 1% as the
wind speed changes.
4.2 Power variations
In Figure 5, typical time series of the power
production are presented for the PitchWind turbine at
6Êm/s and at 12Êm/s. It can be observed that the turbine
power is very close to 15-16 kW during 25 minutes of
wind speed of 12 m/s. At the lower wind speed, the
turbine follows the wind, trying to capture as much
energy as possible, and thus, the output power is more
uneven. A difference compared with fixed-speed turbines
is that periodic power components caused by the blade
0
5
10
15
20
25
0
5
10
15
20
Time (min)
Electric Power (kW)
Figure 5. Power versus time for the Pitch Wind turbine,
gray=6 m/s, black=12 m/s.
rotation are not present. Another difference is the fact
that the instantaneous peak power values are relatively
much lower for this turbine. With a control limiting
generator power above rated wind speed, instead of
generator current, the power variations for this type of
turbine can, in fact, become zero at full power.
Figure 6 presents the spectrum of the power for the
cases shown in Figure 5. It can be observed that there are
no distinct components present in the spectrum as in the
case of fixed-speed turbines [1,2]. However, due to the
control system some frequencies are somewhat amplified,
unfortunately in the region sensitive to flicker. This can
be seen since the spectrum between 0.5-10ÊHz is higher
for the low wind speed case, in which the current control
is active, than for the high wind speed case, in which the
current is kept constant. The increase in power variations
around 3 Hz originates from the fact that rotor speed
varies. At lower speeds, rotor speed changes much more,
and thus, this amplification is higher for lower wind
speeds. The low-frequency variations are higher for high
wind speed than for low wind speed. This is because wind
variations are higher at high wind speeds.
4.3 Voltage variations-Flicker
A method of describing the voltage quality is to
determine the short-term flicker value, Pst. First,
measured Pst values are derived directly from the
measured voltages using the algorithm presented in [3].
This method not only includes the flicker contribution
from the turbine, but also flicker caused by other sources
in the grid. The result is presented in Figure 7.
These flicker values are in fact rather high for medium
wind speeds, more than for many fixed-speed turbines. A
reason for this seems to be sub-harmonics originating
from the generator frequency. Below, the flicker values
without sub-harmonics will also be calculated.
10
-1
10
0
10
1
10
-3
10
-2
10
-1
frequency (Hz)
Power (kW)
Figure 6. Spectrum of the power for the Pitch Wind
turbine, gray=6 m/s, black=12 m/s..
2
4
6
8
10
12
14
0.1
0.15
0.2
0.25
0.3
0.35
0.4
0.45
0.5
Wind speed (m/s)
Measured Pstvalue
Figure 7. Pst as a function of wind speed, direct method.
To determine how much flicker impact only the
turbine has on the grid, the calculated voltage impact is
used instead of the measured grid voltage. Power
pulsation in combination with reactive power will cause
voltage variations on the grid. The voltage deviations are
calculated as
DU = Rgiq + Xgid
where
DU is the calculated voltage deviation, Rg is the
grid resistance, Xg the grid reactance and iq and id are
the instantaneous active and reactive currents. Figure 8
presents the Pst-values from the calculated voltage
variations caused by the wind turbine.
0
5
10
15
20
0.05
0.1
0.15
0.2
0.25
0.3
0.35
0.4
0.45
0.5
Wind speed (m/s)
Calculated Pstvalue
Figure 8. Calculated Pst as a function of wind speed,
direct method.

As can be observed, the flicker contribution from the
wind turbine is somewhat lower then the flicker
measured on the grid. This is quite natural, since other
disturbances exist on the grid. When the wind turbine was
shut off, the Pst-values were between 0.07 and 0.15.
The high flicker values are partly caused by uneven
power production, but also the fact that sub-harmonic
currents originating from the diode rectifier are emitted
by the electrical systems. These sub-harmonics have
frequencies between 30-70 Hz. With an improved dc-link
filter sub-harmonics can be avoided and the turbine will
then cause lower flicker values.
5. 3 Harmonic current injection
Since the wind turbine is equipped with a thyristor
inverter, harmonic currents are injected into the grid.
The grid filter decreases the harmonic current injection,
but of course, there are still current harmonics injected
into the grid. Table 1 presents the harmonic voltage level
on the grid and the injection of harmonic currents as a
function of power level. The voltage harmonics are
expressed as percentage of the actual grid voltage while
the current harmonics are presented as percentage of the
grid current at 15 kW.
Table 1. Harmonic voltages and currents.
Power (kW)
3rd
5th
7th
11th
13th
17th
19th THD
5
0,21
0,41 0,31
0,45 0,15
0,26
0,15 0,91
10
0,13
0,42 0,29
0,43 0,33
0,47
0,36 1,14
15
0,10
0,28 0,12
0,53 0,44
0,61
0,52 1,38
Power (kW)
3rd
5th
7th
11th
13th
17th
19th
TDD
5
0,86
3,34
0,42
1,88 0,06
1,22
0,60
4,36
10
1,00
5,28
2,39
3,48 0,22
2,30
1,55
7,91
15
0,92
6,80
3,77
4,37 0,44
2,98
2,25
10,5
It can be seen that the voltage distortion is below
1.38Ê%, while the Swedish standard allows 6Ê%.
The harmonic current injection is 10% of the full-load
current, which is higher than the 5 % recommended by
IEC [4]. Although higher current distortion can be
accepted if the over-all power quality on the grid is low
enough, a PWM inverter with much lower current
harmonics will be developed.
6 CONCLUSIONS
The investigation shows that the passive pitching
concept works well. The power-quality problems are
mainly caused by the electric and control systems and can
rather easily be avoided.
The investigation shows that the Pitch Wind turbine
produces a smoother output power compared with fixed-
speed turbines at high wind speeds. The flicker level at
medium wind speeds is higher than for many fixed-speed
turbines due to the presence of sub-harmonics,
originating in the diode rectifier. The flicker situation
may be improved by better filtering on the dc-link.
A further improvement may be obtained by low-pass
filtering the power control reference value. In this way,
power pulsation become lower at lower wind speeds.
However, this will lead to a minor loss of energy capture,
since the turbine will operate more on the side of the
optimal Cp-
l value.
The used thyristor inverter causes low voltage
distortion. However, due to high current distortion a
PWM inverter will improve the power quality.
7. REFERENCES
[1]
G. Gerdes, F. Santjer, "Power quality of wind
turbines and their interaction with the grid",
Proceedings of the European Wind Energy
Conference, 10-14 Oct 1994, Thessaloniki, Greece,
pp. 1112-1115
[2]
T. THIRINGER "Power quality measurements
Performed on a Low-Voltage Grid Equipped with
Two Wind Turbines", IEEE Transactions on
Energy Conversion, Vol. 11, No. 3, pp. 601-606,
September 1996
[3] International Electrotechnical Commision,
IEC
Standard 868.
[4] International Electrotechnical Commision,
IEC
Standard 61800-3, 1996.
Wyszukiwarka
Podobne podstrony:
[2001] State of the Art of Variable Speed Wind turbines
Control Issues Of A Permanent Magnet Generator Variable Speed Wind Turbine
[2001] State of the Art of Variable Speed Wind turbines
[2001] State of the Art of Variable Speed Wind turbines
Innovative Solutions In Power Electronics For Variable Speed Wind Turbines
20050253396 Variable Speed Wind Turbine Generator
20050253396 Variable Speed Wind Turbine Generator
Variable Speed Control Of Wind Turbines Using Nonlinear And Adaptive Algorithms
Lqg Multiple Model Control Of A Variable Speed Pitch Regulated Wind Turbine
A Cage Induction Generator Using Back To Back Pwm Converter For Variable Speed Grid Connected Wind E
Modeling Of The Wind Turbine With A Doubly Fed Induction Generator For Grid Integration Studies
Noise propagation path identification of variable speed drive in time domain via common mode test mo
DIN 61400 21 (2002) [Wind turbine generator systems] [Part 21 Measurement and assessment of power qu
Ecological impacts of wind energy
więcej podobnych podstron