
1
Causes and consequences of
immune dysfunction in the
virologically controlled HIV
patient

2
Morbidity and mortality in the virologically
controlled patient
Patients who have achieved long-term viral load control on HAART are
now increasingly experiencing premature onset of diseases associated
with aging, such as
•
cardiovascular (CV) disease
•
non-AIDS cancers
•
liver disease
•
renal disease
These serious non-AIDS diseases are being observed at an excess rate
compared to the general population
Persistent HIV-induced immune dysfunction appears to be associated
with this excess
Engels EA. AIDS 2009; 23:875-885.

3
Morbidity and mortality in the virologically
controlled patient
This slide set summarizes the following topics:
•
Changes in the patterns of morbidity and mortality in HIV-infected
patients since the introduction of HAART
•
Excess risk of serious disease and death vs the general population,
despite virologically effective HAART
•
The association between CD4+ T-cell count and chronic immune
activation with risk of serious non-AIDS disease/death
•
Limitations of HAART in restoring immune function
•
Potential mechanisms that may play a role in causing serious non-
AIDS diseases, such as CV disease, non-AIDS cancers and liver
disease
•
Promising directions for ongoing and future research

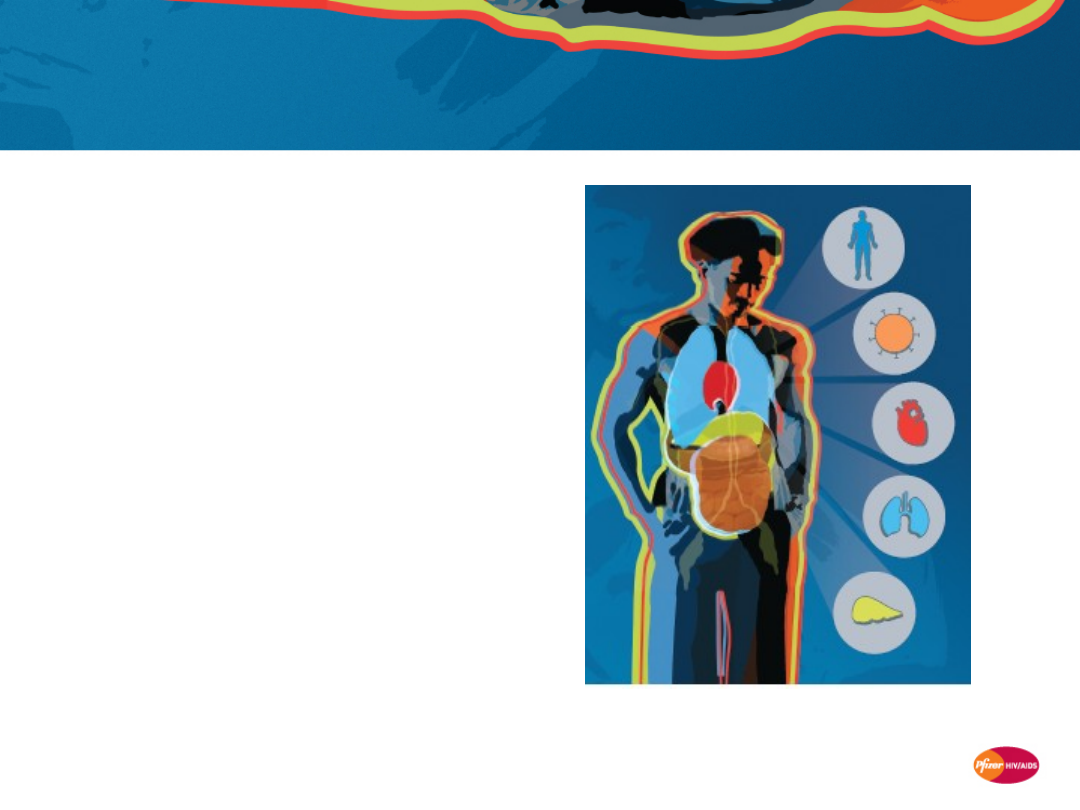
4
Mortality and morbidity in the
modern HAART era
5
Adapted from Lohse N, et al. Ann Intern Med 2007;146:87–95.
P
ro
b
a
b
il
it
y
o
f
s
u
rv
iv
a
l
Pre-HAART
(1995–1996)
Early HAART
(1997–1999)
Survival from age 25 years (N=3,990)
1
0.75
0.5
0.25
0
25
30
35
40
45
50
55
60
65
70
Age, years
Late HAART
(2000–2005)
Population
controls
Patients in the HAART era have at least a 10-year
shorter expected survival than age- and gender-
matched controls

6
Life expectancy of HIV-infected patients in the
HAART era remains shorter than that of the
general population*
Cohort(s)
Country
Patient
population
Time period
Impact of HIV infection on survival
APROCO and
Aquitaine
1
France
2,435 HIV-
infected
patients
1997–2005
• Age- and gender-adjusted overall
mortality 7-fold higher in HIV+ vs general
population
DHCS
2
Denmark
3,990 HIV-
infected
patients
1995–2005
• Median survival after age 25 years for
HIV+ was only 20 years vs ~51 years for
general population
CASCADE
3
Europe,
Canada,
Australia
7,680 HIV-
infected
patients with
known dates of
seroconversion
Up to 2006
• Similar mortality to the general
population in the initial 5 years from
seroconversion, but a significant mortality
excess in HIV patients over the longer term
(5.2% in the first 10 years after
seroconversion among patients 15–24
years of age)
* HIV-negative age- and gender-matched controls
1. Lewden C, et al. JAIDS 2007; 46:72-77.
2. Lohse N, et al. Annals of Internal Medicine 2007; 46:87-95.
3. Porter K, et al. 15
th
CROI 2008; Abstract 14.
7
Survival on HAART is similar to the general
population only if CD4+ counts are ≥500
cells/mm
3
for ≥6 years
Lewden C, et al. J Acquir Immune Defic Syndr 2007; 46:72–77.
* Standardized mortality ratio =
(adjusted for age and gender)
APROCO and Aquitaine cohorts
S
ta
n
d
a
rd
iz
e
d
m
o
rt
a
li
ty
r
a
ti
o
*
Years with CD4+ T-cell count ≥500
cells/mm
3
Mortality in HIV-infected patients
Mortality in general population
0
0.5
1
1.5
2
2.5
3
3.5
4
0
1
2
3
4
5
6
7
N=2,435
8
An emerging model of HIV-induced immune
dysfunction
Continued
Uncontrolled viral
replication and
CD4+ depletion
Death from
AIDS/OIs
H
A
A
R
T
D
e
cr
e
a
se
d
v
ir
a
l
lo
a
d
/
in
cr
e
a
se
d
C
D
4
+
T
-c
e
ll
co
u
n
t
U
n
d
e
te
ct
a
b
le
v
ir
a
l
lo
a
d
Pre-HAART era
1-4
Current HAART era
5,6
Shift to non-AIDS
related causes of
morbidity/
mortality e.g.
•
Heart disease
•
Non-AIDS
cancers
•
Liver disease
V
ir
a
l
re
p
li
ca
ti
o
n
/G
A
LT
d
e
st
ru
ct
io
n
In
cr
e
a
se
d
v
ir
a
l
lo
a
d
/d
e
cr
e
a
se
d
C
D
4
+
T
-c
e
ll
c
o
u
n
t
Initial HIV
Infection
1. Selik RM, et al. AIDS 2002; 29:378–387. 2. Baker RK, et al. JAIDS 2006; 43:27–34. 3. Smit C, et al.
AIDS 2006; 20:741–749.
4. Centlivre M, et al. AIDS 2007; 21:1–11. 5. Jacobson LP, et al. Curr HIV/AIDS Rep 2004; 1:74–81. 6. Aiuti
F, et al. AIDS Rev 2006; 8:88–97.
9
HOPS cohort: Deaths in the HIV patient
population are increasingly due to non-AIDS-
related causes
* P<0.001 1996 vs 2004
Palella FJ, Jr., et al. J Acquir Immune Defic Syndr 2006; 43:27–34.
1997
1996
1998
1999
2000
2001
2002
0
5
10
15
20
25
30
35
40
45
2003
2004
13
27
27
15
34
36
39
3
6
43
Year
N=6,945
P
e
rc
e
n
ta
g
e
o
f
d
e
a
th
s
a
tt
ri
b
u
te
d
t
o
n
o
n
-A
ID
S
-r
e
la
te
d
c
a
u
s
e
s
10
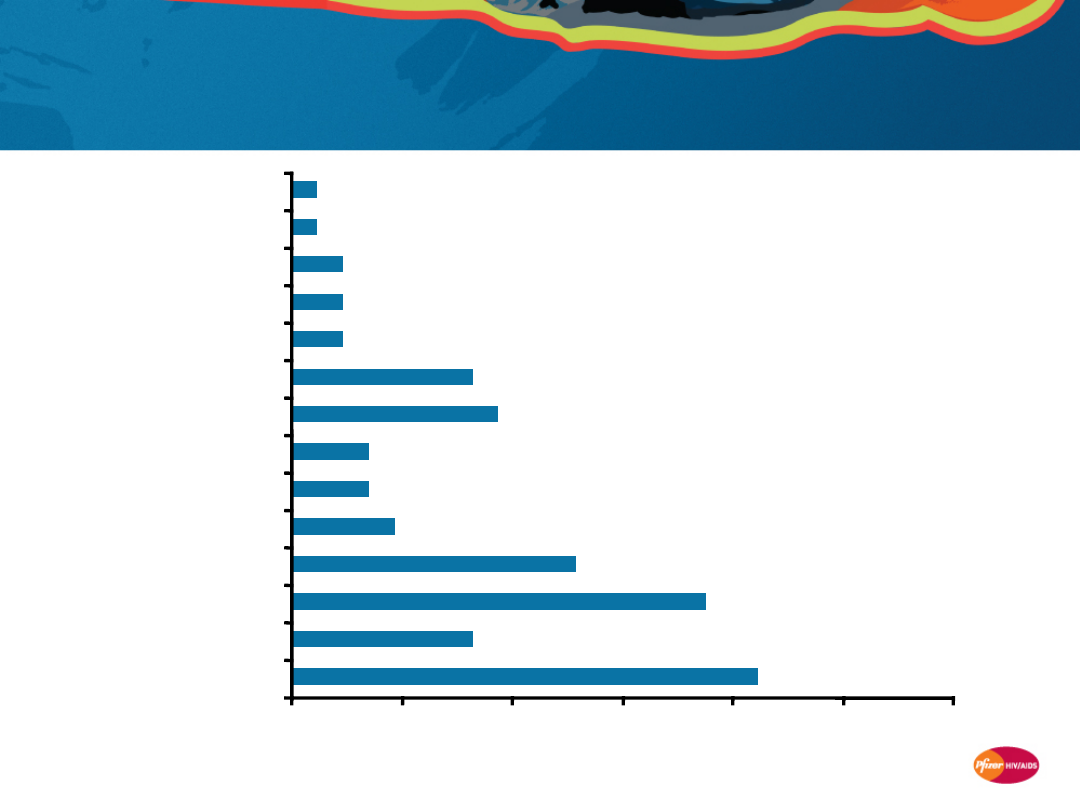
SMART study: Most deaths were due to
non-AIDS-defining events
SMART Study Group. NEJM 2006; 355: 2283–96.
0
5
10
15
20
25
30
Unknown
Opportunistic disease
Non-AIDS cancer
CV disease
Infection
Hepatic complications
Renal complications
Substance abuse
Accident/violent death
COPD
Hematological
Digestive system
CNS disease
Respiratory disease
Percent of deaths
N=5,472 (85 deaths)
11
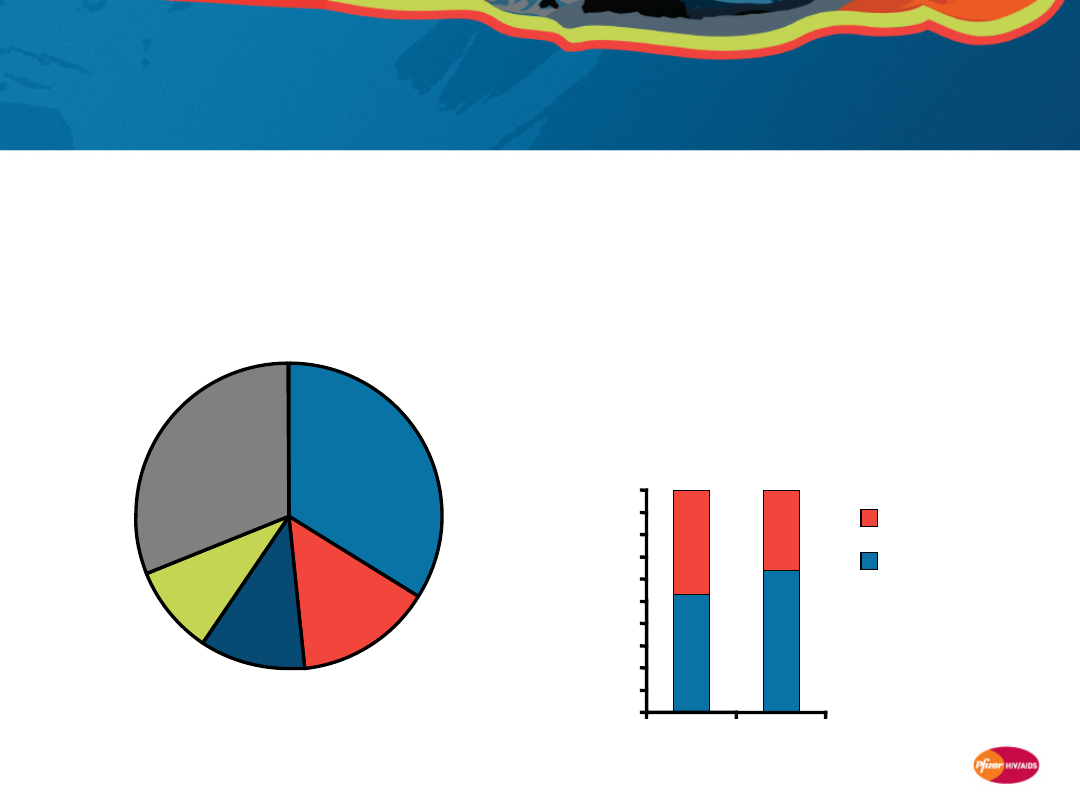
Mortality data from other cohorts confirm
increasing non-AIDS causes of death in HIV
patient population
D:A:D (Europe, Australia, USA)
1
•
23,441 HIV-infected patients, followed
up 1999–2004
•
855 of 1,246 deaths (69%) were non-
AIDS related
1. Weber R, et al. Arch Intern Med 2006; 166:1632–1641. 2. Hessamfar-Bonarek M, et al. 15th CROI 2008; Poster 666.
3. Lewden C, et al. Int J Epidemiol 2005; 34:121–30. 4. Bonnet F, et al. Clin Infect Dis 2009; 48:633–9.
AIDS-
related
Other
Liver-
related
CV or other
heart
diseases
Non-AIDS
cancers
33.8
%
31.1
%
14.5
%
11.0
%
9.4%
2005 Mortalité survey (France)
2–4
•
1,042 HIV-infected patients
•
The proportion of deaths due to non-
AIDS causes increased vs the 2000
survey
•
Leading non-AIDS causes of death in
2005 were
–
non-AIDS cancers
–
hepatitis C
–
CV disease
AIDS related
Non-AIDS related
53
64
47
36
0%
10%
20%
30%
40%
50%
60%
70%
80%
90%
100%
2000
2005
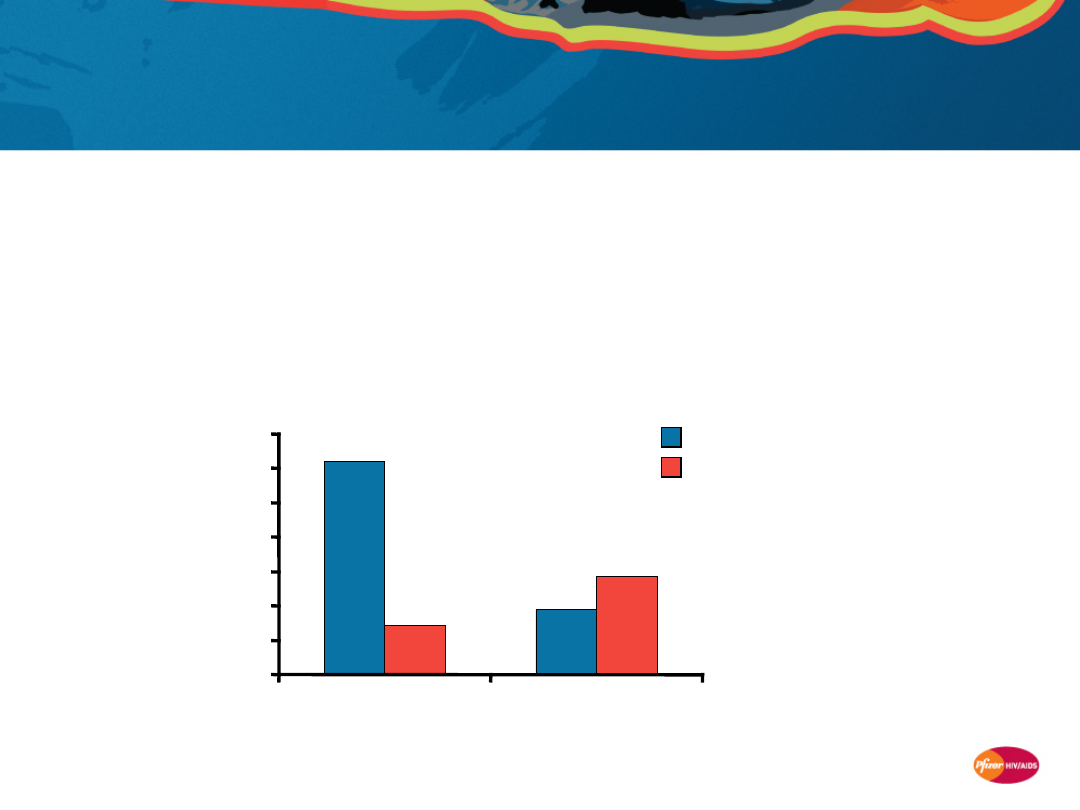
12
Increasing incidence of non-AIDS
hospitalizations confirmed in UK and US clinics
Brighton and Sussex University Hospitals (UK)
1
•
More than half (80/150) of HIV patient hospital admissions in 2006 were
non-HIV related
–
Most admissions in the pre-HAART era were due to an AIDS-defining illness
HOPS (USA)
2
•
7,155 HIV-infected patients in 10 US clinics
1. Soni S, et al. 14th BHIVA Conference 2008; Abstract P128.
2. Buchacz K, et al. AIDS 2008; 22:1345–1354.
%
h
o
s
p
it
a
li
za
ti
o
n
s
AIDS opportunistic infections
Chronic end-organ disease conditions
31.0
9.5
7.2
14.3
0
5
10
15
20
25
30
35
1994-1996
2003-2005
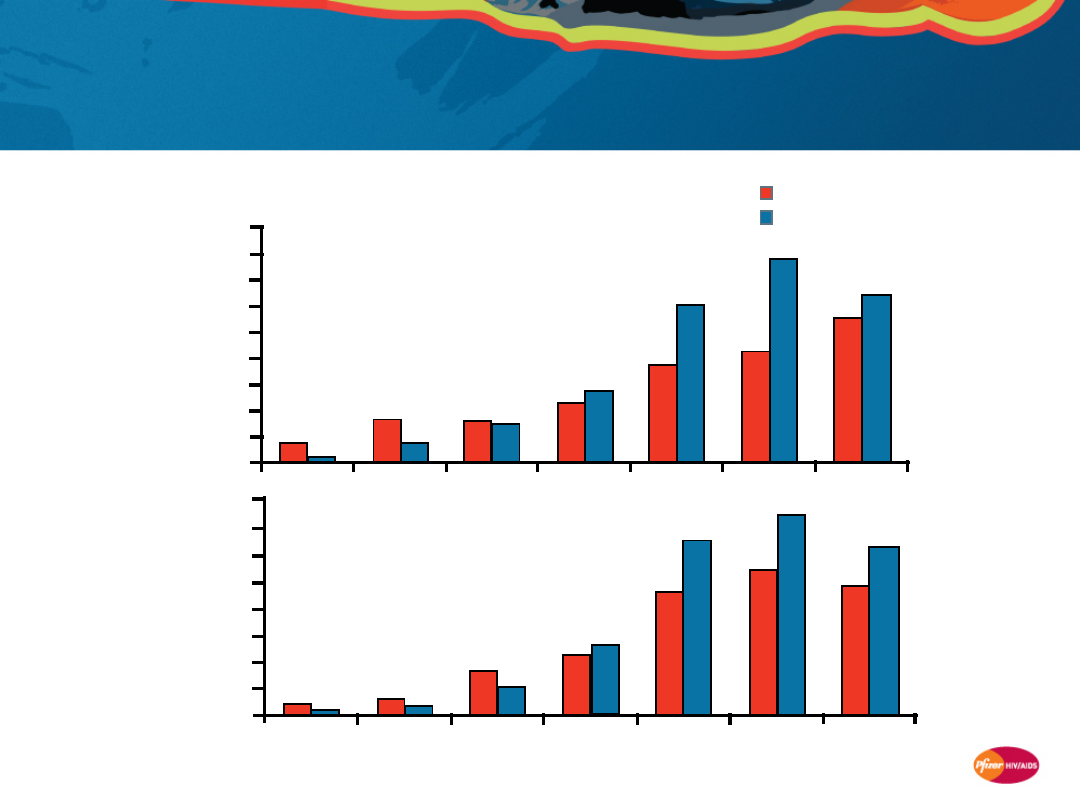
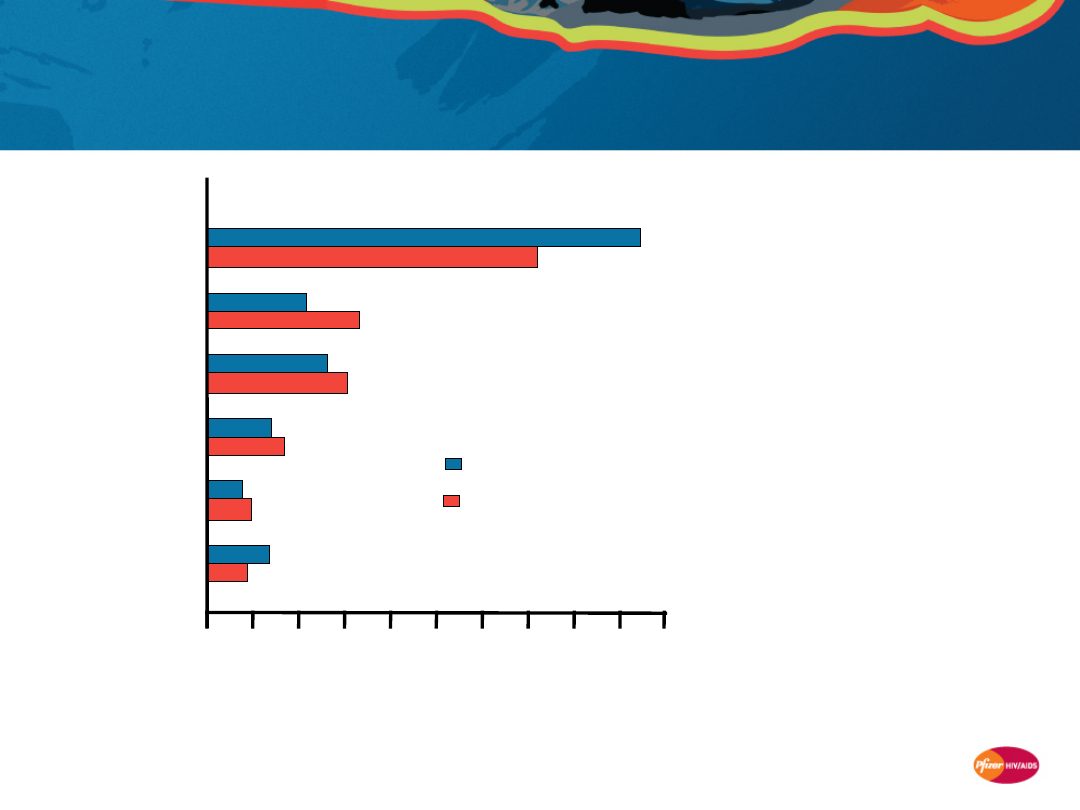
13
Coronary heart disease incidence in young HIV-
infected patients is higher than in non-HIV-
infected counterparts
Currier JS, et al. J Acquir Immune Defic Syndr 2003; 33:506–512.
California Medicaid population 1994–2000
(N=3,083,209)
*Relative risk (HIV infected vs HIV uninfected), P<0.05
Non-HIV infected (N=3,054,696)
HIV infected (N=28,513)
Age category
6.46
5.55
7.79
4.29
6.12
3.69
2.78
2.26
1.51
1.60
0.76
1.64
0.11
0.77
Men
25–34*
18–24*
35–44 45–54* 55–64* 65–74* 75+
0
1
2
3
4
5
6
7
8
9
In
c
id
e
n
c
e
p
e
r
1
0
0
p
e
rs
o
n
-y
e
a
rs
25–34*
18–24*
35–44* 45–54 55–64* 65–74
75+
0
Women
7.42
8
In
c
id
e
n
c
e
p
e
r
1
0
0
p
e
rs
o
n
-y
e
a
rs
6.30
4.81
5.43
6.49
4.55
2.58
2.21
1.03
1.72
0.42
0.64
0.16
0.40
1
2
3
4
5
6
7

14
Cohorts show an excess risk of non-AIDS
morbidity in HIV-infected patients vs the
general population
Cohort/Patient
population/Time period
Impact of HIV infection on risk
SHCS (Switzerland)
1
7,304 HIV-infected patients*
1985–2002
Non-AIDS cancers
•
17-fold Hodgkin’s lymphoma
Italian Registry of AIDS
2
12,104 HIV-infected patients
Up to 1998
Non-AIDS cancers
•
including anal cancer, lung cancer, brain tumors, Hodgkin’s
lymphoma, and leukemias
Linked population-based
AIDS and cancer registry
data (USA)
3
57,350 HIV-infected patients
1996–2002
Non-AIDS cancers
•
including Hodgkin’s lymphoma (standardized incidence ratio [SIR]:
5.6), lung cancer (2.6), and liver cancer (2.7)
ASD and HOPS (USA)
4
54,780 HIV-infected patients
1992–2003
Non-AIDS cancers
•
including anal cancer (SIR: 42.9), vaginal cancer (21.0), Hodgkin’s
lymphoma (14.7), liver cancer (7.7), lung cancer (3.3), and melanoma
(2.6)
VACS (USA)
5
33,420 HIV-infected veterans**
1997–2004
Liver disease and renal disease
* vs general population standardized for, age, gender, and reporting period
** vs age-, gender-, and race-matched HIV-uninfected veterans
1. Clifford GM, et al. J Natl Cancer Inst 2005; 97:425–432.
2. Dal Maso L, et al. Br J Cancer 2003; 89:94–100.
3. Engels EA, et al. Int J Cancer 2008; 123:187–194.
4. Patel P, et al. Ann Intern Med 2008; 148:728–736.
5. Goulet JL, et al. Clin Infect Dis 2007; 45:1593–1601.

15
Mortality and morbidity in the modern HAART
era: Summary
•
Despite virologic suppression, patients in the HAART era still have at
least a 10-year shorter expected survival than age- and gender-
matched controls
1
•
Expected survival is closely associated with CD4+ T-cell counts
–
if patients on HAART reach CD4+ T-cell counts of ≥500 cells/mm
3
for ≥6 years,
survival can be similar to the general population
2
•
Mortality and morbidity in the HIV patient population are
increasingly due to non-AIDS-related causes,
3–8
e.g.
–
liver-related diseases
–
cardiovascular/other related heart diseases
–
non-AIDS cancers
•
Several cohorts show an excess risk of non-AIDS morbidity in HIV-
infected patients vs the general population
9–13
1. Lohse N, et al. Ann Intern Med 2007;146:87–95. 2. Lewden C, et al. J Acquir Immune Defic Syndr. 2007;46:72–77.
3. Palella FJ, Jr., et al. J Acquir Immune Defic Syndr 2006; 43:27–34. 4. SMART Study Group NEJM 2006; 355: 2283–96.
5. Weber R, et al. Arch Intern Med 2006; 166:1632–1641. 6. Hessamfar-Bonarek M, et al. 15th CROI 2008; Poster 666.
7. Lewden C, et al. Int J Epidemiol 2005; 34:121–30. 8. Bonnet F, et al. Clin Infect Dis 2009; 48:633–9.
9. Clifford GM, et al. J Natl Cancer Inst 2005; 97:425–432. 10. Dal Maso L, et al. Br J Cancer 2003; 89:94–100.
11. Engels EA, et al. Int J Cancer 2008; 123:187–194. 12. Patel P, et al. Ann Intern Med 2008; 148:728–736.
13. Goulet JL, et al. Clin Infect Dis 2007; 45:1593–1601.

16
Association of immune response
with serious non-AIDS diseases
17
Immunologic response to HAART is an
independent predictor of clinical outcome
1–3
•
A lack of immunologic response
3–9 months after HAART initiation
in patients who respond
virologically was shown to be
associated with adverse long-term
clinical outcomes
1
•
Higher on-treatment CD4+ T-cell
counts have been associated with
lower rates of non-AIDS diseases
and AIDS
2
•
Mortality rates for AIDS-defining
cancers were 20.1 vs 0.1 per 1,000
patient-years and for non-AIDS-
defining cancers were 6.0 vs 0.6
per 1,000 patient-years when the
current CD4+ T-cell count was <50
vs >500 cells/mm
3
, respectively
3
1. Tan R, et al. J Acquir Immune Defic Syndr 2008; 47:553–558.
2. Baker JV, et al. AIDS 2008; 22:841-848.
3. Monforte A, et al. AIDS 2008; 22:2143–2153.
18
Proportion of deaths from non-AIDS causes is
increasing, but at CD4+ T-cell counts below
normal
Bonnet F, et al. Clin Infect Dis 2009; 48:633–9.
Lewden C, et al. JAIDS 2008; 48; 590-8.
2000 (N=964
deaths)
2005 (N=1,042
deaths)
42
205
227
338
337
156
Most recent CD4+ T-
cell count prior to
death (2005)
0
10
20
30
40
50
% of deaths
AIDS
Non-AIDS
cancer
Liver
related
Cardiovascular
Suicide
Non-AIDS-
defining
infection
-11%
+6%
+2%
+1%
+1%
-3%
Difference in %
deaths between 2000
and 2005
19
•
SMART
•
D:A:D
•
CASCADE*
•
FIRST
•
VACS
†
•
D:A:D
•
CASCADE
•
FIRST
•
Aquitaine
•
SMART
•
D:A:D
•
CASCADE
•
FIRST
•
SMART
•
FIRST
•
VACS
Cohorts/clinical studies suggest lower CD4+ T-cell
counts are associated with higher rates of non-
AIDS clinical events
Cardiovascular
disease
Non-AIDS cancer
Liver Disease
Renal disease
Goulet JL, et al. Clin Infect Dis 2007; 45:1593–1601.
Weber R, et al. 12th CROI, Abstract 595.
CASCADE Collaboration, AIDS 2006; 20:741–749.
Baker JV, et al. AIDS 2008; 22:841–848.
Weber R, et al. Arch Intern Med 2006; 166:1632–1641.
Bruyand M, et al. 15th CROI, Abstract 15.
El Sadr WM, et al. N Engl J Med 2006; 355:2283–2296.
* Cardiovascular disease or type 2 diabetes;
†
Vascular disease
Causes of
morbidity/
mortality:
Studies
suggestin
g
associatio
n with
lower
CD4+
count:
20
Current CD4+ T-cell count
(cells/mm
3
)
Philips A . AIDS 2008; 22:2409–2418.
1. CASCADE Collaboration. AIDS 2006; 20:741–749. 2. Weber R, et al. Arch Intern Med 2006; 166:1632–1641.
R
a
te
p
e
r
1
0
0
p
a
ti
e
n
t-
y
e
a
rs
(9
5
%
C
l)
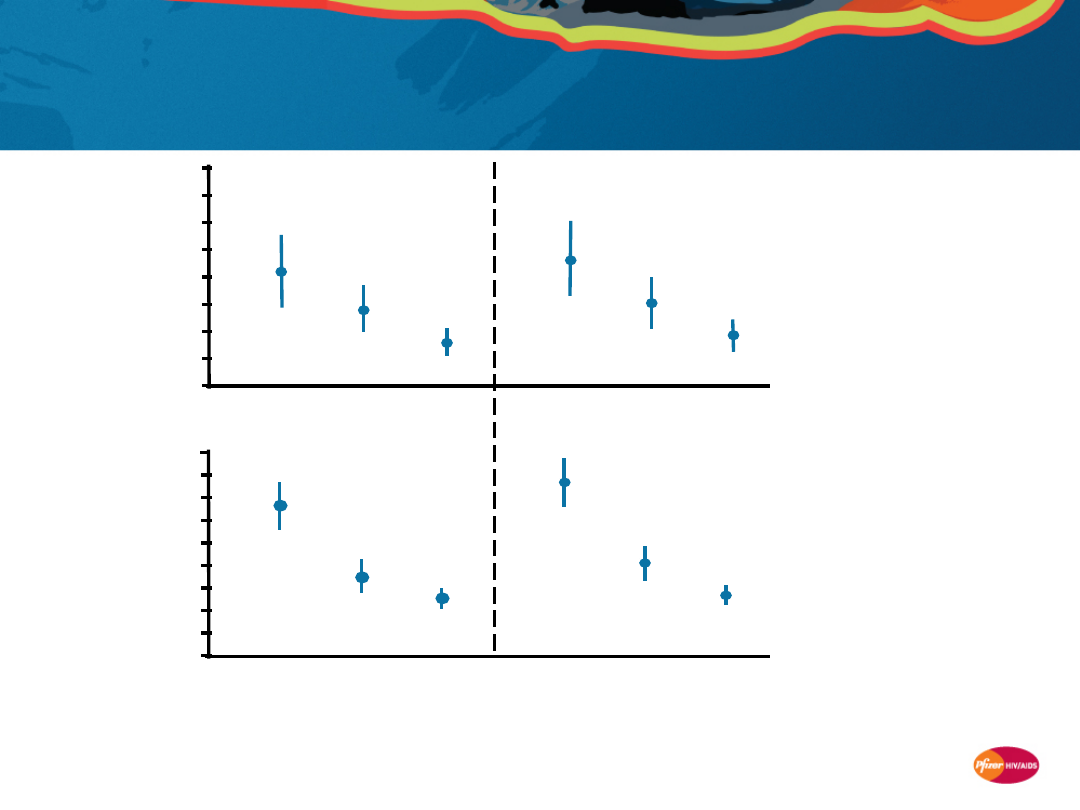
CASCADE
1
(N=7,680 [ART-
naive];
1,938 deaths)
Non-AIDS causes
1.6
1.2
0.8
0.4
0.0
D:A:D
2
(N=23,441;
1,246 deaths)
≥500
200–
349
All causes
0.0
1.6
1.2
0.8
0.4
CASCADE and D:A:D: Higher rates of death
from non-AIDS causes at lower CD4+ T-cell
counts
350–
499
≥500
200–
349
350–
499
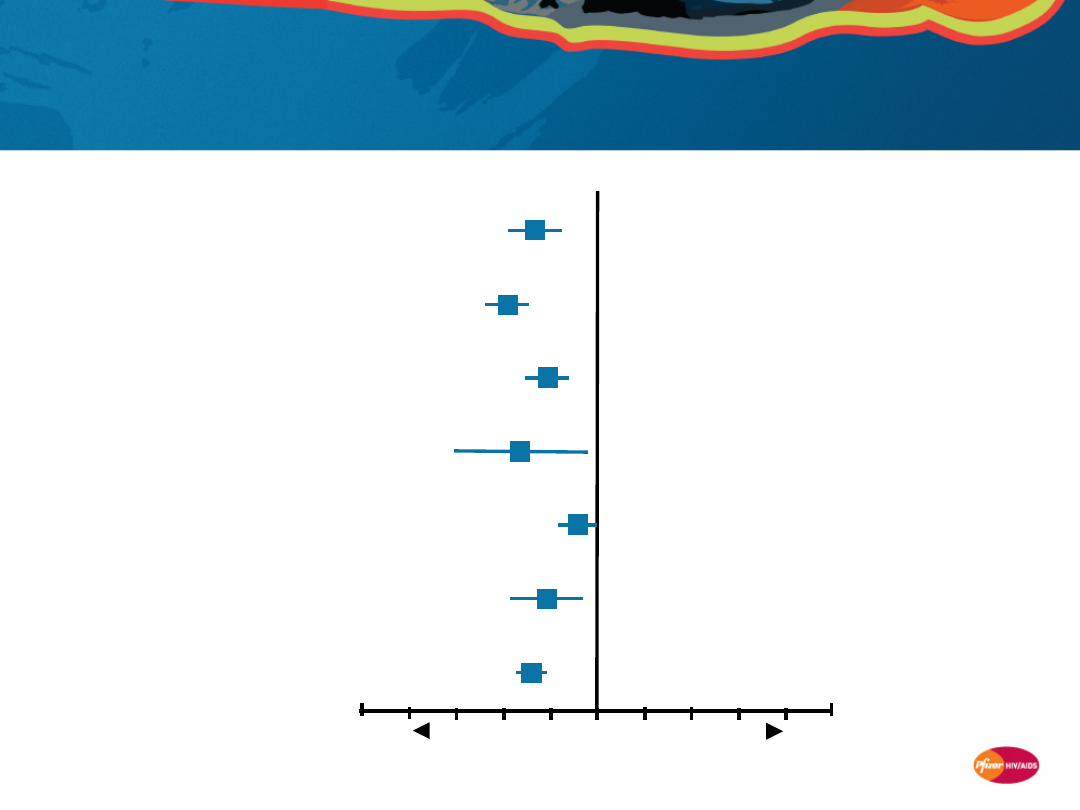
21
CASCADE: Lower risk of death from serious
non-AIDS diseases if CD4+ T-cell counts are
higher
CASCADE Collaboration. AIDS 2006; 20:741–749.
N=7,680 ART-naive patients
1,938 deaths (1997–2003)
Category
Hazard ratio* (95% CI)
* per 100 cells/mm
3
higher latest CD4+ T-cell count
† including accidents, suicide, overdose
(Un-)intentional
†
Cardiovascular disease/
diabetes mellitus
Unknown
Organ failure
Hepatitis/liver related
Other infections
Non-AIDS cancer
0.86
0.81
0.9
0.83
0.95
0.89
0.8
6
0.5
1.5
Lower risk
Higher risk
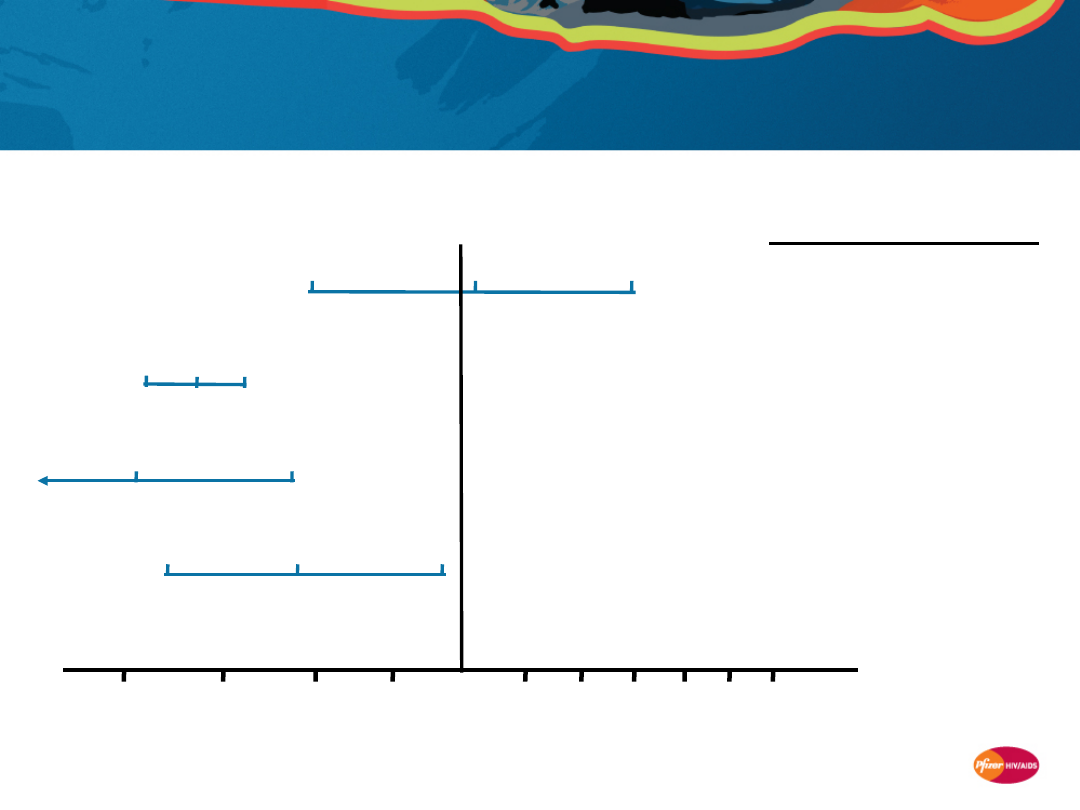
22
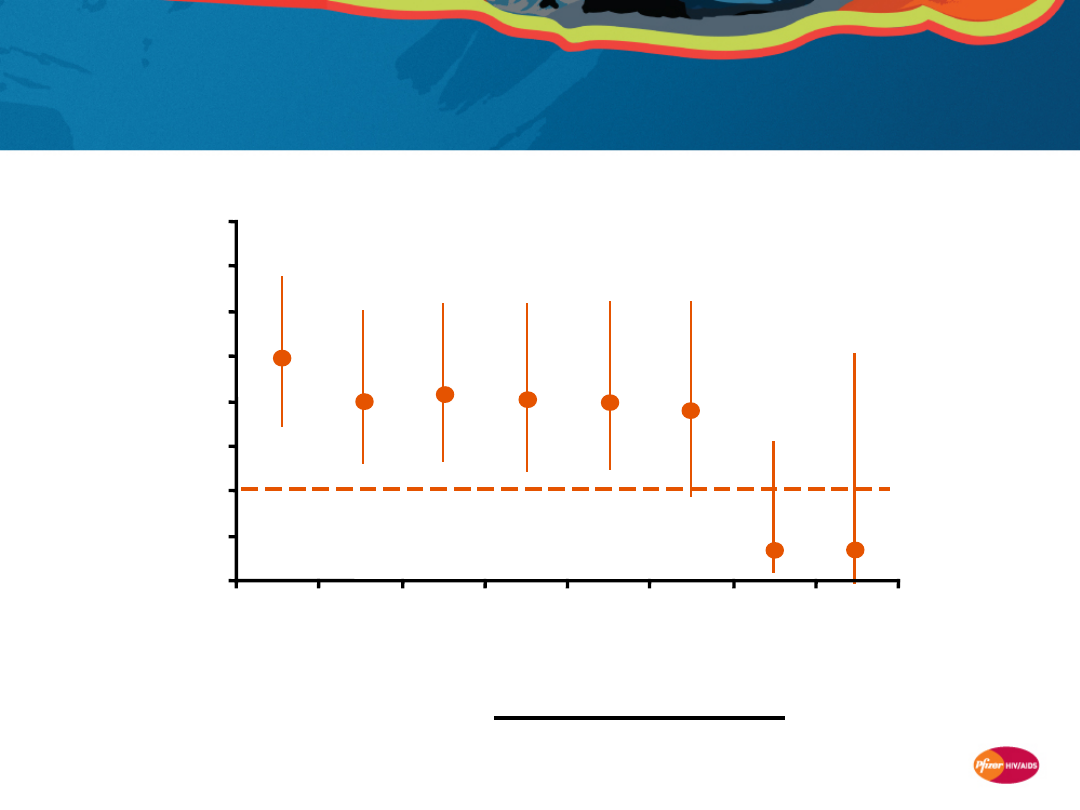
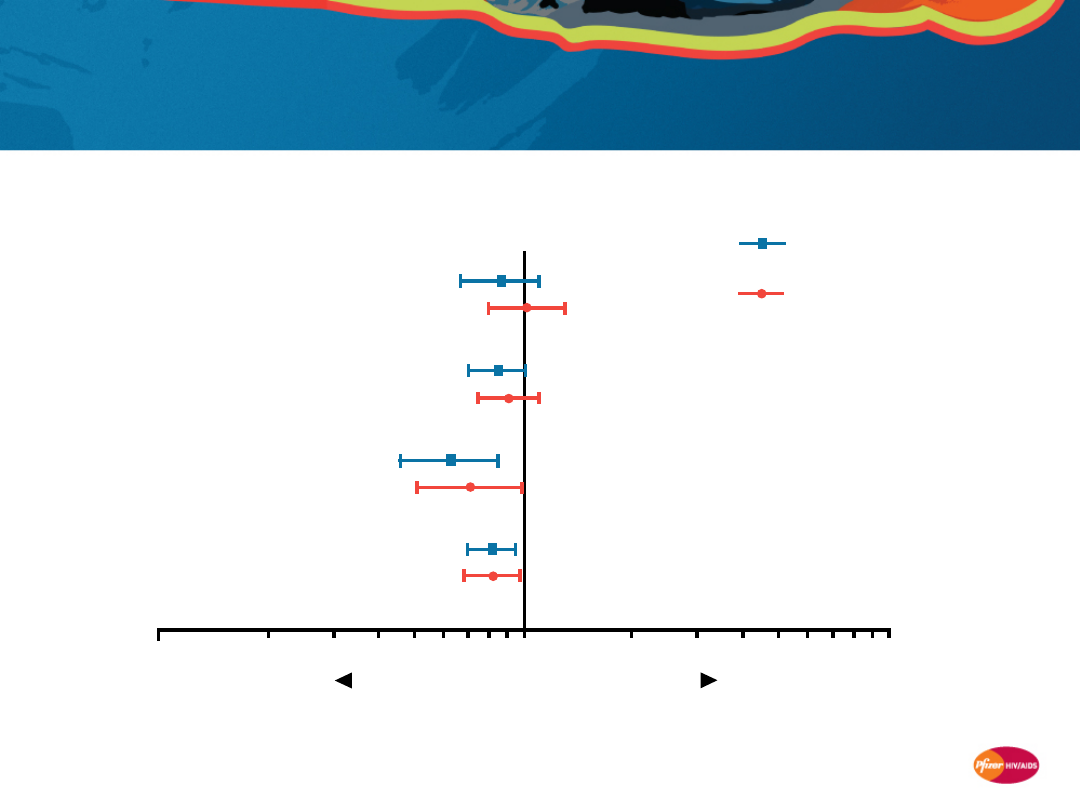
Baker JV, et al AIDS 2008; 22:841–
848.
Category
Patients
Hazard ratio (95% CI)
Liver
CV
Renal
Cancer
(non-AIDS)
14
24
14
32
0.1
1
10
Lower risk
Higher risk
0.87
1.02
0.85
0.91
0.63
0.71
0.81
0.82
Univariate
Multivariate
FIRST study: Risk for non-AIDS diseases is lower
in HIV-infected patients who have higher CD4+ T-
cell counts
* per 100 cells/mm
3
higher latest CD4+ T-cell count; multivariate
hazard ratios adjusted for latest HIV RNA and baseline
covariates: age, sex, race/ethnicity, prior AIDS, and HBV and
HCV co-infection
N=1,397 ARV-naive
patients
Hazard ratio* (95% CI)
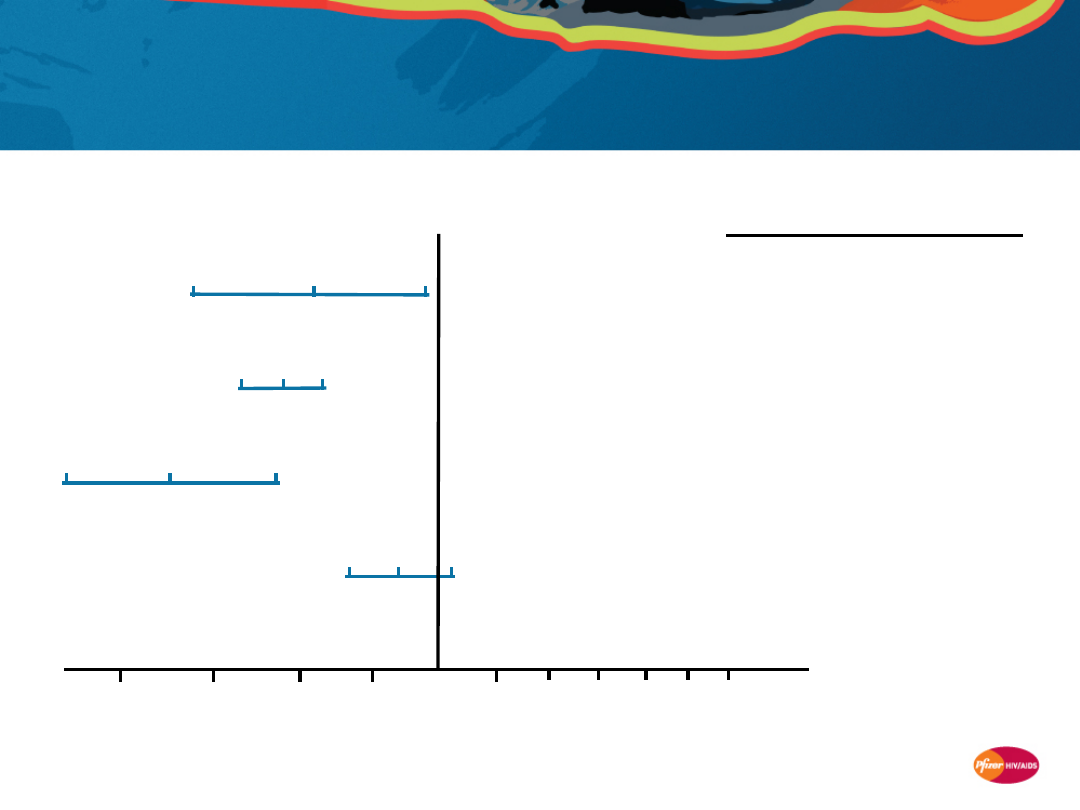
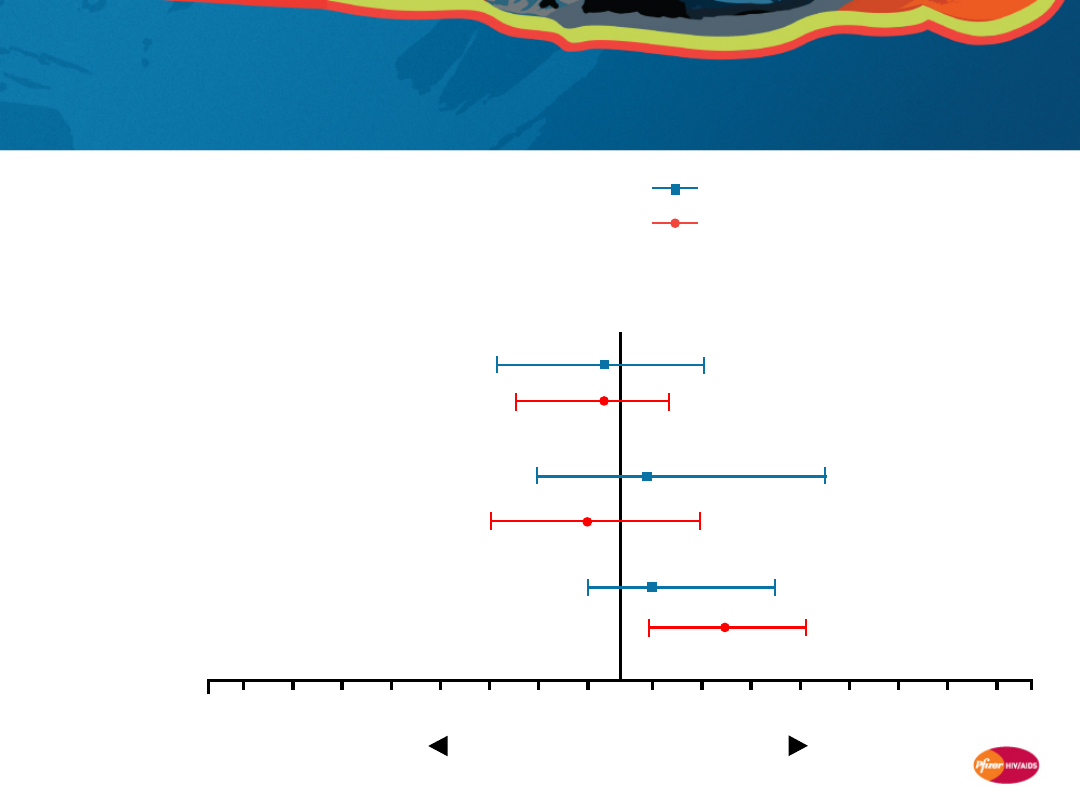
23
Philips A . AIDS 2008; 22:2409–2418.
Non-AIDS cancer:
Lower
risk consistently
associated with
higher
CD4+ T-cell counts
* Adjusted hazard ratio per 100 cells/mm
3
higher latest
CD4+ T-cell count for the association between latest CD4+ T-
cell count and risk of non-ADIS cancers or deaths from non-
AIDS cancers
Adjusted hazard ratio
(95% CI)*
Number
of
events
Includes
non-fatal
32
255
46
49
FIRST
(N=1,39
7)
D:A:D
(N=23,44
1)
CASCADE
(N=7,680)
SMART
(N=5,472)
0.6
0.7
0.8
0.9
1.0 1.1 1.2 1.3 1.4 1.5 1.6
Yes
Yes
No
No

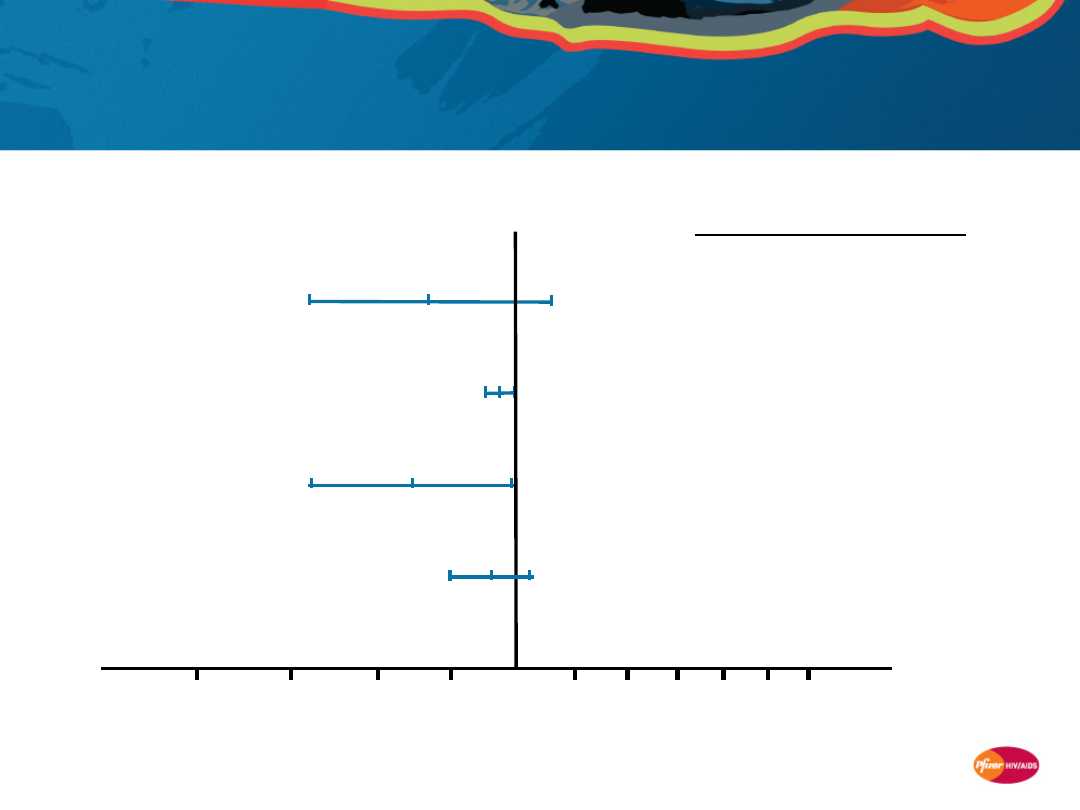
24
14
27
18
0.4
0.5
0.6
0.7
0.8 0.9 1.0
1.2
1.5
Number
of
events
Includes
non-
fatal
Yes
Yes
No
Renal disease:
Lower
risk consistently
associated with
higher
CD4+ T-cell counts
Adjusted hazard ratio
(95% CI)*
Philips A . AIDS 2008; 22:2409–2418.
* Adjusted hazard ratio per 100 cells/mm
3
higher latest
CD4+ T-cell count for the association between latest
CD4+ T-cell count and risk of renal disease or deaths from
renal disease
FIRST
(N=1,39
7)
D:A:D
(N=23,44
1)
SMART
(N=5,472)
25
SMART
(N=5,472)
D:A:D
(N=23,4
41)
Cardiovascular disease:
Lower
risk
consistently associated with
higher
CD4+ T-cell
counts
Philips A . AIDS 2008; 22:2409–2418.
* Adjusted hazard ratio per 100 cells/mm
3
higher latest
CD4+ T-cell count for the association between latest CD4+
T-cell count and risk of cardiovascular disease or deaths
from cardiovascular disease
FIRST
(N=1,3
97)
CASCADE
(N=7,680)
24
855
0.6
0.7
0.8
0.9
1.1
1.0
1.3 1.4
Number
of
events
Includes
non-
fatal
Yes
Yes
No
Adjusted hazard ratio
(95% CI)*
36
145
Yes
1.2
1.5 1.6
26
FIRST
(N=1,39
7)
D:A:D
(N=23,44
1)
CASCADE
(N=7,680)
SMART
(N=5,472)
Number
of
events
Includes
non-
fatal
Liver disease:
Lower risk
consistently
associated with
higher
CD4+ T-cell counts
Adjusted hazard ratio
(95% CI)*
Philips A . AIDS 2008; 22:2409–2418.
* Adjusted hazard ratio per 100 cells/mm
3
higher latest
CD4+ T-cell count for the association between latest CD4+
T-cell count and risk of liver disease or deaths from liver
disease
14
301
40
25
0.6
0.7
0.8
0.9 1.0
1.1 1.2 1.3 1.4 1.5 1.6
No
Yes
No
Yes
27
R
a
te
s
p
e
r
1
0
0
p
a
ti
e
n
t-
y
e
a
rs
(9
5
%
C
I)
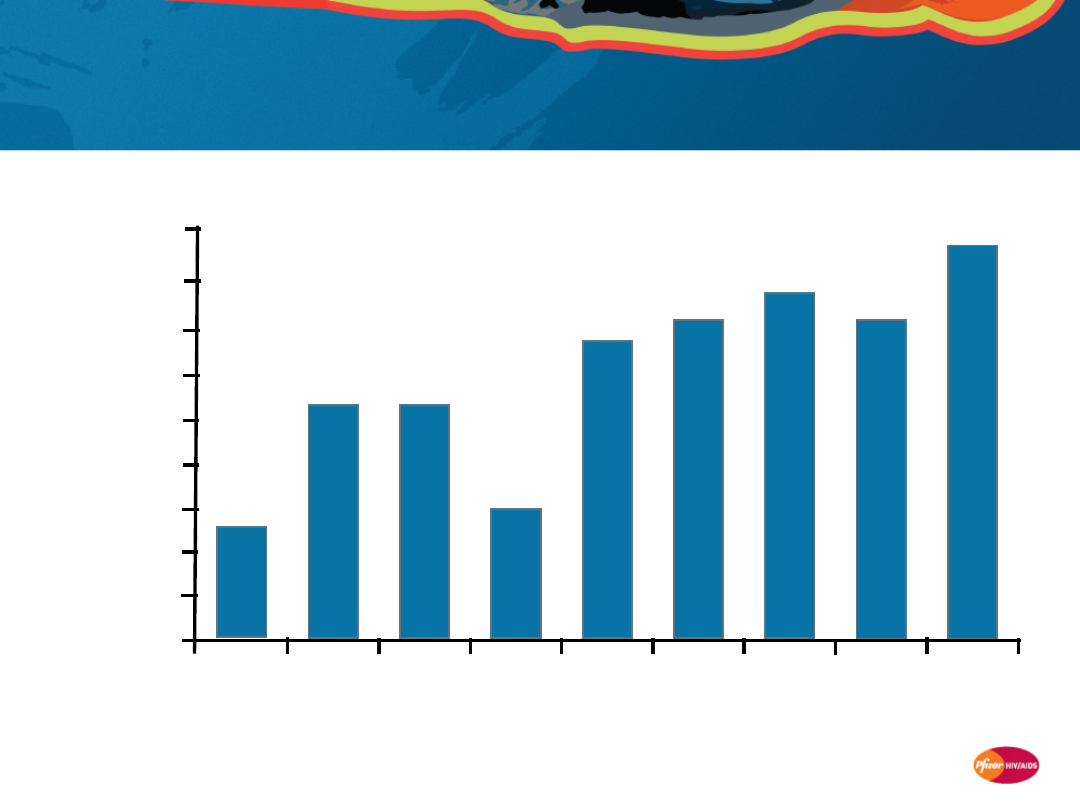
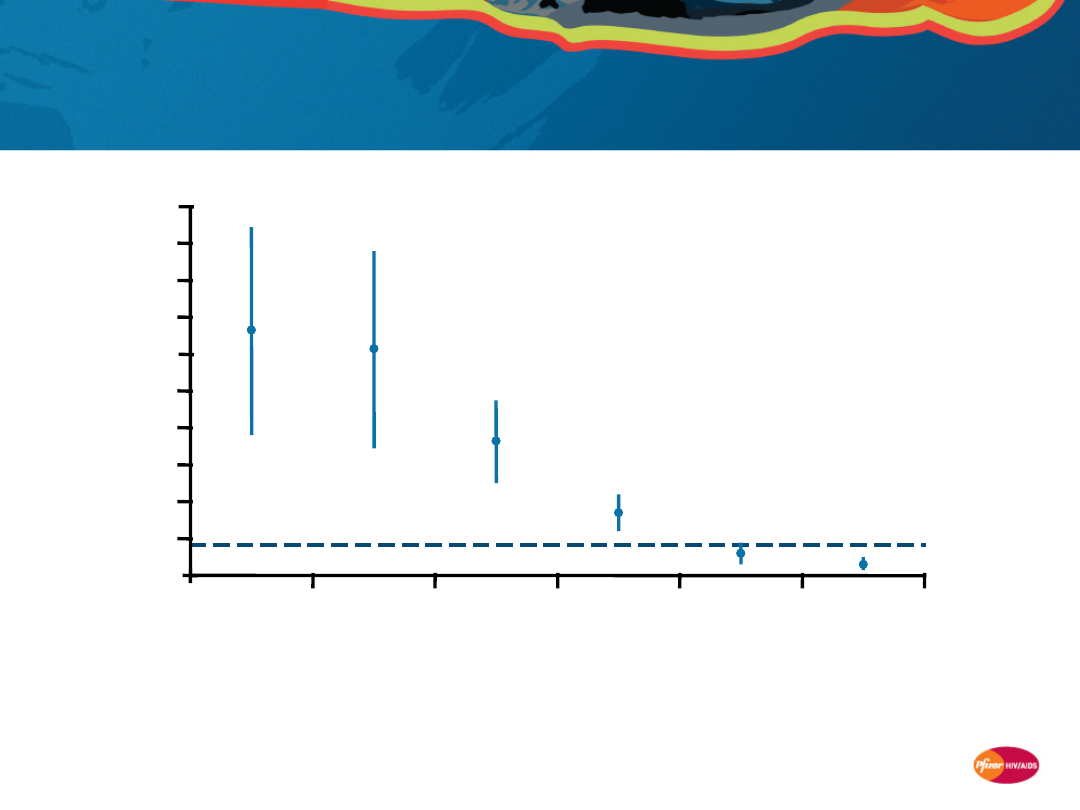
Liver-related death rates in D:A:D: Higher in
patients with lower CD4+ T-cell counts
Weber R, et al. Arch Intern Med 2006;
166:1632–1641.
Overall
rate
Number of events
22
21
44
52
21
21
Latest CD4+ T-cell count
Bars show death rates per 100 patient-years of follow-
up, stratified by latest CD4+ T-cell count
0
0.2
0.4
0.6
0.8
1
1.2
1.4
1.6
1.8
2
<50
50–99
100–199 200–349 350–499
≥500
N=23,441
28
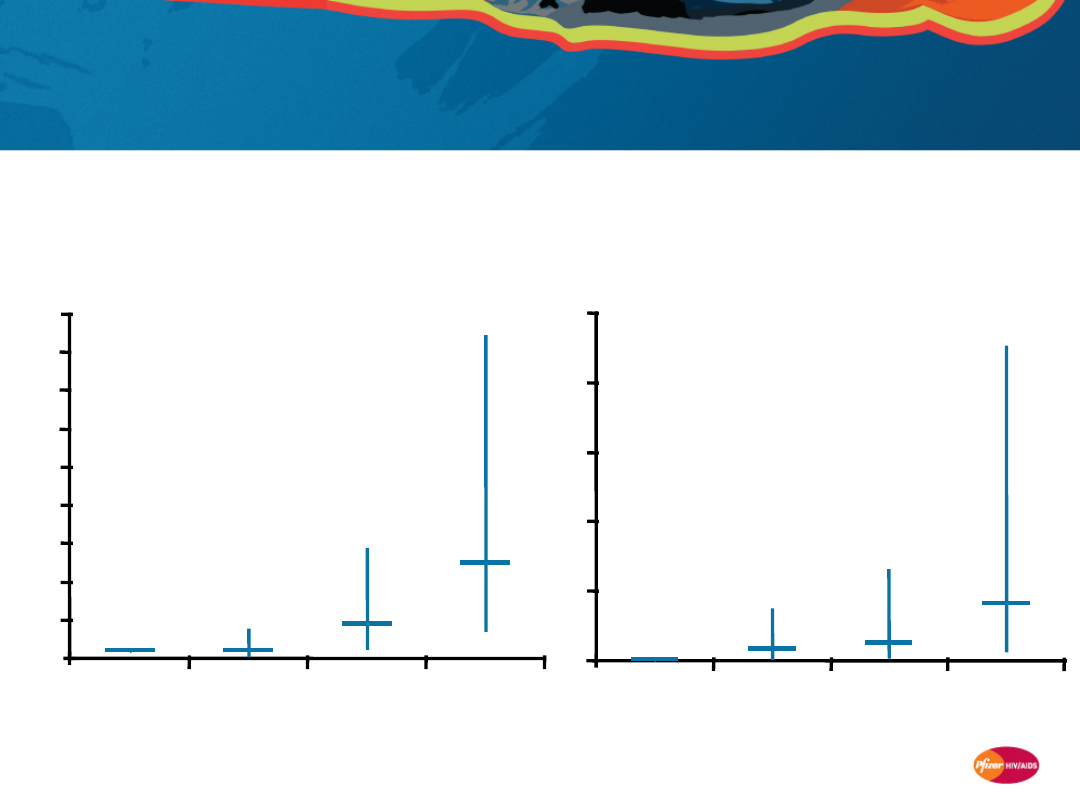
SMART study: Levels of inflammation and
coagulation markers are associated with risk
of death
Kuller LH, et al. PLOS Medicine 2008; 5:
e203.
IL-6
(inflammation marker)
1
1
4.5
12.4
0
5
10
15
20
25
30
35
40
45
<25th
percentile
25–49th
percentile
50–74th
percentile
≥75th
percentile
O
d
d
r
a
ti
o
(
9
5
%
C
I)
d
e
a
th
D-dimer
(coagulation marker)
1
8.3
12.6
41.2
0
50
100
150
200
250
<25th
percentile
25–49th
percentile
50–74th
percentile
≥75th
percentile
Quartiles of biomarker level at baseline
N=255
baseline
plasma
samples
29
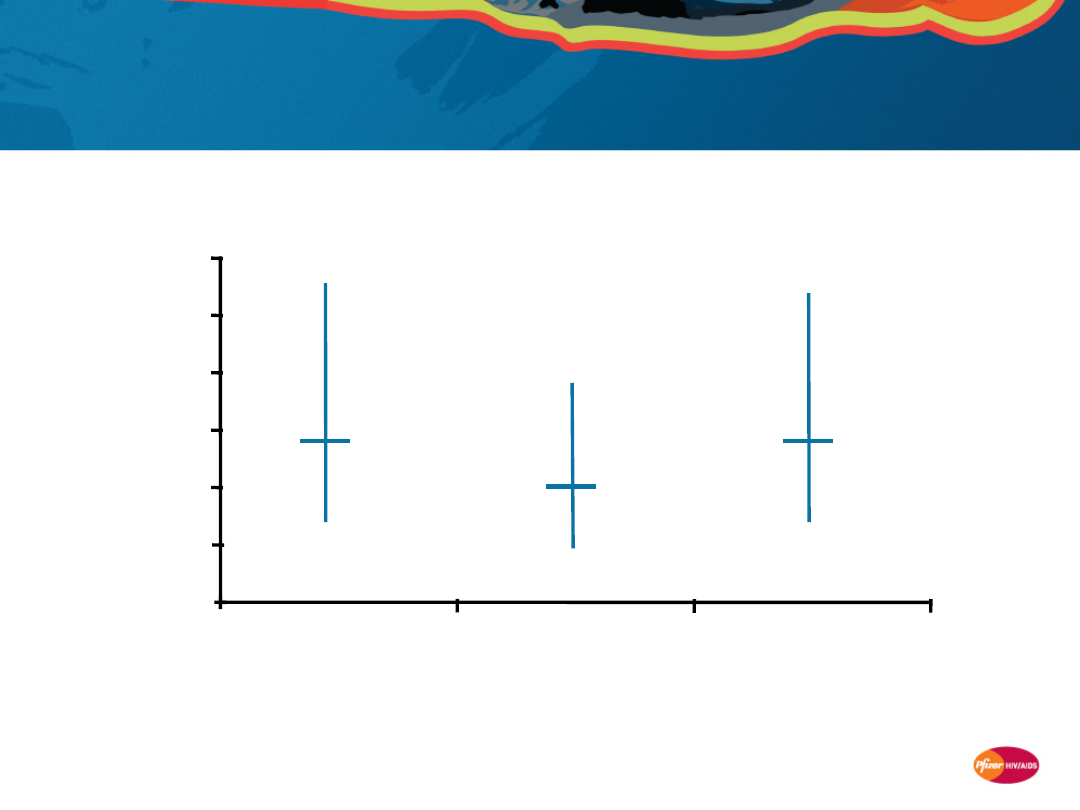
SMART study: Levels of inflammation and
coagulation markers are associated with risk
of CV disease/death
Kuller L, et al. CROI 2008. Abstract 139.
P-values are for adjusted odds ratios for the 4th vs 1st quartile of
each biomarker at baseline, estimated using logistic regression
IL-6
2
0
1
2
3
4
5
6
O
d
d
r
a
ti
o
(
9
5
%
C
I)
C
V
d
is
e
a
s
e
/d
e
a
th
D-dimer
2.8
P=0.003
P=0.06
2.8
P=0.002
Amyloid P
N=499 stored
baseline plasma
samples

30
Association of immune response with serious
non-AIDS diseases: Summary
•
Evidence suggests that incomplete immune restoration in HIV
patients on HAART is, at least in part, accountable for the excess in
non-AIDS-related morbidity and mortality
1–4
•
Lower CD4+ T-cell counts are associated with higher rates of non-
AIDS clinical events,
1–4
including those associated with
–
non-AIDS cancers
–
renal disease
–
cardiovascular disease
–
liver disease
•
Higher baseline levels of markers of inflammation and coagulation
are associated with higher risk of death and cardiovascular disease
in HIV-infected patients
5
1. Baker JV, et al. AIDS 2008; 22:841–848. 2. Weber R, et al. Arch Intern Med 2006; 166:1632–1641.
3. Friis-Moller N, et al. AIDS 2003; 17:1179–1193. 4. Philips A . AIDS 2008; 22:2409–2418.
5.KullerLH, et al. PLOS Medicine 2008; 5: e203.

31
Limitations of HAART in restoring
immune function

32
Limitations of HAART in restoring immune
function
The immune deficits related to HIV infection are only partially
resolved on current HAART regimens compared to HIV-negative
subjects, despite sustained virologic suppression
1,2
•
CD4
+
T-cell counts remain below normal for many patients
3–5
•
The same pathologic processes of immune activation and
immune deficiency persist, albeit at reduced levels
6
1. Hunt PW, et al. J Infect Dis 2003; 187: 1534-43. 2. Anthony, KB, et al. JAIDS 2003; 33: 125-133.
3. Kaufmann GR, et al. AIDS 2000; 14: 959-69. 4. Kaufmann GR, et al. Clin Infect Dis 2005; 41: 361-72.
5. Gras L, et al. JAIDS 2007; 45: 183-92. 6. Wainberg M & Clotet B. AIDS Pat Care STD 2007; 21: 609-620.
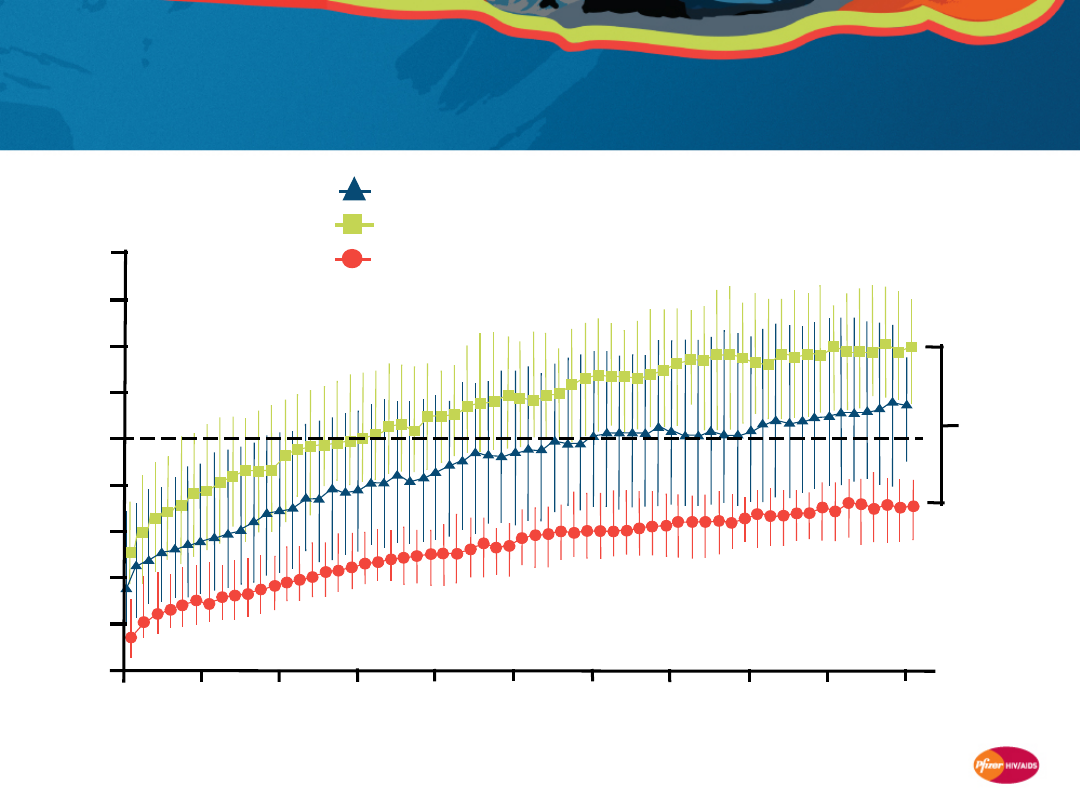
33
0
0
100
200
300
400
500
600
700
800
900
6
12
18
24
30
36
42
48
54
60
P<0.001
Months after HAART
initiation
C
D
4
+
T
-c
e
ll
c
o
u
n
t
(c
e
ll
s
/m
m
3
)
All patients
(N=293)
Complete CD4+ T-cell responders
(N=188)
Incomplete CD4+ T-cell responders
(N=105)
Even after 5 years of effective HAART, many
patients fail to obtain normal CD4+ T-cell
counts
Adapted from Kaufmann GR, et al. Clin Infect Dis 2005; 41:361–372.
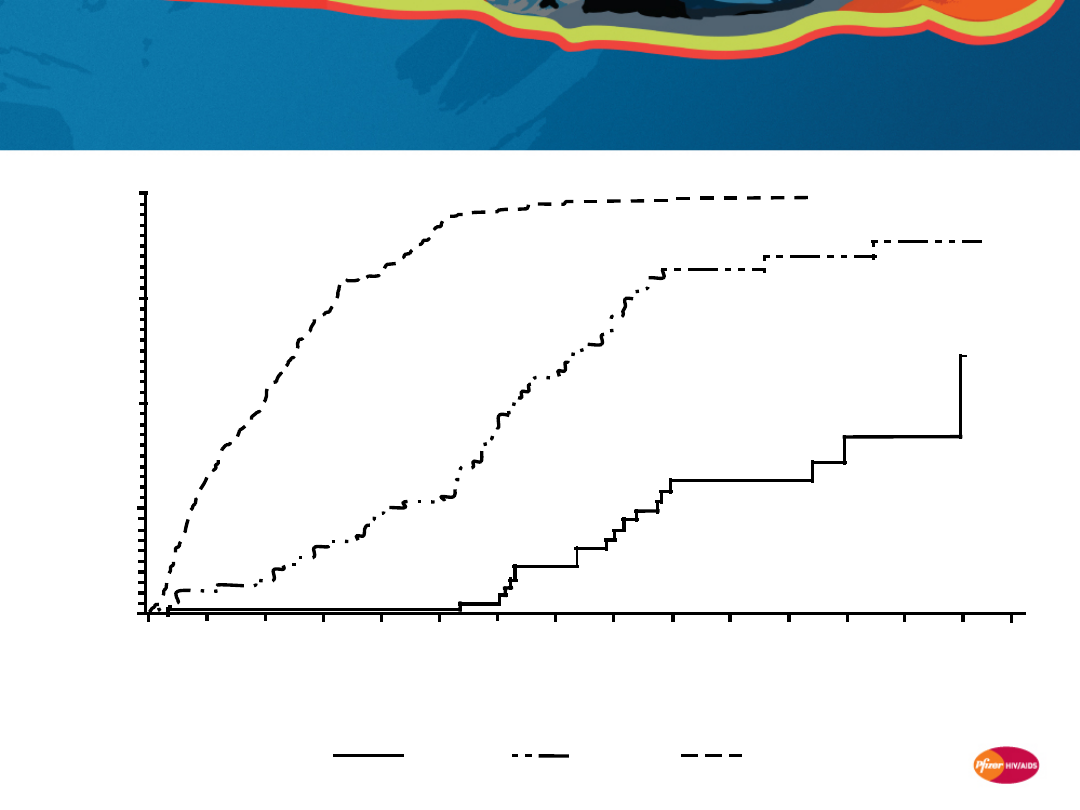
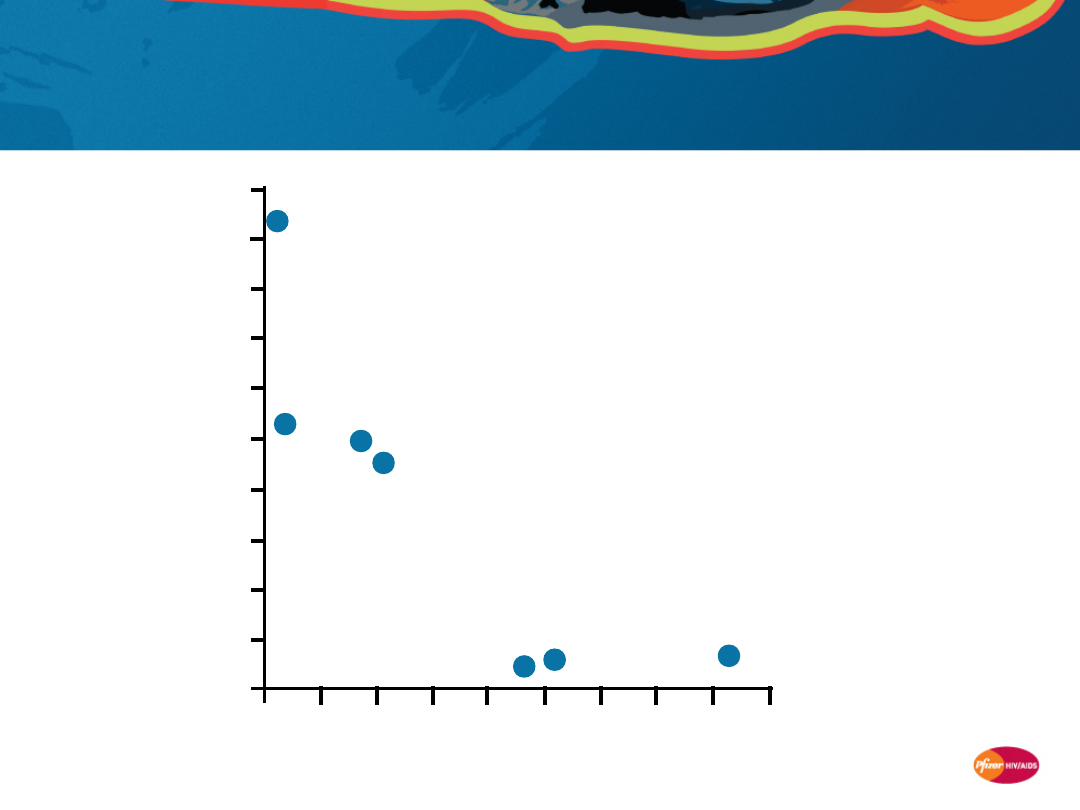
34
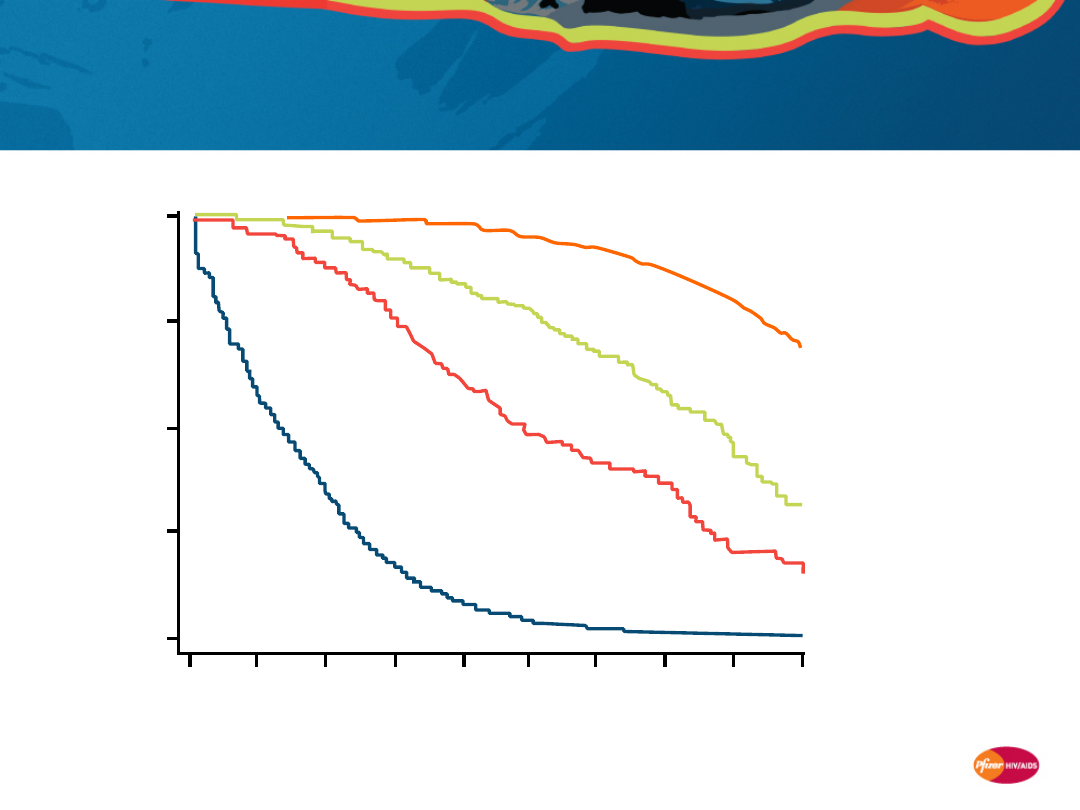
Patients with <500 cells/mm
3
after 4 years of
HAART are unlikely to achieve ≥500 cells/mm
3
in the long term
Kelley C, et al. Clinical Infectious Diseases 2009;
48:787–94.
Months of HAART
1.00
0.7
5
0.5
0
0.2
5
0.0
0
P
ro
b
a
b
il
it
y
o
f
im
m
u
n
o
lo
g
ic
r
e
s
to
ra
ti
o
n
0
1
0
2
0
3
0
4
0
5
0
6
0
7
0
8
0
9
0
100 110 120 130 140 150
N=216
N=76
N=74
Year 4 CD4+ T-cell
count:
<350
cells/mm
3
350–500
cells/mm
3
>500 cells/mm
3
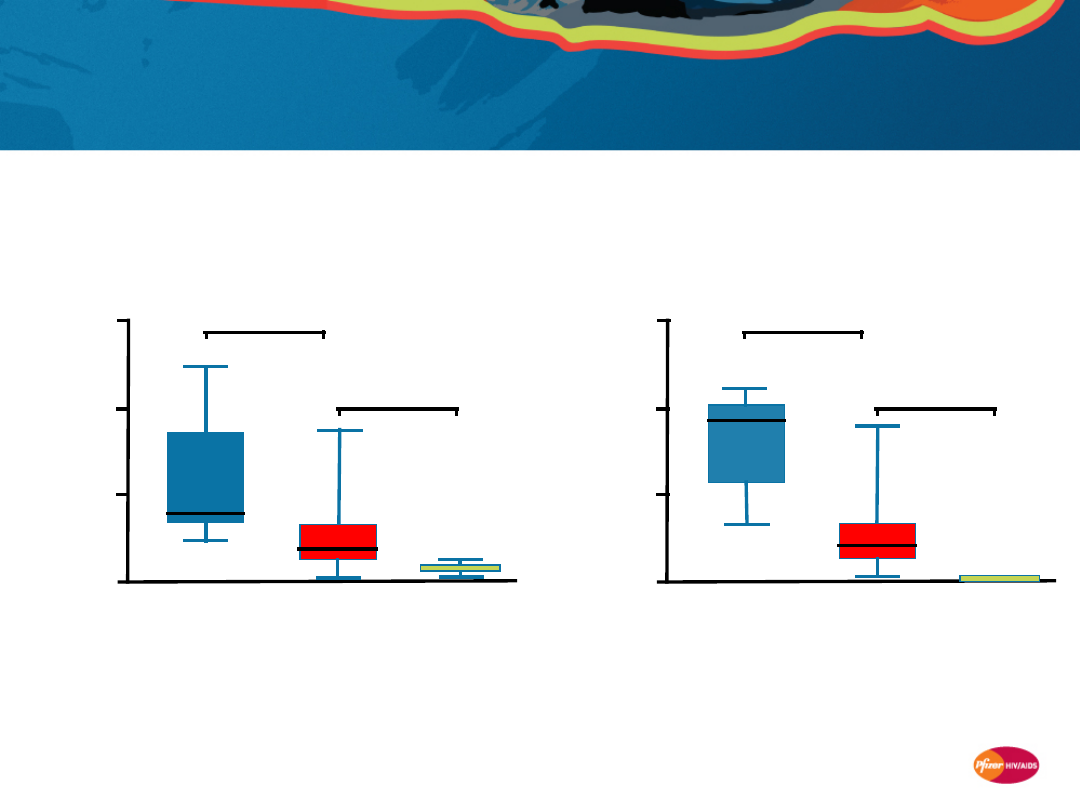
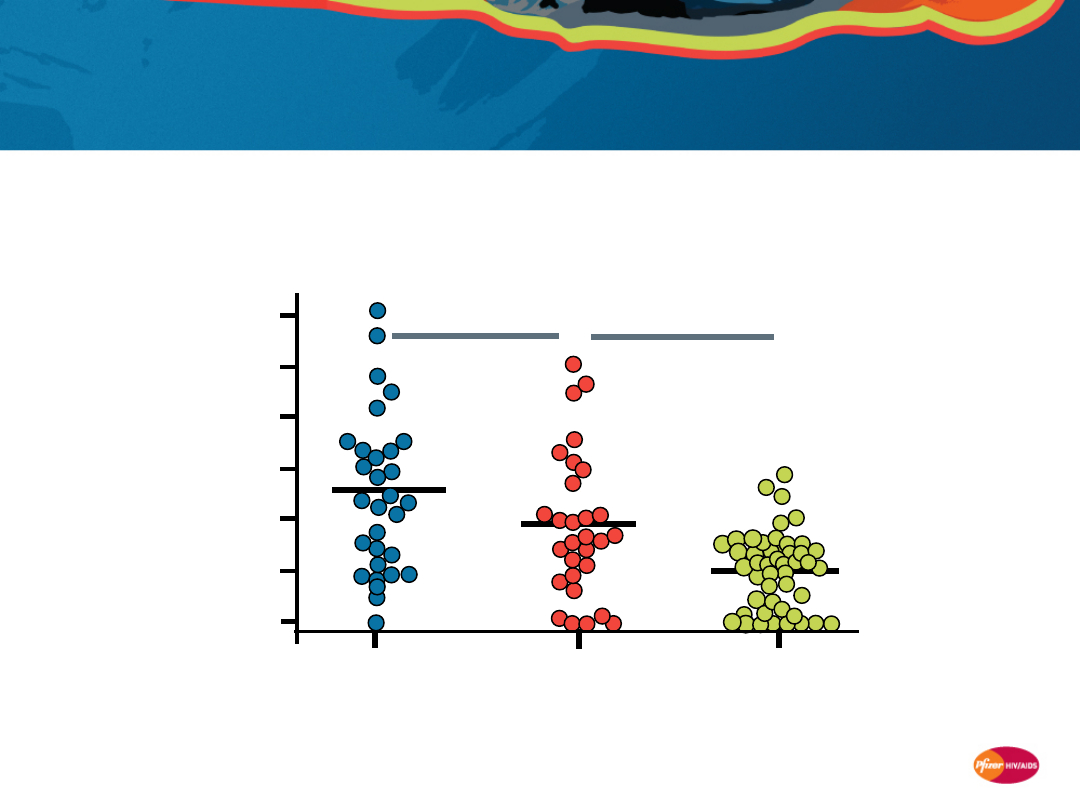
35
HAART is associated with reduced immune
activation, but levels remain high vs HIV-
negative subjects
Adapted from Hunt PW, et al. J Infect Dis 2003; 187:1534–1543.
0
10
20
30
HIV infected
untreated
(N=13)
HIV infected
treated
(N=99)
HIV
uninfected
(N=6)
P
e
rc
e
n
ta
g
e
o
f
a
c
ti
v
a
te
d
C
D
4
+
T
c
e
ll
s
P<0.001
P<0.001
0
10
20
30
HIV infected
untreated
(N=13)
HIV infected
treated
(N=99)
HIV
uninfected
(N=6)
P
e
rc
e
n
ta
g
e
o
f
a
c
ti
v
a
te
d
C
D
8
+
T
c
e
ll
s
P<0.001
P<0.001
CD4+
CD8+
36
•
Amyloid A
•
Amyloid P
•
C-reactive protein
(CRP)
•
Interleukin 6 (IL-6)
•
Tumor necrosis
factor (TNF-α)
•
Soluble TNF
receptors (sTNF-
R1, sTNF-R2)
•
Adiponectin
•
E-selectin
•
Granulocyte-
macrophage colony-
stimulating factor
(GM-CSF)
•
IL-10
•
Monocyte
chemotactic protein
(MCP1)
•
Myeloperoxidase
(MPO)
•
D-dimer
•
Prothrombin
fragment 1+2
(F1.2)
Many biomarkers of immune activation,
inflammation, and endothelial activation have
been identified
These markers may provide additional prognostic information on disease
progression and treatment response
Inflammation
Endothelial activation and
damage
Coagulation
•
Soluble
intercellular
adhesion
molecule and
cell adhesion
molecule
(sICAM-1 and
sVCAM-1)
•
Tissue-type
plasminogen
activator (t-PA)
and activator
inhibitor (t-PAI-
1)
•
von Willebrand
factor (vWF)
Kuller L, et al. 15th CROI 2008. Abstract 139. Ross A, et al. 15th CROI 2008; Abstract 949.
Ross A, et al. 15th CROI 2008; Abstract 954. Calmy A, et al. 15th CROI 2008; Abstract 140.
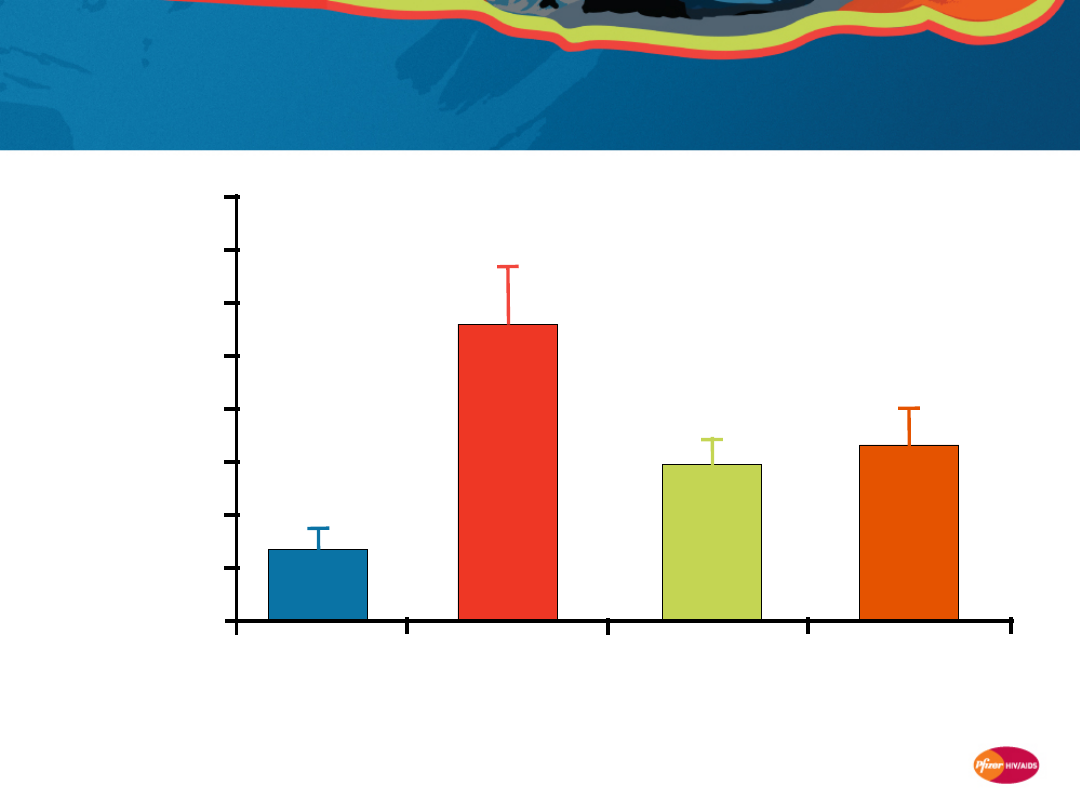
37
Markers of inflammation, such as C-reactive
protein, may persist at elevated levels despite
HAART
* P<0.001 vs HIV uninfected
** P<0.001 vs HIV infected, untreated
Adapted from Kristoffersen US, et al. 15th CROI 2008; Poster 953.
N=115 HIV-infected patients
N=30 HIV-uninfected matched controls
40,000
35,000
30,000
25,000
20,000
15,000
10,000
5,000
0
P
la
s
m
a
c
o
n
c
e
n
tr
a
ti
o
n
o
f
h
s
C
R
P
(
n
g
/m
L
)
HIV uninfected HIV infected,
untreated
HIV infected,
3 months of
HAART
HIV infected,
12 months of
HAART
**
*

38
Limitations of HAART in restoring immune
function: Summary
•
The immune deficits related to HIV infection are only partially resolved
on current HAART regimens compared to HIV-negative subjects,
despite sustained virologic suppression
1,2
•
Even after 5 years of effective HAART, many patients fail to obtain
normal CD4+ T-cell counts
3
–
Patients with <500 cells/mm
3
after 4 years of HAART are unlikely to achieve
≥500 cells/mm
3
during long-term follow-up
4
•
Initiation of HAART is associated with significant reductions in immune
activation, but levels remain elevated vs HIV-negative subjects
1
•
Biologic markers of immune activation, inflammation, and endothelial
activation may provide additional prognostic information on disease
progression and treatment response
–
Markers of inflammation, such as C-reactive protein, may persist at elevated
levels despite HAART
5
1. Hunt PW, et al. J Infect Dis 2003; 187: 1534-43. 2. Anthony, KB, et al. JAIDS 2003; 33: 125-133.
3. Kaufmann GR, et al. Clin Infect Dis 2005; 41:361–372. 4. Kelley C, et al. Clin Infect Dis 2009; 48:787–94.
5. Kristoffersen US, et al. 15th CROI 2008; Poster 953.

39
Potential mechanisms behind
premature incidence of serious
non-AIDS diseases in HIV-infected
patients

40
Chronic immune activation and inflammation
may contribute to elevated risk of non-AIDS
diseases
Impaired CD4+ T-cell reconstitution and immune dysfunction may
underlie the premature incidence of non-AIDS conditions in HIV-
infected patients
Processes that may contribute to persistent immune deficits
include:
•
Very early loss of CD4+ T cells from the gastrointestinal tract
1-3
•
Disruption of the gastrointestinal mucosal barrier, leading to
microbial translocation
4
•
HIV antigen persistence, resulting in ongoing immune
stimulation
5
•
Chronic, generalized immune activation
6
•
Fibrosis and activation-induced damage to lymphatic tissue
7
1. Li Q, et al. Nature 2005; 434:1148–1152. 2. Mattapallil JJ, et al. Nature 2005; 434:1093–1097.
3. Brenchley JM, et al. J Exp Med 2004; 200:749–759. 4. Brenchley JM, et al. Nat Med 2006; 12:1365–1371.
5. Hunt P, et al. J Infect Dis 2003; 187:1534–43. 6. El Far M, et al. Curr HIV/AIDS Rep 2008; 5:13–19.
7. Schacker T, et al. J Clin Invest 2002; 110:3–113.
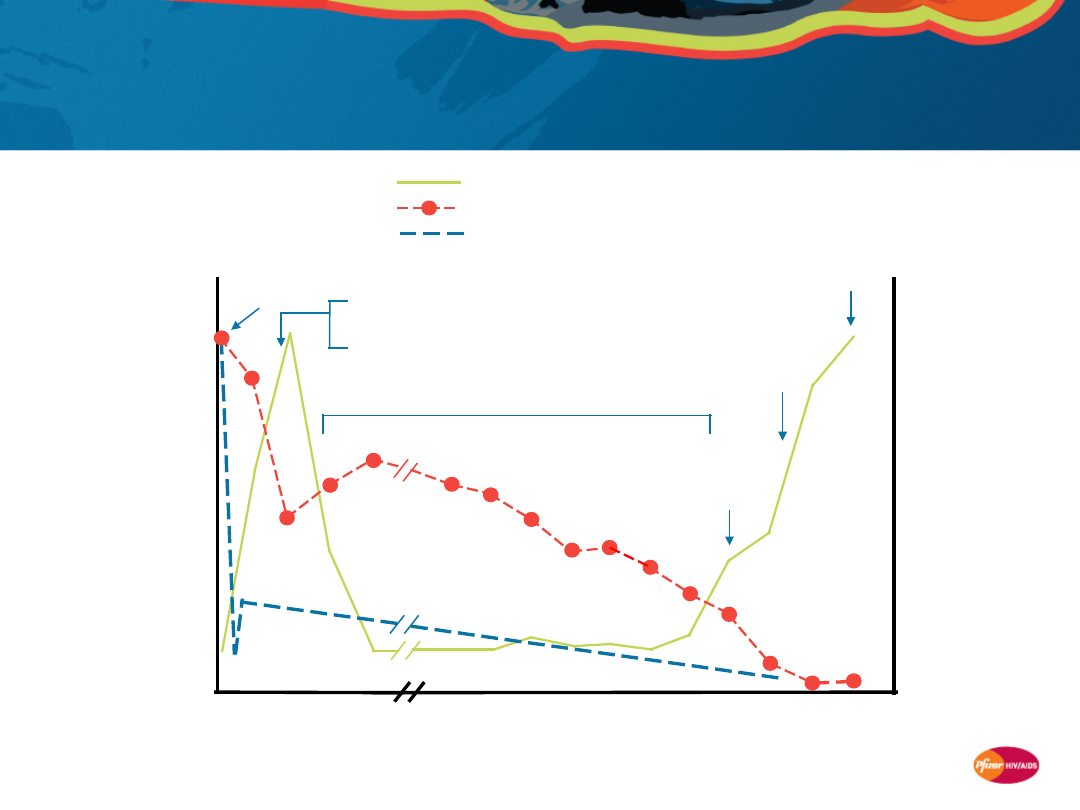
41
Acute HIV infection is characterized by a rapid
and massive loss of the body’s CD4+ T cells
Plasma viremia
Blood CD4+ T cells
Body CD4+ T cells
Primary
infection
±Acute HIV syndrome
Wide dissemination of virus
Seeding of lymphoid organs
R
e
la
ti
v
e
m
a
g
n
it
u
d
e
Time after initial infection
Weeks
Death
Opportunistic
diseases
Clinical latency
Constitutional
symptoms
Years
0
3
6
9
12
1
2
4
5
7
8
10 11+
3
6
9

42
The bulk of early T-cell loss appears to occur in
GALT
Most of the body’s CD4+ T-cells are located in gut-associated
lymphoid tissue (GALT)
1
•
The majority of GALT CD4+ T cells express CCR5 and are
permissive to HIV infection
2
GALT is the principal target of the acute phase of HIV replication
and associated T-cell loss
3-5
This phase results in lasting damage to GALT
1. Veazey RS & Lackner AA. PLoS Med 2006; 3:e515. 2. Appay V & Sauce D. J Pathol 2008; 214:231–241.
3. Li Q, et al. Nature 2005; 434:1148–1152. 4. Mattapallil JJ, et al. Nature 2005; 434:1093–1097. 5. Brenchley JM, et al. J Exp Med 2004; 200:749–759.
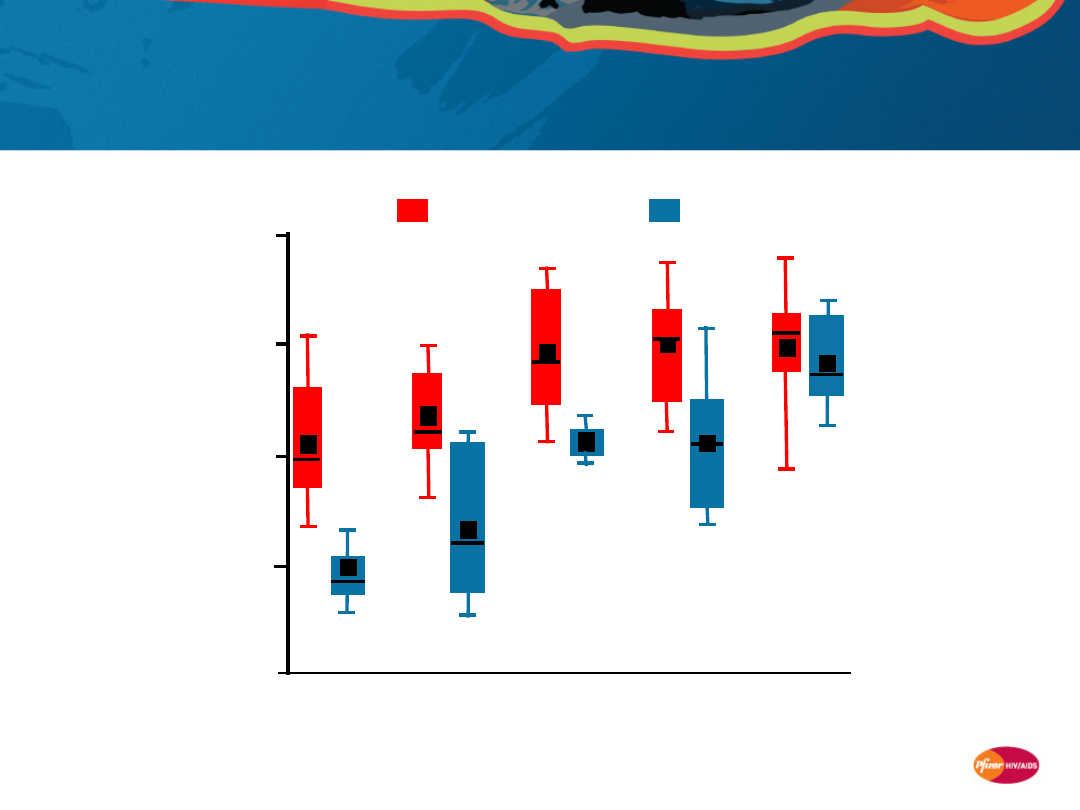
43
Even with early HAART, depletion of CD4+ T cells
in GALT may persist despite normalization in
peripheral blood
Mehandru S, et al. PLoS Med 2006; 3:e484.
AEI,
untreated
(N=32)
0
20
P
e
rc
e
n
ta
g
e
o
f
a
c
ti
v
a
te
d
C
D
4
+
T
c
e
ll
s
40
60
80
AEI, treated
up to 1 year
(N=7)
AEI, treated
1–3 years
(N=7)
AEI, treated
3–7 years
(N=8)
HIV
uninfected
(N=18)
Peripheral blood
Mucosa
AEI = acute/early HIV infected
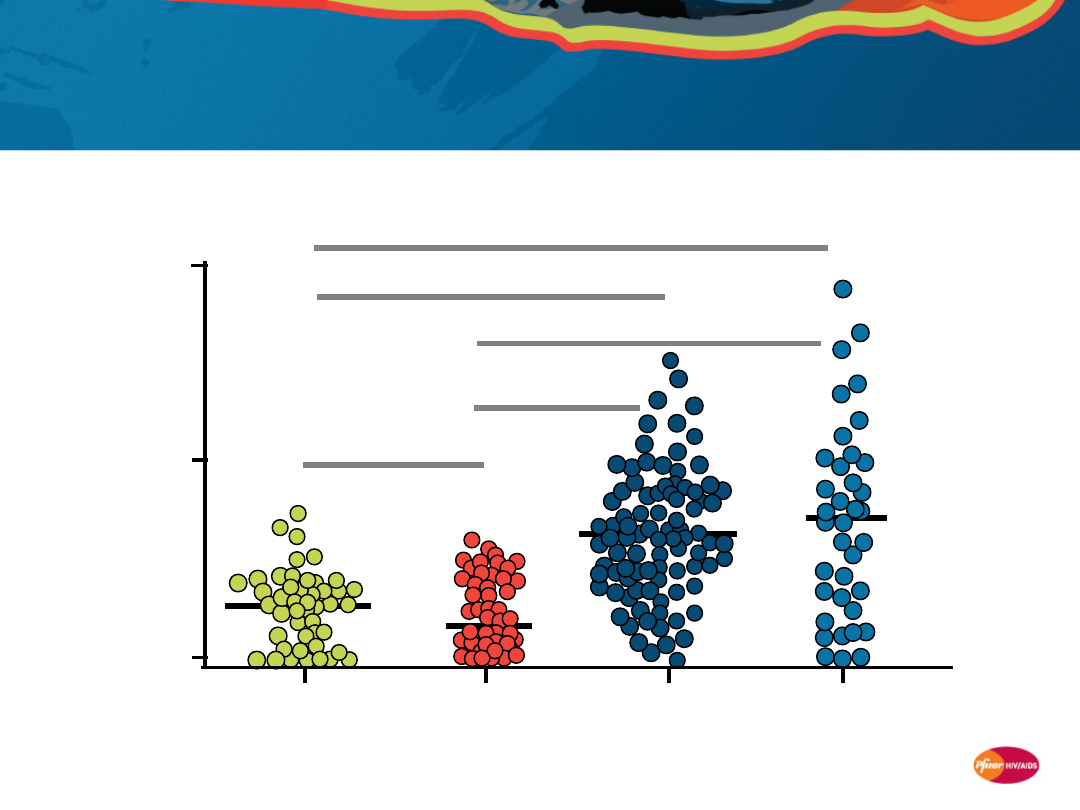
44
Microbial translocation, reflected in increased
plasma LPS levels, may stimulate systemic
immune activation
Brenchley JM, et al. Nat Med 2006; 12:1365–1371.
(N=50)
(N=59)
(N=37)
(N=47)
P<0.0001
P<0.0001
P<0.0001
P<0.0001
P=0.842
200
100
0
P
la
s
m
a
L
P
S
(
p
g
/m
L
)
Uninfected
Acute/early
Chronic
AIDS
LPS = lipopolysaccharide
45
With HAART, LPS levels are only partially
reduced, suggesting persistent microbial
translocation
Brenchley JM, et al. Nat Med 2006; 12:1365–1371.
P=0.0107
0
P
la
s
m
a
L
P
S
(
p
g
/m
L
)
50
100
150
Progressors,
untreated
(N=68)
Progressors,
48 weeks HAART
(N=28)
Uninfected
(N=47)
P=0.0026
46
Higher levels of structural damage to lymphoid
tissue are associated with impaired CD4+ T-
cell reconstitution
Schacker T, et al. J Clin Invest 2002; 110:3–113.
N=7
700
600
500
400
300
200
100
0
800
900
1000
C
h
a
n
g
e
i
n
p
e
ri
p
h
e
ra
l
C
D
4
+
T
-c
e
ll
c
o
u
n
t
Percent area collagen
2
4
6
8
10
12 14
16
18
20

47
Premature “aging” of immune system:
32-
40
● Decreased thymic function
● Deregulation of hemataopoiesis
● Decreased vaccine response
● Lymphoid tissue fibrosis
Immune activation
and
inflammation
14-21
Biomarkers:
TNF-α
19,22,23
D-dimer
24-26
hs-CRP
24,27,28
IL-6
23,24
CD4+ T-cell
depletion
29-31
Excessive CD4+
T-cell
turnover
30,31,53
HIV persistence in
the GALT/lymphoid
tissue.
7-9
Bacterial
translocation.
10
Viral coinfections
(eg. HCV, CMV,
EBV)
11-13
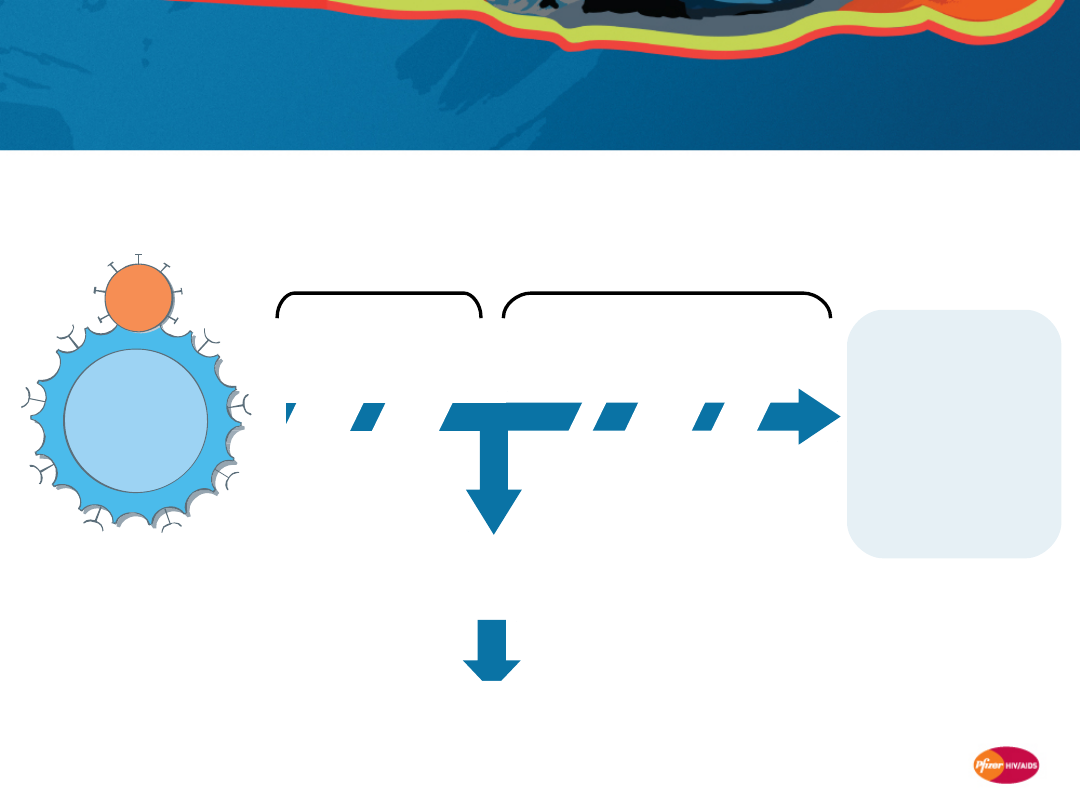
Uncontrolled viral
replication
Death from
AIDS/OIs
H
A
A
R
T
D
e
cr
e
a
se
d
v
ir
a
l
lo
a
d
/
in
cr
e
a
se
d
C
D
4
+
T
-c
e
ll
co
u
n
t
U
n
d
e
te
ct
a
b
le
v
ir
a
l
lo
a
d
Pre-HAART era
1-4
Current HAART era
5,6
V
ir
a
l
re
p
li
ca
ti
o
n
/G
A
LT
In
cr
e
a
se
d
v
ir
a
l
lo
a
d
/d
e
cr
e
a
se
d
C
D
4
+
T
-c
e
ll
c
o
u
n
t
Initial HIV
Infection
Uncontrolled viral
replication
Death from
AIDS/OIs
H
A
A
R
T
D
e
cr
e
a
se
d
v
ir
a
l
lo
a
d
/
in
cr
e
a
se
d
C
D
4
+
T
-c
e
ll
co
u
n
t
U
n
d
e
te
ct
a
b
le
v
ir
a
l
lo
a
d
Pre-HAART era
1-4
Current HAART era
5,6
In
cr
e
a
se
d
v
ir
a
l
lo
a
d
/d
e
cr
e
a
se
d
C
D
4
+
T
-c
e
ll
c
o
u
n
t
An emerging model of HIV-induced immune
dysfunction
Liver disease
12,49,50-
52
● Accelerated Hep C
● Hepatic failure
Non-AIDS
cancers
44-48
● Lung
● Hodgkin’s
lymphoma
Heart disease
1,42,43
● Atherosclerosis
● Increased CIMT
AIDS-related or
other-cause
morbidity/mortalit
y
1-3
HIV persistence in
the GALT/lymphoid
tissue.
7-9
Bacterial
translocation.
10
Viral coinfections
(eg. HCV, CMV,
EBV)
11-13
Immune activation
and
inflammation
14-21
Biomarkers:
TNF-α
19,22,23
D-dimer
24-26
hs-CRP
24,27,28
IL-6
23,24
Normalized
lifespan
41
● CD4+ T-cell
counts ≥500 for
≥6yr
Animatic of an emerging model of HIV-induced immune
dysfunction can be viewed in presentation mode

48
Promising directions for ongoing and future
research
•
Investigational approaches to improve immune
function restoration in HIV-infected patients:
–
Earlier HAART initiation (at CD4+ T-cell counts >500 cells/mm
3
)
–
Treatment with valganciclovir to decrease T-cell activation in
HIV/CMV co-infected patients
–
Novel immunomodulating strategies
•
synthetic cytokines
•
recombinant human growth hormone
•
toll-like receptor agonists
–
CCR5 antagonism
ClinicalTrials.gov: NCT00264290 and NCT00071240. Sereti I, et al. Blood 2009; [Epub ahead of print].
49
Additional IL-2–associated CD4+ T-cell gains
conferred no clinical benefit
SILCAAT study
1
(N=1,695)
ESPRIT study
2
(N=4,111)
Category
Patients
IL-2 / Control
OD or death
(primary endpoint)
Death
Grade 4
events
113 / 119
80 / 75
199 / 184
0.1
1
2
Lower risk
Higher risk
0.95
1.08
1.10
Hazard ratio (95% CI)
IL-2 vs control
159 / 163
107 / 114
467 / 380
0.95
0.91
1.24
1. Levy CROI 2009 Abstract 90bLB. 2. Losso CROI 2009 Abstract 90aLB.
OD = opportunistic disease; CI = confidence interval
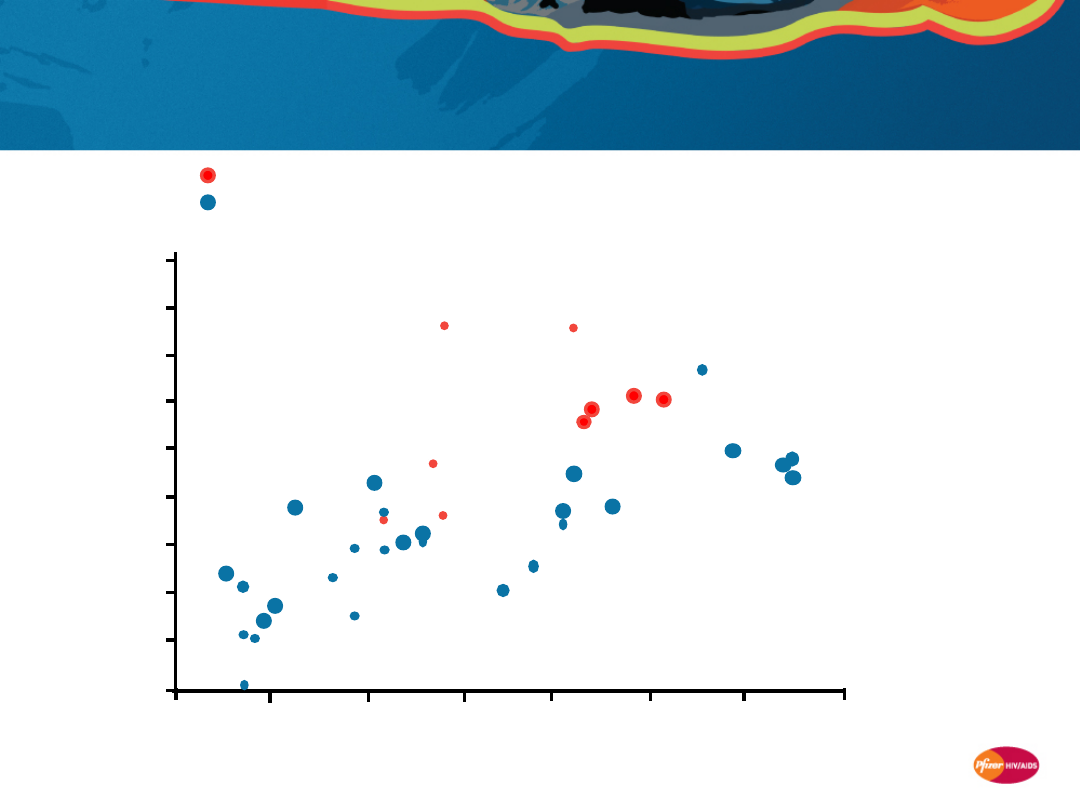
50
CCR5 antagonism was associated with an
additional CD4+ T-cell count gain in treatment-
experienced patient studies
C
D
4
+
T
-c
e
ll
c
o
u
n
t
(c
e
ll
s
/m
m
3
)
CCR5 antagonists (vicriviroc, maraviroc)
Other ARVs (etravirine, enfuvirtide, raltegravir, darunavir,
tipranavir)
-10
10
30
50
70
90
110
130
150
170
Proportion of patients with HIV RNA <50 copies/mL at week 24
0
0.1
0.2
0.3
0.4
0.5
0.6
0.7
Size of circle represents sample size
Wilkin T, et al. 15th CROI 2008; Poster 800.

51
Rationale for immune effects of CCR5
antagonism
Certain host genotypes for CCR5 and its major HIV-suppressive ligand
CCL3L1 appear to affect CD4+ T-cell recovery in long-term HAART,
independent of virologic suppression
•
Patients with favorable
CCR5Δ32
and CCL3L1l genotypes experience
greater HAART-mediated CD4+ T-cell count increases
1
Transplant studies suggest an immunomodulating role of CCR5 antagonism
•
Administration of a CCR5 antagonist in an established monkey heart
transplant model attenuated immune activation and postsurgical stress
responses
2
“Natural hosts” of SIV infection have low CCR5 expression on their CD4+
T cells
3
A number of studies are underway to assess the efficacy of maraviroc,
a CCR5 antagonist, in modulating inflammation and immune response
at various phases of HIV infection
1. Ahuja SK, et al. Nat Med 2008;14:413-20.
2. Schröeder C, et al. J Immunol 2007; 179:2289–99. 3. Pandrea I, et al. Blood 2007; 109:1069–76.

52
Summary
•
While HAART has improved morbidity and mortality rates for the HIV-
infected patient population, an excess risk remains compared to HIV-
negative individuals
1-5
•
HIV-infected patients appear to have an excess risk for various non-
AIDS conditions vs the general population
1-5
•
Persistent immune dysfunction may play a central role
6-8
•
Mechanisms by which HIV increases the risk of serious non-AIDS
disease is an important emerging area for HIV research
•
Studies are needed to better understand the mechanisms and
processes of immune deficiency and immune restoration in HIV
infection
•
This in turn may drive development of interventions that maximize
both viral suppression AND immune reconstitution, further reducing
morbidity and mortality in HIV-infected patients
1. Clifford GM, et al. J Natl Cancer Inst 2005; 97:425–432. 2. Dal Maso L, et al. Br J Cancer 2003; 89:94–100.
3. Engels EA, et al. Int J Cancer 2008; 123:187–194. 4. Patel P, et al. Ann Intern Med 2008; 148:728–736.
5. Goulet JL, et al. Clin Infect Dis 2007; 45:1593–1601. 6. Hunt PW, et al. J Infect Dis 2003; 187: 1534-43.
7. Anthony, KB, et al. JAIDS 2003; 33: 125-133. 8. Kaufmann GR, et al. Clin Infect Dis 2005; 41:361–372.
Document Outline
- Causes and consequences of immune dysfunction in the virologically controlled HIV patient
- Morbidity and mortality in the virologically controlled patient
- Slide 3
- Mortality and morbidity in the modern HAART era
- Patients in the HAART era have at least a 10-year shorter expected survival than age- and gender-matched controls
- Life expectancy of HIV-infected patients in the HAART era remains shorter than that of the general population*
- Survival on HAART is similar to the general population only if CD4+ counts are ≥500 cells/mm3 for ≥6 years
- An emerging model of HIV-induced immune dysfunction
- HOPS cohort: Deaths in the HIV patient population are increasingly due to non-AIDS-related causes
- SMART study: Most deaths were due to non-AIDS-defining events
- Mortality data from other cohorts confirm increasing non-AIDS causes of death in HIV patient population
- Increasing incidence of non-AIDS hospitalizations confirmed in UK and US clinics
- Coronary heart disease incidence in young HIV-infected patients is higher than in non-HIV-infected counterparts
- Cohorts show an excess risk of non-AIDS morbidity in HIV-infected patients vs the general population
- Mortality and morbidity in the modern HAART era: Summary
- Association of immune response with serious non-AIDS diseases
- Immunologic response to HAART is an independent predictor of clinical outcome1–3
- Proportion of deaths from non-AIDS causes is increasing, but at CD4+ T-cell counts below normal
- Cohorts/clinical studies suggest lower CD4+ T-cell counts are associated with higher rates of non-AIDS clinical events
- CASCADE and D:A:D: Higher rates of death from non-AIDS causes at lower CD4+ T-cell counts
- CASCADE: Lower risk of death from serious non-AIDS diseases if CD4+ T-cell counts are higher
- FIRST study: Risk for non-AIDS diseases is lower in HIV-infected patients who have higher CD4+ T-cell counts
- Non-AIDS cancer: Lower risk consistently associated with higher CD4+ T-cell counts
- Renal disease: Lower risk consistently associated with higher CD4+ T-cell counts
- Cardiovascular disease: Lower risk consistently associated with higher CD4+ T-cell counts
- Liver disease: Lower risk consistently associated with higher CD4+ T-cell counts
- Liver-related death rates in D:A:D: Higher in patients with lower CD4+ T-cell counts
- SMART study: Levels of inflammation and coagulation markers are associated with risk of death
- SMART study: Levels of inflammation and coagulation markers are associated with risk of CV disease/death
- Association of immune response with serious non-AIDS diseases: Summary
- Limitations of HAART in restoring immune function
- Slide 32
- Slide 33
- Patients with <500 cells/mm3 after 4 years of HAART are unlikely to achieve ≥500 cells/mm3 in the long term
- HAART is associated with reduced immune activation, but levels remain high vs HIV-negative subjects
- Many biomarkers of immune activation, inflammation, and endothelial activation have been identified
- Markers of inflammation, such as C-reactive protein, may persist at elevated levels despite HAART
- Limitations of HAART in restoring immune function: Summary
- Potential mechanisms behind premature incidence of serious non-AIDS diseases in HIV-infected patients
- Chronic immune activation and inflammation may contribute to elevated risk of non-AIDS diseases
- Acute HIV infection is characterized by a rapid and massive loss of the body’s CD4+ T cells
- The bulk of early T-cell loss appears to occur in GALT
- Even with early HAART, depletion of CD4+ T cells in GALT may persist despite normalization in peripheral blood
- Microbial translocation, reflected in increased plasma LPS levels, may stimulate systemic immune activation
- With HAART, LPS levels are only partially reduced, suggesting persistent microbial translocation
- Higher levels of structural damage to lymphoid tissue are associated with impaired CD4+ T-cell reconstitution
- Slide 47
- Promising directions for ongoing and future research
- Additional IL-2–associated CD4+ T-cell gains conferred no clinical benefit
- CCR5 antagonism was associated with an additional CD4+ T-cell count gain in treatment-experienced patient studies
- Rationale for immune effects of CCR5 antagonism
- Summary
Wyszukiwarka
Podobne podstrony:
Modification of Intestinal Microbiota and Its Consequences for Innate Immune Response in the Pathoge
fitopatologia, Microarrays are one of the new emerging methods in plant virology currently being dev
Issue of Gun Control and Violence As Seen in the U S and
(gardening) Roses in the Garden and Landscape Cultural Practices and Weed Control
Gun Control in the U S New Methods Are Needed
Gun Control in the USA
2000 10 Raid Controllers 15 Scsi Controllers in the Linux Labs
Domjan M , Cusato B Pavlovian feed forward mechanisms in the control of social behavior
Implementing Anti Virus Controls in the Corporate Arena
Jacobson Mind Control in the United States
Design of an Artificial Immune System as a Novel Anomaly Detector for Combating Financial Fraud in t
Mind Control in the 1990 s Neuro Linguistic Programming
Mettern S P Rome and the Enemy Imperial Strategy in the Principate
Early Variscan magmatism in the Western Carpathians
Applications and opportunities for ultrasound assisted extraction in the food industry — A review
In the end!
Cell surface in the interaction Nieznany
Post feeding larval behaviour in the blowfle Calliphora vicinaEffects on post mortem interval estima
więcej podobnych podstron