
1
Podstawy teorii sygnałów,
systemów i sterowania
Wykład 18
Sygnały stochastyczne w
układach automatyki
2
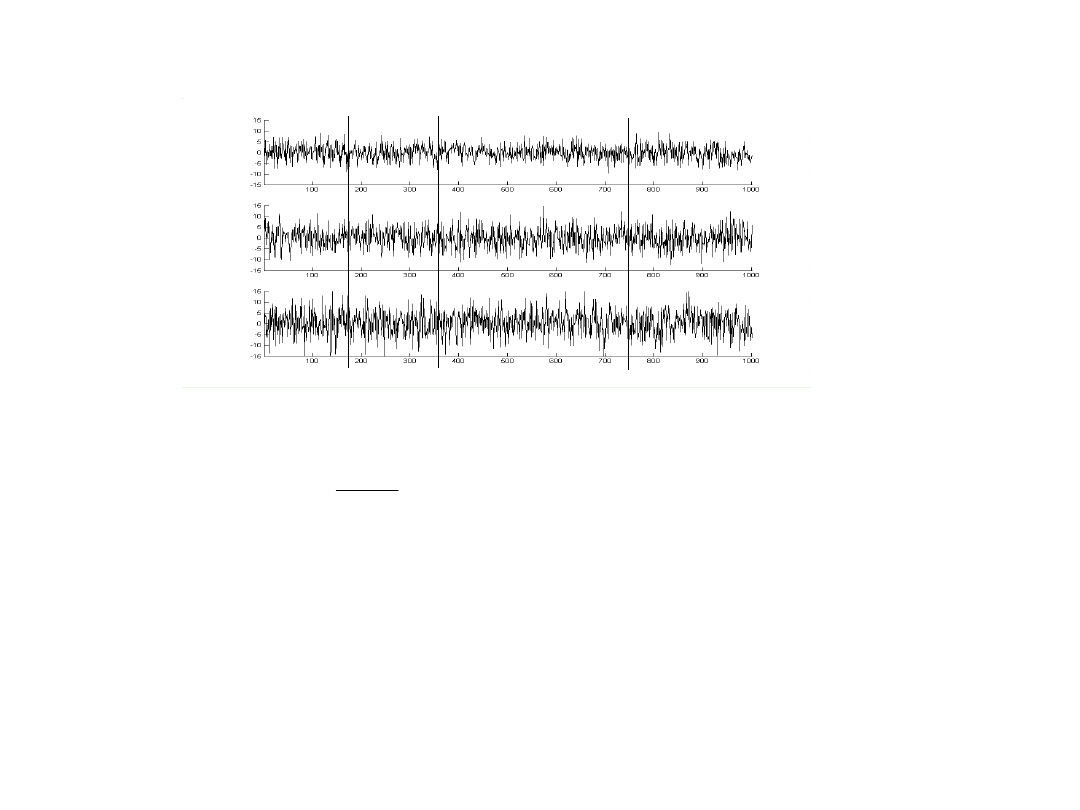
x
1
x
2
x
n
t
t
t
t
1
t
2
t
3
N
x
x
F
)
(
)
(
N = nk określa liczbę wziętych pod uwagę wartości
)
(
),...,
(
),
(
),...,
(
),...,
(
),
(
2
1
1
1
2
1
1
k
n
k
k
n
t
x
t
x
t
x
t
x
t
x
t
x
)
(x
- liczba tych wartości w zbiorze
),
(
),...,
(
1
1
k
n
t
x
t
x
które są mniejsze lub równe x.
(1)
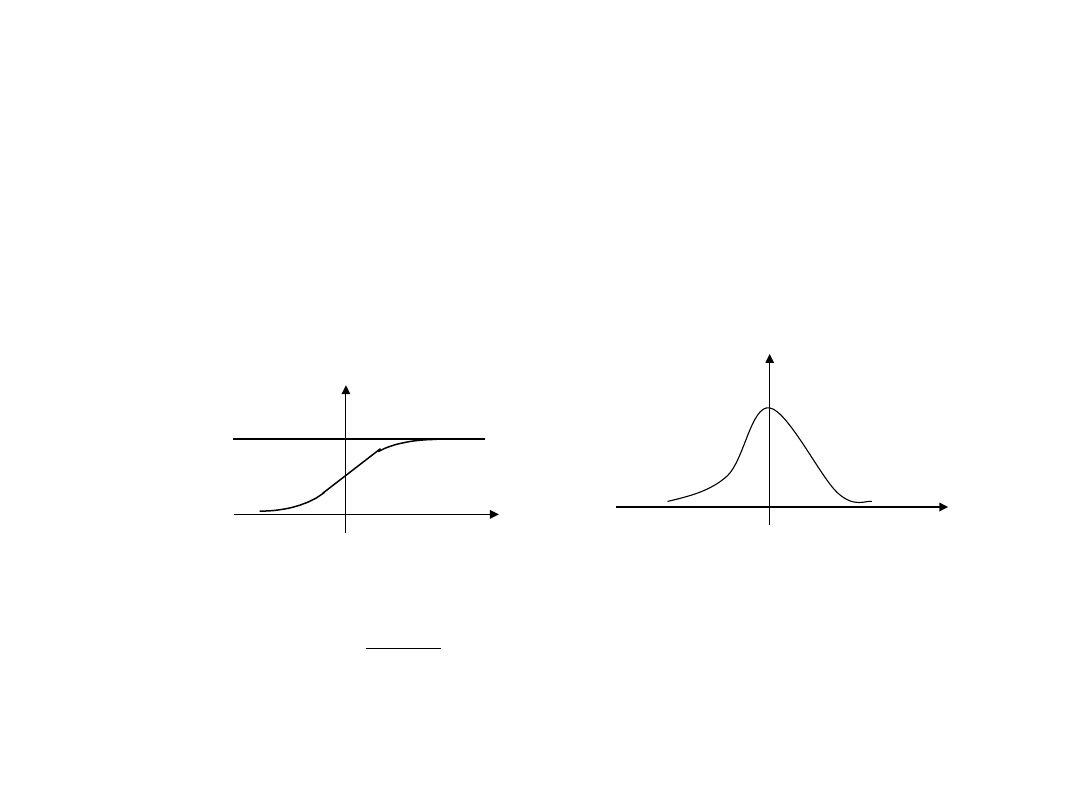
- funkcja rozkładu
3
,
(9.2)
Własności funkcji rozkładu (1):
1
)
(
0
x
F
.
1
)
(
,
0
)
(
F
F
x
1
F(x)
0
dx
x
dF
x
f
)
(
)
(
f(x)
x
0
- funkcja gęstości rozkładu
• F(x) jest funkcją monotonicznie
niemalejącą,
4
Wartość średnia i wariancja
T
T
T
dt
t
x
T
x
)
(
2
1
lim
)
(
)
(
t
z
x
t
x
- wartość średnia
stacjonarnego i
ergodycznego procesu
stochastycznego X(t)
T
T
T
dt
t
z
x
T
x
2
2
)]
(
[
2
1
lim
T
T
T
T
T
T
T
T
T
dt
t
z
T
dt
t
z
x
T
dt
x
T
x
)
(
2
1
lim
)
(
1
lim
)
(
2
1
lim
2
2
2
T
T
T
T
T
T
dt
t
z
T
z
x
dt
x
T
x
)
(
2
1
lim
2
)
(
2
1
lim
2
2
2
2
2
2
)
(
z
x
x
2
2
2
2
)
(x
x
z
-
wariancja

5
Wykład 19
Sygnały stochastyczne w układach
automatyki (c.d.)

6
T
T
T
x
dt
t
x
t
x
T
R
)
(
)
(
2
1
lim
)
(
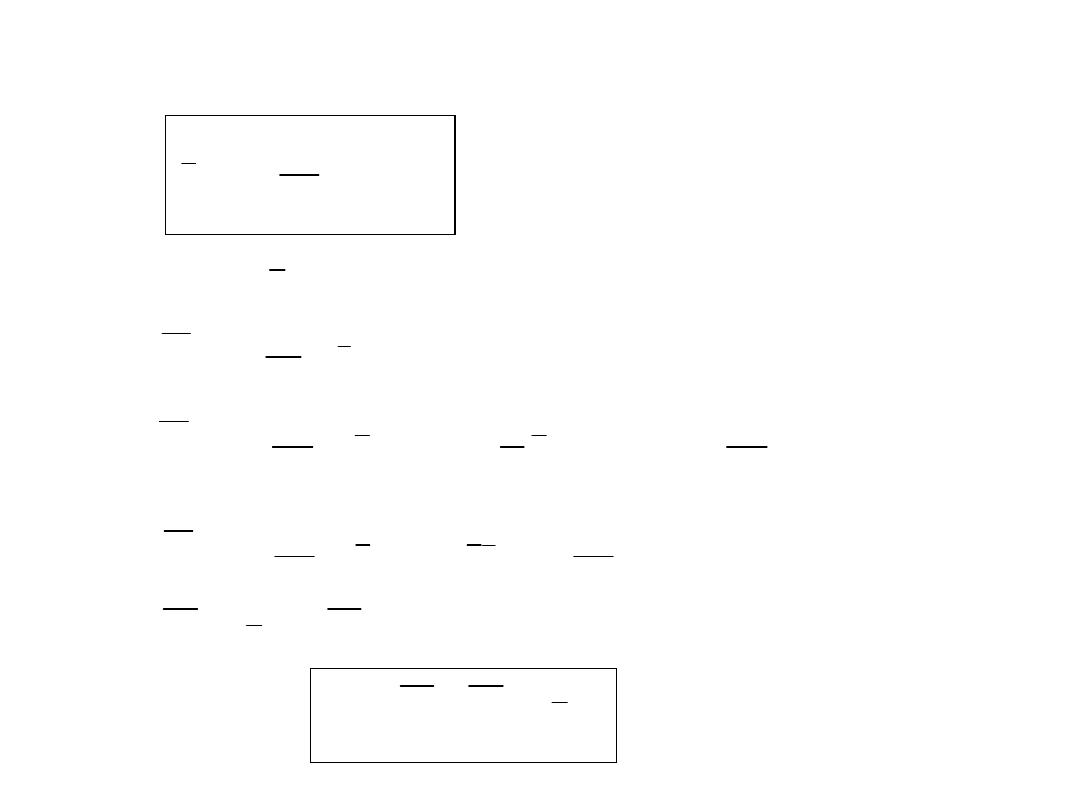
Funkcja autokorelacji
2
)
(
)
(
x
R
x
2
2
)
(
2
1
lim
)
0
(
x
dt
t
x
T
R
T
T
T
x
)
(
)
(
x
x
R
R
7
T
T
T
dt
t
x
t
x
T
R
)
(
)
(
2
1
)
(
R
x
(
)
R
x
(
)
2
x
0
0
8
Funkcja korelacji wzajemnej
T
T
T
yx
dt
t
y
t
x
T
R
)
(
)
(
2
1
lim
)
(
)
(
)
(
yx
xy
R
R
)
0
(
)
0
(
)
(
y
x
xy
R
R
R

9
Gęstość widmowa ergodycznego sygnału
stacjonarnego
2
2
)
(
2
1
lim
x
dt
t
x
T
P
T
T
T
T
t
dla
t
x
T
t
T
dla
t
x
t
x
T
T
0
)
(
)
(
)
(
2
2
)
(
2
1
lim
T
T
T
x
dt
t
x
T
P

10
d
j
X
dt
t
x
2
2
)
(
2
1
)
(
d
j
X
T
P
T
T
2
)
(
2
1
2
1
lim
d
T
j
X
P
T
T
2
)
(
lim
2
1
2
T
j
X
S
T
T
x
2
)
(
lim
)
(
2
d
S
x
P
x
)
(
2
1
2
- gęstość
widmowa mocy
sygnału
)
(
)
(
x
x
S
S

11
)
(
)
(
2
1
lim
)
(
j
Y
j
X
T
S
T
T
T
xy
dt
e
t
x
j
X
t
j
T
T
)
(
)
(
dt
e
t
y
j
Y
t
j
T
T
)
(
)
(
)
(
)
(
yx
xy
S
S

12
Związek między funkcją korelacji i gęstością
widmową
d
e
R
S
j
x
x
)
(
)
(
d
e
S
R
j
x
x
)
(
2
1
)
(
d
R
j
d
R
S
x
x
x
sin
)
(
cos
)
(
)
(
d
S
j
d
S
R
x
x
x
sin
)
(
2
1
cos
)
(
2
1
)
(
0
cos
)
(
2
)
(
d
R
S
x
x
0
cos
)
(
1
)
(
d
S
R
x
x
13
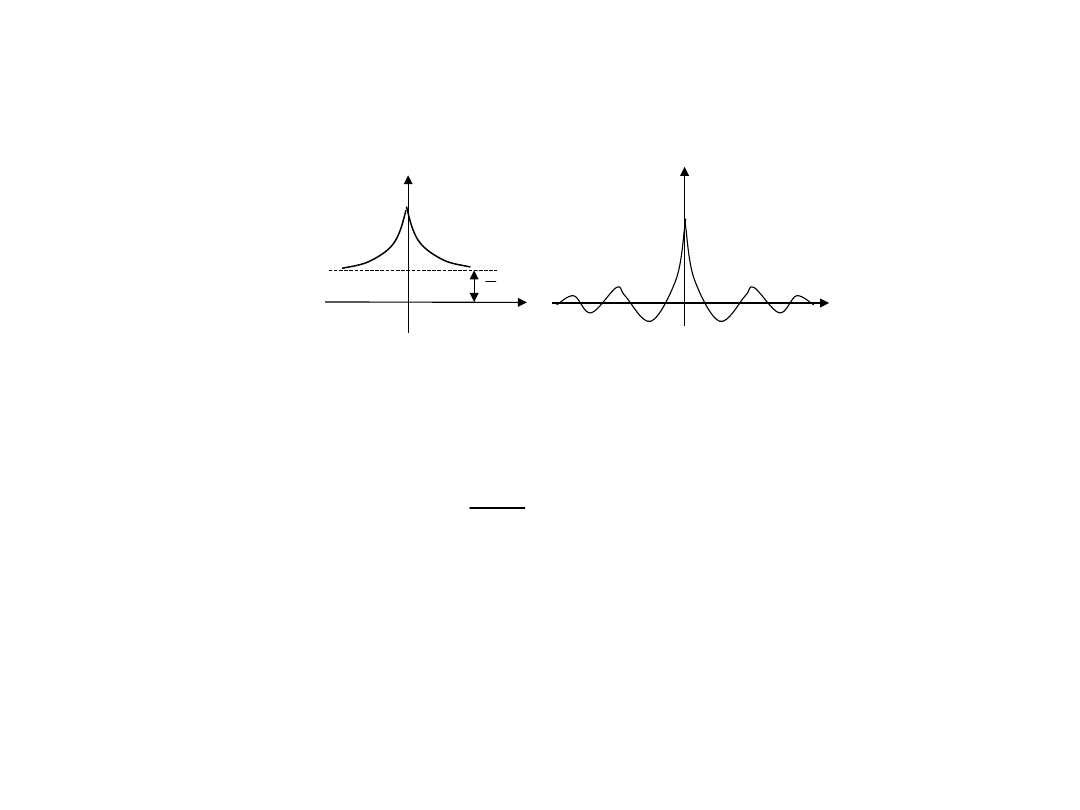
)
(
x
S
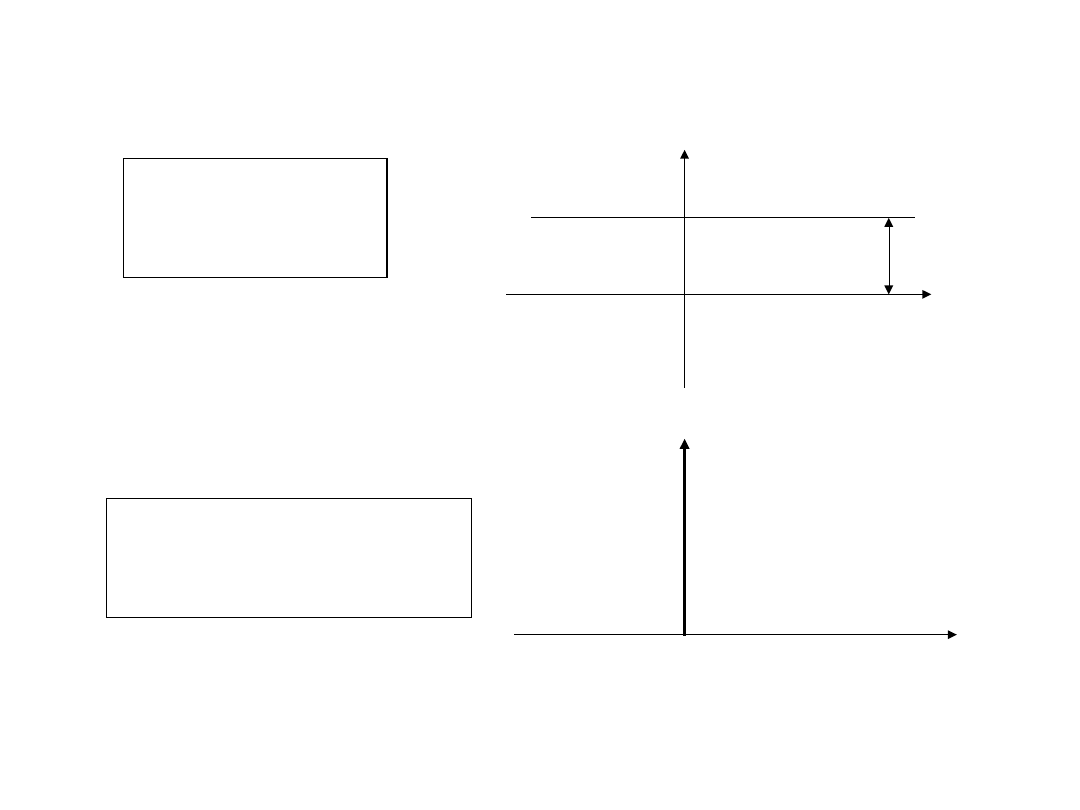
Szum biały
)
(
)
(
c
R
x
c
S
x
)
(
c
0
0
)
(
x
R
Document Outline
- Slide 1
- Slide 2
- Slide 3
- Slide 4
- Slide 5
- Slide 6
- Slide 7
- Slide 8
- Slide 9
- Slide 10
- Slide 11
- Slide 12
- Slide 13
Wyszukiwarka
Podobne podstrony:
18i19
PTSiSS 6
PTSiSS 14
PTSiSS 10
PTSiSS 11
PTSiSS 7
PTSiSS 12
PTSiSS 8
PTSiSS 14 1
PTSiSS 13 i 14
PTSiSS 9
PTSiSS 15
Automatyka 18i19
więcej podobnych podstron