
M
OLECULAR BIOLOGY OF NUCLEIC ACID
-
EXPERIMENTAL METHODOLOGY
Katarzyna Węgrzyn & Igor Konieczny
Laboratory of Molecular Biology
IFB UG & MUG
Course book prepared as part of the project: „Kształcimy najlepszych kompleksowy program rozwoju
doktorantów, młodych doktorów oraz akademickiej kadry dydaktycznej Uniwersytetu Gdańskiego”
Project no: UDA-POKL.04.01.01-00-017/10-00
Intercollegiate Faculty of Biotechnology UG&MUG
Gdańsk 2012


Molecular biology of nucleic acid - experimental methodology
3
by Katarzyna Węgrzyn & Igor Konieczny
Table of contents
CHAPTER 1. POLYMERASE CHAIN REACTION (PCR)
.......................................................................................... 7
........................................... 15
CHAPTER 3. GEL MOBILITY SHIFT ASSAY
CHAPTER 5. SURFACE PLASMON RESONANCE (SPR)
.......................................................................................27
CHAPTER 6. CHROMATIN IMMUNOPRECIPITATION ASSAY (CHIP)
..................................................................32
CHAPTER 8. TWO DIMENSIONAL ELECTROPHORESIS OF NUCLEIC ACIDS
........................................................49
CHAPTER 9. METHODS FOR ORIGIN REGION DETERMINATION
.......................................................................54
CHAPTER 10. METHODS FOR IN VITRO ANALYSIS OF REPLICATION INITIATION
..............................................57


Molecular biology of nucleic acid - experimental methodology
5
by Katarzyna Węgrzyn & Igor Konieczny
Introduction
It is more than 10 years after the completion of the draft sequence of the human genome was
published in Nature and more than 140 years after the discovery of nucleic acids. During this time
molecular biology was borne and became the most important branch of biology and probably
the most important science today. In 1961, William Astbury described molecular biology as ”not so
much a technique as an approach, an approach from the viewpoint of the so-called basic sciences
with the leading idea of searching below the large-scale manifestations of classical biology for the
corresponding molecular plan. It is concerned particularly with the forms of biological molecules and
[...] is predominantly three-dimensional and structural – which does not mean, however, that it is
merely a refinement of morphology. It must at the same time inquire into genesis and function.”
Modern molecular biology describes biological systems on the molecular level, describes
molecules, mainly proteins and nucleic acids. Research conducted on nucleic acids formed
fundaments for modern molecular biology and modern science. The development of this knowledge
was only possible due to the development of techniques allowing the analysis of molecules in cells.
A variety of methods was discovered allowing the identification of proteins and nucleic acids, analysis
of their sequence and structure, as well, and probably most importantly, interactions between
proteins and nucleic acids. The discovery of methods for DNA sequencing, amplification and analysis
were honored by the Nobel committee, showing the importance of those discoveries. This amazing
development of molecular biology techniques allows the accumulation of new knowledge on
the structure and functioning of biological systems. The results of molecular biology experiments are
important nowadays for substantially all biology branches such as microbiology, structural biology,
developmental biology, neurobiology, physiology, ecology and many others. Molecular biology forms
the bases and is a part of medical sciences and pharmacology. Drug discovery, development of
modern therapies would not be possible without molecular biology, it’s techniques and data
accumulated from thousands of experiments conducted day after day in laboratories all over
the world. That data and the discovery and development of new techniques are bringing progress to
our understanding of living organisms and allow the implementation of this knowledge for our
benefit.
Here we present a brief description of selected basic techniques used in molecular biology
for the analysis of nucleic acids. The described techniques are important for understanding basic
concepts of molecular biology and understanding complex technology and experimental approaches.
Studying molecular biology methods brings the understanding of their bases and appreciation of
the intellectual input standing behind their discovery and development. Also, it brings the ability to
understand results described in science publications. The understanding of the fundaments of
particular techniques is critical for their proper application. The presented selection will be boarded
and permanently modified to create the most suitable tool for students during molecular biology
studies with particular emphasis on nucleic acids. The selection shows principles for basic techniques
analyzing nucleic acids, difficulties in the application of these techniques and possible applications of
particular methods. At the end of each chapter the reader can find further literature for reading
and questions which should help with deeper understanding of the presented matter.

6
Molecular biology of nucleic acid - experimental methodology
by Katarzyna Węgrzyn & Igor Konieczny
Important dates and facts in the history of molecular biology
1869 Fritz Miescher discovers that the pus cells contain an substance to which he gave the name 'nuclein'
1871 Discovery of nucleic acids
1910 Discovery that genes lie on chromosomes
1913 Chromosomes are linear arrays of genes
1919 Phoebus Aaron Levene proposes the 'tetranucleotide' structure of DNA
1927 Mutations are physical changes in genes
1928 Frederick Griffith described in bacteria the phenomenon 'transformation'
1931 Discovery of crossing over recombination
1938 Rudolf Signer, Torbjorn Caspersson and Einer Hammarsten estimated molecular weights for DNA between
500 000 and 1 000 000 daltons
1944 Oswald Avery, Colin MacLeod and Maclyn McCarty described that Griffith's transforming is DNA based.
They proposed that DNA may be the genetic material
1949 Erwin Chargaff proposed that DNA base composition varies from one species to another and proposed the
so called Chargaff’s rules
1949 Roger and Colette Vendrely and André Boivin find that half as much DNA in the nuclei of sex cells is
present in the body cells
1951 Rosalind Franklin distinguishes two forms of DNA
1952 Discovery that viral DNA but not proteins enters the bacterial cell (Al Hershey and Martha Chase)
1952 X-ray diffraction pattern of the B form of DNA (Rosalind Franklin and Raymond Gosling)
1953 James Watson and Francis Crick, Rosalind Franklin and Raymond Gosling, Maurice Wilkins, W. E. Seeds,
Alec Stokes and Herbert Wilson, and Bertil Jacobson publish on the structure of DNA
1954 George Gamow proposed that DNA code for the synthesis of proteins
1955 Seymour Benzer analyses the structure of DNA of a bacterial virus close to the distances of the individual
bases
1957 The ‘sequence hypothesis' and 'the central dogma' (Francis Crick)
1958 Matthew Meselson and Franklin Stahl demonstrate that DNA replication is semi-conservative
1959 Arthur Kornberg isolates the enzyme DNA polymerase
1961 Description that a sequence of nucleotides encodes a particular amino acid. The genetic code was
depicted (Marshall Nirenberg and Johann Heinrich Matthaei)
1961 mRNA discovery, “Operon Model” by Jacob and Monod
1962 The Nobel prize in medicine is awarded to James Watson, Francis Crick and Maurice Wilkins
1963 “Replicon Model” by Jacob and Brenner
1967 The antisense RNA
1968 The discovery of restriction enzymes (Arber, Smith, Natans)
1972 The introduction of recombinant DNA technology (Boyer, Cohen)
1977 The antisense technology (Zamecnik)
1977 DNA sequence analysis methods (Sanger, Maxam, Gilbert)
1979 Z-DNA form is discovered by Rich
1982 National Institute of Health established GeneBank
1983 Polymerase Chain Reaction developed by Mullis
1990 The beginning of the Human Genome Project
1995 H. influenza genome
1996 Sacharomyces cerevisiae genome
1998 C. elegance genome
2001 Human genome sequence published
2007 The beginning of high speed modern DNA sequencing technology
L
ITERATURE
Astbury W.T, 1961, Molecular Biology or Ultrastructural Biology? Nature 190: 1124
The Human Genome at Ten, 2010 Nature 470
The double helix – 50 years. 2003, Nature 421

Molecular biology of nucleic acid - experimental methodology
7
by Katarzyna Węgrzyn & Igor Konieczny
CHAPTER 1. Polymerase chain reaction (PCR)
The polymerase chain reaction is one of the most popular techniques in molecular biology
(e.g. for amplification particular DNA fragment designed for cloning), diagnostic (e.g. for analysis of
point mutations), forensic sciences (e.g. for affiliating fatherhood) etc. It was developed in 1983 by
Kary Mullis, who in 1993 was awarded the Nobel Prize in chemistry. The polymerase chain reaction
enables the amplification of the initial amount of nucleic acid, which increases exponentially and can
be calculated from the formula:
N = N
0
× 2
n
where N is the amount of the product of the reaction
N
0
is the amount of the template
n is the number of cycles
Unfortunately this formula does not take into account the reaction efficiency. If the reaction
efficiency is E, it can be added to the formula:
N = N
0
× (1 + E)
n
At the beginning of the reaction in the initial cycles, the reaction efficiency is usually 0.8-0.97 and it
decreases parallel with the accumulation of the reaction product, with the decrease of nucleotides
and primers and also with the decrease of enzyme activity.
In order for the PCR reaction to take place, the reaction mixture has to contain:
− DNA template (theoretically just one DNA molecule is sufficient to obtain amplification product.
Usually the amount of 1-10ng bacterial DNA, 0.1-1ng plasmid DNA or up to 500ng human genomic
DNA is used as a template)
− polymerase (the enzymes used in PCR are isolated from thermostabile bacteria and their
optimum temperature is around 70°C. Depending on the amplification product destination
a polymerase with different processivity and fidelity is chosen. The most common one is Taq
polymerase obtained from Thermus aquaticus. Since it is characterized by high processivity but
lower fidelity it is used to obtain high amount of the PCR product. If high fidelity is needed then
the Pfu polymerase from Pyrococcus furiosus or Pwo from Pyrococcus woesei are usually used.
For a standard 50 µl reaction 1U of enzyme is used)
− primers (they are short DNA fragments, usually around 25bp, that contain 40-60% of GC residues.
They are complementary to the particular regions within the DNA template, that flank the region
which is going to be amplified. Primer melting temperature (Tm) should be the same for both of
them and is usually around 50-60°C. It is important that they do not form secondary structures
and are not complementary to each other. The concentration of both of them should be around
0.2-1 µM)
− Mg
2+
(this ion is a polymerase cofactor. Its concentration should be around 2mM but very often
has to be estimated individually for a particular PCR experiment. The excess of Mg
2+
can inhibit
the PCR reaction by interaction with nucleotides, what decreases the amount of available
nucleotides in the reaction mixture)
− dNTPs (they are dATP, dTTP, dGTP, dCTP. The concentration of each of them should be up to
200 µM and should not be exceeded, since the excess of dNTPs can result in a unspecific reaction
8
Molecular biology of nucleic acid - experimental methodology
by Katarzyna Węgrzyn & Igor Konieczny
product and can chelate the Mg
2+
ions. On the other hand, a too low concentration of dNTPs
results in quick arrest of the reaction via the depletion of reaction components)
− buffer (the standard buffer for the PCR reaction contains 10-50mM Tris pH 8-9 and sodium
or potassium salts)
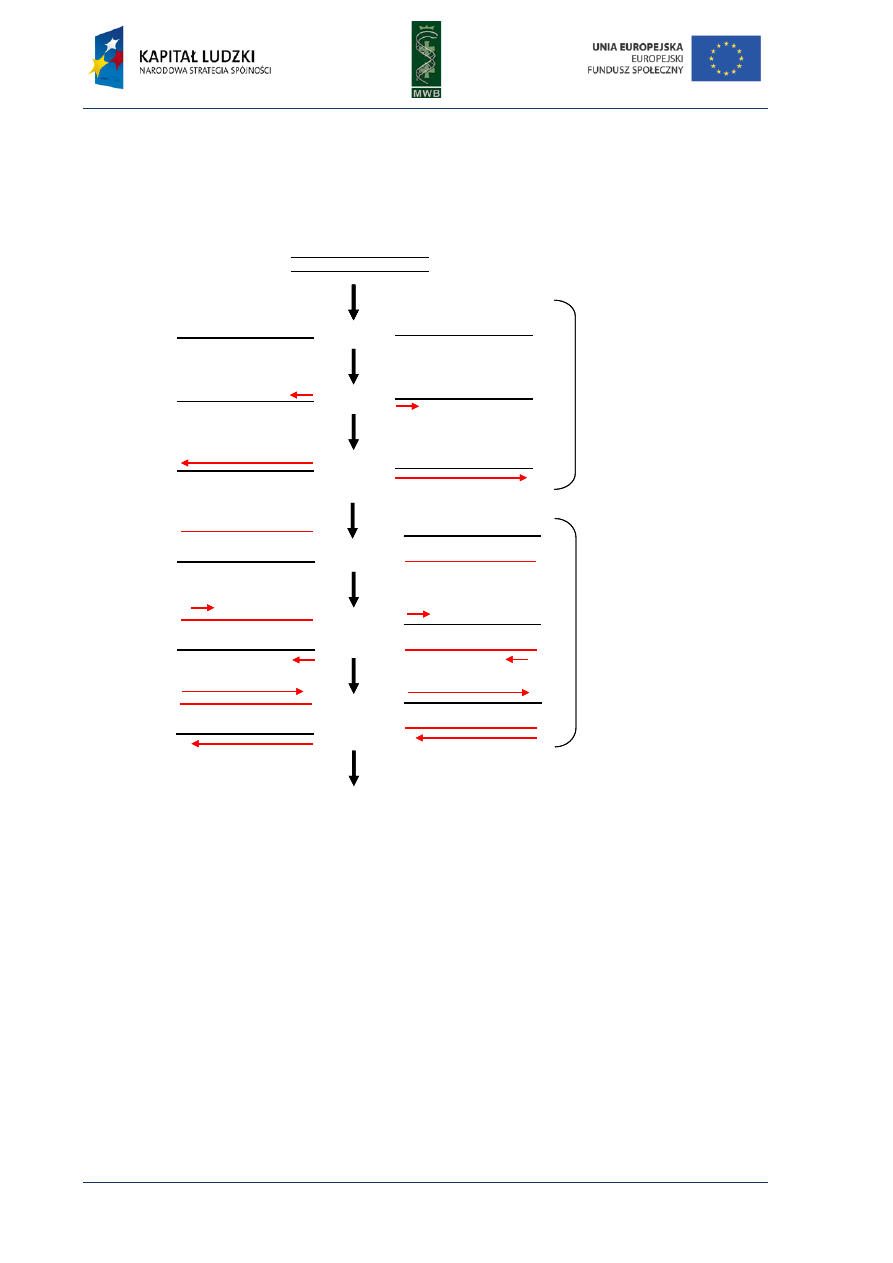
Fig. 1. Scheme of the first and second cycle during the polymerase chain reaction. The template used in the
reaction is presented in black, primers and synthesized complement strand are presented in red.
Three main steps can be distinguished in the PCR reaction (Fig. 1):
1. Denaturation - it is the first step during which by heating the reaction mixture to 95°C for 30-120
sec. the DNA template melts)
2. Annealing - it is a step when the primers hybridize to the complement strand of DNA template.
It is carried out for 30-60 sec. in a temperature that depends on the melting temperature (Tm)
of primers. The simplest formula to calculate the Tm takes into account the number of AT and GC
residues within the primer
Tm = 2°C × (A+T) + 4°C × (G+C)
The annealing temperature is usually 5°C lower than the Tm, however it should be optimized for a
particular pair of primers.
5’
3’
5’
3’
5’
3’
5’
3’
5’
3’
5’
3’
5’
3’
5’
3’
denaturaion
annealing
elongation
the first cycle
denaturation
denaturation
5’
3’
5’
3’
5’
3’
5’
3’
annealing
5’
3’
5’
3’
5’
3’
5’
3’
elongation
5’
3’
5’
3’
5’
3’
5’
3’
next cycles
second cycle
5’
3’
5’
3’
5’
3’
5’
3’
5’
3’
5’
3’
5’
3’
5’
3’
5’
3’
5’
3’
5’
3’
5’
3’
5’
3’
5’
3’
5’
3’
5’
3’
5’
3’
5’
3’
denaturaion
annealing
elongation
the first cycle
denaturation
denaturation
5’
3’
5’
3’
5’
3’
5’
3’
5’
3’
5’
3’
annealing
5’
3’
5’
3’
5’
3’
5’
3’
5’
3’
5’
3’
elongation
5’
3’
5’
3’
5’
3’
5’
3’
5’
3’
5’
3’
next cycles
second cycle

Molecular biology of nucleic acid - experimental methodology
9
by Katarzyna Węgrzyn & Igor Konieczny
3. Elongation - in this step the primers are elongated and nucleotides complementary to
the template are added. The elongation temperature depends on the optimum temperature of
the enzyme and the time of this process depends on the processivity of polymerase. For instance
Taq polymerase can add 1000 nucleotides in 1 min and for Pfu polymerase it takes 2 min.
The elongation time should be applied properly since a too long elongation can result in
unspecific products and too short can lead to no product formation).
These three steps are repeated 20-30 times, one after the other as a rule. Usually the first cycle is
preceded by initial denaturation in 95°C for up to 2 min and the last one is followed by terminal
elongation in 72°C for 5 min.
The PCR products are then further analyzed by electrophoresis.
A
BRIDGED
PCR
PROGRAM
Temperature
Time
1. 95°C
30 sec
2. 95°C
30 sec
3. Tm-5°C
30 sec
4. 72°C
time (sec) = (number of base pairs/ 1000 for Taq) × 60
Steps from 2 to 4 are repeated 20-30 times
5. 72°C
30 sec
T
ROUBLESHOOTING
1. If there is no PCR product:
− the temperature of primer annealing should be decreased
− the elongation time should be increased
− the Mg
2+
concentration should be optimized
− the dNTPs concentration should be increased
− the DNA template concentration should be checked
− the formation of secondary structures by primers should be checked
− the primers concentration should be checked
2. If shorter unspecific products are present
− the elongation time should be increased
− the temperature of primer annealing should be increased
− the contamination of the reaction mixture components should be checked
3. If longer unspecific products are present
− the elongation time should be decreased
− the concentration of dNTPs and primers should be decreased
− the temperature of primer annealing should be increased
− the contamination of the reaction mixture components should be checked

10
Molecular biology of nucleic acid - experimental methodology
by Katarzyna Węgrzyn & Igor Konieczny
Variety of the method
PCR-RFLP (PCR- Restriction Fragment Length Polymorphism)- is a technique, in which the DNA from
different species e.g. the wild type and the mutant, is amplified and the PCR products are digested
with restriction enzymes. The electrophoretic analysis of obtained restriction fragments results with
restriction profile of the organism (DNA fingerprint). The profiles can be compared between
the organisms and show the differences in restriction sites and therefore the differences in
the sequences.
PCR-SSCP (PCR-Single Strand Conformation Polymorphism) – the first step in PCR-SSCP is the classical
PCR reaction, which is followed by denaturation of the obtained amplification products. The received
ssDNA is then separated in a gel during electrophoresis. Because various ssDNA can form different
secondary structures, ssDNA molecules with the same length can migrate differently in the gel. The
distinctions in the migration can be observed even for the molecules that differ in just one
nucleotide. Therefore the PCR-SSCP can be utilized for mutational analysis.
RAPD-PCR (
RT-PCR (Reverse Transcription - PCR) – is the PCR reaction during which the RNA is transcribed into
cDNA by reverse transcriptase. The cDNA can be used then as a template in classical PCR. Both
reverse transcription and classical PCR can be performed either in one tube or separately.
The transcription of RNA into cDNA occurs at 40-50°C depending on the reverse transcriptase,
further DNA amplification is performed according to the standard PCR protocol. The method can be
useful during gene library preparation and other techniques where cDNA is utilized.
Random Amplification of Polymorphic DNA – PCR) – is a PCR reaction in which the
amplifying region is essentially unknown. It utilizes just one short (10-20 nucleotides) random primer
with high content of GC residues. In first two cycles of RAPD-PCR, the primer annealing is performed
in low temperature (35-45°C), allowing the random hybridization of the primer, even to not fully
complement sequences of the template. In the following cycles, the annealing occurs in temperature
characteristic for the primer. Since DNA of different organisms is not identical, the band pattern
formed by RAPD-PCR products in agarose electrophoresis can be utilized to distinguish them and
evaluate the relationship between the organisms.
Real-time PCR – is the PCR reaction during which the increasing amount of the reaction product is
monitored in real time. There are common methods of detection of reaction progression: using
fluorescent dye like Sybr Green or TaqMan probes. The first one utilizes the dye, which intercalates
the dsDNA. Since the PCR product is intercalated by the fluorescent dye, the more product the more
fluorescence detected. In the second method, the TaqMan probes ( short DNA fragment with
a fluorescent tag at 5’ and a quencher at 3’ end respectively) anneal to the amplifying region and are
degraded by polymerase during elongation of the primer. The degradation of the probe causes
the separation of the fluorescent tag from the quencher, what results with fluorescence of
the fluorophore. Therefore the more amplification reactions the more fluorescence detected. One of
the most important parameters of real-time PCR is threshold cycle (C
T
), indicating the cycle at which
the instrument can distinguish the amplification generated fluorescence from the background.
It depends on the initial amount of DNA template, since the higher number of DNA template
molecules the lower C
T
. The estimation of investigated DNA copy number requires the standard
curve tracing, which is the C
T
plotted against template copy number (Fig. 2B). To trace the standard
curve the PCR reaction with a different known copy number of DNA template should be performed.
Molecular biology of nucleic acid - experimental methodology
11
by Katarzyna Węgrzyn & Igor Konieczny
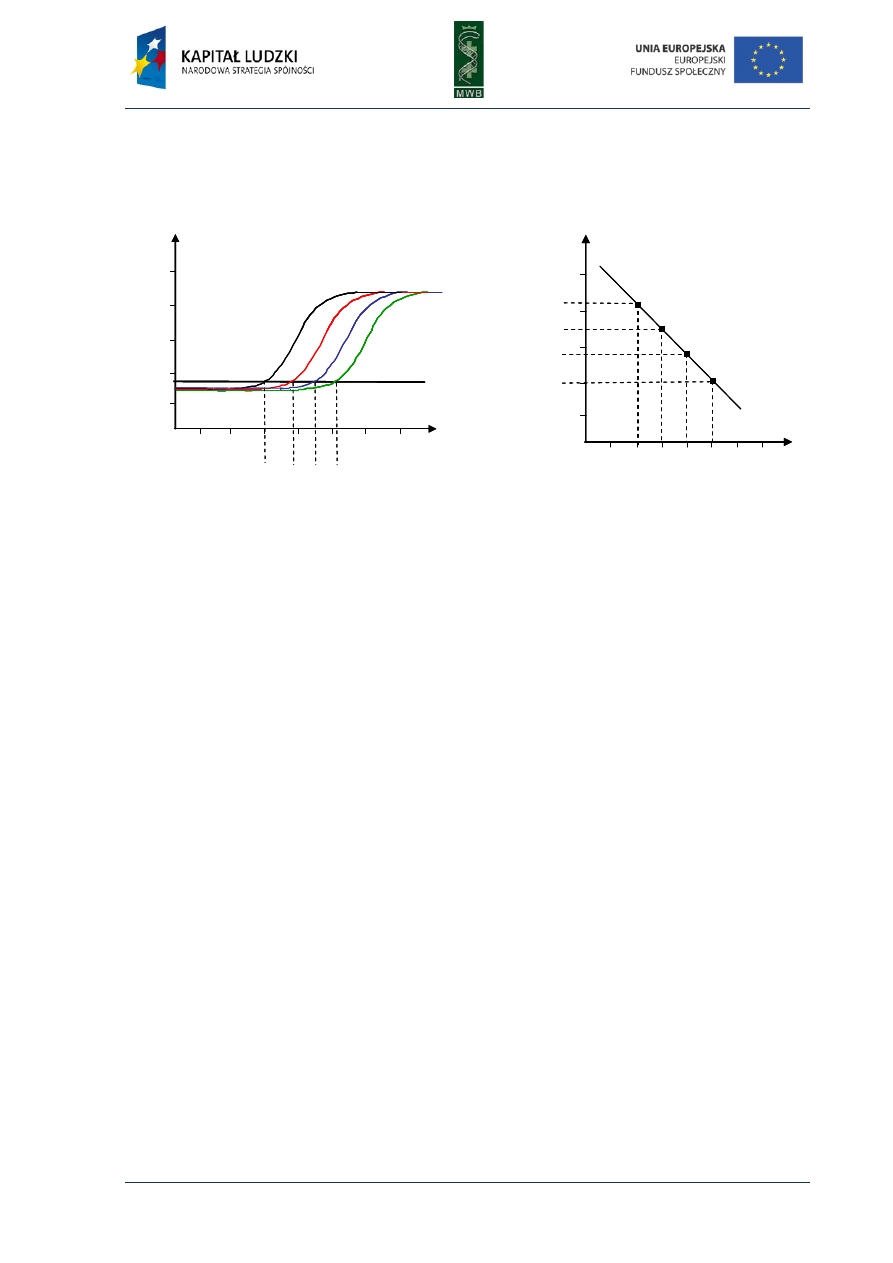
As a result the curves showing the dependence between the fluorescence and cycle numbers are
obtained and for each curve the C
T
value can be read out (Fig. 2A). Then the C
T
values are plotted
against template copy number resulting with standard curve (Fig. 2B).
Fig 2. Real-time PCR curves. (A) The graph shows the curves of detected fluorescence dependence from
number of cycles. The addition of higher amount of a template results with lower cycle number in which
the thermocycler can detect the fluorescence. The green curve represents the reaction with the lowest
template amount and the black curve with the highest one. A thick black line shows the threshold, which is
a fluorescence above which the instrument can distinguish the amplification generated fluorescence from
the background. (B) The standard curve determined during real-time PCR reactions with increasing known
amounts of a template. The curve shows the dependence of threshold cycle C
T
from a template copy numbers.
When the standard curve is traced, next the final experiment of template copy number
determination in the investigated samples can be performed. After the real-time PCR reaction with
investigated samples as a template, the threshold cycle can be obtained. Then the C
T
value serves to
read off the template copy number from the standard curve.
Emulsion PCR – is a classical PCR reaction but performed in a drop of water-in-oil emulsion, what
facilitates the amplification of genomic libraries and cDNA libraries. It requires the preparation of
an oil-surfactant mixture (e.g. mixture of Span80, Tween 80, Triton X-100 and mineral oil) and
aqueous phase, which is the classical PCR reaction mixture. Then the aqueous phase is added to the
oil phase in a dropwise manner and the mixture should be stirred for few minutes. After that the PCR
reaction can be performed and when it is finished the amplification product should be extracted
from the emulsion. This kind of PCR is used for instance during next-generation of sequencing
methods such as Sequencing by Oligonucleotide Ligation and Detection (SOLiD).
cycle number
fl
uor
es
c
enc
e
5
10
15
20
25
30
35
threshold
C
T
1 C
T
2 C
T
3 C
T
4
cycle number
fl
uor
es
c
enc
e
5
10
15
20
25
30
35
threshold
C
T
1 C
T
2 C
T
3 C
T
4
template copy number
thr
es
hol
d
c
yc
le
num
ber
(C
T
)
10
4
10
5
10
6
10
7
10
8
10
15
20
25
30
C
T
1
C
T
2
C
T
3
C
T
4
10
9
template copy number
thr
es
hol
d
c
yc
le
num
ber
(C
T
)
10
4
10
5
10
6
10
7
10
8
10
15
20
25
30
C
T
1
C
T
2
C
T
3
C
T
4
10
9
A
B
12
Molecular biology of nucleic acid - experimental methodology
by Katarzyna Węgrzyn & Igor Konieczny
L
ITERATURE
Bartlett J. M. S. & Stirling D, 2003, PCR protocols, Methods Mol. Biol. 226, Humana Press.
Dieffenbach C.W. & Dveksler G.S, 2003, PCR primer: a laboratory manual. Second edition, Cold Spring Harbor
Laboratory Press.
Williams R, Peisajovich S.G, Miller O.J, Magdassi S, Tawfik D.S, Griffiths A.D, 2006, Amplification of complex
gene libraries by emulsion PCR, Nature Methods 3(7): 545-550.
McPherson M. J. and Møller S. G, 2006, PCR. Second edition, Taylor & Francis Group.
Q
UESTIONS
1. What kind of PCR would you perform during:
a. plasmid analysis
b. copy number estimation
c. mutational analysis
d. library preparation
2. What is the difference between the first and the next cycles of PCR reaction?
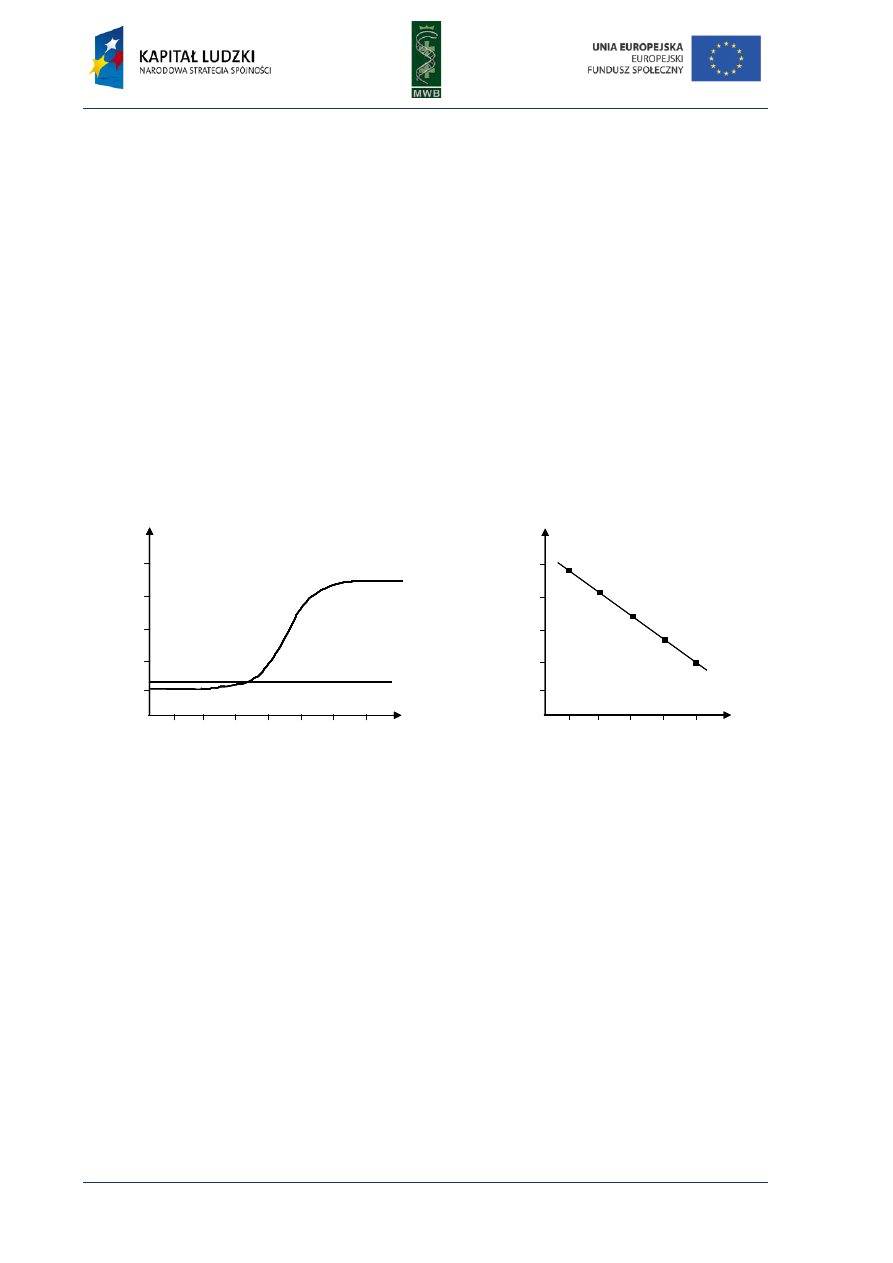
3. Figure shows the result of real-time PCR (A). Based on the standard curve (B) determine the template copy
number within the analyzed sample.
cycles
fl
uor
es
c
enc
e
threshold
10
14
18
22
26
30
34
cycles
fl
uor
es
c
enc
e
threshold
10
14
18
22
26
30
34
template copy number
thr
es
hol
d
c
yc
le
num
ber
10
4
10
5
10
6
10
7
10
8
10
15
20
25
30
template copy number
thr
es
hol
d
c
yc
le
num
ber
10
4
10
5
10
6
10
7
10
8
10
15
20
25
30
A
B

Molecular biology of nucleic acid - experimental methodology
13
by Katarzyna Węgrzyn & Igor Konieczny
CHAPTER 2. DNA sequencing
DNA sequencing started almost forty years ago. In this time the methods developed in 1970s
by Sanger or Maxam and Gilbert were improved many times and they are still perfected to read as
many DNA sequences as fast as possible. The automation of sequencing as well as the application of
new solutions (Polony sequencing, pyrosyquencing, Illumina sequencing, SOLiD sequencing)
remarkably reduce labor time and make this process easier, more accurate and reliable.
Maxam-Gilbert sequencing method
Two scientist from Harvard University, Allan Maxam and Walter Gilbert in 1977 developed the
sequencing method called chemical sequencing. It is based on chemical degradation of the 5’-end
radiolabeled DNA fragment of interest. The DNA can be either single or double stranded and
the cleavage reactions are performed in four tubes. To each of them a diverse cleavage agent,
modifying different nucleotide and therefore diverse in cutting position, is added. The action of the
chemical is based on three steps: modification of the nitrogenous base by the chemical, removal of
the base from the sugar and breaking of the DNA at the sugar point (often supported by adding hot
piperidine to the sample). After the cleavage reactions, the obtained DNA fragments are separated in
a polyacrylamide gel, resolution of which is the main limitation of this sequencing method. Because
the DNA utilized in the reactions is labeled, the visualization of the bands is easy with the use of
autoradiography and the sequence can be read based on the analysis of all the bands (Fig. 3).
Cleavage agents:
− dimethyl sulfate (DMS) - cleaves preferentially guanine (G) through its methylation, causing
destabilization of a glycosidic bond; in some conditions it can also cut adenine (A+G)
− acid (e.g. formic acid) – cleaves both adenine and guanine (A+G)
− dimethyl sulfate with acid or alkali - cleaves adenine (A)
− hydrasine – cleaves the cytosine and thymine (C+T)
− hydrasine with 2M NaCl - cleaves the cytosine
Fig. 3. DNA sequencing gel after Maxam-Gilbert sequencing
method. The products of four degradation reactions are
separated in four lanes. In every reaction a different cleavage
agent is used that preferentially degrades glycosidic bond
between sugar and nitrogenous base: guanine (G), guanine or
adenine (G+A), cytosine or thymine (C+T) and cytosine (C).
Sanger sequencing method
The method was developed in 1977 by Frederick Sanger’s group and was first used for
sequencing of the ΦX174 bacteriophage genome. The Sanger method, also called
the chain-termination method is based on termination of the DNA synthesis reaction after
the incorporation of a dideoxynucleotide triphosphate (ddNTP). The DNA synthesis is performed in
G
G+A
C+T
C
T
C
G
C
G
T
A
C
G
A
G
G+A
C+T
C
T
C
G
C
G
T
A
C
G
A

14
Molecular biology of nucleic acid - experimental methodology
by Katarzyna Węgrzyn & Igor Konieczny
four separate tubes, containing, besides the DNA template, a primer and a DNA polymerase, one
ddNTP triphosphate (ddATP, ddTTP, ddGTP or ddCTP) and three remaining deoxynucleotide
triphosphates (dNTP). Since the modified nucleotides do not contain a 3’-OH group,
the phosphodiester bond cannot be formed between the ddNTP and the next dNTP. In each tube the
reaction is stopped in a position of a nucleotide with different nitrogenous base A, T, G or C,
depending on the ddNTP added. Because of the small amount of the ddNTP in reactions the chain
termination occurs rarely and stochastically ( statistically once per each template DNA). The products
of the synthesis reaction are separated in a poliacrylamide gel and a visualization of the DNA
fragments is achieved due to the use of radio- or fluorescent- labeled ddNTPs (Fig. 4). A labeled
primer or dNTPs can also be used in the reaction.
Fig. 4. DNA sequencing gel after Sanger sequencing method.
The products of four DNA synthesis reactions separated in
four lanes. In every reaction different a ddNTP is added to
the reaction mixture: ddGTP (G), ddATP (A), ddTTP (T) or
ddCTP (C). When the ddNTP is incorporated into the DNA
chain the synthesis of DNA stops.
The Sanger method was the base for automated sequencing, where the synthesis reaction
products are separated by capillary electrophoresis and fluorescence is read by a detector. Currently,
automated sequencing is still being developed to obtain lower costs and higher throughput.
The challenge was also the miniaturization of the system and microchip capillary electrophoresis has
been successfully applied, what reduced the time and the reagents' volumes used and made possible
signal detection from a single molecule template.
Pyrosequencing method
This method is based on the synthesis sequencing method developed in late 1990s. It utilizes
detection of a pyrophosphate (PPi) released during a DNA polymerization reaction. The detection of
this process requires the cascade of enzymatic reactions, presented as equations:
(DNA)
n
+ dNTP (DNA)
n+1
+ PPi
PPi + APS ATP + SO
4
2-
ATP + luciferin + O
2
AMP + PPi + oxyluciferin + hv
where APS stands for adenosine 5’-phosphosulphate and hv represents an emitted photon.
In the first step, one of four dNTPs is added to the reaction and if it is incorporated to
the chain, the enzymatic cascade is triggered and a photon of light is emitted, what is detected by
a sensor and marked as a peak on the pyrogram (diagram showing detected light depending on
G
A
T
C
T
C
G
C
G
T
A
C
G
A
G
A
T
C
T
C
G
C
G
T
A
C
G
A
luciferase
ATP
sulphurylase
DNA
polymerase
Molecular biology of nucleic acid - experimental methodology
15
by Katarzyna Węgrzyn & Igor Konieczny
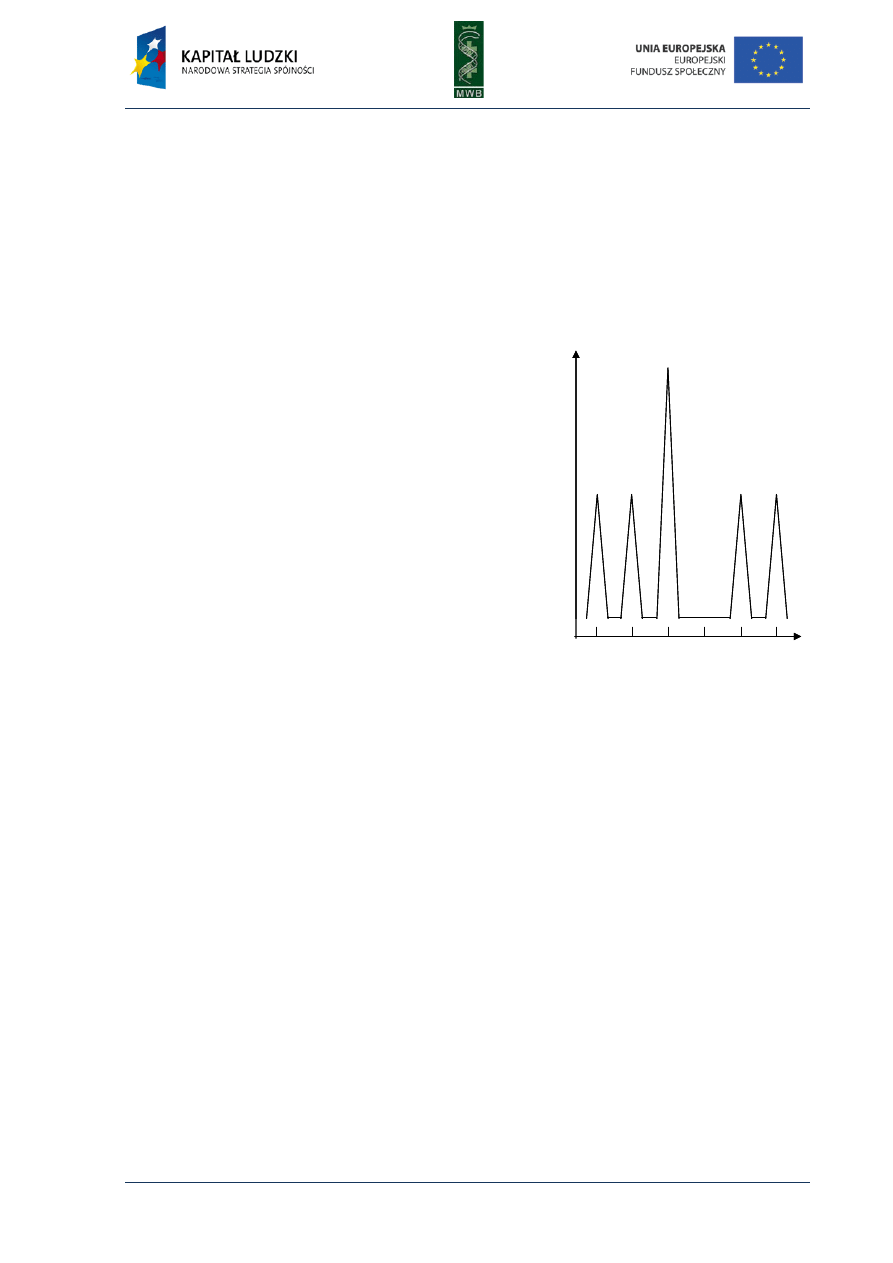
the added dNTP) (Fig. 5). If the added dNTP is not complementary to the nucleotide within
the template the light is not emitted. In the next step the second dNTP is added and so on.
The procedure is repeated as long as the whole sequence is read.
The pyrosequencing reactions can be performed as a solid-phase reaction or liquid-phase
sequencing. The first one requires washing of the non-incorporated nucleotides therefore the DNA
template is immobilized on a solid support such as magnetic beads to avoid signal decrease.
The second one omits the step of washing of the non-incorporated nucleotides by addition of
a fourth enzyme e.g. apyrase, that degrades the free nucleotides.
Fig. 5. Pyrogram. The diagram shows dependence
between detected light and added dNTP. The sequence
reads from the pyrogram what is written in red below
the diagram.
Pyrosequencing became a very popular method of reading the DNA sequence since
it eliminates the necessity of primer or dNTPs labeling and performing electrophoresis. It also
reduces time and enables real-time detection. Unfortunately, it also has some disadvantages like
the necessity of the washing step in the solid-phase sequencing or the decrease of the activity of
apyrase and its interaction with DNA in liquid-phase method. It can also bring some difficulties in
reading the proper number of the same nucleotide in homopolymeric regions where a nucleotide is
repeated more than five times due to nonlinear light response.
Sequencing by Oligonucleotide Ligation and Detection (SOLiD) sequencing
method
Sequencing by Oligonucleotide Ligation and Detection is a technique of sequencing developed
in the last few years by the Life Technology company. It has a great throughput and enables reading
of 3-4Gb in approximately 5 days. SOLiD method consist of four processes following one after
another. It starts from preparation of a library of the DNA of interest and specific adaptors (a short
DNA fragments). The adaptors are ligated to the DNA fragments and hybridize to the adaptor
complementary sequences immobilized on beads. This facilitates the deposition of a lot of DNA
fragments to a bead. Then an emulsion PCR (see Chapter 1) is performed and the clonal bead
E
m
itte
d
lig
h
t
nucleotide added
G
T
A
C
G
C
nucleotide sequence
G
T
A
C
CC
E
m
itte
d
lig
h
t
nucleotide added
G
T
A
C
G
C
nucleotide sequence
G
T
A
C
CC
nucleotide added
G
T
A
C
G
C
nucleotide sequence
G
T
A
C
CC
16
Molecular biology of nucleic acid - experimental methodology
by Katarzyna Węgrzyn & Igor Konieczny
populations are formed. Next, the beads are depositioned on a glass slide. After that, the actual
sequencing reaction can be performed (Fig. 6). During the sequencing reaction the elongation of
primer, that is hybridized to the adaptor DNA occurs. The fluorescently labeled, at the 3’end, di-
based probes are added (the probes are 8 bp oligonucleotides) and just the ones that contain
complementary sequences hybridize to the sequencing DNA (Fig. 6A). Next the non-hybridized
probes are washed and the probe that hybridizes to the template is ligated to the primer (Fig. 6B).
Since the probes differ in the first two nucleotides and are labeled with different fluorescent dyes,
after the cycle the probe which hybridized to the template and which ligated to the primer can be
identified. Therefore from the first cycle the first two nucleotides of the sequence are read. After
the ligation reaction and reading the fluorescence, the two nucleotides at the 3’ end of the probe are
cleaved (Fig. 6C) and then the next cycle can be performed. In the next cycle consecutive di-bases are
added and the seventh and eighth nucleotides of the sequence are read.
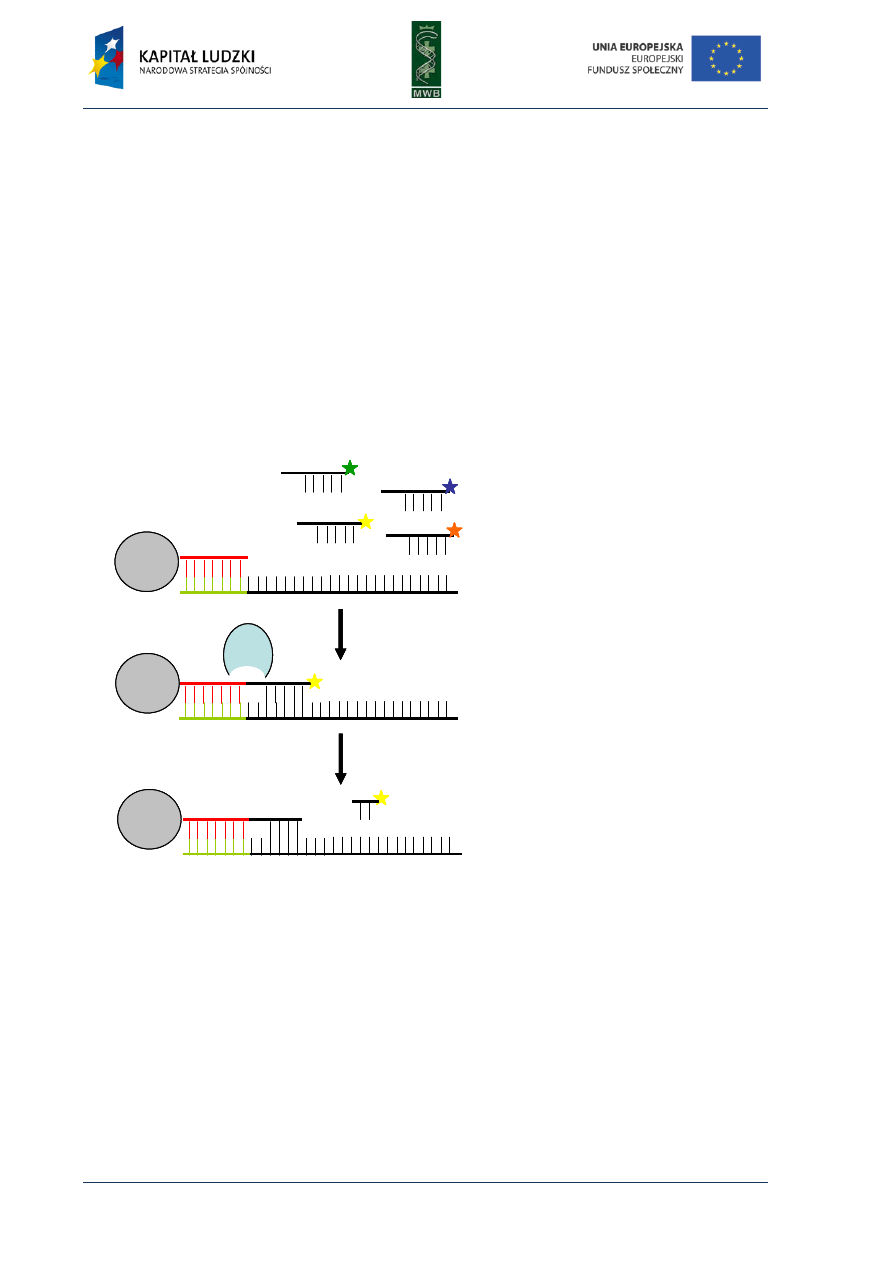
Fig. 6. The first cycle of sequencing
reaction during SOLiD sequencing
method. After the hybridization of
the primer to the adaptor sequence,
the different fluorescently labeled
di-based probes are added (A).
When the complement de-base
hybridizes to the template, the
ligase support its ligation to the
primer (B). The fluorescence is read
and then the last two nucleotides of
the probe are cleaved and removed
(C). After that the next cycle can be
performed.
In the following cycles the ligation of the probes enable the reading of every fifth and sixth
nucleotide. To read the whole sequence, primers that differ in length are used. If the length of
the first used primer is n, the length of the next one could be n-1, then n-2 and so on. This method
enables to over read the same sequence what improves the reliability of the method and because
high amounts of DNA fragments can be attached to one bead via an adaptor sequence, it enables
the preparation of a lot of sequencing reactions on a small surface.
bead
C
ligase
adapter
primer
G
G T
A C
G G
C
adapter
primer
G
C
adapter
primer
G
ligation
cleavage
bead
bead
A
B
C
bead
C
ligase
adapter
primer
G
G T
A C
G G
C
adapter
primer
G
C
adapter
primer
G
ligation
cleavage
bead
bead
bead
C
ligase
adapter
primer
G
G T
A C
G G
C
adapter
primer
G
C
adapter
primer
primer
G
ligation
cleavage
bead
bead
A
B
C

Molecular biology of nucleic acid - experimental methodology
17
by Katarzyna Węgrzyn & Igor Konieczny
L
ITERATURE
Franca L.T.C, Carrilho E, Kist T.B.L, 2002, A rewiev of DNA sequencing Techniques, Quarterly Reviews of
Biophysics 35(2): 169-200.
Graham C.A, Hill
Hindley J, Staden R, 1983, Laboratory Techniques in Biochemistry and Molecular Biology. DNA sequencing Vol.
10, Elsevier Biomedical.
A.J.M, 2001, DNA sequencing protocols, Humana Press Inc.
Janisz M, 2008,
Mardis. E. R, 2007, The impact of the next-generation sequencing technology on genetics. Trends in Genetics
24(3): 133-141.
Next-generation genome sequencing: towards personalized medicine, Wiley-Vch Verlag GmbH
& Co.
Maxam A. M, Gilbert M, 1977, A new method for sequencing DNA, Proc Natl Acad Sci USA 74(2): 560-564.
Michelson K.R, 2007, New high throughput technologies for DNA sequencing and genomics, Elsevier.
Q
UESTIONS
1. The figure shows the result of a sequencing reaction. What sequencing method was used? What was the
sequence of the analysed DNA fragment?
2. What kind of sequencing method would you choose to read the sequence of the bacterial genome in just a
few days? Explain your choice.
3. Which sequencing methods are based on fluorescence detection?
G
A
T
C
G
A
T
C
18
Molecular biology of nucleic acid - experimental methodology
by Katarzyna Węgrzyn & Igor Konieczny
CHAPTER 3. Gel Mobility Shift Assay
One of the simplest methods utilized to investigate interactions between nucleic acids and
proteins is the gel mobility shift assay (GMSA). The nomenclature of this technique is different and
names such as electrophoretic mobility shift assay (EMSA), gel shift assay or gel retardation assay are
used. Originally, GMSA was exploited to analyze rRNA-protein interactions and the action of E. coli
lactose operon regulatory system (Dahlberg et al, 1969; Fried & Crothers, 1981). The basis of
the method is a difference in the migration of naked DNA and a protein-DNA complex in an agarose
or poliacrylamide gel (Fig. 7). When a protein is bound to a DNA fragment, we observe a retardation
of a DNA band migration in a gel, compared with the migration of a naked nucleic acid.
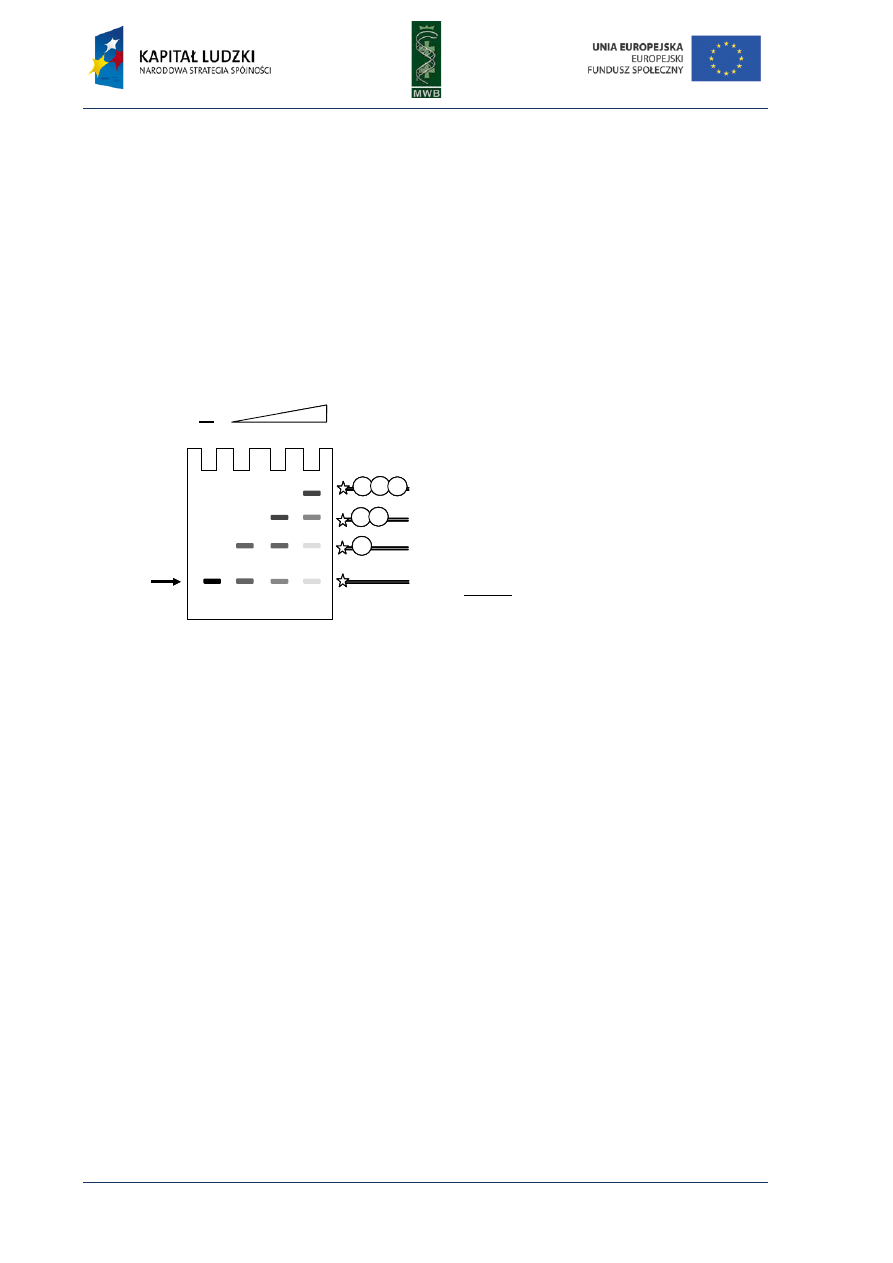
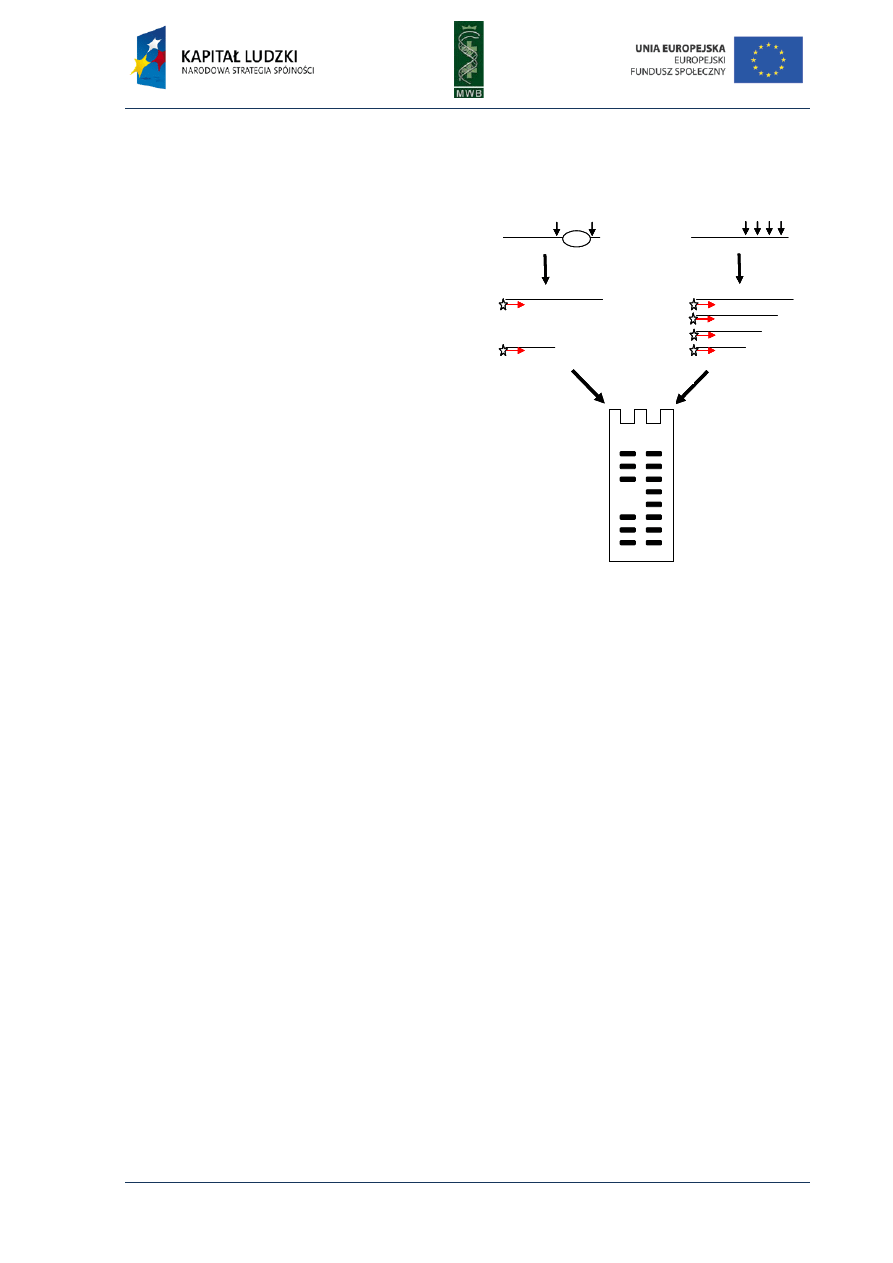
Fig. 7. Scheme of GMSA in titration of
a labeled DNA fragment with increasing
amounts of a protein. All samples contain
equal amounts of DNA (load DNA) and
increasing amounts of the protein. The more
protein was added to the sample the more
electrophoretic bands were observed.
Schematic presentation of the electropho-
retic species is shown on the right.
Since every nucleoprotein complex is different, before carrying out the GMSA, the target (nucleic
acid), the labeling method, the binding and electrophoresis conditions should be carefully selected.
Nucleic acids
Choice of the appropriate fragment of the nucleic acid (DNA or RNA), its length should be
taken into consideration. Usually, short fragments of nucleic acids are used in the GMSA
experiments. The shorter the fragment the higher electrophoretic resolution of the complexes from
free nucleic acid and the smaller the number of non-specific protein binding sites. However, with
shorter nucleic acid fragments the “end-effect” can occur, which results in aberrant protein binding.
Lengthening of the fragments can help in avoiding this limitation but can also cause such problems as
non-specific binding or smaller resolution of the bands.
When the length of the target DNA fragment is chosen then the labeling method should be
selected. To label and then to visualize the nucleic acids, radioisotopes, fluorophores or haptens can
be used. The most popular method is to label the 5’ or 3’ end with
32
P-phosphate, since it offers very
high sensitivity (the subpicomole range) and does not change the structure of the nucleic acid.
To label DNA with radioisotope incorporation of a [γ-³²P]dNTP during a 3'-end filling reaction by
Klenow fragment of DNA polymerase I or 5'-end labeling using the [γ-³²P]ATP and T4 polynucleotide
kinase can be performed.
An alternative to radioisotopes are fluorescent dyes and tags. The examples of dyes enabling
detection of dsDNA without any changes in the migration pattern are the phenanthridinium dimer,
ethidium homodimer (EthD) or the asymmetric cyanine compounds like the thiazole orange
homodimer (TOTO) and the oxazole yellow homodimer (YOYO). Also, dyes like Sybr Gold, Sybr Green
I and II could be advantageous in the GMSA, but during their use the DNA should be stained post
Protein
Probe
(load DNA)
Protein
Probe
(load DNA)

Molecular biology of nucleic acid - experimental methodology
19
by Katarzyna Węgrzyn & Igor Konieczny
electrophoresis due to the possible alterations in the nucleic acid migration in a gel. When using
fluorophores, it is possible to achieve the sensitivity that is comparable to the one obtained with
isotopes but some problems could occur especially when competing nucleic acid is added to the
samples or if a ssDNA is the target. In such cases the fluorescent tag coupled to dNTP (usually dCTP,
dUTP) could be a solution. Labeling of the target nucleic acid could be performed during a PCR
reaction, by 3’-end filling with the Klenow fragment or by adding labeled nucleotides to the 3’-end by
the terminal deoxynucleotidyl transferase (TdT).
Another alternative to radioisotopes is chemiluminescent detection of the target nucleic acid, where
biotin or digoxigenin (DIG) can be used as the labels. Visualization of the target requires transfer of
the labeled molecules to a solid membrane support (nylon, nitrocellulose) and subsequently,
a secondary detection method with the use of sterptavidin or anti-DIG antibodies. Since one biotin
can be bound by one streptavidin molecule with multiple covalently attached alkaline phosphatase
molecules, that can carry out many reactions with a lumigenic substrate, the detected signal could be
increased. The detection limit achieved for the biotin-streptavidin-alkaline phosphatase system could
be 5-50 pg of nucleic acid per band.
Binding conditions
The binding conditions such as salt concentration, pH or temperature should be adjusted in
case of a particular complex formation. Addition of substances stabilizing the nucleoprotein
complexes (glycerol, sucrose, proteases or nucleases inhibitors) or reducing the nonspecific
interactions (competitors, non-ionic detergents) could be considered. To favor the specific
interactions between the protein and a nucleic acid the unlabeled competitors such as genomic DNA,
poly-d(I-C) or poly-d(A-T) are used. If the binding is specific, the addition of such competitors results
in the occurrence of distinct bands. If the competitor present in a sample reduces the target binding
it indicates non-specific interactions.
The typical volume of the reaction is 20-30 µl and an entire sample is usually loaded onto the
gel, however, the smaller volume of the loaded sample the narrower starting zone at the beginning
of separation and sharper bands at the end of electrophoresis.
Electrophoresis conditions
The conditions during electrophoresis have a big impact on the nucleoprotein complex
stability, therefore they should be carefully chosen. The most commonly used buffers are Tris-
Borate-EDTA (TBE) and Tris-Acetate-EDTA (TAE) or their modifications if necessary (buffers without
EDTA for metal-binding proteins or without acid for increasing the complex stability). To stabilize the
complex during the electrophoresis, glycerol or ethylene glycol could also be added to the running
buffers. If the nucleoprotein interaction is extremely weak, the binding buffer could be utilized
during the electrophoresis.
The sample separation could be performed in an agarose (0.7-1.5% w/v) or polyacrylamide
(3.5-6 % w/v) gel, however, a better resolution of the bands is obtained in case of the latter. Prior to
the preparation of the gels it is very important to degas all necessary solutions (TBE buffer,
acrylamide solution, H
2
O), what results in more efficient polymerization and in more homogenous
gels. When casting the gel, bubble formation should be also prevented, since bubbles do not conduct
electrical current what can affect the migration of the sample.
Before the separation of the sample in a gel, pre-electrophoresis, lasting 0,5-1h, should be
performed. It is a critical step as the gel is equilibrated with the running buffer and a use of a dye can

20
Molecular biology of nucleic acid - experimental methodology
by Katarzyna Węgrzyn & Igor Konieczny
reveal any gel defects (gel homogeneity, shape of the lanes). The pre-electrophoresis, as well as the
actual separation, are conducted at 10 V/cm of gel length.
A
BRIDGED PROCEDURE
1. Nucleic acid preparation and labeling.
2. Preparation of the reaction mixtures containing nucleic acid titrated with a protein.
3. Incubation of the mixtures in an appropriate temperature.
4. Addition of a loading solution (glycerol/sucrose/ficoll).
5. Loading the samples into the gel’s wells.
6. Electrophoresis in an appropriate buffer.
7. Detection of the electrophoretic bands (autoradiography, fluorescence imaging chemiluminescent imaging).
T
ROUBLESHOOTING
1. If no bands are visible after the electrophoresis :
− the amount of the nucleic acid used should be verified and adjusted to the detection level;
− the labeling reaction should be controlled and repeated if necessary;
− nuclease inhibitors could be added to prevent nucleic acid degradation.
2. If no retardation is observed:
− the quantity and the activity of the protein should be verified;
− the migration of the protein alone should be verified; if it is the same as the migration of the target
nucleic acid the pH of the buffers should be reduced;
− the composition of the buffers should be verified (some proteins require very low salt concentration or
addition of metal ions).
3. If all bands are smeared:
− fresh, degased reagents for gel preparation should be used;
− the voltage could be reduced;
− concentration of the gel and the running buffers should be checked.
4. If the free nucleic acid migrates normally and the retarded bands are smeared:
− conditions stabilizing the nucleoprotein complex should be used (minimal gel running time; increased gel
concentration; reduction of salt concentration in the buffers; lowering the electrophoresis temperature;
addition of stabilizing reagents to the buffers).
L
ITERATURE
Dahlberg A.E, Dingman C.W, Peacock A.C, 1969, Electrophoretic characterization of bacterial polyribosomes in
agarose-acrylamide composite gels, J Mol.Biol. 41:139-147
Fried M.G. and Crothers D.M, 1981, Equilibria and Kinetics of Lac Repressor-Operator Interactions by
Polyacrylamide Gel Electrophoresis. Nucl. Acids Res. 9:6505-6525
Hellman L.M. and Fried M.G, 2007, Electrophoretic Mobility Shift Assay (EMSA) for Detecting Protein-Nucleic
Acid Interactions, Nat. Protoc. 2(8):1849-1861
Lane D, Prentki P, Chandler M, 1992, Use of gel retardation to analyze protein-nucleic acid interactions,
Microbiol. Rev. 56(4):509-528
Rye H.S, Drees B.L, Nelson H.C, Glazer A.N, 1993, Stable fluorescent dye-DNA complexes in high sensitivity
detection of protein-DNA interactions, J Biol Chem 268(33):25229-25238
Travers A. and Buckle M, 2000, DNA-Protein Interactions, Oxford University Press
Molecular biology of nucleic acid - experimental methodology
21
by Katarzyna Węgrzyn & Igor Konieczny
Q
UESTIONS
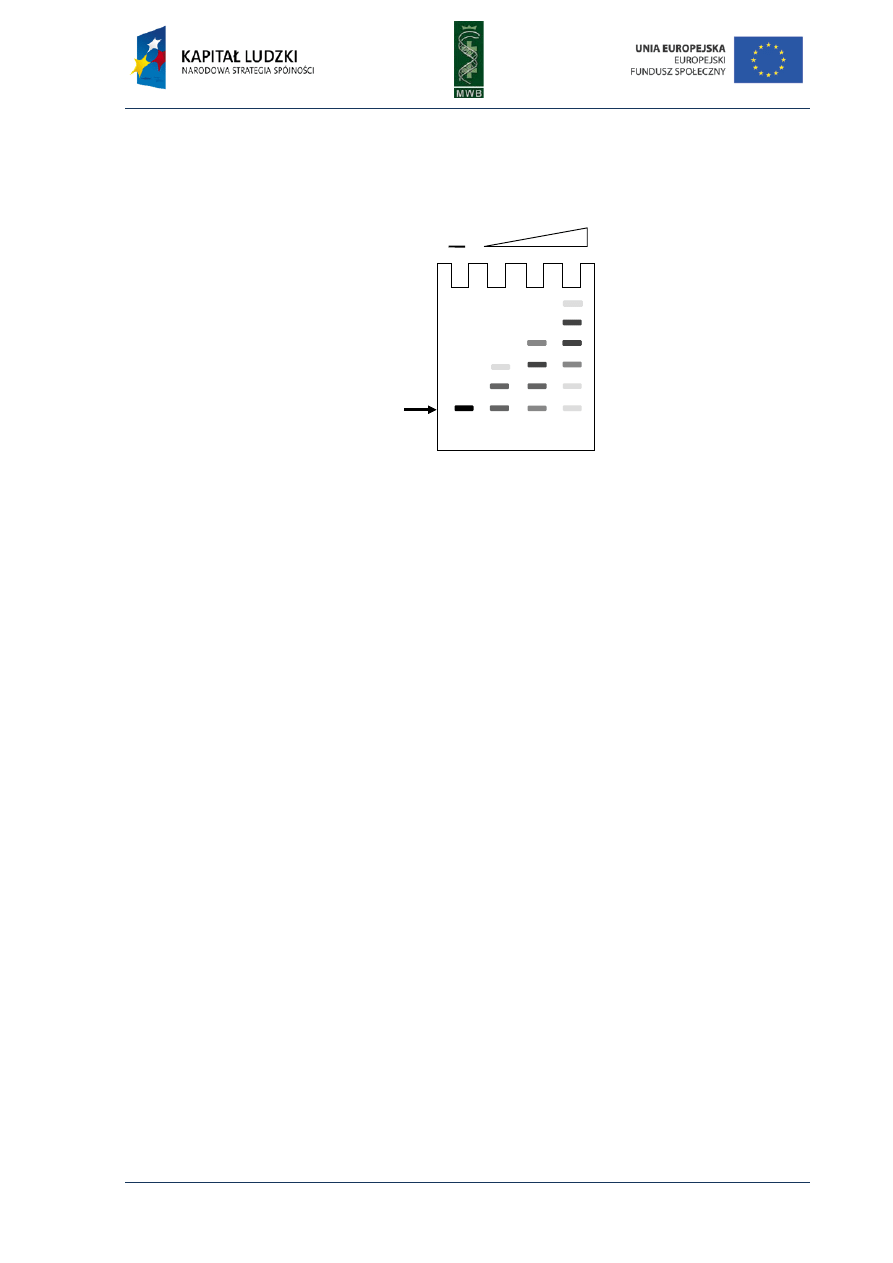
1. The figure shows the gel after the GMSA experiment. What can you say about the binding of the protein X
to the DNA fragment?
2. How can the results of GMSA experiment be visualized?
3. What is the purpose of poly-d(I-C) or poly-d(A-T) addition to the reaction mixture?
Probe
(load DNA)
Protein
Probe
(load DNA)
Protein
22
Molecular biology of nucleic acid - experimental methodology
by Katarzyna Węgrzyn & Igor Konieczny
CHAPTER 4. Footprinting
Among the many different methods enabling the investigation of nucleic acid – protein
interactions, the footprinting technique provides knowledge not only about the existence of such
complex formations but also enables to recognize the sequence bound by the protein. This method
was developed in the late 70s by Galaz and Schmitz, who, as an example, investigated interactions of
the repressor LacI with a sequence of the operator lacO. They combined two techniques: the
Maxam-Gilbert DNA-sequencing method and the method of isolation DNAase-protected fragment
and developed the protecting assay, in which digestion of labeled nucleic acid is locally inhibited by
the bound protein. The cleavage of nucleic acid usually is random and optimized to cleave every
molecule just once and in different positions, what results in a wide range of fragments different in
length. The nucleic acid is not cleaved in the region bound by the protein, therefore the same group
of digestion products cannot originate and on a denaturing polyacrylamide gel that is seen as a gap
named footprint (Fig.8).
Fig. 8. The scheme of footprinting assay. (A) An analysis of the protein binding site. The protein is incubated
with labeled DNA, then the DNA is digested and the obtained fragments are dissolved in a poliacrylamide gel.
The lack of the visualized bands correspond to the site occupied by the protein. (B) A control reaction without
the protein.
digestion
denaturation
digestion
denaturation
A
B
digestion
denaturation
digestion
denaturation
A
B

Molecular biology of nucleic acid - experimental methodology
23
by Katarzyna Węgrzyn & Igor Konieczny
Before every footprinting experiment the choice of the nucleic acid substrate, labeling method and
cleavage agent should be made.
Nucleic acid
The length of the nucleic acid fragment used in this experiment is limited by resolution of
polyacrylamide gels and usually is about 50-200 base pairs long. The fragment can be generated by
restriction digestion of a plasmid containing the sequence of interest or in a PCR reaction. The choice
of the nucleic acid is more complicated when the region bound by the protein is unknown and then
the application of artificial fragments could be useful.
Labeling method
Since in the footprinting assay very small amounts of nucleic acid is used (a few femtomoles of
nucleic acid), labeling with
32
P or
33
P is commonly applied. Fluorescent labeling (with fluorescein,
Alexa dyes, Texas Red, Cy-5) is also more and more popular since it is safer and the labeled fragment
does not decay. Unfortunately sometimes the sensitivity of the fluorescent technique is not enough
to observe bands containing less than 1% of total nucleic acid.
When the target is a restriction fragment, labeling with radioisotopes can be performed by 3’end
filling of the sticky-end with α-
32
P-dNTP by Klenow fragment. If the target is amplified during PCR
reaction, the radiolabeled at 5’end oligonucleotides can be used.
Cleavage agents
There are different agents used to cleave nucleic acid during the footprinting assay. The most
popular are DNaseI and hydroxyl radicals.
DNase I is an agent of choice if the nucleic acid is double-stranded DNA. It binds the DNA minor
groove and cuts the phosphodiester backbone of the molecule in a divalent cation- dependent
manner. Both magnesium and calcium ions can be used, however the first ones are more efficient.
Requirement of divalent ions entails the simplicity in stopping the reaction by addition of EDTA.
DNaseI is also readily used in the footprinting assay since it is cheap and active in a wide range of
conditions. It can stand pH from 5 to 9, temperature up to 70°C and salt concentration even up to 1M
NaCl. The additional advantage of DNaseI is that it is sequence unspecific. Unfortunately depending
on the local DNA structure, it can generate an uneven range of digestion products. For instance
the activity of the enzyme can be inhibited within AT-rich tracts because of narrower minor groove
hindering the protein binding. Also the GT-rich regions are not preferred by DNaseI because of lower
flexibility. Easiness of DNA bending by the enzyme seems to be a required element of the DNaseI
action mechanism. The disadvantage of this enzyme is also its size, because as a large glycoprotein
that binds 10 base pairs, it overestimates the protein binding sequence by about 3 base pairs.
The second commonly used cleavage agent are hydroxyl radicals. They are generated in
a Fenton reaction, during which the Fe
2+
is oxidized to Fe
3+
by hydrogen peroxide. The products of
this reaction are also hydroxyl radical and hydroxyl anion. Since the Fe
2+
can interact with negatively
charged DNA, in practice ferric ion used in the reaction is chelated by EDTA ([Fe(EDTA)
2-
]). In the
reaction sodium ascorbate is added, since it reduces the [Fe(EDTA)
1-
] product back to [Fe(EDTA)
2-
],
what provides the starting amount of the Fenton reaction substrate. Generated hydroxyl radicals are
highly reactive and attack the C4’ or C1’ positions of deoxyribose via the minor groove of the DNA.
Because of their small size, they are able to cleave very close to the bound protein. The cleavage is
sequence unspecific, however it can be reduced within the AT tracts. The cleavage reaction is slower

24
Molecular biology of nucleic acid - experimental methodology
by Katarzyna Węgrzyn & Igor Konieczny
than with DNaseI, sensitive to solvents scavenging free radicals (DMSO, ethanol, glycerol) and
requires precipitation of reaction products before polyacrylamide gel electrophoresis. The reaction is
quenched by addition of a thiourea stop solution, which reacts with any remaining hydroxyl radical.
Electrophoresis conditions
The samples are resolved in a denaturing polyacrylamide gel, where the denaturing agent is
7M urea and the running buffer is usually TBE. The polyacrylamide concentration within the gel
varies from 5 to 20% depending on the DNA fragment size (8% gel is a standard for 150bp fragment)
and the prepared gel is very thin (0.33mm) and long (40cm). The samples should be heated and
quickly cooled on ice before loading onto a gel to enable denaturation of the cleavage products.
A
BRIDGED PROCEDURE
1. DNA fragment preparation (PCR reaction with labeled primers; restriction digestion)
2. Labeling of DNA fragment (unless the fragment was labeled during PCR reaction)
3. Binding reaction (the condition of the reaction should be adjusted)
4. Cleavage of DNA (the type, amount of cleavage agent and the reaction condition should be adjusted)
5. Precipitation of cleavage products (it is very important when the hydroxyl radicals are the cleavage agents;
when DNaseI is used there is usually no need to remove the enzyme)
6. Denaturing polyacrylamide gel electrophoresis
7. Detection of electrophoretic bands (autoradiography, fluorescence imaging)
Modifications of the method
Solid-phase footpriniting
In this method the labeled DNA fragment is immobilized via biotin–streptavidin interaction on
paramagnetic beads. Then the protein of interest is added and the nucleoprotein complex is formed.
The next step is cleavage of DNA by a cleavage agent (usually DNaseI) and purification of nicked DNA.
Since the nucleic acid is immobilized on solid phase, the purification of DNA is facilitated what results
in a faster protocol. After the digestion, the resin is washed and samples are denatured. The beads
can be easily removed by simple centrifugation and the DNA of interest remains in the supernatant.
The separation of cleavage products is performed as in the classic footprinting method.
Nucleic acid cleavage and primer extension
Although DNaseI and hydroxyl radicals have a lot of advantages, sometimes other cleavage
agents are used as nucleases mung bean, P1 and S1. They are agents of choice when the nucleic acid
is single stranded DNA or RNA. The nucleoprotein complex formation followed by nucleic acid
degradation by these agents is the same as in the classic footprinting assay. The difference is that the
target nucleic acid is not labeled and the cleavage is followed by primer extension assay, in which
a labeled primer is used (Fig. 9). The cleavage agent is used in a concentration, which enables to cut
every molecule of the nucleic acid just once. The bound protein protects the potential cleavage sites
what is observed as the absence of a nucleic acid fragment of a particular length. Because
the products of the cleavage reaction are single stranded nucleic acid fragments, to facilitate
the visualization of the reaction products a one labeled primer is used. In the PCR reaction
the complementary strands are synthesized and a ladder of double stranded fragments is produced.
Molecular biology of nucleic acid - experimental methodology
25
by Katarzyna Węgrzyn & Igor Konieczny
As a control, the reaction without protein is prepared. The comparison of primer extension products
of these two reactions allows to indicate the nucleic acid region bound by the protein.
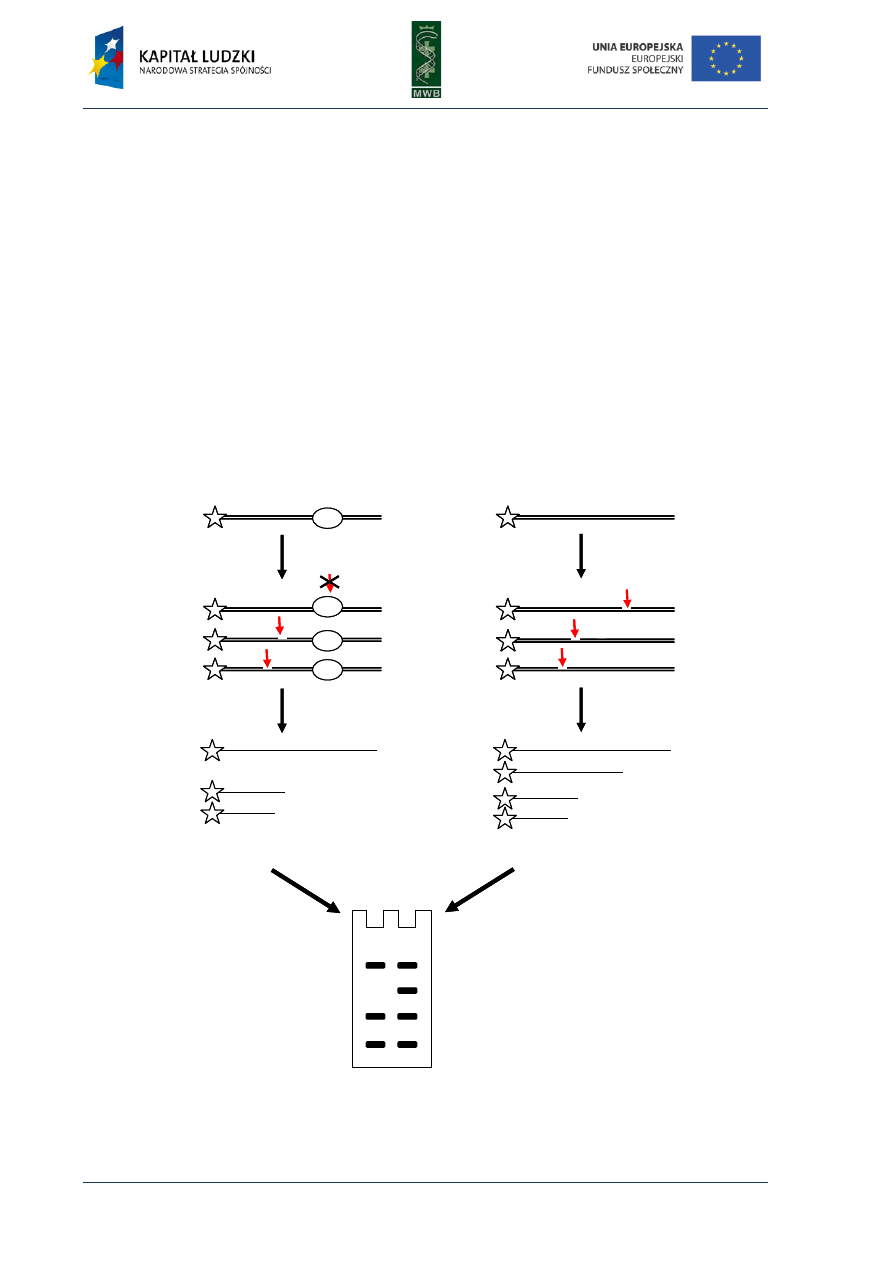
Fig. 9. The scheme of the footprinting assay
with the primer extension reaction. (A) An
analysis of protein binding site. The protein
is incubated with non-labeled DNA, then the
DNA is digested and the obtained fragments
are used as a template for the PCR reaction
with a labeled primer. Then the reaction
products are dissolved in a poliacrylamide
gel and the lack of the visualized bands
correspond to the site occupied by the
protein. (B) A control reaction without the
protein.
In vivo footprinting
The classical footprinting assay required the interaction of purified protein with prepared
nucleic acid fragment. Unfortunately sometimes the reconstruction of native conditions is very
difficult and the lack of complex formation does not exclude the formation of such a complex in vivo.
The results obtained from live cells can give more reliable information. However, in case of in vivo
studies, the exposition of cells to the action of the cleavage agents for several minutes can result
with artificial results. It is mainly because the used chemicals can interact with many cell
components. These kinds of limitations can be avoided when UV-light is a footprinting agent.
The irradiation of DNA results with a wide range of photoproducts depending on local DNA
environment and the assumption is that one molecule is photomodified just once. The most frequent
photoproducts formed in DNA are pyrimidine dimers, purine dimers are less frequent. The reactivity
pattern is different for necked nucleic acid and molecule bound by the protein. After the irradiation
the nucleic acid is isolated from the cells and primer extension reaction with labeled primer is
performed. The polymerase stops when it meets the photo-changed nucleotide and the ladder of
amplification products is generated. They are separated on a denaturing polyacrylamide gel and
detected depending on the labeling method.
Potassium permanganate probing assay
The potassium permanganate (KMnO
4
) probing assay is not a typical technique for detection of
protein interactions with DNA. It is usually used to observe local melting of dsDNA and formation of
a ssDNA region. However because of the similarities to the footprinting method it is often called
“KMnO
4
footprinting”. Compared with nucleases, KMnO
4
is an oxidizing agent that modifies thymine
residues in single stranded DNA. The agent concentration is adjusted to obtain just one modification
per molecule. This reagent does not modify the residues in double stranded nucleic acid. The probing
with KMnO
4
is followed by primer extension with a labeled primer (see above). During this reaction,
the polymerase stalls at the modified thymines on the template, what results with a range of
denaturation
primer
extension
primer
extension
A
B
denaturation
primer
extension
primer
extension
primer
extension
A
B

26
Molecular biology of nucleic acid - experimental methodology
by Katarzyna Węgrzyn & Igor Konieczny
products of different length. The assay with KMnO
4
probing is typically use to identify a region within
the nucleic acid where the local melting of double stranded molecule and formation of a single
stranded region occurs (“opening”).
T
ROUBLESHOOTING
1. If no or low cleavage of nucleic acid is observed:
− check the cleavage agent (the DNaseI concentration and activity; if hydroxyl radicals are used prepare
new reagents)
− check the condition of the reaction, if there are no inhibitors of the cleavage agent
2. If the cleavage is observed within the expected footprint region:
− lower the concentration of cleavage agent
− reduce the time of cleavage reaction
− check the conditions of the binding reaction
− check the concentration and activity of the protein
3. If all bands are smeared:
− fresh, degassed reagents for gel preparation should be used
− the concentration of gel and running buffers should be checked
L
ITERATURE
:
Hampshire A. J, Reusling D. A, Broughton-Head V. J, Fox K. R, 2007, Footprinting-A method for determining the
sequence selectivity, affinity and kinetics of DNA-binding ligands, Methods 42: 128-140.
Pfeifer G.P. and Tornaletti S, 1997, Footprinting with UV Irradiation and LMPCR, Methods 11: 189-196.
Sandaltzopoulos R. and Becker P. B, 1995, Solid-phase DNaseI footprinting, Biochemica 4: 25-27.
Travers A. and Buckle M, 2000, DNA-Protein Interactions, Oxford University Press.
Q
UESTIONS
:
1. What cleavage agents can be used in a footprinting experiment?
2. Can the footprinting assay be an in vivo experiment?
3. What type of footprinting method would you use for detection of:
a. protein-DNA interaction sites
b. dsDNA melting regions
c. nucleoprotein interactions within Adenine and Thymine rich regions?

Molecular biology of nucleic acid - experimental methodology
27
by Katarzyna Węgrzyn & Igor Konieczny
CHAPTER 5. Surface Plasmon Resonance (SPR)
One of the most sophisticated techniques enabling investigation of the interactions between
molecules in real time is the surface plasmon resonance (SPR). It is a specific chromatography
technique since two phases are present in the experiment: the mobile phase (analyte) passes over
the immobile phase (ligand attached to the surface of the sensorchip). In SPR technique a very
sensitive detection system is used, what makes performing experiments with a trace amount of
substance and observing even cryptic interactions possible. Moreover, the use of the available
software gives the possibility to calculate the values of constants from the obtained results. The first
use of the SPR concerned the immuno-complex formation. However, the development of this
method nowadays enables analyzing interactions between different molecules, like nucleic acids,
proteins, lipids or even the entire cells and viruses. The SPR is a powerful technique applied not only
in life sciences but also in drug discovery or food analysis.
Fig. 10. The schematic SPR de-
tection system. The basic
elements such as prism, sensor
chip and a flow cell are marked
at the scheme. The black arrow
shows the direction of the flow
through the flow cell.
The physical basis of SPR is an optical method that enables the measurement of the angle of
light reflected from the surface of a sensor chip coated with a thin golden film (Fig. 10).
The reflection of the incident polarized light is not total because some of the energy is lost in the
film. When the angle of the incident light is proper, it can cause a resonance of mobile electrons
(plasmons) present at the surface of the gold layer. The resonance frequency and indirectly the angle
of the reflected light depend on the refractive index, i.e. the medium surrounding the sensor chip
surface. Contact with a buffer or binding a ligand to the surface of a sensor chip changes
the refractive index and therefore the reflection angle. This angle is called surface plasmon
resonance angle and the greater the mass immobilized on the surface of the sensor chip the greater
changes in the SPR angle detected. The changes in the spr angle are reported as response units (RU)
and every 1000 RU corresponds to about 0.1° change in the reflection angle, which is caused by
binding approximately 1 ng of the protein on every mm
2
of the sensor chip.
Nomenclature
Ligand – a molecule attached to the surface of the sensor chip
Analyte – a molecule that is passed in the solution over the immobilized ligand
Sensogram – a plot of the response against time, showing the progress of the interaction
prism
incident
light
reflected
light
flow cell
sensor chip
(glas sidle,
gold layer)
ligand
analyte
SPR angle
prism
incident
light
reflected
light
flow cell
sensor chip
(glas sidle,
gold layer)
ligand
analyte
SPR angle

28
Molecular biology of nucleic acid - experimental methodology
by Katarzyna Węgrzyn & Igor Konieczny
Sensor chips
The sensor chip is a glass surface, that is coated with a very thin layer of gold. Usually
the metal layer is modified and a dextran hydrogel layer is added to form a hydrophilic environment
on the surface of the sensor chip. This modification, and also some others, facilitate
the immobilization of the molecules. One sensor chip contains 4 flow cells (channels), what gives
a possibility to perform 3 experiments simultaneously. The fourth channel remains empty
and functions as a reference one.
Depending on the sensor chip surface character, we can distinguish:
− CM1 - contains a carboxymethylated surface without dextran; has low binding capacity; is suitable
for binding large molecules, viruses, entire cells; couples molecules to carboxyl groups on the
sensor surface via -NH
2
, -SH, -CHO, -OH or –COOH groups
− CM3 - contains a surface with carboxymethylated short dextran chains; it is suitable for binding
large molecules, viruses, entire cells; couples molecules to carboxyl groups on the sensor surface
via -NH
2
, -SH, -CHO, -OH or –COOH groups
− CM4 - contains a surface with dextran chains as long as in the CM5 sensor chip (longer than in
CM3) but with lower carboxymethylation; due to a reduced negative charge of the surface it is
suitable for immobilization of negatively charged molecules
− CM5 - one of the most commonly used sensor chips; contains a surface with carboxymethyleded
dextran chains longer than in the CM3 chip; suitable for binding small to large molecules or whole
viruses; couples molecules to the carboxyl groups on the sensor surface via -NH
2
, -SH, -CHO, -OH
or –COOH groups
− CM7 - similar to the CM5 sensor chip but contains a surface with higher carboxymethylation of
the dextran chains and higher density of the matrix, what provides three times higher
immobilization capacity; suitable for binding small molecules; couples molecules to the carboxyl
groups on the sensor surface via -NH
2
, -SH, -CHO, -OH or –COOH groups
− NTA - contains a surface with carboxymethylated dextran chains, pre-immobilized with
nitrilotriacetic acid (NTA); suitable for binding His-tagged proteins
− SA - contains a surface with carboxymethylated dextran chains, pre-immobilized with
streptavidin; suitable for binding molecules tagged with biotin
− L1 - contains a surface with carboxymethylated dextran with covalently attached lipophilic groups;
suitable for binding lipid membrane vesicles; provides the maintenance of the lipid bilayer
structure
− HPA - contains a hydrophobic surface with a long-chain of alkanethiol molecules, attached directly
to the golden film; suitable for binding lipid monolayers
Immobilization methods
Every SPR analysis begins with immobilization of a ligand on the surface of the sensor chip.
There are three main methods enabling to attach molecules: covalent immobilization, immobilization
via coupled molecule or hydrophobic adsorption. The chosen method depends on the character of
the immobilized molecule and on the type of the sensor chip, which is going to be used.
Covalent immobilization is the most popular method used to attach molecules on the surface
of the sensor chip. The CM sensor chips are suitable for this method and the CM5 is usually the chip

Molecular biology of nucleic acid - experimental methodology
29
by Katarzyna Węgrzyn & Igor Konieczny
of first choice. It requires modification of the ligand and provides its stable attachment in
the conditions used in the course of an experiment. The conditions of the immobilization reaction
should take into consideration: the temperature (usually 25°C), pH (3,5<pH<pI of the protein) and the
buffer composition (e.g. for amine coupling Tris should be omitted). Before the attachment of the
molecules the surface of the sensor chip requires activation. Addition of 1-ethyl-3-(3-
dimethylaminopropyl)-carbodiimide (EDC) and N-hydroxysuccinimide (NHS) to the carboxy-
methylated matrix of the chip results in the formation of succinimide esters, that spontaneously
react with a ligand. Attaching the ligand can utilize three coupling chemistries: via amine (amine
coupling), thiol (thiol coupling) or aldehyde (aldehyde coupling) groups. After the immobilization of
the ligand, the excess of the reactive group should be inactivated by addition of an appropriate
chemical, for instance ethanolamine in case of the amine coupling. It should be remembered that in
this method it is difficult to determine the orientation of the bound ligand. The most heterogeneous
orientation is given by the amine coupling since most proteins contain several available amine
groups.
The defined attachment orientation can be provided by the capturing approach. It utilizes
the immobilization of the ligand via a capturing molecule, covalently attached to the surface of
the sensor chip. Streptavidin (sensor chip SA) or NTA (sensor chip NTA) can be such molecules and
they require that the ligand contains biotin or His-tag, respectively. The surface of the sensor chip
can also be prepared individually and other tags or antibodies can be used as the capturing
molecules. Unfortunately, the maximum analyte binding capacity is usually lower when compared to
a directly immobilized ligand.
The third method of the immobilization of the molecules is a hydrophobic attachment based
on lipid monolayers (sensor chip HPA) and bilayers (sensor chip L1). The lipid monolayer is created by
adsorption of lipids from micelles or liposomes on the surface of the sensor chip. They are bound in
a way that the hydrophobic lipid tails are oriented towards the golden film and the hydrophilic heads
towards the aqueous sample. In case of creating a sensor chip with a lipid bilayer, the chip with
a matrix containing a dextran with hydrophobic structures can be used. These structures can be
inserted into the liposomes and attach the membranes to the dextran matrix.
When the method of immobilization is chosen, a proper amount of ligand that is going to be
attached should be estimated. The amount of the bound ligand is expressed as ligand binding
capacity presented in response units RU. It depends on the molecular weight of both the ligand and
the analyte and can be calculated from the formula:
The SPR experiment
When a ligand is immobilized on the surface of the sensor chip, the actual experiment can be
performed. Three phases can be distinguished during a SPR experiment: association, dissociation and
regeneration (Fig. 11). In the first step an analyte dissolved in a suitable buffer (called running buffer)
passes over the immobilized ligand and interacts with it. If the two form a complex the mass
attached to the gold layer rises, what changes the spr angle and causes an increase of the detected
signal. The second phase is dissociation, when the analyte is omitted from the running buffer and the
formed complex dissociates. During this phase a detected response decreases. In the last stage of
ligand binding
capacity (RU)
analyte binding
capacity (RU)
=
ligand molecular
weight
analyte molecular
weight
×
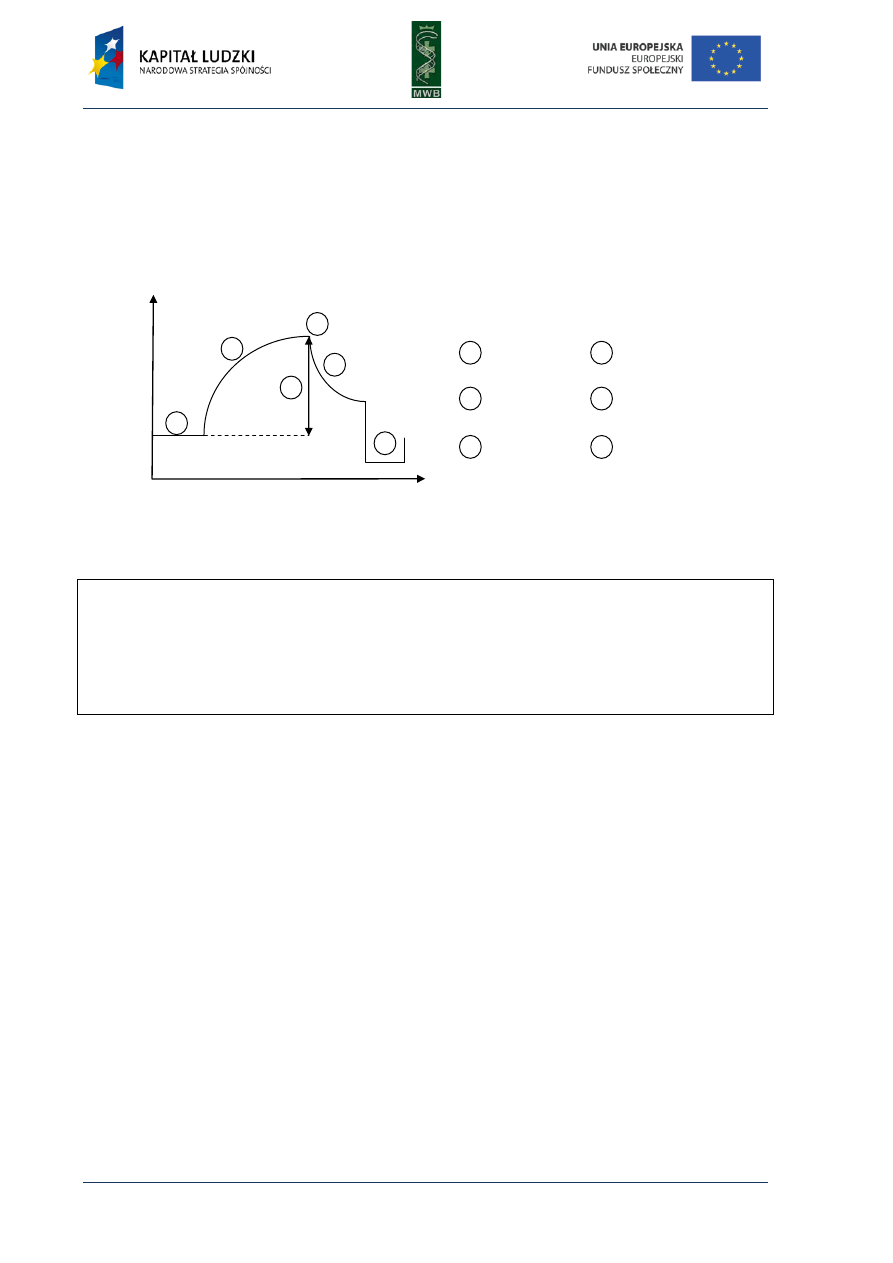
30
Molecular biology of nucleic acid - experimental methodology
by Katarzyna Węgrzyn & Igor Konieczny
the experiment, the surface of the sensor chip is regenerated by removing the remnants of
the analyte. What is important, the ligand is not damaged during this phase and after
the regeneration the next experiment can be performed. However, it should be remembered that
the surface of the sensor chip with the immobilized ligand is not indestructible and approximately
after 40 analyte injections a noticeable decrease in the analyte binding capacity is detected. In this
situation the sensor chip should be changed.
Fig. 11. Schematic illustration of a sensogram. The three main phases of the spr experiment (1-3) and response
points (a, b) important to calculate analyte binding response (relative response; c) are marked on the diagram.
A
BRIDGED PROCEDURE
1. Activation of the surface of the sensor chip and preparation of the ligand
2. Immobilization of the ligand
3. Injection of the analyte
4. Analysis of the interaction
5. Regeneration of the surface of the sensor chip
T
ROUBLESHOOTING
1. If no association of an analyte, expected to bind the ligand, is detected:
− verify the binding conditions; when required, change the buffer
− verify the analyte activity
− verify the analyte concentration
2. If the signal detected on the reference channel increases
− use more stringent experimental conditions
− change the sensor chip
3. If the analyte binding capacity decreases
− verify the analyte activity
− change the sensor chip
1
2
3
association
dissociation
regeneration
a
b
c
baseline
response (RU)
relative
response (RU)
1
2
3
a
b
c
Time (s)
Re
sp
o
n
se
(
RU
)
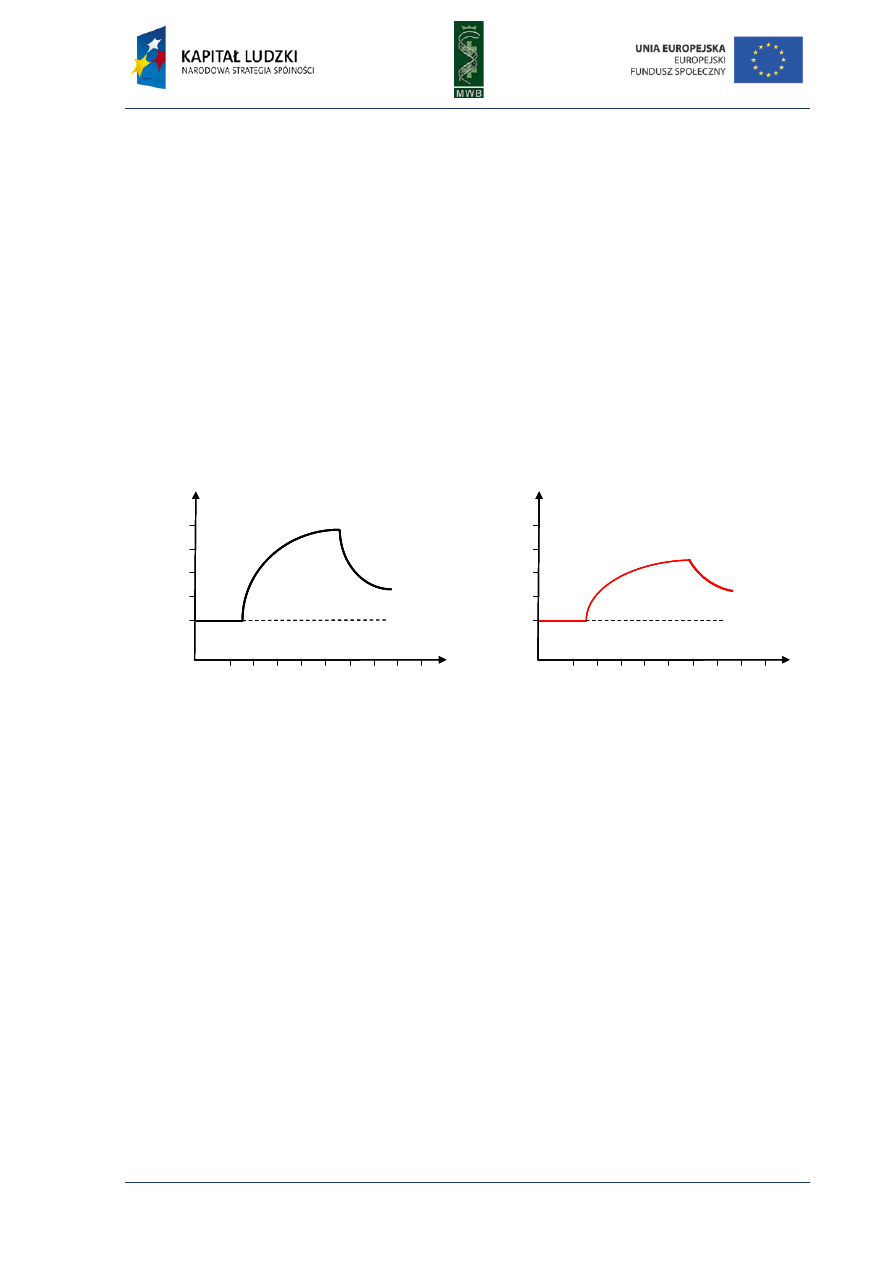
Molecular biology of nucleic acid - experimental methodology
31
by Katarzyna Węgrzyn & Igor Konieczny
L
ITERATURE
Biacore Sensor Surface Handbook BR-1005-71 Edition AB.
Cullen DC, Brown RG, Lowe CR, 1987-1988, Detection of immuno-complex formation via surface plasmon
resonance on gold-coated diffraction gratings. Biosensors 3(4): 211-25.
Schasfoort R.B.M. and Tudos A.J, 2008, Handbook of Surface Plasmon Resonance, The Royal Society of
Chemistry Publishing.
Q
UESTIONS
1. What kind of sensorchip would you use during analysis of protein interactions with
a. DNA
b. proteins
2. Describe the bases of ligand attachment by the capturing approach.
3. The figure below presents sensograms of proteins A (A) and B (B) binding to the DNA fragment, immobilized
on the surface of a SA sensorchip. The molecular mass of protein A is 50kDa and protein B 100kDa. What
can you say about the interaction of the proteins A and B with the analyzed DNA fragment?
Time (s)
Re
sp
o
n
se
(RU
)
A
0
500
250
375
125
50
150
250
350
450
Time (s)
Re
sp
o
n
se
(RU
)
B
0
500
250
375
125
50
150
250
350
450
Time (s)
Re
sp
o
n
se
(RU
)
A
0
500
250
375
125
50
150
250
350
450
Time (s)
Re
sp
o
n
se
(RU
)
A
0
500
250
375
125
50
150
250
350
450
Time (s)
Re
sp
o
n
se
(RU
)
B
0
500
250
375
125
50
150
250
350
450
Time (s)
Re
sp
o
n
se
(RU
)
B
0
500
250
375
125
50
150
250
350
450
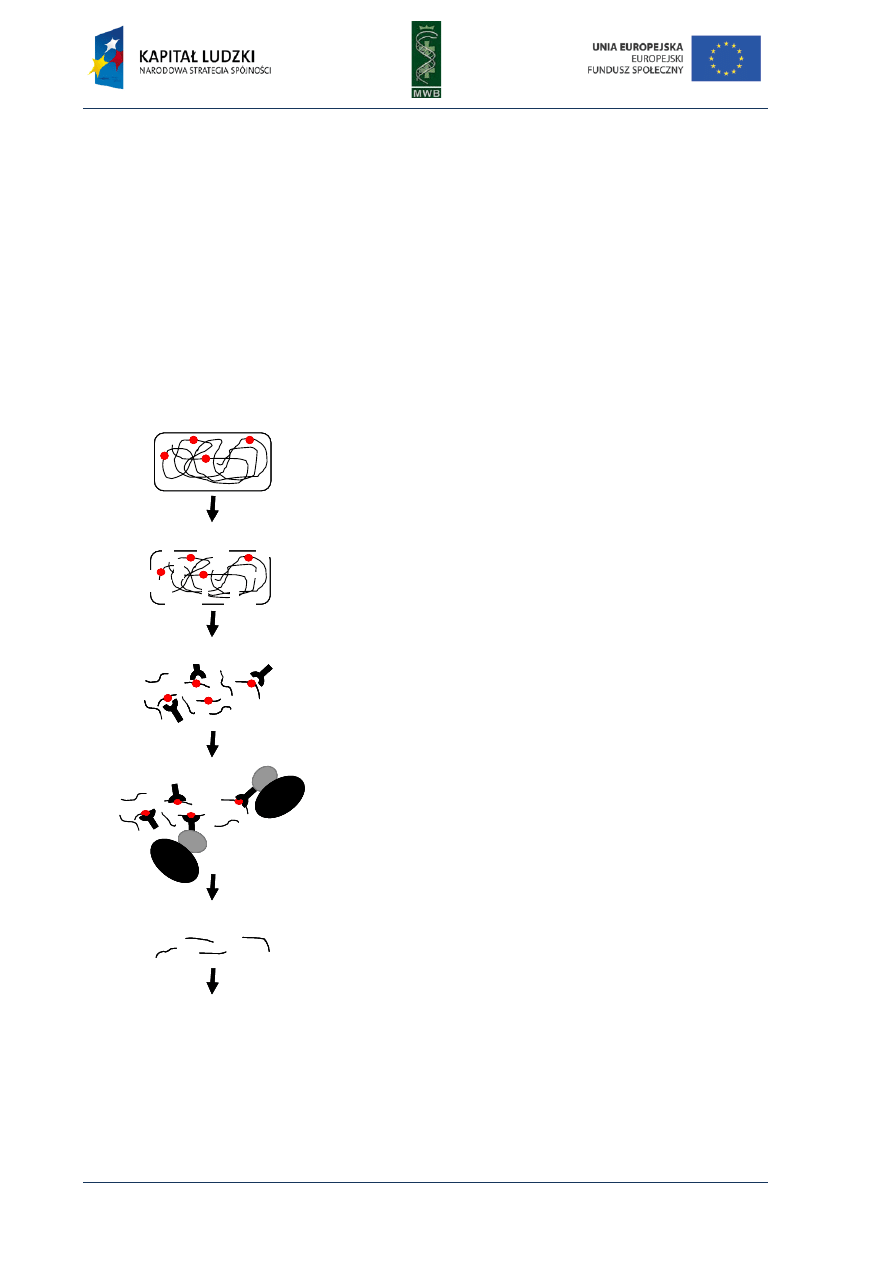
32
Molecular biology of nucleic acid - experimental methodology
by Katarzyna Węgrzyn & Igor Konieczny
CHAPTER 6. Chromatin immunoprecipitation assay (ChIP)
Among the many techniques that enable investigation of interactions between proteins and
nucleic acids, the chromatin immunprecipitation assay (ChIP) is utilized for detection of
a nucleoprotein complex formation in vivo. The method is based on fixation (crosslinking) of
nucleoprotein complexes within cells at any point of the cell cycle, fragmentation of nucleic acid and
isolation of a protein-nucleic acid complex via specific antibodies that recognize the protein of
interest (Fig. 12). In the original method the DNA isolated from the complex is used as a template in
a PCR reaction (see Chapter 1). There are also experiments called “RIP” where it is the RNA that is
co-precipitated with a protein and then it is submitted to a reverse transcription reaction.
Fig. 12. A scheme of the Chromatin Immunoprecipitation
assay (ChIP). The protein of interest is marked as a red
circle, the protein A from Staphyclococcus aureus is
marked as a gray circle and the black ellipse represents
sepharose beads. The scheme presents the basic steps of
the ChIP assay: Crosslinking of nucleoprotein complexes;
Cell lysis and nucleic acid fragmentation; Incubation with
antibodies; Precipitation; Nucleic acid purification.
The ChIP technique was used mainly to determine the binding sites of transcription factors and
histone proteins. Now it is applied to recognize binding sites for many other proteins and is
combined with other techniques, such as real-time PCR, microarrays (ChIP-on-chip), cloning or
sequencing (ChIP-seq).
Precipitation
Crosslinking of nucleoprotein complexes
Cell lysis and nucleic acid fragmentation
Incubation with antibodies
Decrossling and nucleic acid purification
sepharose
A
Detection e.g. PCR
A
Precipitation
Crosslinking of nucleoprotein complexes
Cell lysis and nucleic acid fragmentation
Incubation with antibodies
Decrossling and nucleic acid purification
sepharose
A
Detection e.g. PCR
A

Molecular biology of nucleic acid - experimental methodology
33
by Katarzyna Węgrzyn & Igor Konieczny
Although the procedure is simple, optimization of conditions is usually needed. The optimal
cross-linking agent, fixation conditions, nucleic acid fragmentation method, immunoprecipitation
conditions and post-immunoprecipitation detection technique should be carefully chosen.
Cross-linking agent
Fixation of cellular structures can be obtained by chemical (acridine orange, cisplatin,
formaldehyde, methylene blue) or UV light crosslinking.
Formaldehyde is the most popular crosslinking agent since the fixation is very simple and it can
be easily reversed. Formaldehyde can be added directly to the cell culture because it penetrates the
cell membranes and crosslinks proteins to nucleic acids. In a protein it reacts with amine and imine
groups of amino acids such as lysines, arginines, histidines and in a nucleic acid with the side chains
of adenines and cytosines, what results in the formation of Shiff’s bases. The time of incubation with
formaldehyde should always be adjusted individually since, for example, non-histone proteins
require longer incubation. However, it should be taken into consideration that longer exposition of
cells to this chemical can also cause protein-protein crosslinking, what in consequence can give false-
positive result or it can hinter nucleic acid fragmentation leading to false negative results.
Formaldehyde is also a mild denaturing agent and during an exposition, which is too long,
denaturation of proteins can occur, what can decrease the antigen availability. Therefore the fixation
time should not be exceeded and on average should be up to 10-30 minutes. The crosslinking
reaction can be stopped by the addition of glycine solution (0.125 M) and reversed by heating (6h
at 65°C).
Other crosslinking chemicals are less often used, since they could be very toxic or crosslink
only DNA with proteins, like for example cisplatin. Some of them (acridine orange, methylene blue)
are agents of choice if nucleases or restriction enzymes are to be used for fragmentation of nucleic
acids, since after the formaldehyde fixation only sonication can be applied.
Besides the use of chemical crosslinking agents it is also possible to utilize ultraviolet light for
cells fixation. The source of light should be in a distance of 2-3 cm from a dish with the cell culture.
The cell irradiation with 254 nm or 266 nm UV light takes usually from a few seconds (for laser as the
source of light) up to 15 minutes (for low intensity light source) and crosslinks nucleic acids with
proteins. The first crosslink was shown for cysteine with uracyl and cysteine with thymine. Apart
from the cysteine, the most photoreactive amino acids are phenylalanine and tyrosine.
Unfortunately, over-irradiation can cause damage both in proteins and nucleic acids and can bring
false negative results. Appropriate irradiation time should be adjusted in every experiment.
Nucleic acid fragmentation method
To facilitate the purification of a nucleoprotein complex from the cell lysate and to enable
reliable estimation of the region of nucleic acid bound by the protein, fragmentation of nucleic acid is
required. The most commonly used method is sonication, which utilizes ultrasounds for shredding
nucleic acids, what produces fragments from 100 to 500 bp in length. Usually several cycles, a few
seconds burst and a few seconds pause, are applied. It is very important to keep samples chilled on
ice during the sonication since heat released during this process can result in denaturation of nucleic
acids and proteins. After the nucleic acid fragmentation with ultrasounds the sample can be
immediately subjected to immunoprecipitation.
An alternative for the sonication method is digestion of the nucleic acids with nucleases. It is
often used when no crosslinking agent was added or after a UV-light crosslinking. The reaction is fast

34
Molecular biology of nucleic acid - experimental methodology
by Katarzyna Węgrzyn & Igor Konieczny
and simple, the incubation is performed in 37°C for 5 min. It can be easily stopped by addition of
EDTA, that chelates divalent ions, which are cofactors for nucleases. Digestion with nucleases is not
recommended after formaldehyde crosslinking because due to the nucleic acid fixation the cleavage
is not efficient. A disadvantage of this method is the necessity of purification of nucleic acid
fragments after the cleavage reaction. The procedure requires centrifugation of the reaction mixture
in a CsCl gradient, which is time-consuming.
Immunoprecipitation conditions
One of the most important steps during the whole ChIP procedure is immunoprecipitation of
the nucleoprotein complex from a cell lysate. It is performed by addition of specific antibodies
recognizing the protein of interest bound to the nucleic acid and subsequent isolation of such
a complex. Concentration of the antibodies and the time of incubation depend on the antibody
specificity and should be adjusted experimentally. After the recognition of the nucleoprotein
complex by the antibodies, the whole complex is purified by utilization of protein A from
Staphyclococcus aureus or protein G from Streptococcal bacteria, conjugated with sepharose beads.
These proteins are able to bind with high affinity to the Fc region of an antibody. Conjugation with
the sepharose beads facilitates the isolation of such a complex by simple centrifugation. Although
the method of purification of the immunoprecipitated complex is quite fast and easy, a problem with
high background can occur. It arises from unspecific interactions of proteins and nucleic acids with
sepharose beads. To avoid it, competitors such as BSA or sonicated salmon sperm DNA are added to
the samples. Also the use of magnetic beads can solve this problem, however, it is still quite
an expensive technique.
Post-immunoprecipitation detection methods
After the isolation of the nucleoprotein complex through the interaction with antibodies and
the proteinA-sepharose beads, the nucleic acid should be isolated for further analysis. If the DNA is
the nucleic acid and formaldehyde is the crosslinking agent, it can be achieved by a simple incubation
of the sample in a TE buffer at 65°C for 6h, followed by centrifugation. The supernatant contains the
DNA fragments released from the complexes. Also, the whole nucleoprotein complex can be released
during incubation with 1% SDS and 0,1 M NaHCO
3
solution, for 15 min at room temperature. Then
the protein-DNA complex is further incubated at 65°C for 6h, to de-crosslink (reverse crosslink) and
release the nucleic acid. Addition of proteinase K helps to degrade proteins present in the sample.
The isolated nucleic acid can be further analyzed in a PCR reaction, Southern blotting or sequencing
reaction.
In case of RNA-protein complexes the procedure is very similar. After the isolation of
the complex with antibodies and beads coated with the protein A, an elution buffer (100 mM Tris, 10
mM EDTA, 1% SDS and DEPC-H
2
O) is added and the sample is incubated for 10 minutes at 37°C,
followed by centrifugation. The supernatant contains the RNA-protein complexes, from which pure
RNA can be obtained by proteinase K-mediated degradation of the protein. Subsequently the RNA
can be utilized in a RT-PCR or northern blotting analysis.
If a protein is going to be analyzed, the Laemmli buffer can be added directly to the sample
containing beads with isolated complexes. Next, after heating and centrifugation the supernatant can
be loaded onto denaturing polyacrylamide gels and SDS-PAGE followed by western blotting can be
performed.

Molecular biology of nucleic acid - experimental methodology
35
by Katarzyna Węgrzyn & Igor Konieczny
Control experiments
When preparing a ChIP analysis one should carefully plan control experiments, since difficulties
at every step of the procedure can give false results. A sample of the cell lysate should be taken to
confirm the presence of the nucleic acids and proteins in the initial material. To exclude over-fixation,
cross-reactivity of antibodies or unspecific interactions with resin, preparation of samples omitting
the addition of the crosslinking agent, antibodies or protein A-sepharose beads, should be
performed. If it is available, a lysate from cells with the deletion of a gene encoding the protein of
interest could also be used as a negative control.
A
BRIDGED PROCEDURE
1. Crosslinking of nucleoprotein complexes within the living cells (chemicals, UV-light)
2. Lysis of the cells (enzymatic; mechanical; ultrasounds)
3. Nucleic acid fragmentation (sonication; enzymatic cleavage)
4. Incubation with antibodies specific for the protein of interest
5. Incubation with beads coated with protein A or protein G
6. Purification of the complexes by centrifugation
7. Isolation of nucleic acid-protein complexes, necked nucleic acid or protein
8. Further analysis (PCR, blotting, sequencing)
ChIP and other methods
ChIP-chip
One of the most popular modifications of the ChIP technique is the so called ChIP-on-chip,
which combines classical the immunoprecipitation assay with microarrays. It enables very fast
screening of whole genomes for regions bound by proteins of interest. For example, the combination
of these two methods was successfully applied for the detection of regions bound by transcription
factors in yeasts. The method for obtaining the nucleic acid fragments in the ChIP-chip is the same as
in the classic immunoprecipitation assay. The additional steps are the fluorescent labeling of
the obtained fragments and hybridization to a genome microarray. As a control of the background,
the initial nucleic acid fragments (after sonication) labeled with a different dye can be used. The most
popular dyes utilized in this technique are Cy3 and Cy5.
ChIP cloning
In a ChIP-cloning method the nucleic acid fragments obtained from the ChIP assay are cloned
into vectors. This results in the construction of a library, containing fragments bound by a particular
protein. In this technique it is very important to obtain as low a background as possible since nucleic
acid fragments bound nonspecifically by the protein have equal chance to be cloned as
the specifically-bound fragments.
ChIP-seq
To identify an unknown sequence recognized by the protein of interest, the ChIP assay
followed by a sequencing reaction can be performed. It is usually utilized for creating binding maps
of whole genomes and requires analysis of large packages of data. There are many software tools
and sophisticated algorithms that assist during such data analysis and help disprove false results.

36
Molecular biology of nucleic acid - experimental methodology
by Katarzyna Węgrzyn & Igor Konieczny
T
ROUBLESHOOTING
1. If no nucleic acid is detected after ChIP procedure:
− verify the initial nucleic acid content (if necessary, add nuclease inhibitors; increase the number of cells
used in the experiment);
− verify the conditions of the crosslinking reaction (formaldehyde can cause over-fixation and masking of
the nucleic acid by proteins; UV-light can damage both nucleic acid and the protein);
− verify the presence of the initial protein (if necessary add the protease inhibitors);
− check the specificity of antibodies (if necessary, adjust the concentration and time of incubation with
antibodies).
2. If nucleic acid is detected in a negative control reaction:
− add competitors (BSA, salmon sperm DNA);
− reduce the time of incubation with a resin;
− increase the concentration of a salt in the sample;
− add a detergent (TritonX, NP40, Brij 58).
L
ITERATURE
Buck M.J. and Lieb J.D, 2004, ChIP-chip: considerations for the design, analysis, and application of genome-
wide chromatin immunoprecipitation experiments, Genomics 83: 349-360.
Das P.M, Ramachandran K, vanWert J, Singal R, 2004, chromatin immunoprecipitation assay, BioTechniques
37(6): 961-969.
Smith K.C, Aplin R.T, 1966, A mixed photoproduct of uracil and cysteine (5-S-cysteine-6-hydrouracil). A possible
model for the in vivo crosslinking of deoxyribonucleic acid and protein by ultraviolet light, Biochemistry
5:2125-2130.
Smith KC, 1969. Photochemical addition of amino acids to 14C-uracil, Biochem. Biophys. Res. Commun. 34: 354-
357.
Smith K.C, 1970, A mixed photoproduct of thymine and cysteine: 5-S-cysteine, 6-hydrothymine. Biochem.
Biophys. Res. Commun, 39: 1011-1016.
Travers A. and Buckle M, 2000, DNA-Protein Interactions, Oxford University Press.
Q
UESTIONS
1. Is it possible to identify a sequence of a DNA fragment bound by the protein, analysed by ChIP?
2. What modifications of the ChIP technique increase output of the method?
3. Protein X has been analyzed for its binding to DNA fragment by ChIP. How would you interpret the obtained
result presented on the figure below? What kind of additional control(s) would you propose?
PCR product
1 2 3 4
C
ells
lin
e
A
C
ells
lin
e
B
C
ells
lin
e
C
C
ont
rol
of
P
CR
re
ac
tion
PCR product
1 2 3 4
C
ells
lin
e
A
C
ells
lin
e
B
C
ells
lin
e
C
C
ont
rol
of
P
CR
re
ac
tion
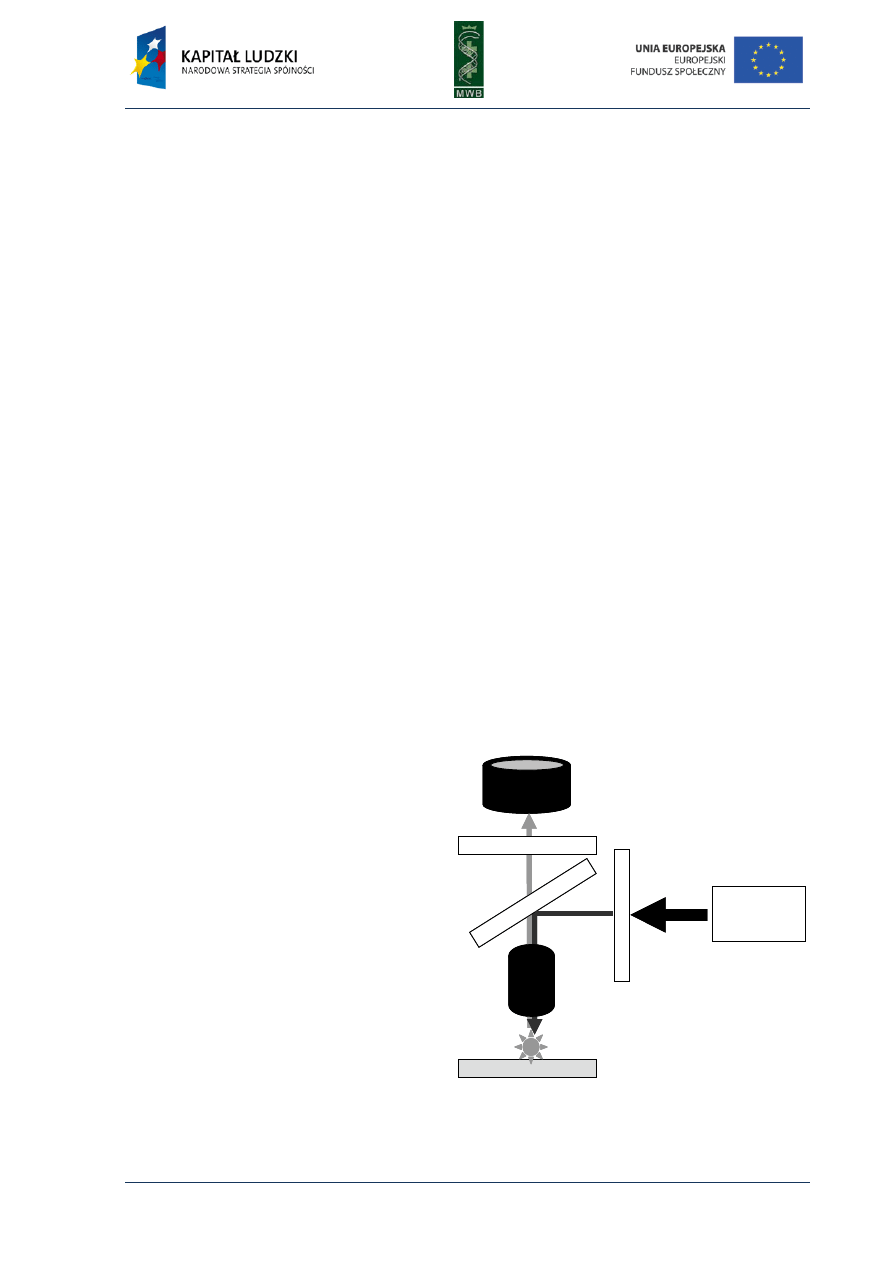
Molecular biology of nucleic acid - experimental methodology
37
by Katarzyna Węgrzyn & Igor Konieczny
CHAPTER 7. Microscopy
Researchers’ adventure with microscopy began in the XVII century, when Leeuwenhoek
improved the construction of the microscope and was first to start observing living cells.
The microscope he was using was a light microscope and since those days it was improved many
times resulting in a wide range of different instruments that enable observations of subcellular
structures. One of the greatest breakpoints took place at the beginning of the XX century and
involved the utilization of beams of electrons for creating a specimen’s image. It enabled the
observation of molecules as small as the nucleic acids, proteins or nucleoprotein complexes. Then
the subsequent progress in microscopic imaging lead to the observation of molecules with atomic
resolution that allows to notice even subtle changes in a molecule’s structure.
Fluorescence microscopy
Light microscopy was the first technique developed to observe biological objects.
Unfortunately, it was very difficult to observe molecules as small as nucleic acids, since this
technique provides resolution of about 0,2 µm and results in good images only for dark or strongly
refracting specimens. For better imaging of biological structures fluorescence microscopy was
developed. It is also a type of light microscopy but the object of interest is illuminated with a nearly
monochromatic light that excites a specimen’s fluorescence. Then the emitted light passes through
an emission filter to the microscope lens. (Fig. 13) The presence of such a filter ensures that only
emitted light is going to be observed. Depending on the light source, also an excitation filter can be
used that provides monochromatization of the emergent light. Besides a source of light emission and
an excitation filter often there is also a dichroic mirror installed. It reflects the excitatory light beam
and divides it into a number of spectrally distinct output beams, what results in an illumination of the
specimen with an intense light.
Fig. 13. A scheme of light fluorescent
microscope. The elements of the
microscope such as ocular, objective,
emission and excitation filters, source of
light and dichroic mirror are marked on
the picture. The black arrow indicates
the whole light spectrum produced by
the lamp. The dark gray arrow shows the
path of the excitation light and the light
gray arrow represents the light emitted
by the specimen.
Fluorescence microscopy allows to observe a molecule that emits light by itself or that was
stained or tagged with a fluorescent molecule. The most popular dye utilized for DNA staining is DAPI
(
Light source
Ocular
Dic
hr
oic
mi
rro
r
E
x
c
it
a
tio
n
filt
e
r
Specimen
Emission filter
Objective
Light source
Light source
Ocular
Dic
hr
oic
mi
rro
r
E
x
c
it
a
tio
n
filt
e
r
Specimen
Emission filter
Objective
4',6-diamidino-2-phenylindole). It associates with AT clusters in the minor groove and preferentially
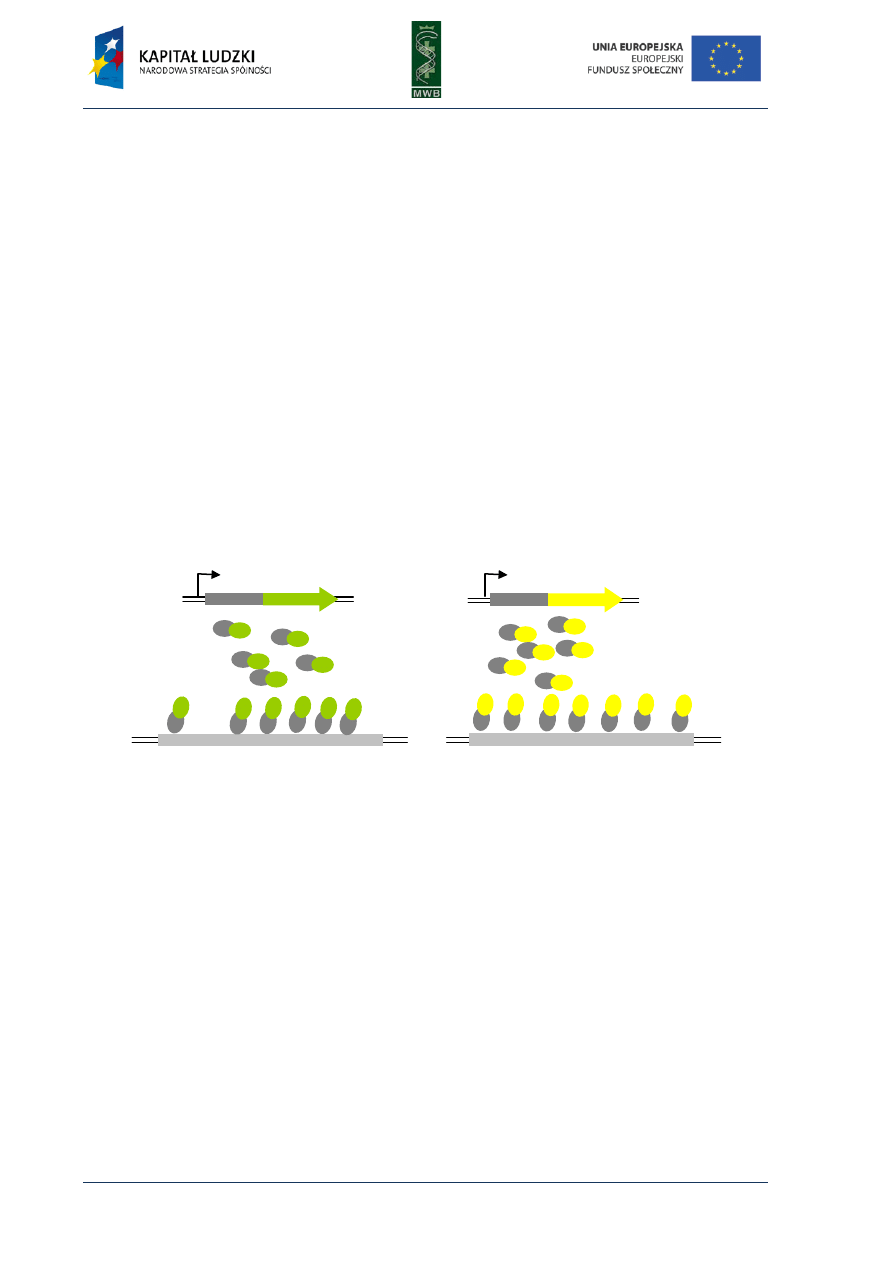
38
Molecular biology of nucleic acid - experimental methodology
by Katarzyna Węgrzyn & Igor Konieczny
stains dsDNA. DAPI can also bind RNA but in a different binding mode. It is excited by a
Apart from dyes, naturally occurring proteins like green fluorescent protein (GFP), can be used
as fluorescent tags facilitating microscopic observations of nucleic acids and proteins. A gene for such
a tag can be fused with the gene for a protein, that binds the analyzed nucleic acid. Binding of
the product of this gene (fusion protein) to the nucleic acid can result in focusing of fluorescence in
a subcellular position, that corresponds to the subcellular position of the nucleic acid. This kind of
nucleic acid tagging is utilized for example in the fluorescent repressor-operator system (FROS).
wavelength of
358 nm and emits light of 460 nm wavelength (when bound with RNA it emits light of about 500 nm)
which is visible as blue fluorescence.
Fluorescent Repressor-Operator System (FROS)
The FROS technique enables localization of a DNA particle in living cells and is based on
the interaction between a fusion protein (repressor fused with a fluorescent protein) and
an operator sequence introduced into the nucleic acid of interest. Binding of the operator sequence
by the fusion protein, via an interaction with the repressor, results in a convergence of fluorescence
in the position occupied by the nucleic acid (Fig.14). Under a microscope it is observed as
a fluorescent focus.
Fig. 14. A scheme of FROS system based on lactose (A) and tetracycline (B) operons. The gene for fusion
protein (repressor and fluorescent protein) is expressed under the control of arabinose promoter P
BAD
.
The DNA of interest contains the cassette with 256 repeats of operator sequence lacO (A) or tetO (B). Binding
of repressor to the operator sequence results in focusing of fluorescence in the position of DNA of interest.
For the first time FROS was used by Robinett and co-workers to visualize chromosomal DNA
in budding yeasts. 256 repeats of an operator sequence from the lactose operon lacO were
introduced to the yeast chromosome. Then the gene encoding for the LacI repressor in fusion with
GFP was expressed; binding of the LacI-GFP to the lacO sequence resulted in the observation of
a fluorescent focus in the position corresponding to the subcellular localization of chromosomal DNA.
A similar system, based on tetracycline operon elements was used later by Michaelis and co-workers.
The FROS technique is now mainly applied and intensively exploited for determination of plasmid’s
localization in bacterial cells. The main advantage of this system is that it enables the observation of
molecules in living cells in different conditions and at different points of the cell cycle. Locating the
gene for a fusion protein under the control of a regulated promoter also facilitates the control over
the expression level of the gene. The only difficulty and limitation of the FROS technique is that it
requires the introduction of an operator sequence into the sequence of the DNA molecule of
interest. The bacterial cell should also contain the gene for the fusion protein. These requirements
P
BAD
P
BAD
A
B
lacI
gfp
eyfp
tetR
lacO
lacO
tetO
tetO
tetO
lacO

Molecular biology of nucleic acid - experimental methodology
39
by Katarzyna Węgrzyn & Igor Konieczny
cause the necessity of genetic manipulations before microscopic observations and are a bottleneck
of the FROS technique.
A
BRIDGED PROCEDURE
:
1. Preparation of a DNA molecule of interest (incorporation of an operator sequence) and the gene encoding
the fusion protein
2. Cell culture preparation
3. Induction of the expression of the lacI-gfp gene (time of the expression should be adjusted experimentally;
for E. coli cells the expression from the PBAD promoter usually lasts 30 min.)
4. Inhibition of the expression of the lacI-gfp gene
5. Additional staining of the cells (optional)
6. Preparation of the specimen
Fluorescent in situ hybridization (FISH)
An observation of the subcellular localization of a nucleic acid can be performed not only
in living cells (with FROS) but also in fixed cells - by using FISH technique. FISH was developed in the
late 1960s and utilizes the hybridization of radiolabeled probes to a complementary sequence of
the investigated nucleic acid. Nowadays, fluorescently labeled probes are commonly used for FISH
experiments. The probe can be a restriction fragment that is labeled at one end by incorporation of
a modified nucleotide (
☼-dNTP) by the terminal deoxinucleotide transferase (TdT) (Fig. 15) or during
a 3'-end filling reaction with the use of Klenow fragment of the DNA polymerase I.
Apart from the preparation of the probes, fixation of the cells is required during a FISH
procedure and consists of incubation with a crosslinking agent (e.g. paraformaldehyde) and
subsequent dehydratation of the cells in alcohol baths (70%, 90% and 96% ethanol). The cells are
prepared on a glass slide what facilitates the following microscopic observations. Before the probes
are added to the cells both probes and the investigated DNA are denatured by heating the samples
and then hybridization is continued at 42°C for 16-20 hours. Next, the excess of the probes is
removed by simple washing of the glass slide and then additional staining of the cells can be
performed.
A
BRIDGED PROCEDURE
1. Preparation of the probes (fluorescent labeling with tagged nucleotide
☼-dNTP)
2. Cell fixation (formaldehyde, paraformaldehyde)
3. Permeabilization ( lyzozyme, detergent) (optional)
4. Cell dehydration (ethanol baths)
5. Denaturation of the probes and the nucleic acid within the cells
6. Hybridization
7. Removal of the excess of the probes
8. Additional staining (optional)
9. Microscopic observations
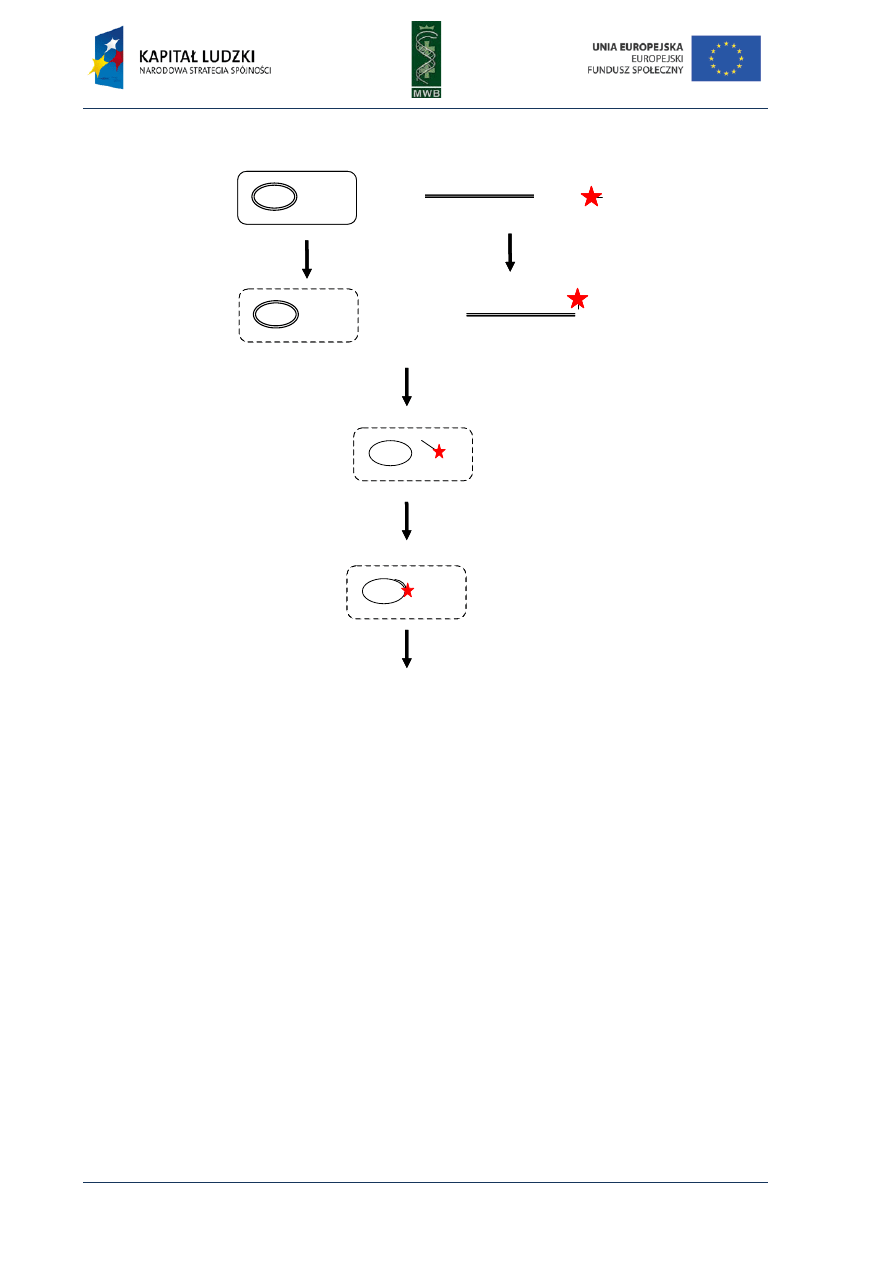
40
Molecular biology of nucleic acid - experimental methodology
by Katarzyna Węgrzyn & Igor Konieczny
Fig. 15. A scheme of cells (A) and fluorescent probe preparation (B) and abridged FISH procedure (C). The cells
are fixed with for e.g. paraphormaldehyde and the cell wall and membranes are permeabilized (A) The probe is
prepared by addition of fluorescently labeled nucleotide to the 3’ end of short DNA fragment, containing
sequence complement to the DNA of interest. The reaction is catalyzed by terminal deoxynucleotide
transferase (B). Then the probes are mixed with the cells (C) and the sample is heated, making possible the
denaturation of DNA, both the probe and the investigated DNA. Next the cells are incubated allowing
the hybridization of the probe with DNA of interest within the complement region. After that cells can be
additionally stained with fluorescent dyes (e.g. DAPI) and prepared for microscopic observations.
The procedure is very similar for both prokaryotic and eukaryotic cells, therefore it is
commonly used in microbiology, genetic diagnostics and tumor biology. It allows to detect even very
small alterations (deletion, duplications, rearrangements) in the genetic material, therefore it is
a popular method of karyotyping (visualization of a cell’s chromosomes). FISH can also be utilized for
comparing samples from different organisms and finding the differences in a gene arrangement.
Nucleic acid localization via its binding proteins labeling
Both FROS and FISH are methods in which the nucleic acid is tagged with a fluorescent protein
or a labeled nucleic acid fragment, respectively. The position of the DNA or the RNA within a cell can
also be determined by staining proteins that naturally bind the nucleic acid molecule. It can be
achieved by expression of a gene for a fusion protein (protein of interest and a fluorescent one) or by
immunostaining. The first method is utilized in living cells and is very similar to the FROS technique.
It also requires a fusion between the gene for the protein of interest and the fluorescent one, but in
5’-
- 3’
+
dCTP
5’-
C
A
B
3’ end labeling
by TdT
fixation and
permeabilization
denaturation
+
C
hybridization
microscopic observations
5’-
- 3’
+
dCTP
5’-
C
A
B
3’ end labeling
by TdT
fixation and
permeabilization
denaturation
+
C
hybridization
microscopic observations
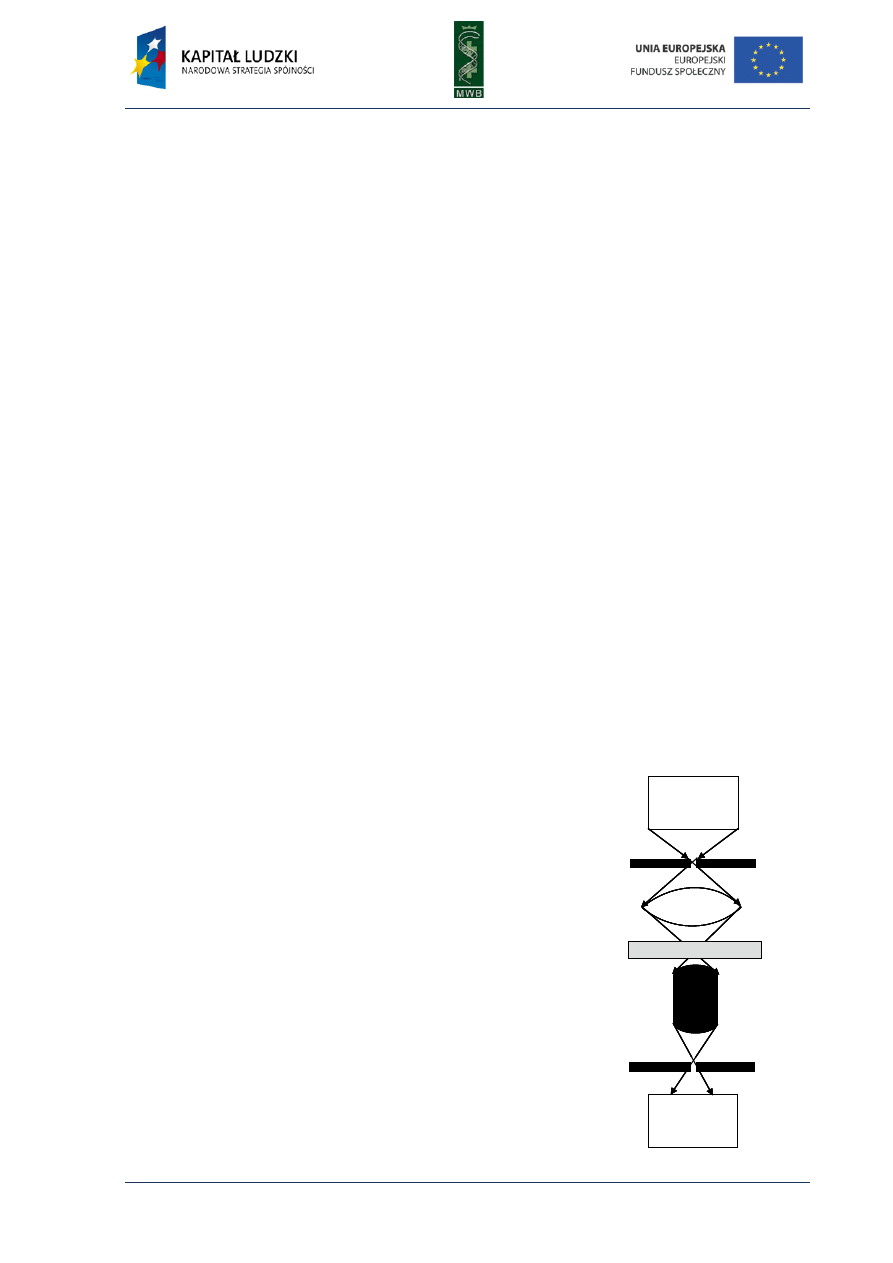
Molecular biology of nucleic acid - experimental methodology
41
by Katarzyna Węgrzyn & Igor Konieczny
contrast to the FROS, it does not require cloning of a binding sequence. This makes the method
easier than FROS, however, not all proteins fused to a fluorescent one can remain active, like
a repressor (e.g. LacI) does. This limitation can be omitted in a immunostaining technique, but the
observations are performed on fixed cells, similarly as in the FISH method. Instead of the labeled
probes it requires utilization of labeled antibodies that recognize the protein of interest.
Unfortunately, both techniques stain the nucleic acid indirectly and what is observed is the protein’s
subcellular localization. It can only be suspected that the localization of the nucleic acid within
the cell is equal to the subcellular position of the area covered with the nucleic acid binding protein.
Confocal microscopy
Although fluorescent light microscopy has many advantages, it is very difficult to obtain images
of thick specimens that emit light. What is more, the light from above and below the focal plane can
reduce the contrast what is observed as blurring of an image. These limitations are omitted in
confocal microscopy, which enables to obtain 3D sharp images of specimens as thick as
50 micrometers or more. The idea of such a microscope was created and then patented in 1957 by
Marvin Minsky. It is based on placement of the light source behind the pinhole in a such a way that it
forms a point source of light, focused on one spot of specimen. Then the reflected light is focused by
the objective lens at the image plane (Fig. 16). The presence of a non-transparent pinhole aperture
enables only light reflected from the specimen to pass to the detector and rejection of the light
coming from above and below of a focal plane. To obtain the information of a whole specimen the
spot is scanned across the image and date are collected sequentially.
Nowadays one of the most popular confocal microscopes is epi-illumination, in which light emitted
by the laser passes though the pinhole aperture, scans the specimen and passes through the second
pinhole aperture positioned in front of the detector. The result of specimen observations with
confocal microscope is a 3D image and the specimen can be either live or fixed cells and tissues.
Fig. 16. A scheme of confocal microscope. The path of the light is
marked by black arrows. The light from the source of light passes
through the pinhole, then the light is collected by the condenser lens
and is focused as a spot within the specimen. Light emitted by the
sample passes through the objective lens and the pinhole and finally
reaches the detector.
Pinhole
Specimen
Objective
Light source
Specimen
Detector
Condensor
lens
Pinhole
Specimen
Objective
Light source
Specimen
Detector
Condensor
lens
Specimen
Objective
Light source
Light source
Specimen
Specimen
Detector
Detector
Condensor
lens
Condensor
lens
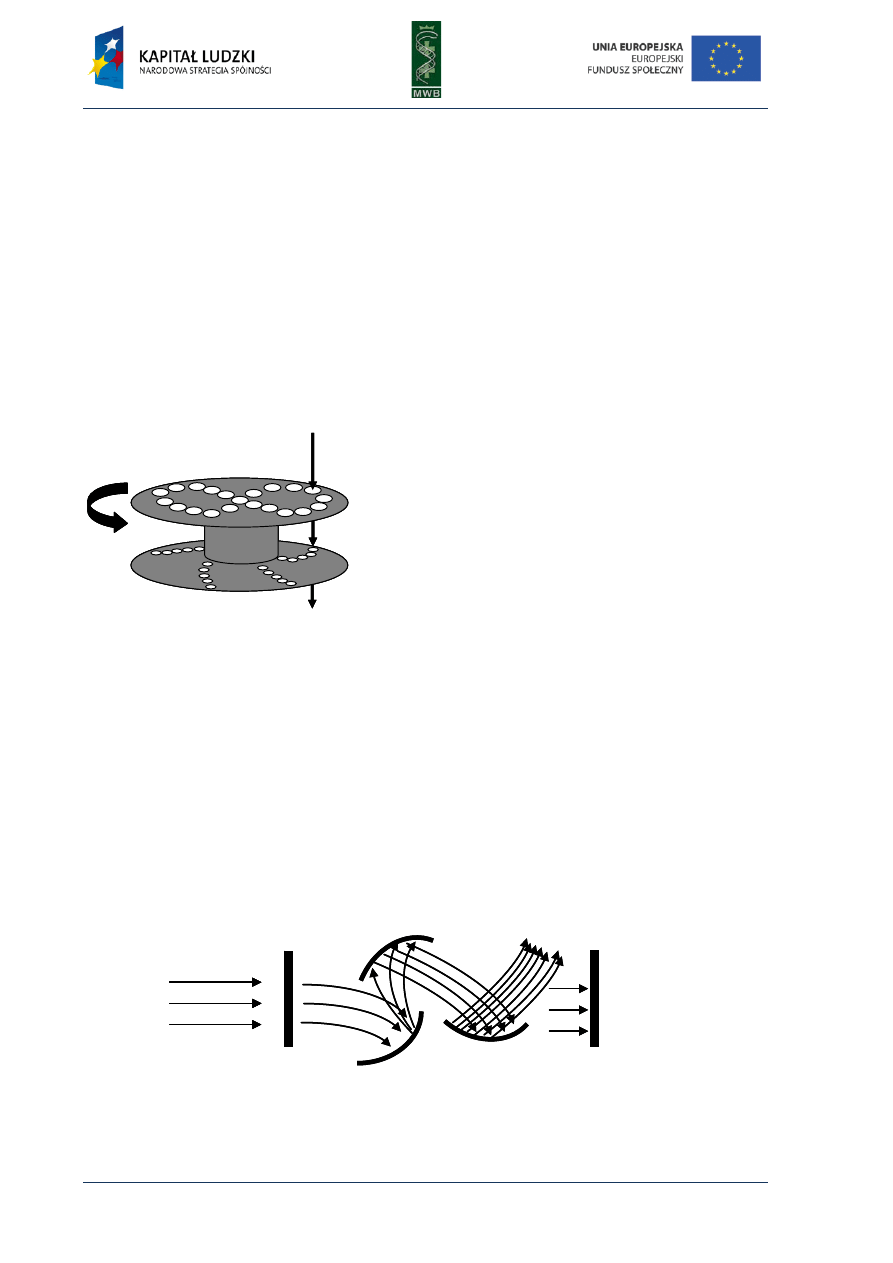
42
Molecular biology of nucleic acid - experimental methodology
by Katarzyna Węgrzyn & Igor Konieczny
Scanning techniques
Confocal microscopes differ in beam scanning techniques and the single-beam scanning and
multiple-beam scanning microscope can be distinguished. The first one is used in most laser scanning
confocal microscopes (LSCM) and can use galvanometer mirrors, acousto-optic devices or oscillating
mirrors which cause the focusing of a single beam on the specimen, what enables to sequentially
point-scan a region of interest. Unfortunately these kinds of microscopes have limited speed of
scanning, therefore they are unsuitable for observations of millisecond dynamic events. In multiple-
beam scanning microscopes (spinning disk microscopes) these limitations are omitted because of a
spinning Nipkow disc application. It is a disk containing an array of pinholes and microlenses (Fig. 17)
that enables the usage, in parallel, an array of beams, what results with faster scanning of
the specimen. Spinning disk microscopes have found application in observations of high speed
intracellular events.
Fig. 17. The improved Nipkow disk. The first disk
contains microlenses and the second one contains
pinholes. The path of the light through the disk is
shown by the black thin arrows. The direction of the
disk movement is indicated by the thick black arrow.
Detectors used in confocal microscopy
In confocal microscopes different types of detectors can also be used, which include
photomultipliers, photodiodes or charge-coupled devices (CCDs). All of them are highly sensitive
photon detectors, since the amount of light available for image formation is reduced in a confocal
microscope because of the exclusion of light from fluorescent structures located away from the
objective focal plane.
The most popular one is photomultiplier, which is a photosensitive surface that catches
the photons and then transfers the absorbed photons’ energy into a stream of photoelectrons.
The energy transition occurs in a photocathode that emits electrons. Then electrons are multiplied
on dynodes (chain of electron multipliers) and finally reach the anode (Fig. 18)
Fig. 18. Schematic representation of a photomultiplier. The photocathode, dynodes and anode are marked on
the scheme. The arrows indicate the path of the light and photoelectrons. (based on Engstrom).
photocathode
dynode
dynode
anode
light
electrons
photocathode
dynode
dynode
anode
light
electrons
microlenses disk
pinholes disk
microlenses disk
pinholes disk

Molecular biology of nucleic acid - experimental methodology
43
by Katarzyna Węgrzyn & Igor Konieczny
Specimen preparation
The preparation of the specimen for confocal microscopic observations is very similar as for
a conventional wide field microscope. However, because the objects observed with a confocal
microscope are thick, their preparation should not damage the 3D structure of the specimen.
To avoid specimen deformations very often a spacer is used as a fishing line or a piece of coverslip is
put between the slide and the coverslip. The specimen for these kinds of observations can be either
live or fixed cells and tissues, depending on their transparency. The fixation of the sample can
increase the penetration of the specimen by the laser beam and reduce opacity and turbidity of
the object. If the penetration of the light is not enough to image all the sections of the specimen,
the fixed sample can be cut using a microtome and each section can be imaged separately.
The fixation is very often combined with permeabilization of the specimen, what facilitates the later
sample staining. The permeabilization of the cells can be achieved by incubation with DMSO, Triton
X-100, saponin or deoxycholate. Then the additional staining can be performed with fluorescent dyes
or labeled antibodies and due to the photobleaching effect also liquid embedding media like glycerol
should be used.
A
BRIDGED PROCEDURE
1. Fixation
2. Permeabilization
3. Staining
4. Mounting
5. Observations
Electron microscopy (EM)
Despite the fact that the simplicity of light microscopy makes it the most popular technique to
visualize biological objects, it is connected with some limitations that disable it in observations of
small macromolecules. These restrains can be overcome in electron microscopy, where instead of
light, a beam of electrons generates the image of very small objects. The magnitude and
the resolution obtained with EM are 10 000 000× and 0,2 nm, respectively. The source of electrons is
a tungsten cathode, followed by an anode that accelerates the electrons (Fig. 19). When
the electrons pass through the specimen, they are focused by a series of magnetic lenses. At the end
of their pathway there is a fluorescent screen or a photographic plane; the electrons interact with
these materials as photons and generate an image of the specimen.
The type of EM described above is the transmission electron microscopy (TEM), since
the beam of electrons is transmitted through the specimen and its image is generated by the
particles that pass through it. The second most popular EM technique is the scanning electron
microscopy (SEM), in which the electrons scan the specimen and a signal from every scanned spot is
collected, amplified and displayed. There can be three types of data collected: second electrons (SE),
backscatter electrons (BE) and characteristic X-rays, however, very rarely one instrument contains all
three types of detectors. The obtained image has a characteristic three-dimensional aspect resulting
from highlights and shadows of the scanned surface. It has weaker parameters of the obtained image
than the TEM (resolution 10-20 nm; magnification 500 000×), but it enables to observe thick objects
and to generate an image of their surface. The SEM is usually used for observation of whole cells and
tissues.
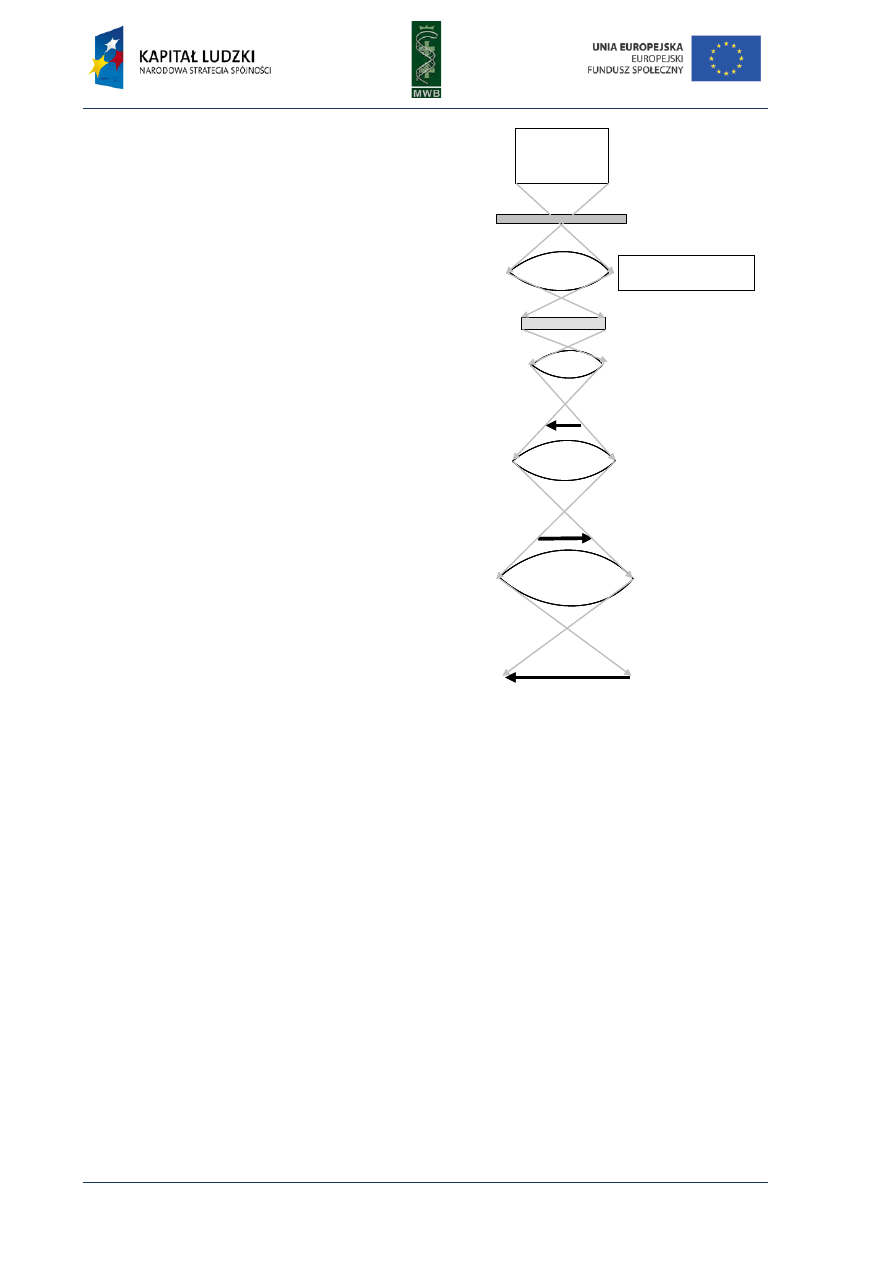
44
Molecular biology of nucleic acid - experimental methodology
by Katarzyna Węgrzyn & Igor Konieczny
Fig. 19. A scheme of the electron microscope.
The elements as source of electrons, condenser,
intermediate and projector lens are marked in the
picture. The path of the electron beams is indicated by
gray arrows. The intermediate images and final image
are shown as black arrows.
Specimen preparation
The specimen preparation from different biological materials is very similar and consists of
adsorption on a support matrix (carbon-coated grid), drying and contrast addition. What is very
important for TEM, the specimen must be very thin, less than 20 nm.
Due to the fact that also the support matrix can have impact on the quality of the image,
the grid preparation is the very first step in an EM procedure. The grid is usually made of copper
coated with a support film. The most common one is a carbon film, since it forms a very thin layer
and does not influence the images. Unfortunately, carbon creates a hydrophobic environment and
before use it must be subjected to ionizing gases or chemical treatment to become hydrophilic.
Then the sample can be prepared. The first step of this procedure is the sample adsorption on
a supporting matrix. When a nucleic acid is going to be observed there are two methods of molecule
adsorption: spreading with the use of a basic protein film or a direct adsorption. In the spreading
method usually it’s the cytochrome c that is mixed with a nucleic acid. The positively charged
cytochrome c complexes the negatively charged nucleic acids and forms a film at the water-air
interface. Then such a mixture can be spread on the carbon-coated grid. The nucleic acid can also be
directly adsorbed on a mica support, which is a more common method. It requires deposition of
the amine groups (pentylamine) on a carbon-coated grid and their spontaneous interaction with
the nucleic acids. Molecules can also be bound to carbon via mediators such as the polylysine
(polymer with positively charged groups) or divalent cations (Mg
2+
).
Electron
source
Specimen
Specimen
Specimen
Condensor
lens
Objective
lens
Intermediate
lens
Projector
lens
Anode
First intermediate image
Intermediate image
Final image
Electron
source
Specimen
Specimen
Specimen
Condensor
lens
Objective
lens
Intermediate
lens
Projector
lens
Anode
First intermediate image
Intermediate image
Final image
Condenser lens

Molecular biology of nucleic acid - experimental methodology
45
by Katarzyna Węgrzyn & Igor Konieczny
Since contrast in the EM depends on the atomic number of the atoms in the sample, and
the biological molecules such as a nucleic acid or proteins have low value of this parameter, it is
required to stain them with heavy metal salts (salts of osmium, uranium, lead) possessing a high
atomic number. When the beam of electrons meets the heavy metal atoms it is diffracted under such
a large angle that it cannot enter the imaging lanes. The staining can be positive, when the heavy
metal ions interact with the molecule what results in contrasting of the molecule, or can be negative,
when the macromolecule is usually unstained in contrast to the stained surroundings. The most
popular method of nucleic acid staining utilizes uranyl acetate, which forms simple salts with the
phosphate groups of DNA. This compound can also be used for staining proteins (it is then performed
in lower pH than the one used for DNA) and RNA. For enhancing the obtained signal to generate
a higher quality image, antibodies can also be used. They can bind to a protein, simply increasing
the size of the investigated object or they can be conjugated with gold particles, what improves
the detection (Immunogold Electron Microscopy).
Apart from staining the contrast can be enhanced by a metal shadowing technique. It consists of
spraying particles of a vaporized metal onto the whole specimen. This technique is commonly used
to emphasize the details of biological structures. Platinum is most commonly used in the metal
shadowing; first it is melted and then evaporated from a heated electrode.
Cryo-electron microscopy (CEM)
The basic limitation of EM is that it requires preparation of a dry specimen. It makes impossible
the observation of molecules within a buffer. This restriction can be avoided in a cryo-electron
microscopy. In CEM the specimen is observed at liquid nitrogen or liquid helium temperatures, what
prevents evaporation of water. The specimens are usually prepared by vitreous-ice technique, during
which a sample placed on a grid is rapidly frozen. The specimen can also be frozen, cut with
a diamond knife into thin pieces (40-200 nm) and then placed on the grid. The low temperature
during imaging ensures additional protection of the specimen from radiation damage. Results
obtained with the CEM can be reconstructed into three-dimensional images of the analyzed
molecule. Compared to the negative staining and the metal shadowing of the specimen in EM,
the CEM image is a superimposition of all of the densities in the sample what results in more actual
data.
Atomic force microscopy (AFM)
Although electron microscopy is characterized by resolution as high as 0,2 nm sometimes it is
insufficient to observe very small objects. The atomic force microscopy enables to observe even
the arrangement of individual atoms in a sample with a routine resolution higher than 0,1nm. It was
developed in 1986 on the basis of the scanning tunneling microscope. In AFM the image is not
generated by focusing light or electrons on a specimen but by interaction between the surface and a
sharp probe (tip) of a cantilever. It is very often said that the probe “feels” the sample in AFM. During
the sample scanning, a map of its surface is generated and then the collected data is transformed
into an image. There are three basic elements of an AFM instrument: a piezoelectric transducer,
a force sensor and a feedback control. The first is responsible for the movement of the tip over the
scanned surface. The piezoelectric properties of this element result in changes in its geometry
without changes in the volume under the influence of the applied electrical potential (Fig. 20).

46
Molecular biology of nucleic acid - experimental methodology
by Katarzyna Węgrzyn & Igor Konieczny
Fig. 20. The shape of piezoelectric disk depending on
applied voltage. Piezoelectric material causes that the
disk changes its shape with the constant volume
retention when the voltage potential is applied. (based
on Eaton and West, modified).
The piezoelectric transducer, also called a piezoelectric scanner is usually made of ceramic
materials such as amorphous lead barium titanate (PdBaTiO
3
) or lead zirconate titanate
(Pd[Zr
x
Ti
1-x
]O
3
). It changes the electric potential into a mechanical motion and depending on its shape
it can have more or less motion. Usually it has the shape of a tube (it is present in over 75% of all
AFMs in use).
The second important element of the AFM is the force sensor, which measures the force
between the tip and the surface of the specimen. It can measure forces as low as 10 pN. Most of
the AFM microscopes contain an optical lever force sensor, which consists of a laser focusing light on
the cantilever, that reflects this light to the detector (Fig. 21).
Fig. 21. Scheme of optical lever sensor in the Atomic Force
Microscope. Cantilever is the end with a tip that scans
the surface of the specimen. The up-and-down movements
of the cantilever change the distance between the
cantilever and the detector, what influences the place on
the detector when reflected light falls. (based on Eaton and
West, modified).
Then the signal is directed to the feedback control, which controls the force between the probe and
the specimen’s surface and the movement of the probe. It moves the probe in such way that
the force is constant. For example, if the force sensor detects an increase in the force, it means that
the probe is in closer contact with the surface and it should be moved upwards.
The feedback control enables keeping a proper distance between the sample and the tip. Depending
on the mode type, the sample’s surface can be in direct contact with the tip (contact mode),
the cantilever with the tip can oscillate over the surface and contact it only at the very end of every
downward movement (tapping mode) or does not contact it at all (non-contact mode).
The specimen preparation
The AFM technique enables to observe different objects. The samples that are to be prepared
can be dry (air-AFM) or immersed in a liquid solution (liquid-AFM), what gives the possibility to
observe biological structures in their natural environmental conditions. What is very important the
sample must be rigidly adhered to a smooth substrate since movement of the sample during the
scanning can hinder the generation of a high resolution image. The smaller molecules the smoother
substrate must be used. The most popular substrates are glass, mica or silicone oxide and sometimes
they are used with additional chemicals (e.g. poly-L-lisine, polyethyleneimide, divalent cations) that
facilitate the sample-substrate interaction. Mica is the most often used in biological applications and
like in the EM specimen’s preparation, it is often coated with carbon, what yields hydrophobic
surface suitable for immobilization of hydrophobic molecules e.g. DNA. For DNA also the addition of
V
V
V
V
detector
cantilever
las
er
li
ght
detector
cantilever
las
er
li
ght

Molecular biology of nucleic acid - experimental methodology
47
by Katarzyna Węgrzyn & Igor Konieczny
divalent cations, such as Mg
2+
, Mn
2+
, Zn
2+
, Ni
2+
, can improve the DNA binding to the mica.
Interestingly, the monovalent cations (
K
+
, Na
+
, Li
+
) can inhibit the proteins-mica binding.
Sometimes
a special gold surface is prepared as it is inert against oxygen and free radicals species and can be
easily modified to facilitate the molecules’ adhesion. Molecules can also be bound covalently to
an appropriately prepared substrate. Sometimes special linkers are used that mediate between
the molecule and the substrate ensuring the mobility of the molecule, which can freely interact with
complementary molecules.
There are different methods for placing the sample on the substrate. For the air-AFM, a drop
of molecule solution can be deposited on the substrate and left to evaporate or the substrate can be
immersed in the solution and then air-dried. The sample can also be sprayed onto a substrate.
The molecules can also be directly imaged in liquid conditions without air-drying.
Applications
The AFM is a technique that gives the possibility to observe all kinds of molecules in different
conditions with an atomic resolution. It was successfully applied for imaging of biological molecules
as small as DNA, proteins or nucleoprotein complexes as well as tissues, cells and viruses. The big
advantage of this microscopic technique is that it enables reconstruction of the biological processes
and their observation, like for example the movement of RNA polymerase along the DNA template.
Moreover, it is still developed to obtain better resolution, especially with soft samples in as short
time as possible.
L
ITERATURE
Andreeff M, Pinkel D, 1999, Introduction to fluorescence in situ hybridization: principles and clinical
applications, Wiley-Liss.
Bozzola J.J. and Russell L.D, 1999, Electron microscopy. second edition, World Headquarters.
Braga P.C. and Ricci D, 2004, Atomic force microscopy: Biomedical methods and Aplications. Human Press
Claxtone N. S, Fellers T. J, Davidson M. W, 2005, Laser Scanning Confocal Microscopy,
http://www.olympusfluoview.com/theory/LSCMIntro.pdf
Conn P.M, 2010, Techniques in confocal microscopy, Academic Press.
Dykstra M.J. and Reuss L.E, 2003, Biological Electron Microscopy: theory, techniques and troubleshooting.
second edition.
Eaton P. and West P, 2010, Atomic force microscopy, Oxford University Press.
Engstrom R.W, 1980, Photomultipiler handbook. RCA Corporation.
Fuller S, 1999, Cryo-electron microscopy:taking back the knight. Microbiology Today 26: 56-58.
Kirat K.E, Burton I, Dupres V, Dufrene Y.E, 2005, Sample preparation procedures for biological atomic force
microscopy, Journal of Microscopy 218(3): 199-207.
Liehr T, 2009, Fluorescent in situ Hybridization (FISH) – Aplication Guide, Springer.
Michaelis C, Ciosk R, Nasmyth K. 1997 Cohesins: chromosomal proteins that prevent premature separation of
sister chromatids. Cell. 91(1): 35-45.
Muller M, 2006, Introduction to confocal fluorescence microscopy. Second edition, SPIE.
Pogliano J, Ho TQ, Zhong Z, Helinski DR. 2001 Multicopy plasmids are clustered and localized in Escherichia coli.
Proc Natl Acad Sci USA. 98(8): 4486-91.
Price R.L. and Gerome W.G, 2011, Basic Confocal Microscopy, Springer.
Verheust C, Helinski DR. 2007 The incC korB region of RK2 repositions a mini-RK2 replicon in Escherichia coli.
Plasmid 58(2): 195-204.

48
Molecular biology of nucleic acid - experimental methodology
by Katarzyna Węgrzyn & Igor Konieczny
Robinett C.C., Straight A., Li G., Willhelm C., Sudlow G., Murray A., Belmont A. S. 1996, In vivo localization of
DNA sequences and visualization of large-scale chromatin organization using lac operator/repressor
recognition. J Cell Biol 135(6 Pt 2): 1685-700.
Q
UESTIONS
1. What kind of microscopy should be chosen to image nucleoprotein complexes?
2. How would you determine changes in a subcellular position of DNA particles within the bacterial cell?
3. What kind of microscopic techniques enable to observe very thick specimens and which require preparation
of very thin samples?

Molecular biology of nucleic acid - experimental methodology
49
by Katarzyna Węgrzyn & Igor Konieczny
CHAPTER 8. Two dimensional electrophoresis of nucleic acids
Classical nucleic acid electrophoresis enables to separate fragments which differ in molecular
mass. It is based on the ability of the negatively charged molecules to migrate in the electric field to
the anode. Since the migration of nucleic acid is performed in porous agarose or polyacrylamide gel,
the smaller fragments migrate easier through the pores and can be separated from fragments of
higher molecular mass that migrate slower. Electrophoresis is a basis of different methods used in
restriction mapping, molecular diagnostics or genetic fingerprinting (e.g. RFLP-PCR; see Chapter 1).
However, the resolution of one dimensional electrophoresis is limited. Therefore the separation of
samples in the second dimension can evidently improve the method and quality of the obtained
results. Two-dimensional electrophoresis (2-DGE) was discovered over fifty years ago to separate
peptides and proteins. Then it was also applied for separation of t-RNAs, large fragments of high
molecular weight RNA, DNA restriction fragments or DNA replication intermediates. In this technique
two electrophoretic separations of molecule mixtures are performed. The first separation is
performed in agarose or polyacrylamide gel and then further electrophoresis is conducted but in
perpendicular direction to the first one. In case of nucleic acids the first dimension separates
according to the molecular mass and the second one according to the structure. In 2-DGE, DNA
structures such as Y-shaped, X-shaped or circular molecules can be easily distinguished.
2-DEG of replication intermediates
One of the most common application of two-dimensional DNA gel electrophoresis concerns
separation of replication intermediates. It requires the digestion of DNA molecules and separation of
the obtained fragments in two dimensions. Very often the sample preparation comprises also
an additional step - the BND-cellulose chromatography of DNA fragments. It provides the enrichment
of the sample in DNA fragments containing replication bubbles since BND-cellulose binds single
stranded DNA.
The first electrophoresis is performed in neutral conditions and separates DNA fragments
according to mass. It is performed in 1×TBE buffer in a low agarose concentration gel (0,4%) to
minimize dependence of mobility on structure. The first dimensional gel is run at low voltage (1V/cm)
for about 15h, however for larger DNA fragments (>6kb) it is recommended to even reduce
the voltage since branched intermediates bigger in size are more likely to have retarded mobility.
The second dimension electrophoresis, resolving the DNA fragments according to shape, can be
performed in neutral or denaturing conditions. A neutral electrophoresis is prepared when
the replication origin region is going to be identified. A gel for electrophoresis in second dimension
has higher agarose concentration (1-1,3%) and addition of ethidium bromide (0,5µg/ml). It is run
at higher voltage (5-9V/cm) in 1×TBE buffer supplemented with ethidium bromide (0,5µg/ml). Based
on the shape of the obtained separation curve, it can be estimated what the DNA fragment looks like
and if it contains a replication origin region (Fig. 21). The presence of characteristic arcs created by
migrating bubble- or Y-shaped DNA fragments can confirm the occurrence of replication forks.
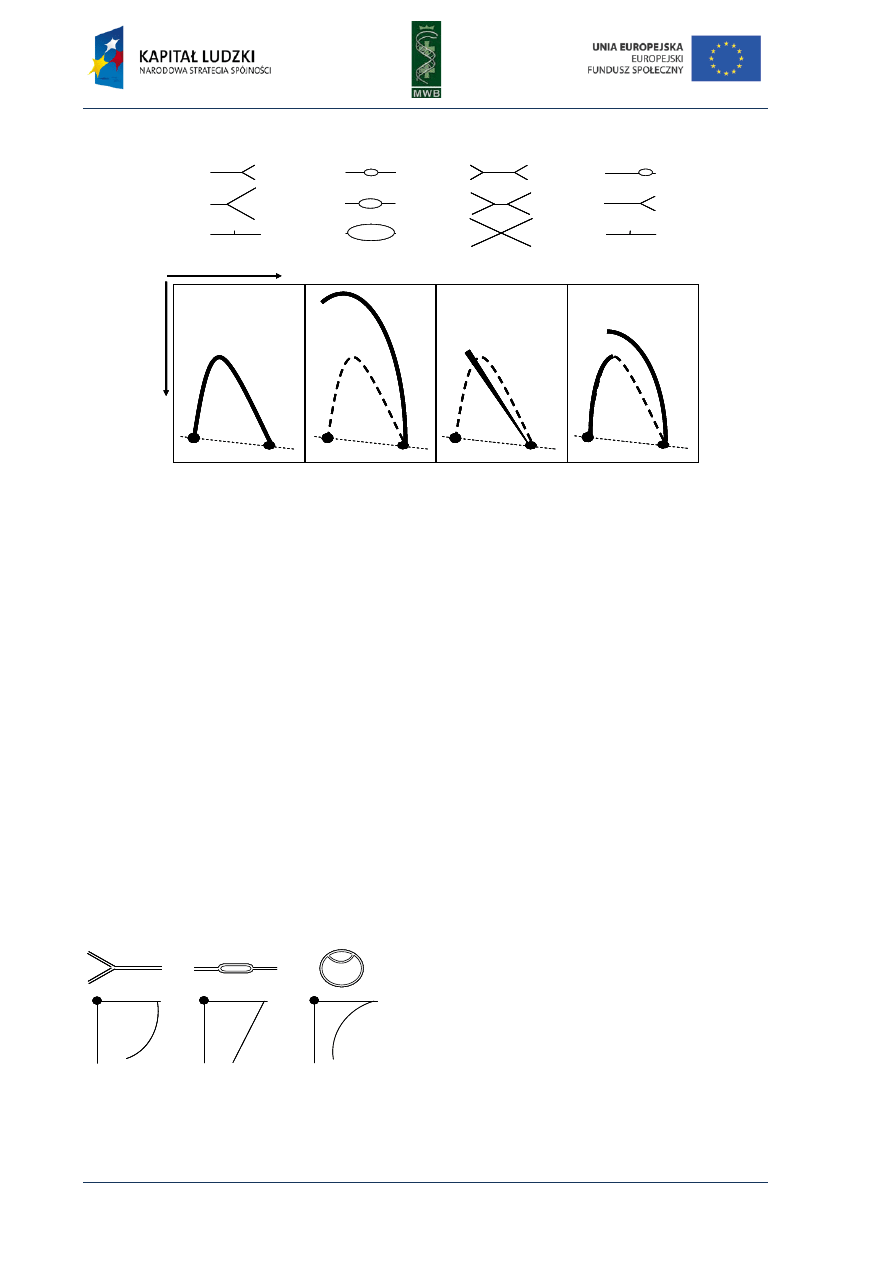
50
Molecular biology of nucleic acid - experimental methodology
by Katarzyna Węgrzyn & Igor Konieczny
Fig. 21. Scheme of replication intermediates separated in gel during neutral 2D electrophoresis. In the first
dimension intermediates are separated based on their size and then the separation in the second dimension is
based on size and shape. The pattern of their separation, depending on shape of intermediates: simple Y (A),
bubble (B), double Y (C), bubble changing into Y (D) is shown on the scheme. (based on Brewer and Fangman,
modified).
If the direction of replication forks movement is going to be determined, a second dimension
gel should be performed in denaturing conditions. Alkaline buffer (AEB buffer containing 30-40mM
NaOH and 2mM EDTA) secures such an environment. It should be remembered, however, that
agarose cannot gel under such conditions, therefore it should be prepared in water and then soaked
in the AEB buffer. The gel for the second dimension in denaturing conditions has higher agarose
concentration, but the voltage during electrophoresis should be reduced in comparison to the
neutral one. This is due to the higher conductivity of AEB than TBE buffer, what can cause heating
and distortion of the gel. Also ethidium bromide is omitted since it does not work in high pH
conditions. Therefore to visualize the obtained results southern blotting is usually performed and
DNA fragments, after transfer to a nylon membrane are hybridized with radiolabeled probes. As in
neutral/neutral 2-D electrophoresis, the shape of the curve, formed by separating nucleic acid
fragments, brings the information about the replication intermediate features. Denaturing conditions
cause four single stranded DNA fragments to arise from every fragment containing replication forks.
The migrating parental strands form the horizontal line and nascent strands form an arc. Depending
on the length of nascent strands the arc has a characteristic shape (Fig. 22).
Fig. 22. Structure of replicating molecules and the
shape of the nascent strand arc. The restriction
fragments containing the origin region in different
positions or the intact circular molecule separating
in 2D polyacrylamide gel in neutral/denaturing
conditions (based on Nawotka and Huberman,
modified).
Since these two techniques, neutral/neutral and neutral/alkaline two-dimensional
electrophoresis, deliver information that complement one another it is recommended to perform
both experiments. Such a strategy can result in a complete picture of the replicating molecule.
A
B
C
D
SIMPLE Y
BUBBLE
DOUBLE Y
BUBBLE
Y
1kb
2kb
1kb
2kb
1kb
2kb
1kb
2kb
FIRST
S
E
CO
ND
A
B
C
D
SIMPLE Y
BUBBLE
DOUBLE Y
BUBBLE
Y
A
B
C
D
SIMPLE Y
BUBBLE
DOUBLE Y
BUBBLE
Y
1kb
2kb
1kb
2kb
1kb
2kb
1kb
2kb
1kb
2kb
1kb
2kb
1kb
2kb
1kb
2kb
1kb
2kb
1kb
2kb
1kb
2kb
1kb
2kb
1kb
2kb
1kb
2kb
1kb
2kb
1kb
2kb
1kb
2kb
1kb
2kb
FIRST
S
E
CO
ND

Molecular biology of nucleic acid - experimental methodology
51
by Katarzyna Węgrzyn & Igor Konieczny
Two-dimensional Gene Expression Fingerprinting (2-D GEF)
There are a lot of different methods applied to gene expression analysis. One of them is gene
expression fingerprinting (GEF), in which non-overlapping sets of 3’-terminal cDNA restriction
fragments are separated on a polyacrylamide gel. The further digestion of the obtained separation
fragments and electrophoresis in the second dimension improves the resolution of the initial
method. It can be used in preliminary gene profiling of a genome project or in searching for novel
expressed sequences.
A
BRIDGED PROCEDURE OF
2-D
GEF
1. RNA isolation
2. cDNA synthesis with biotinylated primer
3. Synthesis of second strand of cDNA by E. coli polymerase I
4. Primary restriction digestion
5. Isolation of DNA fragments via biotin and adaptor ligation (contains a sequence recognized by the primer)
6. PCR reaction
7. First dimensional polyacrylamide gel electrophoresis
8. Elution of separated DNA fragments and their amplification
9. Second restriction digestion
10. Second dimensional electrophoresis and data analysis
The major difficulty that makes this method time- and labor-consuming is restriction digestion
of every isolated DNA fragment (see point 7 and 8 of the procedure) and its further separation and
analysis. Fortunately, the progressive automation of experimental procedures increase the possibility
of improving this method in the future and make it easier to perform.
Two-dimensional gel shift assay
The canonical gel shift assay (see Chapter 3) allows to analyze the nucleic acid fragment in
context of its binding by the protein. It is a simple technique where a particular, small region is
suspected to be bound and going to be analyzed. Unfortunately, if the precise site recognized by
the protein is unknown and is localized within the large nucleic acid fragment it can be difficult to
identify the protein binding site by GMSA. In such a situation, the division of large fragment into
smaller ones and verification each of them separately would be required. These kinds of limitations
can be omitted when two-dimensional gel electrophoresis is utilized. It can be performed with, for
instance entire plasmid DNA, that should be digested to obtain short fragments and labeled in the
next step by incorporation of modified nucleotides (
32
P-dNTP; Cy3-dNTP). Then the mixture of nucleic
acid fragments is incubated with the protein of interest and separated on a polyacrylamide gel
(6-7,5%) in 1×TBE buffer. Next the gel should be heated (75°C) to allow disruption of nucleoprotein
complexes and a high temperature (60°C) should be kept during the entire electrophoresis in the
second dimension. 2-DGE is performed in the same gel but rotated 90°. After electrophoresis,
visualization of the results should be performed. If any restriction fragments are bound by
the protein, they run ahead of the diagonal in the second dimension (Fig. 23). Therefore it is easy to
indicate the region of DNA molecule forming a nucleoprotein complex, isolate it and subject to
further investigation.
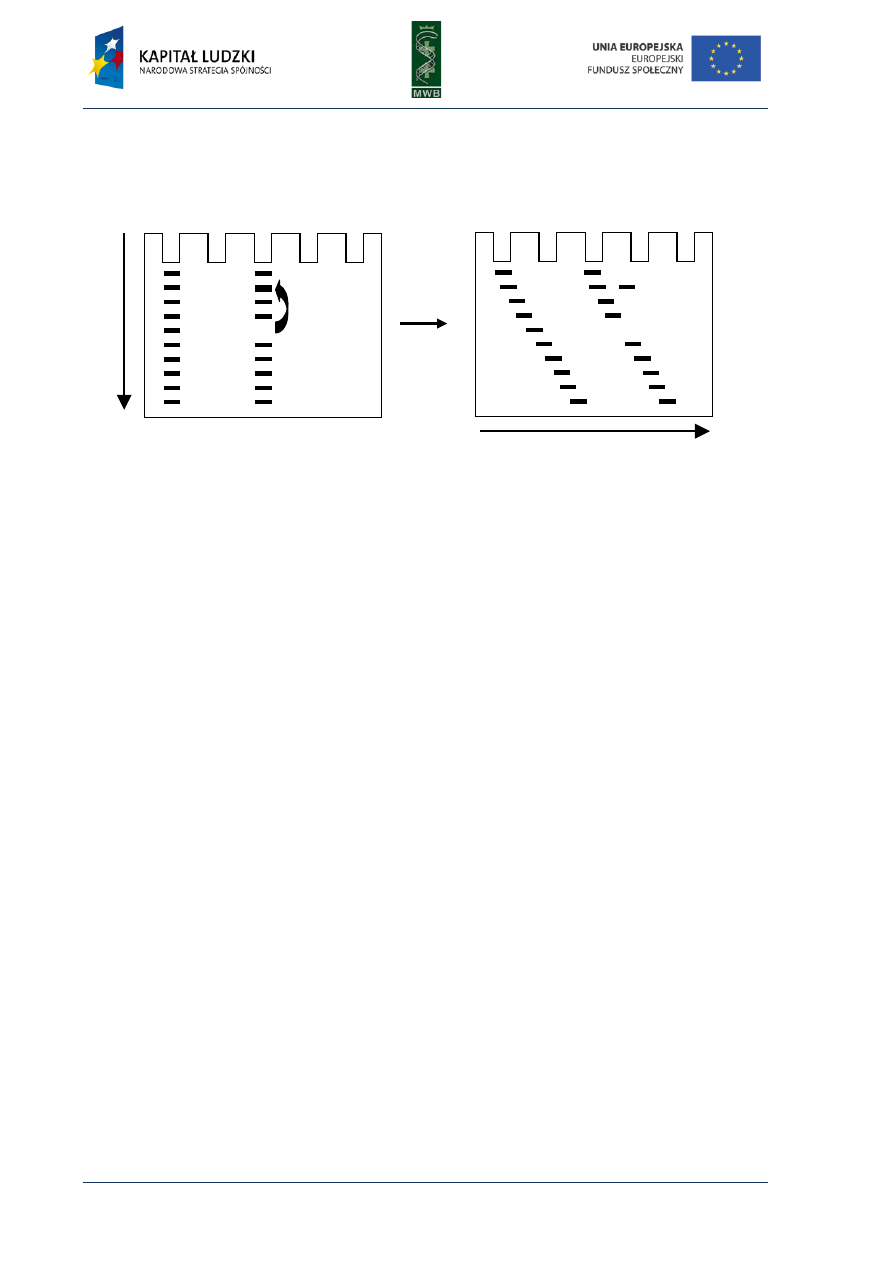
52
Molecular biology of nucleic acid - experimental methodology
by Katarzyna Węgrzyn & Igor Konieczny
Fig. 23. Two-dimensional electrophoresis of gel shift assay. (A) The scheme of the gel performed in first
dimension. The arrow indicates the shift of the band representing the nucleoprotein complex. (B) Scheme of
the same gel resolved in the second dimension in higher temperature allowing a disruption of the complex. The
DNA fragment released from the complex migrates ahead of the diagonal in the second dimension. (based on
Boffini and Prentki, modified).
T
ROUBLESHOOTING
1. If the 2D pattern is distorted
− fresh, degassed reagents for gel preparation should be used
− prolong the gel polymerization time
2. If horizontal streaking or incompletely focused spots are observed:
− check the salt concentration and reduce it when required
− check the amount of loaded sample and reduce it when required
3. If no bands are visible after electrophoresis :
− the amount of used nucleic acid should be verified and adjusted to detection level
− the labeling reaction should be controlled and probably repeated
− the nuclease inhibitors could be added to prevent nucleic acid degradation
L
ITERATURE
Boffini A. and Prentki P, 1991, Identification of protein binding sites in genomic DNA by two-dimensional gel
electrophoresis, Nucleic Acids Research 19(7): 1369-1374.
Brewer B.J. and Fangman W.L, 1987, The Localization of Replication Origins on ARS Plasmids in S. cerevisiae,
Cell 51: 463-471.
Cobuzzi R. J, Burhans W. C, Berman T.A, 1996, Inhibition of Initiation of Simian Virus 40 DNA Replication in
Infected BSC-1 Cells by the DNA Alkylating Drug Adozelesin. J Biol Chem 271(33): 19852-19859.
Nawotka K.A.and Huberman J.A, 1988, Two-Dimensional Gel Electrophoretic Method for Mapping DNA
Replicons, Mol Cell Biol 8(4): 1408-1413.
Shmelkov S.V, Visser J.W.M, Belyavsky A.V, 2001, Two-Dimensional Gene Expression Fingerprinting, Analytical
Biochemistry 290, 26-35.
Stein M. and Varricchio F, 1974, Separation of t-RNAs by two-dimensional polyacrylamide gel electrophoresis,
Analytical Biochemistry 61(1): 112-119.
Vertical gel
Horizontal gel
DNA
DNA
protein
DNA
DNA
protein
A
B

Molecular biology of nucleic acid - experimental methodology
53
by Katarzyna Węgrzyn & Igor Konieczny
Q
UESTIONS
:
1. What techniques would you propose for the obtained results visualized after 2D gel analysis?
2. List the possible applications of 2D electrophoresis of nucleic acids.
3. The figure below presents a gel after 2D electrophoresis of DNA fragment. How can you interpret
the obtained result?

54
Molecular biology of nucleic acid - experimental methodology
by Katarzyna Węgrzyn & Igor Konieczny
CHAPTER 9. Methods for origin region determination
The replication process starts in a specific region called origin. It contains sites for initiator
protein binding and an AT-rich region, where the local melting of dsDNA occurs. In different DNA
molecules there can be one (Prokaryotes, Archea), two (Archea) or multiple (Archea, Eukaryotes)
origins indicated. Techniques used for the origin determination can be divided into in silico, in vivo
and in vitro methods.
In silico methods
The relative nucleotides skews
The simplest in silico method used to determine the position of a replication origin in
the bacterial chromosomes takes advantage of the asymmetry in nucleotide composition between
the leading and lagging strands of the DNA. This differences in the GC and the AT content are usually
presented as relative nucleotide skews (e.g. CG skew = (C-G)/(C+G)) and result from different
mutation rates connected with the architectural asymmetry at the replication forks and the higher
accuracy of the leading strand replication. The relative skew value is a normalized difference in the
content of the complementary nucleotides, which changes the sign crossing of a replication origin.
It can be illustrated graphically with the chromosome walking technique, in which consecutive
nucleotides are analyzed and depending on their character the curve is drawn. For example, G results
in a movement about one unit to the top on the graph, whereas C results in a movement down and A
or T - one unit forward. Such a procedure results in obtaining a diagram of differences between G
and C content (Fig. 24).
The relative nucleotide skews is used in many software tools designed for origin prediction, for
example in the Oriloc, CG-software, Z-curve and Ori-Finder programs. However, the analysis of
chromosome asymmetry gives only the approximate origin position within the analyzed genome’s
sequence, simply indicating the region with higher than average AT content.
Fig. 24. A graphic analysis of chromosome
asymmetry reveled with the chromosome
walking method. A curve shows the
dependence between the nucleotide
position within the chromosome and an
asymmetry (the difference in content of G
and C residues). The extremes on the curve
correspond to origin and termination
regions in the chromosome and sites
where leading strand change into lagging
one.
ter
position in the chromosome
(nucleotide)
as
y
m
m
et
ry
(
G
-C)
leading
strand
leading
strand
lagging
strand
ori

Molecular biology of nucleic acid - experimental methodology
55
by Katarzyna Węgrzyn & Igor Konieczny
Localization of genes for the replication initiation protein and its binding sites
The determination of genes for initiator proteins can be used for origin region prediction.
It was shown that the gene for bacterial replication initiator protein DnaA is found in almost all
bacterial chromosomes and the origin for replication is usually located upstream or downstream of
this gene. The same situation was observed for Archea, which possesses genes for replication
initiation proteins Orc1/Cdc6 close to the origin region. Unfortunately this method does not applied
to eukaryotes, while the origins for DNA replication are found throughout the genomes (for example
in yeasts there are over 500 origins in a genome) and the genes for initiator proteins cannot be
present in proximity of all of them.
The more universal feature for origin region prediction can be the presence of replication
initiation protein binding sites. The region where the initiator form a nucleoprotein complex usually
is contained within the origin of both prokaryotes and eukaryotes. The binding sites for bacterial
initiator DnaA, archeal Cdc3 and MCM proteins and origin recognition complex (ORC) in eukaryotes,
were all found near the site where the replication bubble is formed and replication starts.
In vivo methods
Construction of minichromosomes
This is the most popular method for in vivo origin region determination. It is based on
the construction of minichromosomes - vectors containing particular regions of a chromosome.
The chromosome is digested with restriction enzymes to obtain DNA fragments that can be cloned
into the vector, which does not contain any origin region. If the inserted chromosome fragment can
support replication of the plasmid in bacterial cells this could indicate that the insertion contains
a replication origin. Unfortunately, this method is time consuming since a genomic library needs to
be constructed and then it should be tested in the bacterial cells. It also only narrows down the
region where the origin can be found but does not indicate precisely the origin site.
Chromatin immunoprecipitation assay (ChIP)
Another method that can help to determine an origin region in vivo, is the chromatin
immunoprecipitation assay. Via the immunoprecipitation of replication proteins, that bind specific
sequences within an origin, the whole region can be estimated. For details see Chapter 6.
In vitro methods
The in vitro confirmation of the site where the replication starts can be achieved with such
techniques as:
− two-dimensional gel electrophoresis (for details, see Chapter 8)
− electron microscopy (for details, see Chapter 7)
− GMSA assay (for details, see Chapter 3)
− footprinting analysis (for details, see Chapter 4)
− Surface Plasmon Resonance (for details, see Chapter 5)
These methods allow to observe replication intermediates, determine the specific motifs
within an origin where replication proteins bind or even calculate the stoichiometry and kinetics of
a nucleoprotein complex formation.

56
Molecular biology of nucleic acid - experimental methodology
by Katarzyna Węgrzyn & Igor Konieczny
Frank A. C, Lobry J. R, 2000, Oriloc: prediction of replication boundaries in unannotated bacterial
chromosomes. Bioinformatics 16: 560-561.
L
ITERATURE
:
Freeman J.M, Plasterer T.N, Smith T.F, Mohr S.C, 1998, Patterns of genome organization in bacteria. Science
279: 1827.
Grigoriev A, 1998, Analyzing genomes with cumulative skew diagrams. Nucleic Acids Res 26: 2286-2290.
Lobry J.R, 1996a, Asymmetric substitution patterns in the two DNA strands of bacteria. Mol Biol Evol 13: 660-
665.
Lobry J.R, 1996b, A simple vectorial representation of DNA sequences for the detection of replication origins in
bacteria. Biochimie 78: 323-326.
Mackiewicz P, Zakrzewska-Czerwinska J, Zawilak A, Dudek M.R, Cebrat S, 2004, Where does bacterial
replication start? Rules for predicting the oriC region. Nucleic Acids Res 32: 3781-3791.
Meijer M, Beck E, Hansen F.G, Bergmans H.E, Messer W, von Meyenburg K, Schaller H, 1979 Nucleotide
sequence of the origin of replication of the Escherichia coli K-12 chromosome. Proc Natl Acad Sci USA 76:
580-584.
Messer W, 2002, The bacterial replication initiator DnaA. DnaA and oriC, the bacterial mode to initiate DNA
replication. FEMS Microbiol Rev 26: 355-374.
Messer W, Meijer M, Bergmans H.E, Hansen F.G, von.Meyenburg K, Beck E, Schaller H, 1979, Origin of
replication, oriC, of the Escherichia coli K12 chromosome: nucleotide sequence. Cold Spring Harb Symp
Quant Biol 43(Pt 1): 139-145.
Mrazek J, Karlin S, 1998, Strand compositional asymmetry in bacterial and large viral genomes. Proc Natl Acad
Sci USA 95: 3720-3725.
Oka A, Sugimoto K, Takanami M, Hirota Y, 1980, Replication origin of the Escherichia coli K-12 chromosome:
the size and structure of the minimum DNA segment carrying the information for autonomous replication.
Mol Gen Genet 178: 9-20.
Roten C.A, Gamba P, Barblan J.L, Karamata D, 2002, Comparative Genometrics (CG): a database dedicated to
biometric comparisons of whole genomes. Nucleic Acids Res 30: 142-144.
Salzberg S.L, Salzberg A.J, Kerlavage A.R, Tomb J.F, 1998, Skewed oligomers and origins of replication. Gene
217: 57-67.
Tillier E.R, Collins R.A, 2000, The contributions of replication orientation, gene direction, and signal sequences
to base-composition asymmetries in bacterial genomes. J Mol Evol
Zhang R, Zhang C.T, 2005, Identification of replication origins in archaeal genomes based on the Z-curve
method. Archaea 1: 335-346
50: 249-257.
Q
UESTIONS
1. How can in vitro methods help determine origin region?
2. How can relative nucleotide skews be illustrated graphically?
3. The presence of which elements of bacterial chromosome indicate the origin region?

Molecular biology of nucleic acid - experimental methodology
57
by Katarzyna Węgrzyn & Igor Konieczny
CHAPTER 10. Methods for in vitro analysis of replication initiation
Replication is one of the most important processes within the living cell. It ensures
the duplication of genetic material that is propagated to the daughter cells. Its initiation requires
the subsequent formation of nucleoprotein complexes within the origin region of a DNA molecule.
That results in the melting of a double-stranded DNA (dsDNA) in an AT-rich region (“opening”),
unwinding of the dsDNA by a helicase and subsequent loading of polymerase subunits synthesizing
new DNA strands.
Opening
The very first effect of the initiator proteins’ binding to the sequences within the origin is
the melting of dsDNA and formation of a replication bubble. This process is commonly named
“opening”. It depends on replication initiation proteins (Rep), that via DNA binding cause changes of
the DNA conformation leading to occurrence of ssDNA in an AT-rich region. It is also dependent on
the sequence of the AT-rich region and on its location within the origin. Even small changes in
the organization of the origin (the insertion of 6 bp between the AT-rich region and the sequences of
iterons completely inactivated the origin of the RK2 plasmid) or point mutation in the AT-rich region
result in opening inhibition. Formation of the replication bubble can be directly observed with
electron microscopy (see Chapter 7) or can be verified in vitro, by the potassium permanganate
probing assay.
Potassium permanganate probing assay
The potassium permanganate assay is a type of footprinting method (see Chapter 4). However,
compared with the classic one, where nucleases are used, an oxidizing agent (KMnO
4
) is needed in
this technique. It modifies thymine residues in the single-stranded DNA and its concentration is
adjusted to obtain just one modification per molecule. This reagent does not modify the residues in
a double-stranded nucleic acid, so its action is limited to the replication bubble. Probing with KMnO
4
is followed by primer extension reaction with the use of a labeled primer (see Chapter 4). During this
reaction, the polymerase stalls at the modified thymine residues on the template, what results in
a range of products of different length. Based on the length of the products it can be estimated
where the local melting of the double-stranded molecule and formation of a single-stranded region
occurs.
In this experiment the DNA template is usually a coiled-coil form of a plasmid DNA, containing
the origin. Its incubation with initiator proteins enables open complex formation. Then the probing
reaction is performed.
A
BRIDGED PROCEDURE
1. Incubation of a DNA template with initiator proteins.
2. KMnO
4
probing.
3. DNA purification.
4. Labeled primer extension reaction.
5. Electrophoresis.
6. Visualization of the results (depends on the type of labeling).

58
Molecular biology of nucleic acid - experimental methodology
by Katarzyna Węgrzyn & Igor Konieczny
Helicase assay (FI*)
When the replication bubble is formed, the next step is the recruitment of a helicase (DnaB in
E. coli) by the initiator proteins. Helicase is loaded onto the open complex and next it unwinds the
dsDNA in the 5’ to 3’-end direction. The in vitro helicase assay is performed with a coiled-coil plasmid
DNA, in the presence of the helicase and the initiator proteins. The unwinding reaction is assisted
with other E. coli proteins: HU, gyrase, helicase loader DnaC and SSB. The helicase activity also
requires the presence of the ATP and an ATP regeneration system (creatine kinase and creatine
phosphate). The expansion of the ssDNA region changes the electrophoretic migration of a DNA
molecule in an agarose gel. Such a molecule, marked “FI*”, migrates faster when compared with
a coiled-coil form of the plasmid DNA (“FI”) (Fig. 25). The presence of the FI* band indicates the
activity of all required proteins and especially the helicase.
A
BRIDGED PROCEDURE
1. Incubation of the DNA template with proteins: initiator proteins (DnaA and optionally plasmid initiator),
helicase (DnaB), helicase loader (DnaC), gyrase, HU, SSB.
2. Inhibition of the helicase reaction (incubation at 65°C with EDTA and SDS solutions).
3. Agarose electrophoresis for 20h, 25 V (1% gel in a TBE buffer; it is important to not add EtBr to the gel since
it can disturb the migration pattern).
Fig. 25. Helicase assay (FI*). The scheme presents the result
of the helicase assay, in which the reaction mixture
containing a constant amount of plasmid DNA, initiator
protein and additional proteins (HU, SSB, gyrase) is titrated
with helicase. The more helicase is added to the reaction
mixture the more FI* form of plasmid DNA is visible after the
electrophoresis in the agarose gel.
In vitro replication (FII)
The replication process is conducted by a polymerase and accessory proteins. It starts within
the origin, where the replication bubble has been formed. First, a primase is loaded onto the DNA
since the DNA polymerase cannot start the synthesis without a free –OH group at the 3’-end. Then
the clamp-loading complex (ɣ complex) loads the sliding clamp (β clamp) onto the primer-template
strand. The final step is the loading of a polymerase core, which is a heterotrimer containing
the α (DNA polymerase), ε (proofreading exonuclease) and θ (stabilizes ε) subunits. The formation of
the polymerase complex is ATP-dependent, since this compound increases the affinity of the clamp-
loader for β subunits and for DNA. The hydrolysis of the ATP is triggered when ɣ complex-β clamp-
ATP binds the DNA. Then the DNA is released by the ɣ complex.
The in vitro replication assay can be performed in a crude cell extract, containing all necessary
proteins and compounds or in a reconstructed system utilizing all purified proteins. Both methods
are based on counting of radioactivity of nucleotides labeled with
3
H, incorporated during the DNA
synthesis. The experiment is performed very often on a plasmid template containing the region of
an origin of interest. The DNA template that is used in in vitro replication assays can also be sperm
nuclei and ssDNA replicon. The reaction mixture contains the template added to the crude cell
FIII
FII
FI
FI*
─
helicase

Molecular biology of nucleic acid - experimental methodology
59
by Katarzyna Węgrzyn & Igor Konieczny
initiator protein (ng)
D
N
A
syn
thesi
s
(c
pm
)
A
B
extract or to the mixture of purified polymerase subunits, initiator protein, primase and other
required components. The crude cell extracts can be prepared from bacterial or eukaryotic cells
(e.g. Sacharomyces cerevisae, Xenopus oocytes, HeLa). After the incubation, during which
the replication initiation and the DNA synthesis occur, the reaction is stopped and the radioactivity is
counted in a scintillation counter. The results are referred to the base readout where no DNA
template or no initiator protein was added. The obtained values are usually presented as a diagram
(Fig. 26).
Fig. 26. Dependence of in vitro plasmid replication on initiator
protein. The diagram shows the kinetics of in vitro incorporation
of [H
3
]dTTP depending on the amount of initiator protein added
to the reaction mixture. The replication reaction was performed
in a cellular extract containing all necessary proteins except the
initiator protein. (A) The reaction mixtures contained equal
amounts of cellular extract, DNA template, and increasing
amounts of initiator protein. (B) Control reaction without DNA
template.
A
BRIDGED PROCEDURE
1. Incubation of the DNA template with purified proteins/crude cell extract.
2. Stopping the reaction with a 100 mM pyrophosphate (PiroP) and a 10% trichloroacetic acid (TCA)
solution.
3. Counting the radioactivity in a scintillation counter.
L
ITERATURE
Abhyankar M.M, Zzaman S, Bastia D, 2003, Reconstitution of R6K DNA Replication in Vitro Using 22 Purified
Proteins, J Biol Chem 278(46): 45476-84
Doran K.S, Konieczny I, Helinski D.R, 1998. Replication origin of the broad host range plasmid RK2. Positioning
of various motifs is critical for initiation of replication. J Biol Chem 273: 8447-8453.
Kaittell B. L, Helinski D. R, 1991, Iteron inhibition of plasmid RK2 replication in vitro: evidence for intermolecular
coupling of replication origins as a mechanism for RK2 replication control. Proc Natl Acad Sci USA, 88(4):
1389-93.
Konieczny I, Helinski D.R, 1997, Helicase delivery and activation by DnaA and TrfA proteins during the initiation
of replication of the broad host range plasmid RK2. J Biol Chem 272(52): 33312-33318.
Mukhopadhyay G, Carr K.M, Kaguni J.M, Chattoraj D.K, 1993 Open-complex formation by the host initiator,
DnaA, at the origin of P1 plasmid replication. EMBO J 12(12): 4547-4554.
Rajewska M, Kowalczyk L, Konopa G. & Konieczny I, 2008 Specific mutations within the AT-rich region of
a plasmid replication origin affect either origin opening or helicase loading. Proc Natl Acad Sci USA 105:
11134-11139.

60
Molecular biology of nucleic acid - experimental methodology
by Katarzyna Węgrzyn & Igor Konieczny
Q
UESTIONS
1. The figure shows the result of the potassium permanganate assay. How would you interpret the obtained
results?
2. How would you verify the replication initiator protein activity?
3. What are the components of the in vitro replication reaction?
KMnO
4
Initiator protein
-
+ +
-
-
+
KMnO
4
Initiator protein
-
+ +
-
-
+
KMnO
4
Initiator protein
-
+ +
-
-
+
Document Outline
- Introduction
- CHAPTER 1. Polymerase chain reaction (PCR)
- CHAPTER 2. DNA sequencing
- CHAPTER 3. Gel Mobility Shift Assay
- CHAPTER 4. Footprinting
- CHAPTER 5. Surface Plasmon Resonance (SPR)
- /
- CHAPTER 6. Chromatin immunoprecipitation assay (ChIP)
- CHAPTER 7. Microscopy
- CHAPTER 8. Two dimensional electrophoresis of nucleic acids
- CHAPTER 9. Methods for origin region determination
- CHAPTER 10. Methods for in vitro analysis of replication initiation
Wyszukiwarka
Podobne podstrony:
Exploring Careers of Biochemistry and Molecular Biology
Molecular evolution of FOXP2, Nature
34 453 476 Creep of HSS Part I Experimental Investigations
Can Climate Shift the Biology of Ecosystems Printout TIME
Biology of plants
Molecular analysis of C glabrata
Potentiometric and NMR complexation studies of phenylboronic acid PBA
Comparison of theoretical and experimental free vibrations of high industrial chimney interacting
56 793 814 Thermal Fatique of a Tool Steel Experiment and Numerical Simulation
transpozycjaMolecular Biology of the?ll
Molecular structure of rubidium six
Molecular evolution of FOXP2, Nature
34 453 476 Creep of HSS Part I Experimental Investigations
Detection and Molecular Characterization of 9000 Year Old Mycobacterium tuberculosis from a Neolithi
The biology of digital organisms
1 1 William Blake Songs of Innocence and Experience (Selected poems)
Comparison of theoretical and experimental free vibrations of high industrial chimney interacting
więcej podobnych podstron