
Information Systems Research
Articles in Advance, pp. 1–21
issn 1047-7047 eissn 1526-5536
http://dx.doi.org/10.1287/isre.1110.0388
© 2011 INFORMS
The Effects of Social Network Structure on Enterprise
Systems Success: A Longitudinal Multilevel Analysis
Sharath Sasidharan
School of Business, Emporia State University, Emporia, Kansas 66801, ssasidha@emporia.edu
Radhika Santhanam, Daniel J. Brass
Gatton College of Business and Economics, University of Kentucky, Lexington, Kentucky 40506
{santhan@uky.edu, dbrass@uky.edu}
Vallabh Sambamurthy
Eli Broad College of Business, Michigan State University, East Lansing, Michigan 48824, sambamurthy@bus.msu.edu
T
he implementation of enterprise systems has yielded mixed and unpredictable outcomes in organizations.
Although the focus of prior research has been on training and individual self-efficacy as important enablers,
we examine the roles that the social network structures of employees, and the organizational units where they
work, play in influencing the postimplementation success. Data were gathered across several units within a
large organization: immediately after the implementation, six months after the implementation, and one year
after the implementation. Social network analysis was used to understand the effects of network structures,
and hierarchical linear modeling was used to capture the multilevel effects at unit and individual levels. At the
unit level of analysis, we found that centralized structures inhibit implementation success. At the individual
level of analysis, employees with high in-degree and betweenness centrality reported high task impact and
information quality. We also found a cross-level effect such that central employees in centralized units reported
implementation success. This suggests that individual-level success can occur even within a unit structure that is
detrimental to unit-level success. Our research has significant implications for the implementation of enterprise
systems in large organizations.
Key words: enterprise systems; postimplementation; information exchange; learning; social networks
History: Joey George, Senior Editor. Published online in Articles in Advance.
Introduction
Enterprise systems are software packages that inte-
grate business processes across functional activi-
ties in firms. Despite the widespread adoption and
numerous years of organizational experience, the
successful implementation remains a complex and
challenging process (Cotteleer and Bendoly 2006,
Jacobs and Bendoly 2003, Reilly 2007, Swanson 1994).
Reports have chronicled failures and difficulties at
well-known corporations, such as FoxMeyer, Hershey
Foods, Hewlett Packard, Boeing, and Siemens (Robey
et al. 2002, Ross and Vitale 2000, Wang et al. 2006)
and at large educational institutions (Brown and
Vessey 2003, Gattiker and Goodhue 2005). Organiza-
tions encounter great difficulty in assimilating and
motivating employees to use the large-scale informa-
tion systems in intended ways and at the desired level
of usage (Fichman and Kemerer 1999, Jasperson et al.
2005, Purvis et al. 2001). In a survey of 232 respon-
dents from multiple industries, a majority of the
respondents noted that most of the significant prob-
lems occurred during the postimplementation phase,
particularly in motivating employees and ensuring
that users had assimilated the systems into their work
(Robbins-Gioia 2002).
The prevailing theories argue that knowledge bar-
riers inhibit users’ attempts to understand the tech-
nology, the value of the specific features, and how
it should be used for their work (Amoako-Gyampah
and Salam 2004, Barker and Frolic 2003, Nah et al.
2001). Although firms provide training to help users
obtain knowledge about the system, often ignored is
the on-the-job, situated learning process of exploring
and sharing information in the context of actual work
(Robey et al. 2002). Users interact with each other,
share their knowledge about the system, and collab-
oratively learn about use of the system in a trial-
and-error, improvised learning process (DeSanctis
and Poole 1994, Griffith 1998, Jasperson et al. 2005,
Orlikowski 1996). In an enterprise system implemen-
tation, “users frequently relied on each other for assis-
tance. If a user within a department discovered how
to perform a particularly useful task, peers were
quickly updated about the tip” (Boudreau and Robey
2005, p. 12). Thus, interactions among users, as they
share information with their peers and collaboratively
1
Cop
yright:
INFORMS
holds
cop
yr
ight
to
this
Ar
ticles
in
Adv
ance
version,
which
is
made
av
ailab
le
to
subscr
ibers
.
The
file
ma
y
not
be
posted
on
an
y
other
w
ebsite
,
including
the
author’
s
site
.
Please
send
an
y
questions
regarding
this
policy
to
per
missions@inf
or
ms
.org.
Published online ahead of print November 3, 2011

Sasidharan et al.:
The Effects of Social Network Structure on Enterprise Systems Success
2
Information Systems Research, Articles in Advance, pp. 1–21, © 2011 INFORMS
explore the use of the enterprise system for their
tasks, might greatly affect its assimilation and use
(Brown and Duguid 1991, Cook and Brown 1999,
Edmondson et al. 2001, Kang and Santhanam 2003,
Lave and Wenger 1991, Pawlowski and Robey 2004,
Santhanam et al. 2007, Sharma and Yetton 2007).
Therefore, there is a growing interest in examin-
ing how the social networks and social capital of
individuals and groups affect their sharing of knowl-
edge and their ability to use the new technology
(Boudreau and Robey 2005, Sykes et al. 2009). When
contrasted with human capital (skills, abilities, self-
efficacy, etc.), social capital refers to “the sum of
the actual and potential resources embedded within,
available through, and derived from the network of
relationships possessed by an individual or social
unit” (Nahapiet and Ghoshal 1998, p. 243). Individ-
uals are embedded in networks of relationships that
affect their ability to disseminate and share complex
knowledge in solving nonroutine problems neces-
sary for the effective implementation of an enterprise
system.
Even as individuals utilize their social networks to
solve problems with the new technology and adapt
it for their tasks, their improvised learning actions
are potentially enabled and constrained by the social
structures prevailing in their organizational units.
As Ibarra et al. (2005) note, while a large stream
of research has examined the effects of individu-
als’ social networks, it neglects the effects of the
broader unit structures within which such individuals
are located. Indeed, enterprise systems are imple-
mented to impact both individual-level and unit-
level performance in firms. Researchers suggest that
the study of unit-level success is as important as
individual-level success, but investigations of unit-
level success tend to be neglected in IS research
(DeLone and McLean 1992, Gattiker and Goodhue
2005). Although individual-level implementation is
important, it makes little difference if the organiza-
tional units are functioning poorly. Building on this
suggestion, we contribute to the theory on social net-
works and social capital by suggesting that group-
level social capital will affect individual as well
as group-level success. We include both individual-
and unit-level success in our analyses and exam-
ine cross-level effects between individual employees’
network characteristics and the unit network struc-
ture in which these employees are embedded. We
also consider the possibility that individual-level net-
works might interact with unit-level networks to pro-
duce different levels of success. For example, network
structures that enhance individual success could ham-
per unit success, and vice versa. Our theory is based
on the assumption that employees benefit from social
interactions and knowledge sharing (social capital)
above and beyond any individual training or self-
efficacy (human capital). It is the exchange of knowl-
edge that overcomes the barriers to implementation
success. Thus, social networks can provide the struc-
tures of information sharing and collaboration for
improvised learning by users in the context of the
implementation and use of enterprise systems.
Our research examines the following questions:
How does the position of an individual in the social
network of knowledge exchange affect the value and
usefulness of the system to the individual? How
does the pattern of information exchange in a unit
contribute to both the individuals’ and units’ sys-
tem implementation success? Do unit social networks
combine with individual social networks to affect
enterprise system implementation? We gathered data
at three points over a year in the context of an enter-
prise system implementation at a large, multi-unit
organization. We utilize the longitudinal data and
multilevel analyses to test our hypotheses. The next
section of the paper presents our theoretical argu-
ments and research hypotheses. Then we describe our
research method and present our results. Finally, the
paper concludes with a discussion of the implications
for future research and practice.
Theoretical Foundations and
Research Hypotheses
Enterprise systems are software packages that auto-
mate and integrate business processes and support
cross-functional activities across users in organiza-
tions (Mabert et al. 2000). They provide not only cross-
functional transaction automation but also integrated
and coordinated data and information to support
decision makers dispersed across the organization.
Enterprise systems implementations are usually man-
dated, and employees have little choice, particularly
about the use of a base set of the mandated features
(Jasperson et al. 2005). However, there is tremendous
variety even in the use of a mandated system, espe-
cially with respect to the nonmandated features in the
system (Bhattacherjee 2001, Hsieh and Wang 2007).
As Barley’s research (1986, 1990) aptly demonstrates,
the effort invested by employees in understanding
and fully exploiting the capabilities of technologies is
largely discretionary. Most enterprise systems present
a rich array of features that impose considerable inter-
pretive flexibility and challenge individual users to
learn which features might be appropriate for their
tasks and how those features should best be used
(DeSanctis and Poole 1994, Fulk 1993, Jasperson et al.
2005, Orlikowski 1996). The sheer complexity and
malleability of enterprise systems means that some
users are likely to use a few features, whereas oth-
ers might, over a period of time, opt to apply addi-
tional features for completing their tasks (Boudreau
Cop
yright:
INFORMS
holds
cop
yr
ight
to
this
Ar
ticles
in
Adv
ance
version,
which
is
made
av
ailab
le
to
subscr
ibers
.
The
file
ma
y
not
be
posted
on
an
y
other
w
ebsite
,
including
the
author’
s
site
.
Please
send
an
y
questions
regarding
this
policy
to
per
missions@inf
or
ms
.org.

Sasidharan et al.:
The Effects of Social Network Structure on Enterprise Systems Success
Information Systems Research, Articles in Advance, pp. 1–21, © 2011 INFORMS
3
and Seligman 2005, Hsieh and Wang 2007, Robey
et al. 2002).
Organizations provide training to users to help
them learn the procedural features of the new technol-
ogy. However, the training programs typically do not
provide a business process orientation and the inte-
grative knowledge that can help users assimilate and
adapt the system to their particular work (Gallivan
et al. 2005, Kang and Santhanam 2003, Robey et al.
2002, Sharma and Yetton 2007). Users experience dif-
ficulties in understanding how the specific features
fit the demands of their tasks, how their tasks and
the technology could be mutually adapted for better
fit, and how the different features of the technology
could be combined in order to be useful to their tasks
(Purvis et al. 2001). Hence, the postimplementation
period of enterprise system implementation consists
of extensive interactions and exchange of informa-
tion among employees as they learn to modify and
adapt the system to the needs of their organizational
tasks (Jasperson et al. 2005; Orlikowski 1996, 2000;
Pawlowski and Robey 2004; Robey et al. 2002; Sykes
et al. 2009).
We propose that the sharing of information will be
dependent on the relationships among users. Hence,
the social networks of employees will influence their
ability to engage in improvised learning from their
peers and the extent to which they are able to success-
fully assimilate and implement the system. A social
network is a set of actors and a set of ties, with each
tie representing a relationship or absence of a rela-
tionship between the actors (Borgatti and Foster 2003,
Brass 1995). The actors and the corresponding set of
ties can be depicted in the form of a network dia-
gram, and the features of the network can be com-
puted at both the level of the network as a whole (i.e.,
the organizational unit) and the individual actor (i.e.,
employee). The focus is on the pattern of relation-
ships among actors. Social network analysis (SNA)
has been applied to understand many organizational
phenomena (see Brass et al. 2004, Kilduff and Brass
2010 for reviews), including the diffusion of medi-
cal innovations and success of technical innovations
(Barley 1990, Burkhardt 1994, Burkhardt and Brass
1990, Cross and Cummings 2004, Obstfeld 2005).
To capture data that reflect the extended use of
the system, we examined the effects of employees’
social networks at three times over a period of one
year. Enterprise systems often take considerable time
to become integrated with business processes because
the employee and the organization have to make
adjustments to translate new procedures into routine
business practices (Edmondson et al. 2001, Fichman
and Kemerer 1999, Orlikowski 1996, Ravichandran
2005). Initially, as employees learn the system and
try to integrate it into their work, they might face
significant knowledge barriers, and the system might
even be viewed as unsuccessful. However, once
employees have transitioned into a period of impro-
vised/situated learning and overcome knowledge
barriers, the system might be seen as being more
successful (Boudreau and Robey 2005). Thus, it is
important that we examine implementation success
over time.
Implementation Success
IS implementation success can be assessed on many
dimensions (DeLone and McLean 1992, 2003). With
complex and mandated systems such as an enter-
prise system, measures such as usage frequency might
not accurately reflect the implementation success
(Boudreau and Seligman 2005). Enterprise systems are
implemented to integrate data from various organi-
zational units and provide employees with a more
integrated view of the business information. Their
value can be judged by the extent to which employ-
ees understand how the information they see and
utilize relates not only to their work but also to
other employees’ tasks. The information helps them
develop a more holistic view of business processes
(Kang and Santhanam 2003, Gattiker and Goodhue
2005). Therefore, employees’ judgments about the
quality of information provided by the new enterprise
system are one way to gauge if the enterprise sys-
tem has provided the intended benefits (Sedera et al.
2004). Because it is one of the most salient measures
of enterprise-wide systems, we adopt perceived infor-
mation quality as our first dimension of implemen-
tation success (Au et al. 2008; DeLone and McLean
1992, 2003; Sedera et al. 2004). Information quality has
been found to increase user satisfaction and system
usage (Petter et al. 2008).
Enterprise systems are also implemented to reengi-
neer business processes. A new enterprise system
must help employees execute their tasks efficiently,
identify new ways of doing their tasks, and positively
impact their task performance. Thus, individual task
impact (DeLone and McLean 1992, 2003; Sedera et al.
2004) is our second dimension of implementation suc-
cess. If employees judge that the new enterprise sys-
tem has improved information quality, helped them
complete their tasks efficiently and identify new ways
of doing their tasks (i.e., task impact), the imple-
mentation of the enterprise system can be deemed
successful.
The Effects of Individual Social Network Struc-
tures.
Although training programs might help users
understand interdependencies among the tasks, many
training programs are restricted to teaching users
the basic procedural information needed to use
the system (Boudreau and Seligman 2005, Sharma
and Yetton 2007). Even the best training programs
Cop
yright:
INFORMS
holds
cop
yr
ight
to
this
Ar
ticles
in
Adv
ance
version,
which
is
made
av
ailab
le
to
subscr
ibers
.
The
file
ma
y
not
be
posted
on
an
y
other
w
ebsite
,
including
the
author’
s
site
.
Please
send
an
y
questions
regarding
this
policy
to
per
missions@inf
or
ms
.org.

Sasidharan et al.:
The Effects of Social Network Structure on Enterprise Systems Success
4
Information Systems Research, Articles in Advance, pp. 1–21, © 2011 INFORMS
have difficulty anticipating all the complexitities of
actual on-the-job use. Subsequent to receiving train-
ing, employees’ ability to comprehend the new infor-
mation system and its impact on their work might
be influenced by their information exchange with
other employees. In particular, we focus on the advice
network concerning the enterprise system and the
individual’s ego network, i.e., the network anchored
around the particular employee (Borgatti and Foster
2003, Brass 1995). The size of an ego network refers to
the number of direct connections an individual (ego)
has and is considered a measure of individual central-
ity (Freeman 1979). Central actors with many contacts
have greater access to and control over information
and thus acquire more social capital than peripheral
actors (Brass 1984, Ibarra and Andrews 1993). This
individual-level network measure is referred to as “in-
degree centrality,” and it provides an independent
measure of the size of an individual’s advice network
(Brass and Burkhardt 1993).
Network theory assumes that knowledge flows
through adjacent network links and that individu-
als with more ties and thus more central positions
have a greater chance of acquiring such knowledge
(Brass 1984, Freeman 1979, Ibarra and Andrews 1993).
Because the successful integration of an enterprise
system requires users to acquire knowledge and dis-
cuss features of the new system and the manner in
which it might be integrated into their work rou-
tines, a large ego network will provide an employee
with increased access to other employees’ knowledge,
appreciation of their tasks, and the ability to exchange
much-needed information (Brass 1984, 1995; Brass
and Burkhardt 1993; Ibarra and Andrews 1993). As
more people share information with the ego about
problems and solutions, the ego is exposed to a
broader variety of experiences and information, not
simply limited to the ego’s own particular problems.
As a result, the individual is more likely to have a
comprehensive, holistic perspective of the system and
understand the various ways by which the new sys-
tem provides integrated information for improving
task performance. Employees with large networks are
more likely to identify new ways of doing things,
keep abreast of different types of information that the
new enterprise system provides, and experiment with
new features of the system than are employee with
fewer connections. They are likely to realize the scope
of the system and how it provides the opportunities
to combine information to impact the task in innova-
tive ways. Therefore, we state our first hypotheses as
follows.
Hypothesis 1A (H1A). The in-degree-centrality of in-
dividual employees will be positively related to the per-
ceived information quality of the enterprise system.
Hypothesis 1B (H1B). The in-degree-centrality of in-
dividual employees will be positively related to the per-
ceived task impact of the enterprise system.
Alternatively, Burt (1992) has argued that the size
of one’s network is less important than the pattern
of one’s ties. In particular, Burt and others (see Brass
et al. 2004 for a review) have shown that social cap-
ital accrues to individuals who are connected to oth-
ers who are not themselves connected. The lack of
connection between two actors with whom one is
connected is referred to as a structural hole (Burt
1992). At the individual level of analysis, the social
capital advantages of structural holes translate into
power (Brass 1984), better performance (Mehra et al.
2001), promotions (Brass 1984, Burt 1992), career suc-
cess (Seibert et al. 2001), and creativity (Brass 1995,
Burt 2004). The advantage of relationships with dis-
connected others involves access to diverse, non-
redundant information. People who are connected
share information and connecting to others who are
themselves connected might simply provide redun-
dant information. Individuals with many structural
holes in their ego networks become the critical con-
necting link between other actors and a conduit for
smooth flow of information (Burt 1992). They tend
to have greater access to nonredundant information
flowing from different parts of the network, enabling
them to learn and adapt quickly to the changing
requirements brought about by the system. Accord-
ing to Burt (2004), employees with structural holes
are more likely to “connect the dots” and see the
synergies between diverse ideas. In addition, struc-
tural holes provide opportunities for an employee to
“match up” actors with problems and actors with
solutions by providing a bridge between the two.
Employees with structural holes in their advice net-
works are in a good position to develop innovative
uses of the system and reengineer business processes
(Burt 2004). Thus, as Burt (1992) argues, structural
holes are an important measure of an individual’s
social capital.
Betweenness centrality is often used as a measure of
structural holes (e.g., Mehra et al. 2001). It refers to the
extent to which an employee falls between any other
pair of employees, who are not themselves connected,
on the shortest path between those two employees.
People with high levels of betweenness centrality are
able to see other employees’ work perspectives and
are in a position to experiment and innovate. Peo-
ple with structural holes (high betweenness central-
ity) are more likely to generate new ideas (Burt 2004)
and understand the scope of the system, the dif-
ferent types of information it provides, and how it
impacts tasks. In our context, we propose that indi-
viduals with high betweenness centrality will benefit
Cop
yright:
INFORMS
holds
cop
yr
ight
to
this
Ar
ticles
in
Adv
ance
version,
which
is
made
av
ailab
le
to
subscr
ibers
.
The
file
ma
y
not
be
posted
on
an
y
other
w
ebsite
,
including
the
author’
s
site
.
Please
send
an
y
questions
regarding
this
policy
to
per
missions@inf
or
ms
.org.

Sasidharan et al.:
The Effects of Social Network Structure on Enterprise Systems Success
Information Systems Research, Articles in Advance, pp. 1–21, © 2011 INFORMS
5
from gaining access to unique ideas about the use of
the enterprise system and will be better positioned
to learn about its important features or how to adapt
the technology and the business processes for better
fit. Therefore, they are more likely to see the bene-
fits of the enterprise system than employees with low
betweenness centrality.
Hypothesis 2A (H2A). The betweenness centrality of
individual employees will be positively related to perceived
information quality of the enterprise system.
Hypothesis 2B (H2B). The betweenness centrality of
individual employees will be positively related to perceived
task impact of the enterprise system.
The Effects of Unit-Level Social Network Struc-
tures.
Although individual employees are critical
to enterprise system success, a focus on only the
individuals’ network structures ignores the larger
networks in which these ego networks are embed-
ded (Ibarra et al. 2005): the social capital of the
group. One of the important questions is why there
are differences in implementation success across orga-
nizational units. Similar technologies might occa-
sion different outcomes because people within units
might undergo qualitatively different learning expe-
riences and processes (Barley 1990, Edmondson et al.
2001). Because advanced technologies, such as enter-
prise systems, have interpretive flexibility, employees
belonging to an organizational unit might engage in
a joint information-sharing process and collectively
learn how to appropriate the technology (Boudreau
and Robey 2005, DeSanctis and Poole 1994, Fulk 1993,
Levine et al. 2000). Their effectiveness in improvised
learning is contingent upon their ability to share infor-
mation and collaborate in implementing the new sys-
tem. Coleman (1990) and others (see Adler and Kwon
2002, Nahapiet and Ghoshal 1998 for reviews) have
argued that this is an important aspect of group social
capital. However, not all units share knowledge eas-
ily; some units might be better at sharing, communi-
cating and exchanging information than others. The
communication pattern in a unit might be a key
indicator of the information exchanges (Argote et al.
2000, 2003; Argote and Ingram 2000; Moreland and
Myaskovsky 2000; Szulanski 1996). We focus on the
degree of centralization of the unit’s communication
pattern and how that could facilitate or hinder the
successful unit-level implementation of an enterprise
system.
Network centralization refers to the extent of vari-
ability of ties of individual employees within an
organizational unit. It measures the extent to which
information flow is organized around one or two par-
ticular employees within the unit (Borgatti and Foster
2003, Brass 1995, Wasserman and Faust 1994). In a
Figure 1
Network Structures
(a)
C
B
A
D
E
(b)
Z
R
Y
S
T
highly centralized unit (Figure 1a), a small number of
users will have a comparatively higher concentration
of ties than other users. In less centralized networks
(Figure 1b), ties are spread more evenly among users.
Although considerable debate has occurred around
the social capital benefits of structural holes (Adler
and Kwon 2000, Burt 1992, Brass et al. 2004, Coleman
1990, Nahapiet and Ghoshal 1998), the centraliza-
tion of network structures has seldom been addressed
(Borgatti and Foster 2003, Borgatti et al. 2009). We
focus on centralization rather than the more com-
monly used measures of group social capital (e.g.,
density) because it provides a direct indication of
how information is disseminated within organiza-
tional units. Organizational hierarchies reflect the
common assumption that centralized communication
structures provide the most efficient distribution of
information. Indeed, organizations designate a rela-
tively few number of individuals (i.e., managers) to
distribute information to others (i.e., subordinates).
Likewise, some organizations designate unit repre-
sentatives to be trained extensively on the enterprise
system and disseminate information to others in the
unit. Although this might be efficient for the distribu-
tion of easily codifiable information, network research
suggests that it might be ineffective when tasks are
complex and sharing of implicit knowledge is nec-
essary for the effective implementation of the sys-
tem (Krackhardt 1994, Krackhardt and Carley 1998,
Uzzi and Lancaster 2003). Although rarely investi-
gated in field settings, small group network experi-
ments in the 1950s found that centralized structures
(Figure 1a) were effective when tasks were simple,
but decentralized groups (Figure 1b) performed bet-
ter when tasks were complex (see Borgatti et al. 2009
and Shaw 1964 for a review). As users attempt to
acquire knowledge about the new enterprise system
and its relevance for their tasks, they benefit from
being able to share noncodifiable knowledge, insights,
and experiences with each other. Uzzi and Lancaster
(2003, p. 384) refer to this as “private knowledge”
that is not easily transmitted through formal chan-
nels. It is idiosyncratic, nonstandard, “soft” knowl-
edge that is “valuable to the learning process.” In a
centralized network, information is routed through a
Cop
yright:
INFORMS
holds
cop
yr
ight
to
this
Ar
ticles
in
Adv
ance
version,
which
is
made
av
ailab
le
to
subscr
ibers
.
The
file
ma
y
not
be
posted
on
an
y
other
w
ebsite
,
including
the
author’
s
site
.
Please
send
an
y
questions
regarding
this
policy
to
per
missions@inf
or
ms
.org.
Sasidharan et al.:
The Effects of Social Network Structure on Enterprise Systems Success
6
Information Systems Research, Articles in Advance, pp. 1–21, © 2011 INFORMS
few key members of the unit. Therefore, users might
be inhibited in their collective knowledge accumula-
tion efforts and unable to fully judge the value and
relevance of the enterprise system. For the unit to ben-
efit as a whole, employees will have to collectively
share the private knowledge necessary to understand
the task, solve unexpected problems, and fully appre-
ciate the information interdependencies of the new
system (Fichman and Kemerer 1999, Fulk 1993, Kang
and Santhanam 2003). We therefore expect that decen-
tralized unit structures will provide the group social
capital necessary for successfully assimilating knowl-
edge and implementing the system.
Although only a few enterprise system studies have
attempted to address unit-level success (e.g., Gattiker
and Goodhue 2005), we attempt to capture unit level
implementation success independent of individual
level success. Rather than aggregating measures of
individual success, we use measures of unit-level per-
ceived information quality and work impact as pro-
vided by unit supervisors. We propose the following.
Hypothesis 3A (H3A). The centralization in a unit
will be negatively related to supervisors’ ratings of unit-
level information quality of the enterprise system.
Hypothesis 3B (H3B). The centralization in a unit
will be negatively related to supervisors’ ratings of unit-
level work impact of the enterprise system.
Cross-Level Effects
If the social capital of individual employees and orga-
nizational units has an impact on enterprise system
implementation success, then interactive effects are
possible: Do employees with a certain type of net-
work benefit from a specific type of network structure
in their units? Are they able to leverage their indi-
vidual relationships because of the surrounding unit
social structure? Ibarra et al. (2005, p. 359) note that,
“individual and collective interests may coincide or
differ.” We posit that employees with high levels of
in-degree centrality in the advice network will ben-
efit from being embedded in highly centralized unit
networks.
There is little organizational evidence to support
this prediction. Network studies of social capital typ-
ically have concentrated on either individuals (e.g.,
Burt 1992) or groups (Coleman 1990). Few, if any,
studies have investigated both individual-level net-
works and unit-level networks (Brass et al. 2004, Brass
2010, Ibarra et al. 2005). Most network studies at the
unit-level of analysis focus on interunit networks (e.g.,
Tsai 2001), or use the unit as the referent group for cal-
culating aggregate individual-level network measures
(e.g., Reagans et al. 2004). However, in summarizing
early small-group laboratory research, Shaw (1964)
noted that individuals in decentralized networks (Fig-
ure 1b) were more satisfied than individuals in cen-
tralized networks, but individuals who were individ-
ually central in highly centralized networks (Actor A
in Figure 1a) were the most satisfied of all. If you are
an individual in a highly centralized unit (Figure 1a),
it is best to be one of the one or two individuals
to whom everyone else comes for advice. In central-
ized units, where not everyone shares information
equally, the employee with the high in-degree central-
ity benefits most. Thus, we propose that individual-
level success can occur within a unit structure that
is detrimental to unit-level success. Employees who
have social capital by virtue of high in-degree central-
ity are in a position to take advantage of a unit-level
social structure (centralization) that inhibits unit-level
success. The social capital benefits of individual cen-
trality will be amplified in centralized group network
structures. We therefore propose the following.
Hypothesis 4A (H4A). The joint effects of individual-
level in-degree centrality and unit-level centralization will
be positively related to individual-level perceived informa-
tion quality.
Hypothesis 4B (H4B). The joint effects of individual-
level in-degree centrality and unit-level centralization will
be positively related to individual-level perceived task
impact.
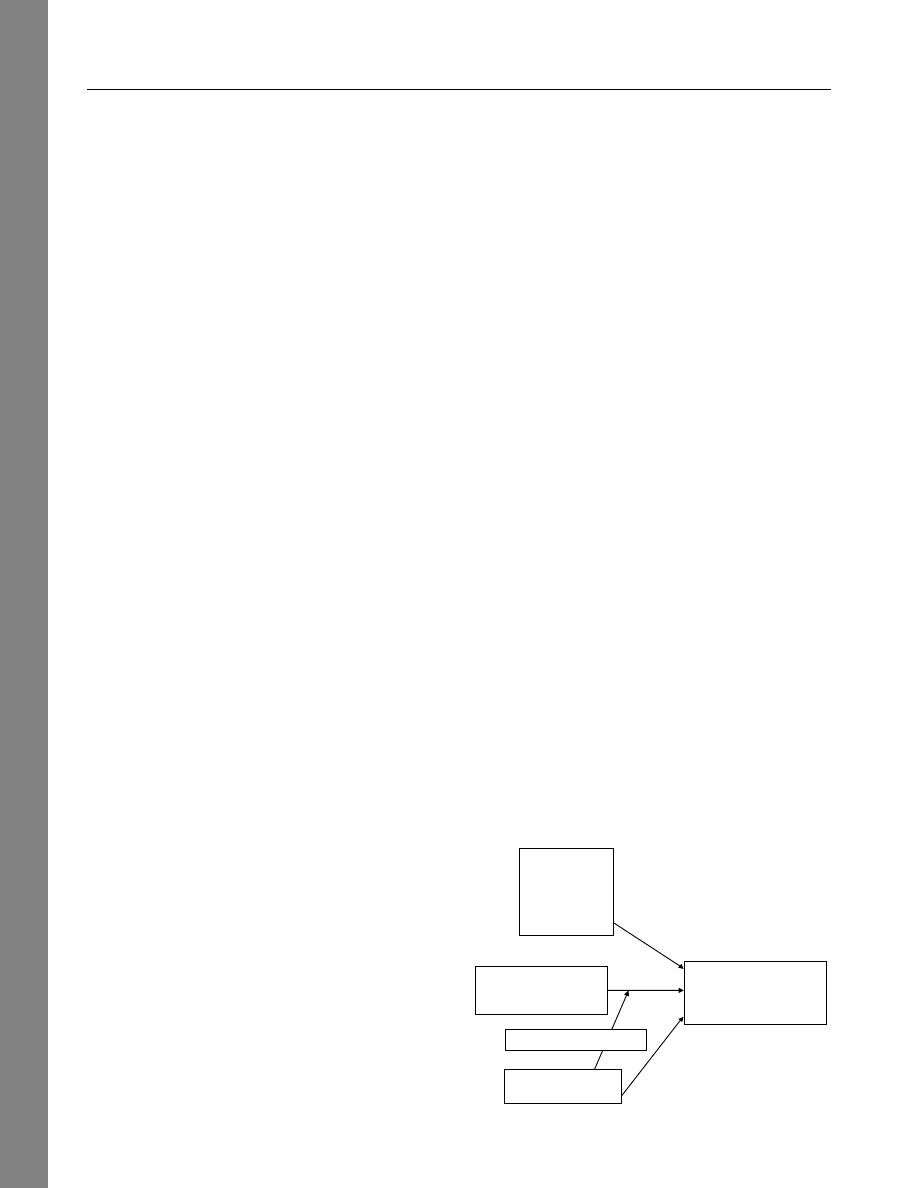
Research Method
To test our research model shown in Figure 2, we
conducted a field survey of organizational employees
learning to use a new enterprise resource planning
(ERP) system. To control for variations in orga-
nizational features and make comparisons across
organizational units, we focused on one organiza-
tion, tracking the implementation of the system over
Figure 2
Research Model
Individual/group outcomes
Information quality
Task/work impact
Human capital
Self-efficacy
Ease of use
Training
Involvement
Individual social capital
In-degree centrality
Betweenness centrality
Group social capital
Centralization
In-degree X centralization
Cop
yright:
INFORMS
holds
cop
yr
ight
to
this
Ar
ticles
in
Adv
ance
version,
which
is
made
av
ailab
le
to
subscr
ibers
.
The
file
ma
y
not
be
posted
on
an
y
other
w
ebsite
,
including
the
author’
s
site
.
Please
send
an
y
questions
regarding
this
policy
to
per
missions@inf
or
ms
.org.

Sasidharan et al.:
The Effects of Social Network Structure on Enterprise Systems Success
Information Systems Research, Articles in Advance, pp. 1–21, © 2011 INFORMS
7
a year. As stated earlier, enterprise systems often
take a considerable time to become integrated with
business processes, and hence we captured data
over a year. One year was considered reasonable
because the first module would have been fully
implemented, and we felt that it would be an appro-
priate shakeout period. Data collection took place
during three periods of postimplementation: immedi-
ately following implementation (Phase 1), six months
after implementation (Phase 2), and one year after
implementation (Phase 3).
Data Gathering and the Enterprise System
Implementation Process
We conducted our study at a large southeastern uni-
versity in the United States where a new ERP system
was being implemented. The major vendor was Syste-
manalyse und Programmentwicklung (SAP), and the
software being implemented was the SAP R/3 (higher
education and research) portfolio of ERP solutions.
This includes four major modules: financials (FI),
materials management (MM), human resource man-
agement (HR), and campus management (CM). The
ERP system modules were implemented in a stag-
gered manner. We surveyed employees who were
affected by the first module, FI. The users of the
FI module were primarily administrative staff who
were users of the “legacy” financial system and were
transitioning to the ERP system. The FI module was
the most complex of the ERP system modules and
involved the largest number of users within the uni-
versity community.
The ERP system implementation team was com-
posed of IT personnel from the university and con-
sultants from the implementation partners. They were
co-located just outside of the university campus in a
new office that had been purchased and re-modeled
for this specific purpose. The co-location ensured
smooth flow of information between university IT
personnel and consultants and was viewed as vital to
team performance. The implementation team adopted
a functional perspective rather than a technical per-
spective toward “selling” the implementation to the
university community. The team highlighted exist-
ing business process inefficiencies and explained how
the ERP system would resolve those inefficiencies,
improve information processing, and enhance task
productivity. The top management of the university
was supportive of the implementation. A steering
committee made up of divisional heads was consti-
tuted to review implementation progress.
To spread awareness of the ERP system, regu-
lar “town-hall” style meetings were conducted, and
e-mail circulars were sent to employees through
the implementation list-serve. Employee opinions
regarding changed business processes were solicited
and, when found appropriate, incorporated into the
system. Prior to the launch of the system and
before it was made available to the users, task- and
function-specific training sessions were conducted,
and employees were encouraged to attend. They
were provided with training manuals and a dic-
tionary/glossary that introduced system-specific ter-
minology. Before actually using the ERP system,
employees had to pass a minimum competency test.
We demarcated the organizational unit boundaries
using data provided by the ERP system implemen-
tation team, preliminary interviews with department
heads and senior officials in the human resources
department who were knowledgeable about job roles
and duties of administrative units, and observation
of users of the system. This demarcation was based
on the commonality of the ERP functions that the
employees of the unit had to operate. For example,
all employees in the payroll department would see
the same interface and use similar functions in doing
their tasks with the ERP system. These units tended
to be in line with formal organizational demarca-
tion of units. While we expected that employees
within a unit would consult with one another because
their system interfaces would be similar and differ-
ent from employees in other units, we took a cautious
approach and provided an option in the questionnaire
for respondents to list of names of employees outside
their unit with whom they consulted. However, this
option was hardly used by our respondents, further
suggesting that our organizational unit demarcation
was appropriate. We identified 55 distinct organiza-
tional units covering 702 users. These units included
Payroll Controllers Office, Agricultural Science Cen-
ter, Cancer Center, Office of the Treasurer, etc. Mem-
bers of a unit were co-located and had easy access to
one another.
We collected the data through a survey question-
naire with two sections. The first section of the ques-
tionnaire was designed to identify network properties
of organizational units and users, our independent
variables. The second section was designed to obtain
our two dependent measures of user perceptions of
system success. For the dependent variables at the
organizational unit level, we used the perceptions of
the unit supervisor. The survey questionnaire was
pre-tested with several users and unit heads who
were not part of the final sample. The feedback was
used to make refinements, and the final questionnaire
is shown in Appendix 1.
Employees were requested to voluntarily partici-
pate in the survey, and they were informed that their
responses would be kept confidential and that the
procedures were cleared by the Institutional Review
Board. The first round of survey questionnaires form-
ing Phase 1 data collection was distributed immedi-
ately after implementation of the ERP system. The
Cop
yright:
INFORMS
holds
cop
yr
ight
to
this
Ar
ticles
in
Adv
ance
version,
which
is
made
av
ailab
le
to
subscr
ibers
.
The
file
ma
y
not
be
posted
on
an
y
other
w
ebsite
,
including
the
author’
s
site
.
Please
send
an
y
questions
regarding
this
policy
to
per
missions@inf
or
ms
.org.

Sasidharan et al.:
The Effects of Social Network Structure on Enterprise Systems Success
8
Information Systems Research, Articles in Advance, pp. 1–21, © 2011 INFORMS
second round of data collection, Phase 2, commenced
six months after implementation. The third round
of data collection, Phase 3, commenced one year
after implementation. In all the phases, we collected
individual- and unit-level data.
Measures
Network measures were obtained using the roster
method wherein each respondent was provided with
a list of other users of the ERP system within their
organizational unit. As a general instruction, we
informed the users that they were to respond about
whom they communicate with on a typical work day
regarding questions about the new enterprise system.
We then asked each respondent to check the names
of people they consulted for (1) specifically obtaining
job-related information such as a work-related pro-
cedure and (2) specifically obtain technology-related
information. The respondents were also asked to list
names of people who might not be on the list, or are
outside their unit, but whom they approach to seek
information.
The social network data were analyzed using
UCINET 6 (Borgatti et al. 2002). User responses
were entered as two separate binary network matri-
ces corresponding to the questions about job- and
technology-related information. The vast majority of
respondents selected the technology-related network
only; less than 3% chose the job-related question. Sub-
sequent interviews indicated that they did not per-
ceive much difference between the two networks as
they sought information within their networks. They
indicated that their communications co-mingled dis-
cussions about how the technology would help them
do their jobs and how they could change some of
their job activities to better use the technology. This
perspective is consistent with the mutual adaptation
view, which argues that users learn a new technol-
ogy through a joint adaptation of learning about
their task and the technology (Leonard-Barton 1988).
Therefore, the two network matrices were combined
in the following manner. If a tie existed between a
pair of employees in either or both networks, the
combined matrix would register a tie; otherwise, no
tie existed between a pair of employees. Thus, the
combined matrix captured both job- and technology-
related information ties.
1
We also found that there
were very few nominations outside the workgroup,
and they were from units that were not included
in our survey. Hence these were excluded from the
analyses.
1
It is to be noted that we conducted a sensitivity analysis by exclud-
ing the few responses to the job-related network and using solely
the data from the technology-related and did not find substantive
difference in the results.
At the individual level of analysis, in-degree cen-
trality was calculated as the percentage of the num-
ber of ties received by an actor out of the maximum
possible number of actors within the unit. In-degree
centrality provides a more objective, less biased mea-
sure of the size of an employee’s network because it
counts only ties reported by other employees (rather
than relying on self-reports of the size of one’s net-
work). Because some of the other measures, including
the individual-level dependent variables, are based
on self-reports, the measurement of in-degree cen-
trality through responses from others limits same-
respondent bias. Betweenness centrality was calculated
using the flow betweenness procedure in UCINET 6.
This procedure calculates the extent to which an actor
falls between other pairs of actors, who are not them-
selves connected, on paths of any distance. This mea-
sure takes into account both direct and indirect ties
and is viewed as preferable to the constraint measure
offered by Burt (1992) that focuses primarily on direct
ties (Mehra et al. 2001). At the organizational unit
level of analysis, centralization was calculated using
the Freeman’s centralization measure in UCINET 6,
which expresses the degree of variance of ties as a
percentage of a perfect star network of the same size.
Dependent Variables. Our dependent measures
are at two levels: individual employee and unit.
Employees’ responses were collected to measure
implementation success at the individual level of
analysis whereas unit supervisors’ responses were
collected to measure implementation success at the
unit level. Our dependent measures at the individ-
ual employee level are perceived information quality
and task impact. Information quality taps into employee
perceptions of the value of the new information gen-
erated by the new IS and includes an evaluation
of the accuracy, sufficiency, precision, and complete-
ness of the new information (DeLone and McLean
1992, 2003). We measured information quality by adapt-
ing and refining existing information quality scales
(Bailey and Pearson 1983, Rai et al. 2002) to suit
the ERP implementation context (see Appendix 1 for
items). Task impact measures employee perceptions
about the extent to which the new ERP system allows
them to complete their tasks effectively and to gener-
ate innovative ideas to improve their work. This was
measured by adapting an existing questionnaire (Doll
and Torkzadeh 1998) to suit this study’s context (see
Appendix 1 for items).
At the organizational unit level, our dependent
measures referred to unit-level perceived information
quality and unit-level work impact as reported by the
unit supervisor. Unit supervisors were in a position
to respond to the overall effect of the system at the
unit level.
Cop
yright:
INFORMS
holds
cop
yr
ight
to
this
Ar
ticles
in
Adv
ance
version,
which
is
made
av
ailab
le
to
subscr
ibers
.
The
file
ma
y
not
be
posted
on
an
y
other
w
ebsite
,
including
the
author’
s
site
.
Please
send
an
y
questions
regarding
this
policy
to
per
missions@inf
or
ms
.org.

Sasidharan et al.:
The Effects of Social Network Structure on Enterprise Systems Success
Information Systems Research, Articles in Advance, pp. 1–21, © 2011 INFORMS
9
Control Variables. We controlled for the effects
of alternate explanatory variables that could influ-
ence implementation success. Because our organiza-
tional units are all part of the same organization,
organizational level factors that affect implementation
success were common to all units, and an inherent
control existed for these variables (Damanpour 1991,
Somers and Nelson 2004). However, we controlled
for organizational unit size (number of employees
within a unit). For individual employees, we included
control variables such as amount of training, per-
ceived computer self-efficacy, and ease of use (see
Appendix 1 for items). These constructs have been
shown to affect implementation success (Amoako-
Gyampah and Salam 2004, Somers and Nelson 2004,
Venkatesh 2000). All the employees had been pro-
vided one-time training prior to the implementation
of the system. Therefore, we asked each respondent
to indicate the number of training sessions they had
attended prior to the implementation of the system,
and we used this as a control variable. We also con-
trolled for the extent of employees’ involvement in
system design, thereby controlling for the possibility
that some employees were more involved and famil-
iar with the system prior to its implementation (see
Appendix 1 for items). Finally, users’ beliefs about
self-efficacy could be an important influence on their
perceptions about the information quality and task
impact of the system (Compeau et al. 1999). Because
the goal of our study is to examine the effects of
network structures, self-efficacy represents an impor-
tant control variable so that we can investigate the
additional influence of network structures beyond the
effects of self-efficacy. We used a 7-point Likert scale
to measure these items.
Data Analysis and Results
Response Rates
A total of 702 questionnaires were distributed across
55 units in Phase 1. We received 312 responses, giv-
ing us an overall response rate of 44.44%. To conduct
social network analysis, it is important that data be
collected from at least 80% of the members of each
responding network unit (Rogers and Kincaid 1981).
Missing respondent data could be amplified by the
number of possible connections in the unit, and inac-
curate network measures can result from response
rates less than 80%. Hence, questionnaire responses
from units not having an 80% response rate were
eliminated. Questionnaires that were incomplete or
returned blank were also eliminated. This resulted
in 207 usable responses from 29 organizational units.
Similarly, in Phase 2 of our study (six months after
implementation), we obtained 156 usable responses
from 22 organizational units. Phase 3 of our study
(one year after implementation) yielded 142 usable
responses from 20 organizational units.
2
Data from
respondents who answered in all three phases were
used in our analysis.
Psychometric Properties of Measures
We conducted a factor analysis on the nonnetwork
questionnaire items from Phase 1 using principal
component analysis (PCA) and varimax rotation for
factor extraction. The factor analysis resulted in five
factors, corresponding to the measures of perceived
information quality, computer self-efficacy, ease of
use, perceived task impact, and involvement in sys-
tem design. The items for each of these measures have
corresponding factor loadings greater than 0.5, which
is more than their cross-loadings with other factors
(see Appendix 2 for details). The Cronbach’s alphas
for these measures were greater than the widely used
critical threshold of 0.70 (see Appendix 2).
Data Analysis
Table 1 shows the descriptive statistics of the
individual-level variables in all three phases of data
gathering. The Pearson’s correlations between the
variables are presented in Appendix 3. The means and
standard deviations for the organizational unit level
variables are presented in Table 2. The nonparamet-
ric Spearman’s correlations among these variables are
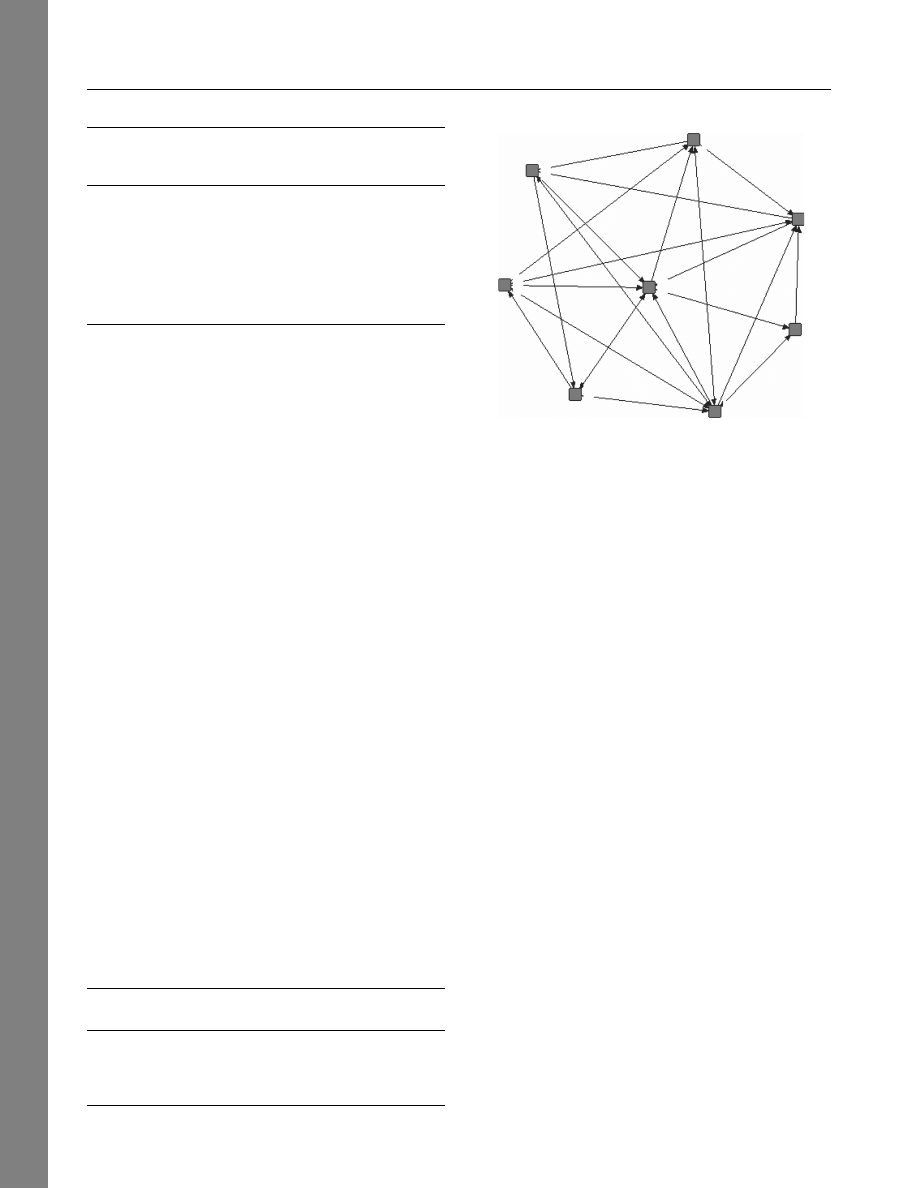
presented in Appendix 4. A network diagram gen-
erated from our data using UCINET 6/Netdraw for
an organizational unit having eight actors (employ-
ees) is presented in Figure 3. The nodes represent the
employees, and the lines represent the communica-
tion patterns between them.
Repeated observations were collected from subjects
at different periods, and these observations are nested
within subjects. Furthermore, because these individ-
uals belong to different units, they are considered to
be nested within units. To analyze such nested data,
hierarchical linear modeling (HLM) is the preferred
technique (Ang et al. 2002, Hoffmann and Gavin
1998, Mithas et al. 2007, Raudenbush and Bryk 2002,
Raudenbush et al. 2004, West et al. 2007). In an HLM
model, each one of the levels of nested data is rep-
resented as a submodel, enabling us to gauge the
impact of each of the levels on the dependent vari-
ables. The HLM modeling also allows us to test for
cross-level effects, i.e., interactions between the net-
work characteristics of the individuals and the units
where they work.
2
We used the same questionnaire in all three phases of the study
for consistency in the administration of the surveys. However, the
level of training and involvement in systems design capture indi-
vidual characteristics prior to the launch of the enterprise system.
Although they were measured at all three times, only Phase I mea-
sures were used for the analysis.
Cop
yright:
INFORMS
holds
cop
yr
ight
to
this
Ar
ticles
in
Adv
ance
version,
which
is
made
av
ailab
le
to
subscr
ibers
.
The
file
ma
y
not
be
posted
on
an
y
other
w
ebsite
,
including
the
author’
s
site
.
Please
send
an
y
questions
regarding
this
policy
to
per
missions@inf
or
ms
.org.
Sasidharan et al.:
The Effects of Social Network Structure on Enterprise Systems Success
10
Information Systems Research, Articles in Advance, pp. 1–21, © 2011 INFORMS
Table 1
Descriptive Statistics at the Individual Employee Level
Phase 1
Phase 2
Phase 3
4n = 2075
4n = 1565
4n = 1425
Measure
Mean (SD)
Mean (SD)
Mean (SD)
Involvement
2
1
044 (0.82)
1
048 (0.88)
1
05 (0.91)
Training
1
1 2
3
074 (1.39)
3
081 (1.33)
3
092 (1.22)
Self efficacy
4
013 (1.27)
4
022 (1.23)
4
021 (1.24)
Ease of use
3
093 (1.27)
4
013 (1.27)
4
010 (1.24)
In-degree centrality
57
031 (23.41)
58
058 (25.04)
61
041 (24.05)
Betweenness centrality
16
075 (15.27)
17
042 (15.15)
19
095 (21.68)
Information quality
4
018 (1.09)
4
023 (1.18)
4
022 (1.24)
Task impact
4
028 (0.96)
4
032 (1.22)
4
035 (1.25)
1
Measured as number of training sessions.
2
These measures reflect one-time individual characteristics prior to the
implementation of the enterprise system. Though they were measured in
each phase, they are time-invariant. Therefore, only Phase 1 measures were
used in the analysis, unlike the rest of the variables. The scores for Phases 2
and 3 are reported only for consistency.
For our individual level data set, the 3-level HLM
model enables us to analyze within-subject and
between-subject observations, as well as between-unit
observations (where subjects belong to their organiza-
tional units). Level 1 represents the submodel at the
most detailed level of the data (Raudenbush and Bryk
2002, Raudenbush et al. 2004, West et al. 2007); in our
case, the individual employee. In the context of a lon-
gitudinal data set, this level represents the repeated
within-subject measures across the three phases for an
individual employee, namely, the independent vari-
able measures of in-degree centrality and between-
ness centrality, and the covariates of self-efficacy and
ease of use. The dependent variable is at the same
level of analysis; in our case, individual employee rat-
ings of perceived information quality and perceived
task impact for the three phases. Level 2 represents
the second submodel and also denotes observations
at the individual employee level. However, it includes
only time-invariant between subjects measures. In our
study, training and involvement in systems design
capture each individual’s characteristics prior to the
implementation of the enterprise system and remain
constant for the duration of our study. These two
constructs were represented at Level 2. Level 3 repre-
sents the third submodel and final level of the hier-
archy, and denotes observations related to the unit
Table 2
Descriptive Statistics at the Organizational Unit level
Phase 1
4n = 295 Phase 2 4n = 225 Phase 3 4n = 205
Measure
Mean (SD)
Mean (SD)
Mean (SD)
Unit size
7
014 (2.46)
7
010 (2.39)
7
010 (2.49)
Centralization
40
041 (20.20)
37
024 (18.96)
31
002 (20.84)
Information quality
4
051 (1.01)
4
094 (1.05)
5
003 (1.09)
Work impact
4
099 (1.20)
5
002 (1.17)
4
086 (1.16)
Figure 3
Actual Network Diagram
1
5
4
7
6
3
8
2
as a whole. In our case, individual employees belong
to their organizational units and its associated mea-
sure is centralization. Thus, 3-level HLM has time and
time-varying (time-dependent) individual employee
level covariates (i.e., the repeated within-subject mea-
sures) at Level 1, time invariant (time-independent)
individual employee level covariates (i.e., between
subject measures) at Level 2, and organizational unit
level covariates at Level 3 (Raudenbush et al. 2004,
West et al. 2007) (see Table 3 and Figure 4).
Mathematically, our Level 1 submodel can be rep-
resented as
Y
ijk
=
0jk
+
1jk
4Time5 +
2jk
4Self efficacy5
+
3jk
4Ease of Use5 +
4jk
(In-degree centrality)
+
5jk
4Betweenness centrality5 + e
ijk
1
where, Y
ijk
is the individual user’s perception about
information quality or task impact.
0jk−5jk
are the Level 1 coefficients and e
ijk
is the
Level 1 random effect.
The Level 2 submodel takes the form
0jk
=
00k
+
01k
4Involvement5 +
02k
4Training5 + r
0jk
1
where
00k−02k
are the Level 2 coefficients and r
0jk
is
the Level 2 random effect.
Similarly, the Level 3 submodel can be represented
as
00k
=
000
+
001
4Centralization5 + u
00k
40k
=
400
+
401
4Centralization5
+
u
40k
4for interaction effect51
where
000−001
and
400−401
are the Level 3 coeffi-
cients and u
00k
, u
40k
are the Level 3 random effects.
Substitution of the Level 3 “” terms into the Level 2
Cop
yright:
INFORMS
holds
cop
yr
ight
to
this
Ar
ticles
in
Adv
ance
version,
which
is
made
av
ailab
le
to
subscr
ibers
.
The
file
ma
y
not
be
posted
on
an
y
other
w
ebsite
,
including
the
author’
s
site
.
Please
send
an
y
questions
regarding
this
policy
to
per
missions@inf
or
ms
.org.

Sasidharan et al.:
The Effects of Social Network Structure on Enterprise Systems Success
Information Systems Research, Articles in Advance, pp. 1–21, © 2011 INFORMS
11
Table 3
3-Level and 2-Level HLM Models
Covariates
Model
Level 1
Level 2
Level 3
Dependent variables
3-Level HLM
Time, In-degree centrality,
Betweenness centrality,
Self-efficacy, Ease of use
Training, Involvement in
system design
Centralization,
Centralization X
In-degree centrality
Information quality and Task
impact at individual
employee level
2-Level HLM
Time, Centralization
Unit size
NA
Information quality and Work
impact at unit level
submodel and the Level 2 “” terms into the Level 1
submodel yields the following mixed model:
Y
ijk
=
000
+
100
4Time5 +
200
4Self efficacy5
+
300
4Ease of use5 +
400
(In-degree centrality)
+
500
4Betweenness Centrality5
+
010
4Involvement5 +
020
4Training5
+
001
4Centralization5
+
401
4Centralization5(In-degree centrality)
+
r
0jk
+
u
00k
+
u
40k
(In-degree centrality) + e
ijk
1
where, i, j, and k represents Levels 1, 2, and 3, respec-
tively. Using HLM software (Raudenbush et al. 2004),
we ran the 3-level model with the responses from
employees and units that persisted through the three
phases. The results are presented in Table 4a. To fur-
ther test the robustness of the model, we re-analyzed
the model by including the demographic variables
of age, experience, and education. The results are
presented in Table 4b and are similar to earlier
results.
In-degree centrality was found to have a highly
significant positive relationship with the two mea-
sures of implementation success: perceived informa-
tion quality 4
400
=
00241 p < 00055 and task impact
4
400
=
00191 p < 00055. Thus, we find support for H1A
and H1B. Similarly, betweenness centrality also has
a highly significant positive relationship with per-
ceived information quality 4
500
=
00161 p < 00055 and
Figure 4
3-Level HLM Model
Information quality
Task impact
Time (
100
)
Self-efficacy (
200
)
Ease of use (
300
)
In-degree (
400
)
Betweenness (
500
)
Involvement (
010
)
Training (
020
)
Centralization (
001
)
Centralization X
In-degree (
401
)
Level 1
Time-varying
(time-dependent)
individual-level
covariates
Level 2
Time-invariant
(time-independent)
individual-level
covariates
Level 3
Unit-level covariate
and interaction
Dependent
variables
at individual level
task impact 4
500
=
00171 p < 00055; thus, we find sup-
port for H2A and H2B. Furthermore, the cross-level
interaction effect between in-degree centrality and
centralization is found to be significant for both infor-
mation quality 4
401
=
00101 p < 00055 and task impact
4
401
=
00101 p < 00055; thus we find support for H4A
and H4B.
Consistent with prior research, we found that
individual-level attributes such as self-efficacy and
ease of use were significant in our data, support-
ing the importance of human capital. Self-efficacy
had a significant positive relationship with both per-
ceived information quality 4
200
=
00151 p < 00055 and
task impact 4
200
=
00141 p < 00055. Ease of use and
training had a significant positive relationship with
perceived information quality alone 4
300
=
00101 p <
00055. However, involvement in system design had no
significant relationship with either perceived informa-
tion quality or task impact. Overall, the R-squared
value of our model is 0.29.
To analyze implementation success at the unit level,
we ran a 2-Level HLM where the dependent vari-
able is at the unit level. Here, the most detailed
level of observation is the organizational unit. Thus,
Level 1 denotes repeated within-subject measures for
the three phases for the organizational unit; in our
case, the centralization measure. The dependent vari-
able is at this level; in our case, unit supervisor ratings
of unit-level perceived information quality and work
impact for the three phases. Level 2 will denote the
between-subjects measure for organizational units,
namely, unit size (see Table 3 and Figure 5).
Cop
yright:
INFORMS
holds
cop
yr
ight
to
this
Ar
ticles
in
Adv
ance
version,
which
is
made
av
ailab
le
to
subscr
ibers
.
The
file
ma
y
not
be
posted
on
an
y
other
w
ebsite
,
including
the
author’
s
site
.
Please
send
an
y
questions
regarding
this
policy
to
per
missions@inf
or
ms
.org.

Sasidharan et al.:
The Effects of Social Network Structure on Enterprise Systems Success
12
Information Systems Research, Articles in Advance, pp. 1–21, © 2011 INFORMS
Mathematically, the Level 1 submodel can be repre-
sented as
Y
ij
=
0j
+
1j
4Time5 +
2j
4Centralization5 + r
ij
1
where Y
ij
is the unit supervisor’s rating of informa-
tion quality or task impact and
0j−2j
are the Level 1
coefficients and r
ij
is the Level 1 random effect.
The Level 2 submodel can be represented as
0j
=
00
+
01
4Unit Size5 + u
0j
1
where
00−01
are the Level 2 coefficients and u
0j
is the
Level 2 random effect.
Combining the above, as a mixed model, our 2-level
HLM can be mathematically expressed as
4Y
ij
=
00
+
10
4Time5 +
20
4Centralization5
+
01
4Unit Size5 + r
ij
+
u
0j
1
where, i and j represents Levels 1 and 2, respectively.
We ran the 2-level model using the HLM software,
and the results are indicated in Table 4a. As in the
case of the 3-level HLM, to further test the robustness
of the model, we re-analyzed the model by including
the demographic variables of manager age, manager
experience, and manager education. The results are
presented in Table 4b and are similar to the earlier
results.
Our results revealed that centralization had a
significant negative relationship with work impact
Table 4a
Results of HLM Analysis
Model
Covariates
45
Dependent variable
Coefficient values
p-Value
3-Level HLM
Time
4
100
5
Information Quality
−00012
0
069
(Dependent variable is at
Task Impact
−00004
0
086
individual employee level)
Self-efficacy
4
200
5
Information Quality
0
0150
0
001
∗∗
Task Impact
0
0145
0
002
∗
Ease of use
4
300
5
Information Quality
0
0106
0
004
∗
Task Impact
0
0040
0
030
In-degree centrality
4
400
5
Information Quality
0
0243
0
001
∗∗
Task Impact
0
0194
0
001
∗∗
Betweenness centrality
4
500
5
Information Quality
0
0156
0
002
∗
Task Impact
0
0172
0
001
∗∗
Involvement in system design
4
010
5
Information Quality
−00001
0
090
Task Impact
−00041
0
054
Training
4
020
5
Information Quality
0
0127
0
003
∗
Task Impact
−00022
0
030
Centralization
4
001
5
Information Quality
−00184
0
002
∗
Task Impact
−00154
0
002
∗
In-degree centrality × Centralization 4
401
5
Information Quality
0
0104
0
002
∗
Task Impact
0
0100
0
002
∗
2-Level HLM
Time
4
10
5
Information Quality
0
0238
0
002
∗
(Dependent variable
Work impact
0
0141
0
020
is at unit level)
Centralization
4
20
5
Information Quality
−00138
0
017
Work impact
−00234
0
005
∗
Unit size
4
01
5
Information Quality
−00022
0
072
Work impact
−00055
0
050
∗
p ≤ 0005;
∗∗
p ≤ 0001
4
20
= −
00231 p < 00055, thereby supporting H3B. How-
ever, we did not find a significant relationship
between centralization and perceived information
quality, thus we do not find support for H3A.
However, from the 3-level HLM, we find that
centralization has significant negative impact on
individual-level perceived information quality 4
001
=
−
00181 p < 00055 and individual-level task impact
4
001
= −
00151 p < 00055. Thus, we find that centraliza-
tion inhibits not only unit-level work impact as rated
by unit supervisors, but also the individual percep-
tions of the information quality and task impact of the
enterprise system. The R-squared value of our model
is 0.38. Overall, our results support our contention
that social network characteristics of organizational
units and employees affect postimplementation infor-
mation exchanges and influence the extent of imple-
mentation success. In addition, our results demon-
strate the importance of cross-level network effects in
the implementation of enterprise systems.
Discussion and Conclusion
Overall, our research suggests that a multi-level
framework focusing on both the human capital and
social capital of individuals and the social capital of
groups is necessary for a comprehensive understand-
ing of the postimplementation success of complex
technologies in organizations. Consistent with previ-
ous findings on human capital (Chau 2001, Compeau
Cop
yright:
INFORMS
holds
cop
yr
ight
to
this
Ar
ticles
in
Adv
ance
version,
which
is
made
av
ailab
le
to
subscr
ibers
.
The
file
ma
y
not
be
posted
on
an
y
other
w
ebsite
,
including
the
author’
s
site
.
Please
send
an
y
questions
regarding
this
policy
to
per
missions@inf
or
ms
.org.

Sasidharan et al.:
The Effects of Social Network Structure on Enterprise Systems Success
Information Systems Research, Articles in Advance, pp. 1–21, © 2011 INFORMS
13
Table 4b
Results of HLM Analysis with Demographic Variables
Model
Covariates
45
Dependent variable
Coefficient values
p-Value
3-Level HLM
Time
4
100
5
Information Quality
−00030
0
050
(Dependent variable is at
Task Impact
−00013
0
067
individual employee level)
Self-efficacy
4
200
5
Information Quality
0
0136
0
001
∗∗
Task Impact
0
0143
0
002
∗
Ease of use
4
300
5
Information Quality
0
0101
0
003
∗
Task Impact
0
0035
0
039
In-degree centrality
4
400
5
Information Quality
0
0278
0
001
∗∗
Task Impact
0
0213
0
001
∗∗
Betweenness centrality
4
500
5
Information Quality
0
0161
0
003
∗
Task Impact
0
0203
0
001
∗∗
Age
4
010
5
Information Quality
0
0006
0
048
Task Impact
−00000
0
098
Experience
4
020
5
Information Quality
0
0004
0
059
Task Impact
0
0007
0
048
Education
4
030
5
Information Quality
0
0028
0
074
Task Impact
−00031
0
060
Involvement in system design
4
010
5
Information Quality
−00011
0
089
Task Impact
−00030
0
070
Training
4
020
5
Information Quality
0
0110
0
006
Task Impact
−00003
0
095
Centralization
4
001
5
Information Quality
−00213
0
004
∗
Task Impact
−00166
0
002
∗
In-degree centrality X Centralization
4
401
5
Information Quality
0
0113
0
004
∗
Task Impact
0
0133
0
002
∗
2-Level HLM
Time
4
10
5
Information Quality
0
0237
0
002
∗
(Dependent variable is
Work impact
0
0136
0
022
at unit level)
Centralization
4
20
5
Information Quality
−00191
0
016
Work impact
−00244
0
005
∗
Unit size
4
01
5
Information Quality
−00018
0
078
Work impact
−00068
0
047
Manager age
4
02
5
Information Quality
−00038
0
016
Work impact
−00029
0
041
Manager experience
4
03
5
Information Quality
0
0041
0
066
Work impact
0
0074
0
048
Manager education
4
04
5
Information Quality
−00110
0
053
Work impact
−00200
0
028
et al. 1999, Igbaria and Iivari 1995, Venkatesh 2000,
Venkatesh et al. 2003), we found that computer self-
efficacy, perceptions of ease-of-use, and level of train-
ing affect implementation success. However, after
controlling for human capital, our findings emphasize
the importance of moving beyond existing paradigms
of individual antecedents toward a focus on social
capital and network structures at multiple levels
(Fichman 2004, Jasperson et al. 2005, Ibarra et al.
2005, Santhanam et al. 2007). Our findings suggest
that we must move beyond learning via training to
Figure 5
2-Level HLM Model
Information quality
Work impact
Time (
10
)
Centralization (
20
)
Unit size (
01
)
Level 1
Time-varying
(time-dependent)
unit-level
covariates
Level 2
Time-invariant
(time-independent)
unit-level
covariate
Dependent
variables
at unit level
include learning via social relationships if we are to
fully understand enterprise system implementation
success.
At the individual level, employees who are located
in social networks with the social capital benefits of
high in-degree centrality and high betweenness cen-
trality found the new system to provide better qual-
ity information and to have greater impact on their
jobs, even when controlling for human capital and
technology-related characteristics such as ease-of-use.
Although Burt (1992) has argued that the pattern of
relationships is a more important indicator of social
capital than the size of the individual’s network, both
measures (in-degree and betweenness centrality) cor-
related positively with the measures of postimple-
mentation success. Sharing knowledge with many
others, as well as talking with diverse, non-connected
others, suggests that employees acquire social capi-
tal by holding central positions. Centrality provides
access to and control of valued resources, such as
information, enabling employees to learn quickly
Cop
yright:
INFORMS
holds
cop
yr
ight
to
this
Ar
ticles
in
Adv
ance
version,
which
is
made
av
ailab
le
to
subscr
ibers
.
The
file
ma
y
not
be
posted
on
an
y
other
w
ebsite
,
including
the
author’
s
site
.
Please
send
an
y
questions
regarding
this
policy
to
per
missions@inf
or
ms
.org.

Sasidharan et al.:
The Effects of Social Network Structure on Enterprise Systems Success
14
Information Systems Research, Articles in Advance, pp. 1–21, © 2011 INFORMS
when faced with innovative projects that demand
different expertise and skill sets (Brass 1984, Burt
1992, Cross and Cummings 2004, Ibarra and Andrews
1993). We also found that group-level social capital, as
exemplified by decentralized advice networks, posi-
tively affected not only group-level postimplementa-
tion success but individual-level success as well. Few
studies have examined unit-level influences on the
assimilation of an enterprise system. Our results sug-
gest that the decentralized interactions necessary for
knowledge exchange are more useful than the often-
assumed efficient but simple distribution of infor-
mation through centralized structures. Complex tech-
nologies necessitate a mastery of individual techni-
cal skills but, even more importantly, require users to
participate in developing a coordinated understand-
ing of technology use (Fichman and Kemerer 1997,
Fulk 1993, Orlikowski 1996). These results also con-
tribute to the theory of group-level social capital by
suggesting that decentralized units acquire social cap-
ital when task success require the sharing of com-
plex, idiosyncratic, “private” knowledge (Uzzi and
Lancaster 2003). Previous conceptualizations of group
social capital have focused on the development of
norms and trust rather than the effective dissemi-
nation and sharing of knowledge, and they seldom
have focused on the nature of the task (Nahapiet and
Ghoshal 1998). Rather than debating the individual
and group definitions and perspectives on social cap-
ital, these results necessitate a multilevel approach to
social capital in future research.
Examinations of IS postimplementation success
typically have been confined to the individual level
of analysis, whereas unit-level studies have been rel-
atively neglected (DeLone and McLean 1992). Like-
wise, network studies have seldom combined micro-
and macrolevels of analysis (Ibarra et al. 2005), and
rarely has the concept of centralization been utilized
at the unit level of analysis (Borgatti et al. 2009).
Understanding implementation success through a
multilevel analysis can provide a more complete
evaluation of a new information system (Gallivan
2001, Klein et al. 1994, Wynekoop and Senn 1992).
Our results emphasize the importance of consider-
ing individual-level and unit-level structures simulta-
neously. Although centralized unit structures inhibit
unit-level and individual-level success, individuals
with high in-degree centrality particularly benefitted
from the centralized unit-level structures. Although
social network analysis is often touted as capable
of simultaneously providing measures across level
of analysis, studies combining both unit-level and
individual-level networks are particularly rare (Ibarra
et al. 2005). While social capital research typically has
focused on the individual or the group (Adler and
Kwon 2002), our findings extend the view of social
capital to include the simultaneous investigation of
individual and group social capital. Our results point
out the importance of considering interactions across
levels of analysis and suggest an area for fruitful
future research efforts (Klein et al. 1994).
Our study also underscores the importance of
longitudinal studies of IS implementation success.
Complex technologies go through postimplementa-
tion break-in phases, and the full effects of com-
plex technologies must be understood by conducting
extended longitudinal studies (Gattiker and Goodhue
2005, Hsieh and Wang 2007, Markus and Tanis 1999).
IS research has tended to concentrate on investigat-
ing IS adoption decisions while neglecting to under-
stand factors that motivate employees to engage in
continued use of IS (Bhattacherjee 2001, Bhattacher-
jee and Premkumar 2004). As our study indicates, the
network characteristics that relate to implementation
success continue to have an impact over an extended
period; in our case, a full year after implementation.
Limitations
Caution is necessary in interpreting these results
because our study has several limitations. First, our
research involves a mandated system rather than a
voluntary one. However, studies indicate that even
when systems are mandated, system use is not totally
mandatory, as Barley’s (1990) research richly illus-
trates. There is some discretion in the intensity and
quality of use, which in turn affects the perceived sys-
tem benefits (Barley 1990, Burkhardt and Brass 1990,
DeLone and McLean 2003). We would hypothesize
even stronger effects for voluntary systems; however,
our data cannot address such generalizations, and
they await future empirical testing. Another limita-
tion of our research is the use of perceptual measures,
including our dependent variables of perceived infor-
mation quality and perceived task impact. While our
network measures came from different sources (i.e.,
in-degree centrality) and our unit-level measures of
success came from supervisors, there is a possibility
of consistency biases in reporting relationships among
perceptual measures obtained from the same source.
Hence, our findings share the shortcomings of most
survey research. We did not validate our perceptual
data with actual usage because we felt that the usage
data was task contingent and not a particularly valid
proxy for implementation success. The actual time
that an employee was logged on the system might
reflect task requirements and time spent logged on
but not in use; and extended periods might reflect
problems using the system as well as nonproblematic
use. Nevertheless, we asked two senior members of
the ERP implementation team to rank the responding
units based on their own perceptions of implemen-
tation success among the units. Their ranking of the
Cop
yright:
INFORMS
holds
cop
yr
ight
to
this
Ar
ticles
in
Adv
ance
version,
which
is
made
av
ailab
le
to
subscr
ibers
.
The
file
ma
y
not
be
posted
on
an
y
other
w
ebsite
,
including
the
author’
s
site
.
Please
send
an
y
questions
regarding
this
policy
to
per
missions@inf
or
ms
.org.

Sasidharan et al.:
The Effects of Social Network Structure on Enterprise Systems Success
Information Systems Research, Articles in Advance, pp. 1–21, © 2011 INFORMS
15
best- and worst-performing units matched the results
obtained through our surveys. Of course, this does
not substitute for objective data but provides one indi-
cator of the validity of our perceptual data. Gener-
alizations are also limited by our particular sample
and setting. Our research was limited to a public uni-
versity setting. Our sample size, particularly at the
unit level, and our statistical tests were limited by
attrition over the course of the longitudinal study.
While a large sample is always preferable, we were
able to obtain significant results despite the small
numbers.
In our 3-level HLM, centralization is specified as
time-independent. However, in the 2-level HLM, cen-
tralization is specified as time-dependent. We were
compelled to do so because in the 3-level HLM, the
critical focus is on the time-dependent network char-
acteristics of the individual and the interactions (i.e.,
cross-level effects) between these and the unit-level
centralization. Because unit-level characteristics are
at Level 3, we treat unit centralization as a Level
3 variable, all of which are time-independent. But
in the 2-level HLM, we treat unit centralization as
the Level 1 time-dependent measure and the unit
size as the time-independent measure. This had to be
done because all the predictors are at the unit level
and centralization; centralization makes a stronger
candidate for being a time-dependent Level 1 vari-
able than unit size. Without this differing treatment
of unit centralization, we could not have developed
the 2-level model for unit effects—a limitation in a
study.
Our analyses were also limited by the absence
of preimplementation network data, thus we cannot
determine if the network changed as a function of the
new system (Burkhardt and Brass 1990). Unlike their
study of power, we focused our research on the advice
network regarding the ERP system, rather than the
more general network structure prior to the change.
Our motivation was to understand how this informal
network of information sharing affected implementa-
tion success beyond training and self-efficacy, rather
than to determine if the network changed and how
changes might affect power. Although we have no
data to confirm this, we suspect that the Phase 1 net-
work data probably reflect the pre-existing advice net-
works to some extent because they were obtained at
the time of the initial “roll-out” of the system. Nev-
ertheless, the lack of data on pre-existing networks is
a limitation of our study. Our findings indicated that
unit size, that is the number of employees in a unit
did not significantly influence implementation out-
comes, but the variance in unit size for this sample
of units (between 5 and 15 employees) was relatively
low, hence the effects due to larger unit sizes have to
be tested.
Implications for Research
While training is useful in learning basic procedures
to use the system and in developing self-efficacy
beliefs, our study indicates that post-training learning
via social relationships is important for the postim-
plementation success of enterprise systems. In addi-
tion to providing valuable content, preimplemen-
tation training might affect network relationships
that enhance postimplementation learning. Future
research should investigate the effect of various train-
ing strategies (training everyone vs. training repre-
sentatives) on network patterns, subsequent learning,
and implementation success. From a training perspec-
tive, our research adds to increasing calls to extend
training research by incorporating the effects of user
learning after formal training is completed (Gallivan
et al. 2005, Haggerty and Compeau 2002, Kang and
Santhanam 2003).
We did not specifically identify the content of
knowledge but instead analyzed patterns of exchange
on technical and job-related information. However,
research has shown that knowledge can be cate-
gorized into types such as know-why, know-what,
know-how, etc. (Garud 1997, Lee and Strong 2003).
Researchers emphasize that certain types of knowl-
edge, such as strategic know-why knowledge, are
more critical in the appropriation of complex tech-
nologies (Sanchez 1996). Hence, another area for
future research is to study information exchanges to
determine what types of knowledge are exchanged
most often. Another research avenue would be to
relate these knowledge exchanges to technology fea-
tures so as to understand what technology features
are appropriated at specific phases of postimplemen-
tation (Jasperson et al. 2005).
From a network perspective, our study is among
the first to illustrate the importance of unit-level
centralization. Future research could examine other
network characteristics such as the nature of ties
in facilitating implementation success. Research sug-
gests that if the information to be transferred is
highly complex, the close, reciprocal binding relation-
ships indicated by strong ties would be more con-
ducive to effective knowledge transfer than the occa-
sional interactions of weak ties (Hansen 1999, Uzzi
and Lancaster 2003). However, weak ties have been
found to be useful in searches for information and in
providing diverse, nonredundant information (Brass
et al. 2004, Hansen 1999). For example, weak ties
might be important for determining who knows what
(Borgatti and Cross 2003), while strong ties might
be necessary for the actual transfer of noncodifiable
knowledge.
We focused on technology-related information net-
works. Future research might examine the role played
by other networks, such as friendship networks, in
Cop
yright:
INFORMS
holds
cop
yr
ight
to
this
Ar
ticles
in
Adv
ance
version,
which
is
made
av
ailab
le
to
subscr
ibers
.
The
file
ma
y
not
be
posted
on
an
y
other
w
ebsite
,
including
the
author’
s
site
.
Please
send
an
y
questions
regarding
this
policy
to
per
missions@inf
or
ms
.org.

Sasidharan et al.:
The Effects of Social Network Structure on Enterprise Systems Success
16
Information Systems Research, Articles in Advance, pp. 1–21, © 2011 INFORMS
influencing system success. While we might assume
that users will seek out experts on the technology,
we might find that users first turn to their friends
for help in implementing the new system. In attempt-
ing to avoid the possible embarrassment of ask-
ing a “stupid” question to an expert, we suspect
that frustrated users often turn to their friends for
help. Network centrality in the friendship network
might interact with expertise to predict implementa-
tion success.
Like most network studies, ours investigated the
effects of existing networks on organizational out-
comes. While we know that homophily (interaction
with similar others), technology, and proximity affect
network structures (Brass et al. 2004), less is known
about how to foster or change network interactions.
For example, our findings suggest that decentralized
patterns of interaction within units are conducive
to implementation success. Yet, we know very little
about how to promote such patterns. Future research
needs to investigate the effects of various interven-
tions on network interactions.
Implications for Practice
Our study focused on ERP systems, but our findings
could apply to the management of implementation
of any other integrated or collaborative systems that
are used by a large number of employees. Project
managers must be aware that it is not only knowl-
edge of the system gathered during training, but
also knowledge gained via social information trans-
fers in the workplace that influence implementation
success. The importance of project management in
the implementation of complex enterprise systems
has been noted, but our findings go a step further
and show that project managers must pay atten-
tion to the social context and structures in organi-
zations. If centralized units can be identified early,
they could be subject to more extensive monitoring
during implementation, and management could pro-
vide opportunities for decentralized social interac-
tion in the form of management retreats, discussion
forums, and electronic bulletin boards. Formal train-
ing programs could be used to foster employee rela-
tionships and help them understand who knows what
(Borgatti and Cross 2003, Sharma and Yetton 2007)
rather than the often-used centralized approach of
training one key person in each unit and hoping that
person can motivate and teach other employees in the
unit. Our study suggests that it might be more effec-
tive to include all employees for training and give
them considerable time for informal interaction, dis-
cussion, and knowledge sharing during the training
program. Providing more opportunities to build con-
nections during training might facilitate postimple-
mentation interactions, decentralized unit structures,
and implementation success.
At the individual level, centrally located employees
perceive greater value in the enterprise system, par-
ticularly when they are located in centralized units.
Based on these findings, project managers might be
tempted to identify central employees for special
training in hopes of efficient diffusion of informa-
tion. As noted above, such a strategy encourages
centralized unit structures. Although it might be ben-
eficial for a particular individual, it hinders unit suc-
cess. An alternative, more useful strategy, might be
for project managers to identify peripheral actors and
move them into the mainstream interactions (e.g.,
adding them to project teams or discussion groups),
thereby increasing their centrality while simultane-
ously promoting more decentralized unit structures.
Overall, our research suggests that if organizations
want to maximize knowledge sharing and informa-
tion quality, they should first focus on social activities
that increase in-degree centrality and an individ-
ual’s self-efficacy while promoting organizational unit
decentralization.
Conclusion
IS researchers have expended considerable effort in
developing technology adoption models but have
devoted far less time to understanding postimple-
mentation behaviors (Jasperson et al. 2005). In par-
ticular, the previously mixed and conflicting results
on organizational reports of postimplementation suc-
cess of enterprise systems might be explained through
attention to unit social structures and learning via
social interaction: the social capital of both indi-
viduals and groups. Organizations must pay atten-
tion to employees’ relationships, interactions, and
information exchanges if they want to reap success
from implementing complex technologies. Our find-
ings endorse a more holistic, longitudinal approach to
examining organizational-level and individual-level
impacts concomitantly.
Acknowledgments
The authors thank the many members of the University
of Kentucky community for helping complete the project,
including the employees who patiently responded to the
survey questions three times. In particular, the authors
thank Dr. Phyllis J. Nash, who was the director of the Enter-
prise System Implementation project, for her full support
and enthusiasm, without which this project could not have
started. They also thank Dr. David Hardison, the project
manager, for sharing information on the implementation
strategy and process. The authors thank Mr. Marc Mathews,
who was the financial controller, for helping us tremen-
dously in the data collection process. Finally, the authors
express our appreciation for the constructive help provided
by the reviewers, the associate, and senior editor for work-
ing to get the manuscript to this publication status.
Cop
yright:
INFORMS
holds
cop
yr
ight
to
this
Ar
ticles
in
Adv
ance
version,
which
is
made
av
ailab
le
to
subscr
ibers
.
The
file
ma
y
not
be
posted
on
an
y
other
w
ebsite
,
including
the
author’
s
site
.
Please
send
an
y
questions
regarding
this
policy
to
per
missions@inf
or
ms
.org.

Sasidharan et al.:
The Effects of Social Network Structure on Enterprise Systems Success
Information Systems Research, Articles in Advance, pp. 1–21, © 2011 INFORMS
17
Appendix 1. Measures
Measurement of Information Quality at the Individual
Employee/Organizational Unit Level
1
The IRIS-SAP-FI system provides the precise information
that (I/my work unit) need(s).
2
The IRIS-SAP-FI system provides output
that is exactly what (I/my work unit) need(s).
3
The IRIS-SAP-FI system provides (me/my work unit) with sufficient
information to do (my/our) tasks.
4
The IRIS-SAP-FI system has errors in the program
that (I have/my work unit has) to work around.
5
(I am/My work unit is) satisfied with the accuracy of the
IRIS-SAP-FI system.
6
The output options (formatting, print type etc.) of the IRIS-SAP-FI
system are sufficient for (my/my work unit’s) use.
Measurement of Task/Work Impact at the Individual
Employee/Organizational Unit Level
1
The IRIS-SAP-FI system helps (me/my work unit) create new ideas.
2
The IRIS-SAP-FI system helps (me/my work unit) meet client needs.
3
The IRIS-SAP-FI system allows (me/my work unit) to accomplish
more work than would otherwise be possible.
4
The IRIS-SAP-FI system (saves me time/allows my work
unit to save time).
5
The IRIS-SAP-FI system increases
(my productivity/the productivity of my work unit).
6
The IRIS-SAP-FI system helps (me/my work unit)
come up with new ideas.
7
The IRIS-SAP-FI system helps (me/my work unit)
try out innovative ideas.
8
The IRIS-SAP-FI system improves client satisfaction.
Measurement of Control Variables
Measure
Items
Computer self-
I could complete my job using the
efficacy
1
IRIS-SAP-FI system
0 0 0
0 0 0 if there was no one around to tell me what to do.
0 0 0 if I had only the training manuals for reference.
0 0 0 if I had seen someone else using it before
trying it myself.
0 0 0 if I could call someone for help if I got stuck.
0 0 0 if someone else had helped me get started.
0 0 0 if I had a lot of time to complete the job.
Ease of use
2
My interaction with the IRIS-SAP-FI system is clear
and understandable.
Interacting with the IRIS-SAP-FI system does not
require a lot of my mental effort.
I find it easy to get the IRIS-SAP-FI system to
do what I want it to do.
I find the IRIS-SAP-FI system to be easy to use.
Involvement
To what extent have you been involved in the
design of the IRIS-SAP-FI system?
1
Adapted from Venkatesh (2000).
2
Adapted from Venkatesh and Davis (2000).
Appendix 2. Validity and Reliability Factor
Loadings of Constructs
Measure
Items
Loadings
Information quality
The IRIS-SAP-FI system provides the
precise information that I need.
0
084
The IRIS-SAP-FI system provides output
that is exactly what I need.
0
081
The IRIS-SAP-FI system provides me
with sufficient information to do my
tasks.
0
078
The IRIS-SAP-FI system has errors in the
program that I have to work around.
0
075
I am satisfied with the accuracy of the
IRIS-SAP-FI system.
0
078
The output options (formatting, print
type, etc.) of the IRIS-SAP-FI system
are sufficient for my use.
0
069
Computer
self-efficacy
I could complete my job using the
IRIS-SAP-FI system
0 0 0
0 0 0 if there was no one around to tell me
what to do.
0
086
0 0 0 if I had only the training manuals for
reference.
0
083
0 0 0 if I had seen someone else using it
before trying it myself.
0
086
0 0 0 if I could call someone for help if I got
stuck.
0
084
0 0 0 if someone else had helped me get
started.
0
085
0 0 0 if I had a lot of time to complete the
job.
0
082
Ease of use
My interaction with the IRIS-SAP-FI
system is clear and understandable.
0
079
Interacting with the IRIS-SAP-FI system
does not require a lot of my mental
effort.
0
082
I find it easy to get the IRIS-SAP-FI
system to do what I want it to do.
0
084
I find the IRIS-SAP-FI system to be easy
to use.
0
086
Task impact
The IRIS-SAP-FI system helps me create
new ideas.
0
068
The IRIS-SAP-FI system helps me meet
client needs.
0
078
The IRIS-SAP-FI system allows me to
accomplish more work than would
otherwise be possible.
0
081
The IRIS-SAP-FI system saves my time.
0
082
The IRIS-SAP-FI system increases my
productivity.
0
085
The IRIS-SAP-FI system helps me come
up with new ideas.
0
081
The IRIS-SAP-FI system helps me try out
innovative ideas.
0
069
The IRIS-SAP-FI system improves client
satisfaction.
0
075
To what extent have you been involved in
the design of the IRIS-SAP-FI system?
0
094
Reliability of Constructs
Measure
Cronbach’s alpha
Information quality
0
089
Task impact
0
090
Computer self-efficacy
0
092
Ease of use
0
086
Cop
yright:
INFORMS
holds
cop
yr
ight
to
this
Ar
ticles
in
Adv
ance
version,
which
is
made
av
ailab
le
to
subscr
ibers
.
The
file
ma
y
not
be
posted
on
an
y
other
w
ebsite
,
including
the
author’
s
site
.
Please
send
an
y
questions
regarding
this
policy
to
per
missions@inf
or
ms
.org.

Sasidharan et al.:
The Effects of Social Network Structure on Enterprise Systems Success
18
Information Systems Research, Articles in Advance, pp. 1–21, © 2011 INFORMS
Appendix 3. Correlations at the Individual Employee Level
Correlations and Intercorrelations (Pearson’s) at the Individual Employee Level (Phase 1)
1
2
3
4
5
6
7
8
1
Involvement
1
2
Training
0
010
1
3
Self efficacy
0
003
0
004
1
4
Ease of use
−0003
0
014
0
015
∗
1
5
In-degree
−0006
0
013
0
014
0
015
∗
1
6
Betweenness
−0001
0
015
∗
0
024
∗∗
0
027
∗∗
0
047
∗∗
1
7
Information quality
0
000
0
004
0
014
∗
0
022
∗∗
0
032
∗∗
35
∗∗
1
8
Task impact
0
005
0
012
0
026
∗∗
0
020
∗∗
0
036
∗∗
40
∗∗
0
037
∗∗
1
∗
Correlations significant at the 0
005 level;
∗∗
correlations significant at the 0
001 level.
Correlations and Intercorrelations (Pearson’s) at the Individual Employee Level (Phase 2)
1
2
3
4
5
6
7
8
1
Involvement
1
2
Training
0
009
1
3
Self efficacy
0
001
0
016
∗
1
4
Ease of use
0
005
0
011
0
017
∗
1
5
In-degree
−0003
0
020
∗
0
021
∗
0
015
1
6
Betweenness
−0004
0
024
∗∗
0
023
∗∗
23
∗∗
0
050
∗∗
1
7
Information quality
−0003
0
016
∗
0
022
∗∗
27
∗∗
0
040
∗∗
0
041
∗∗
1
8
Task impact
−0003
0
012
0
027
∗∗
0
019
∗
0
040
∗∗
38
∗∗
0
050
∗∗
1
∗
Correlations significant at the 0
005 level;
∗∗
correlations significant at the 0
001 level.
Correlations and Intercorrelations (Pearson’s) at the Individual Employee Level (Phase 3)
1
2
3
4
5
6
7
8
1
Involvement
1
2
Training
0
011
1
3
Self-efficacy
0
001
0
008
1
4
Ease of use
0
005
0
005
0
017
∗
1
5
In-degree
−0001
0
022
∗∗
0
022
∗∗
0
014
1
6
Betweenness
0
007
0
027
∗∗
0
025
∗∗
0
028
∗∗
0
050
∗∗
1
7
Information quality
0
001
0
019
∗
0
022
∗∗
0
029
∗∗
0
042
∗∗
0
040
∗∗
1
8
Task impact
−0004
0
017
∗
0
028
∗∗
0
019
∗
0
045
∗∗
0
039
∗∗
0
051
∗∗
1
∗
Correlations significant at the 0
005 level;
∗∗
correlations significant at the 0
001 level.
Appendix 4. Correlations at the Organizational
Unit Level
Correlations (Spearman’s) at the Organizational Unit Level (Phase 1)
1
2
3
4
1
Unit size
1
2
Centralization
−0008
1
3
Information quality
−0011
−0027
1
4
Work impact
−0001
−0053
∗∗
0
047
∗
1
Correlations (Spearman’s) at the Organizational Unit Level (Phase 2)
1
2
3
4
1
Unit size
1
2
Centralization
0
025
1
3
Information quality
−0026
−0024
1
4
Work impact
0
010
−0029
0
072
∗∗
1
Correlations (Spearman’s) at the Organizational Unit Level (Phase 3)
1
2
3
4
1
Unit size
1
2
Centralization
0
017
1
3
Information quality
−0034
−0034
1
4
Work impact
−0002
−0033
0
077
∗∗
1
∗
Correlations significant at the 0
005 level;
∗∗
correlations significant at the
0
001 level.
References
Adler, P., S. Kwon. 2002. Social capital: Prospects for a new concept.
Acad. Management Rev. 27(1) 17–40.
Amoako-Gyampah, K., A. Salam. 2004. An extension of the technol-
ogy acceptance model in an ERP implementation environment.
Inform. Management 41(6) 731–745.
Ang, S., S. Slaughter, K. Ng. 2002. Human capital and institutional
determinants of information technology compensation: Mod-
eling multilevel and cross-level interactions. Management Sci.
48
(11) 1427–1445.
Cop
yright:
INFORMS
holds
cop
yr
ight
to
this
Ar
ticles
in
Adv
ance
version,
which
is
made
av
ailab
le
to
subscr
ibers
.
The
file
ma
y
not
be
posted
on
an
y
other
w
ebsite
,
including
the
author’
s
site
.
Please
send
an
y
questions
regarding
this
policy
to
per
missions@inf
or
ms
.org.

Sasidharan et al.:
The Effects of Social Network Structure on Enterprise Systems Success
Information Systems Research, Articles in Advance, pp. 1–21, © 2011 INFORMS
19
Argote, L., P. Ingram. 2000. Knowledge transfer: A basis for compet-
itive advantage in firms. Organ. Behav. Human Decision Process
82
(1) 150–169.
Argote, L., B. McEvily, R. Reagans. 2003. Managing knowledge in
organizations: An integrative framework and review. Manage-
ment Sci. 49(4) 571–582.
Argote, L., P. Ingram, J. Levine, R. Moreland. 2000. Introduction—
Knowledge transfer in organizations: Learning from the expe-
rience of others. Organ. Behav. Human Decision Process 82(1) 1–8.
Au, N., E. Ngai, T. Cheng. 2008. Extending the understanding
of end-user information systems satisfaction formation: An
equitable needs fulfillment model approach. MIS Quart. 32(1)
43–66.
Bailey, J., S. Pearson. 1983. Development of a tool for measuring and
analyzing computer user satisfaction. Management Sci. 29(5)
530–545.
Barker, T., M. Frolic. 2003. ERP implementation failure—A case
study. Inform. Systems Management 20(4) 43–50.
Barley, S. 1986. Technology as an occasion for structuring: Evidence
from observations of CT scanners and the social order of radi-
ology departments. Admin. Sci. Quart. 31(1) 78–108.
Barley, S. 1990. The alignment of technology and structure through
roles and networks. Admin. Sci. Quart. 35(1) 61–103.
Bhattacherjee, A. 2001. Understanding information systems contin-
uance: An expectation-confirmation model. MIS Quart. 25(3)
351–369.
Bhattacherjee, A., G. Premkumar. 2004. Understanding changes
in belief and attitude toward information technology usage:
A theoretical model and longitudinal test. MIS Quart. 28(2)
229–254.
Borgatti, S., R. Cross. 2003. A relational view of information seeking
and learning in social networks. Management Sci. 49(4) 432–445.
Borgatti, S., P. Foster. 2003. The network paradigm in organizational
research: A review and typology. J. Management 29(9) 991–1013.
Borgatti, S., M. Everett, L. Freeman. 2002. Ucinet 6 for Windows:
Software for Social Network Analysis. Analytic Technologies,
Harvard, MA.
Borgatti, S., A. Mehra, D. J. Brass, G. Labianca. 2009. Network anal-
ysis in the social sciences. Sci. 323(5916) 892–895.
Boudreau, M., D. Robey. 2005. Enacting integrated information
technology: A human agency perspective. Organ. Sci. 16(1)
3–18.
Boudreau, M., L. Seligman. 2005. Quality of use of a complex tech-
nology: A learning-based model. J. Organ. End User Comp. 17(4)
1–22.
Brass, D. 1984. Being in the right place: A structural analysis of
individual influence in an organization. Admin. Sci. Quart. 29(4)
518–539.
Brass, D. 1995. A social network perspective on human resources
management. G. Ferris, ed. Research in Personnel and Human
Resources Management. JAI Press, Greenwich, CT, 39–79.
Brass, D. 2012. A social network perspective on organizational psy-
chology. S. Kozlowski, ed. The Oxford Handbook of Organiza-
tional Psychology. Oxford University Press, UK, Forthcoming.
Brass, D. J., M. Burkhardt. 1993. Potential power and power use:
An investigation of structure and behavior. Acad. Management J.
36
(3) 441–470.
Brass, D., J. Galaskiewicz, H. Greve, W. Tsai. 2004. Taking stock
of networks and organizations: A multilevel perspective. Acad.
Management J. 47(6) 795–819.
Brown,
J.,
P.
Duguid.
1991.
Organizational
learning
and
communities-of-practice: Toward a unified view of working,
learning, and innovation. Organ. Sci. 2(1) 40–51.
Brown, C., I. Vessey. 2003. Managing the next wave of enterprise
systems: Leveraging lessons from ERP. MIS Quart. Executive
2
(1) 65–77.
Burkhardt, M. 1994. Social interaction effects following a technolog-
ical change: A longitudinal investigation. Acad. Management J.
37
(4) 869–898.
Burkhardt, M., D. Brass. 1990. Changing patterns or patterns of
change: The effects of a change in technology on social network
structure and power. Admin. Sci. Quart. 35(1) 104–127.
Burt, R. 1992. Structural Holes. Harvard University Press,
Cambridge, MA.
Burt, R. 2004. Structural holes and good ideas. Amer. J. Sociol. 110(2)
349–399.
Chau, P. 2001. Influence of computer attitude and self-efficacy on
IT usage behavior. J. End User Comp. 13(1) 26–33.
Coleman, J. 1990. Foundations of Social Theory. Harvard University
Press, Cambridge, MA.
Compeau, D., C. Higgins, S. Huff. 1999. Social cognitive theory and
individual reactions to computing technology: A longitudinal
study. MIS Quart. 23(2) 145–158.
Cook, S., J. Brown. 1999. Bridging epistemologies: The generative
dance between organizational knowledge and organizational
knowing. Organ. Sci. 10(4) 381–400.
Cotteleer, M., E. Bendoly. 2006. Order lead-time improvement fol-
lowing enterprise-IT implementation: An empirical study. MIS
Quart. 30(2) 643–660.
Cross, R., J. Cummings. 2004. Tie and network correlates of indi-
vidual performance in knowledge intensive work. Acad. Man-
agement J. 47(6) 928–937.
Damanpour, F. 1991. Organizational innovation: A meta-analysis of
effects of determinants and moderators. Acad. Management J.
34
(3) 555–590.
DeLone, W., E. McLean. 1992. Information success: The quest for
the dependent variable. Inform. Systems Res. 3(1) 60–95.
DeLone, W., E. McLean. 2003. The DeLone and McLean model of
information systems success: A ten-year update. J. Management
Inform. Systems 19(4) 9–30.
DeSanctis, G., M. Poole. 1994. Capturing the complexity in
advanced technology use: Adaptive structuration theory.
Organ. Sci. 5(2) 121–147.
Doll, W., G. Torkzadeh. 1998. Developing a multidimensional mea-
sure of system-use in an organizational context. Inform. Man-
agement 33(4) 171–185.
Edmondson, A., R. Bohmer, G. Pisano. 2001. Disrupted routines:
Team learning and new technology implementation in hospi-
tals. Admin. Sci. Quart. 46(4) 685–716.
Fichman, R. 2004. Going beyond the dominant paradigm for infor-
mation technology innovation research: Emerging concepts
and methods. J. AIS 5(8) 314–355.
Fichman, R., C. Kemerer. 1997. The assimilation of software process
innovations: An organizational learning perspective. Manage-
ment Sci. 43(10) 1345–1363.
Fichman, R., C. Kemerer. 1999. The illusory diffusion of innovation:
An examination of assimilation gaps. Inform. Systems Res. 10(3)
255–275.
Freeman, L. 1979. Centrality in social networks: Conceptual clarity.
Soc. Networks 1 215–239.
Fulk, J. 1993. Social construction of communication technology.
Acad. Management J. 36(5) 921–950.
Gallivan, M. 2001. Organizational adoption and assimilation of
complex technological innovations: Development and appli-
cation of a new framework. DATABASE Adv. Inform. Systems
32
(3) 51–85.
Gallivan, M., V. Spitler, M. Koufaris. 2005. Does IT training really
matter? A social information processing analysis of coworkers’
influence on IT usage in the workplace. J. Management Inform.
Systems 22(1) 153–192.
Cop
yright:
INFORMS
holds
cop
yr
ight
to
this
Ar
ticles
in
Adv
ance
version,
which
is
made
av
ailab
le
to
subscr
ibers
.
The
file
ma
y
not
be
posted
on
an
y
other
w
ebsite
,
including
the
author’
s
site
.
Please
send
an
y
questions
regarding
this
policy
to
per
missions@inf
or
ms
.org.

Sasidharan et al.:
The Effects of Social Network Structure on Enterprise Systems Success
20
Information Systems Research, Articles in Advance, pp. 1–21, © 2011 INFORMS
Garud, R. 1997. On the distinction between know-how, know-
why, and know-what in technological systems. J. Walsh,
A. Huff, eds. Advances in Strategic Management. JAI Press,
Greenwich, CT, 81–101.
Gattiker, T., D. Goodhue. 2005. What happens after ERP implemen-
tation: Understanding the impact of interdependence and dif-
ferentiation on plant-level outcomes. MIS Quart. 29(3) 559–585.
Griffith, T. 1998. Technology features as triggers for sense-making
Acad. Management Rev. 24(3) 472–488.
Haggerty, N., D. Compeau. 2002. A social cognitive view of tech-
nical support and its influence on user learning. Proc. Inter-
nat. Conf. Inform. Systems, Association for Information Systems,
Atlanta.
Hansen, M. 1999. The search-transfer problem: The role of weak
ties in sharing knowledge across organization subunits. Admin.
Sci. Quart. 44(1) 82–111.
Hofmann, D. A., M. B. Gavin. 1998. Centering decisions in hierar-
chical linear models: Implications for research in organizations.
J. Management 24(5) 623–641.
Hsieh, J., W. Wang. 2007. Explaining employees’ extended use
of complex information systems. Eur. J. Inform. Systems 16(3)
216–227.
Ibarra, H., S. Andrews. 1993. Power, social-influence, and sense
making—Effects of network centrality and proximity on
employee perceptions. Admin. Sci. Quart. 38(2) 277–303.
Ibarra, H., M. Kilduff, W. Tsai. 2005. Zooming in and out: Connect-
ing individuals and collectivities at the frontiers of organiza-
tional network research. Organ. Sci. 16(4) 359–371.
Igbaria, M., J. Iivari. 1995. The effects of self-efficacy on computer
usage. Omega 23(6) 587–605.
Jacobs, F., E. Bendoly. 2003. Enterprise resource planning: Devel-
opments and directions for operations management research.
Eur. J. Oper. Res. 146(2) 233–240.
Jasperson, J., P. Carter, R. Zmud. 2005. A comprehensive concep-
tualization of post-adoptive behaviors associated with infor-
mation technology enabled work systems. MIS Quart. 29(3)
525–557.
Kang, D., R. Santhanam. 2003. A longitudinal field study of training
practices in a collaborative application environment. J. Manage-
ment Inform. Systems 20(3) 257–281.
Klein, K., F. Dansereau, R. Hall. 1994. Levels issues in theory devel-
opment, data collection, and analysis. Acad. Management Rev.
19
(2) 195–229.
Kilduff, M., D. Brass. 2010. Organizational social network research:
Core ideas and key debates. J. Walsh, A. Brief, eds. Academy of
Management Annuals, Vol. 4. Routledge, New York, 317–357.
Krackhardt, D. 1994. Graph theoretic dimensions of informal orga-
nization. K. Carley, M. Prietula, eds. Computational Organiza-
tional Theory. Lawrence Erlbaum, Hillsdale, NJ, 89–111.
Krackhardt, D., K. Carley. 1998. A PCANS model of structure in
organizations. Proc. 1998 Internat. Sympos. Command and Control
Res. Tech., Monterey, CA.
Lave, J., E. Wenger. 1991. Situated Learning: Legitimate Peripheral Par-
ticipation. Cambridge University Press, Cambridge, UK.
Lee, W., D. Strong. 2003. Knowing-why about data processes and
data quality. J. Management Inform. Systems 20(3) 13–39.
Levine, J., E. Higgins, H. Choi. 2000. Development of strategic
norms in groups. Organ. Behav. Human Decision Process 82(1)
88–101.
Leonard-Barton, D. 1988. Implementation as mutual adaptation of
technology and organization. Res. Policy 17(5) 251–267.
Mabert, V., A. Soni, M. Venkataramanan. 2000. Enterprise resource
planning survey of US manufacturing firms. Production Inven-
tory Management J. 41(2) 52–58.
Markus, L., C. Tanis. 1999. The enterprise experience: From adop-
tion to success. R. Zmud, ed. Framing the Domains of IT Manage-
ment Research: Glimpsing the Future Through the Past. Pinnaflex
Educational Resources, Inc., Cincinnati, OH.
Mehra, A., M. Kilduff, D. Brass. 2001. The social networks of
high and low self-monitors: Implications for workplace perfor-
mance. Admin. Sci. Quart. 46(2) 121–146.
Mithas, S., N. Ramasubbu, M. Krishnan, C. Fornell. 2007. Design-
ing web sites for customer loyalty across business domains: A
multilevel analysis. J. Management Inform. Systems 23(3) 97–127.
Moreland, R., L. Myaskovsky. 2000. Exploring the performance
benefits of group training: Transactive memory or improved
communication? Organ. Behav. Human Decision Process 82(1)
117–133.
Nah, F., J. Lau, J. Kuang. 2001. Critical factors for succesful imple-
mentation of enterprise systems. Bus. Process Management J. 7(3)
285–291.
Nahapiet, J., S. Ghoshal. 1998. Social capital, intellectual capital
and the organizational advantage. Acad. Management Rev. 23(2)
242–266.
Obstfeld, D. 2005. Social networks, the tertius iungens orienta-
tion, and involvement in innovation. Admin. Sci. Quart. 50(1)
100–130.
Orlikowski, W. J. 1996. Improvising organizational transformation
over time: A situated change perspective. Inform. Systems Res.
7
(1) 63–92.
Orlikowski, W. J. 2000. Using technology and constituting struc-
tures: A practice lens for studying technology in organizations.
Organ. Sci. 11(4) 404–428.
Pawlowski, S., D. Robey. 2004. Bridging user organizations: Knowl-
edge brokering and the work of information technology pro-
fessionals. MIS Quart. 28(4) 645–672.
Petter, S., W. DeLone, E. McLean. 2008. Measuring information sys-
tems success: models, dimensions, measures, and interrelation-
ships. Eur. J. Inform. Systems 17(3) 236–263.
Purvis, R., V. Sambamurthy, R. Zmud. 2001. The assimilation of
knowledge platforms in organizations: An empirical study.
Organ. Sci. 12(2) 117–135.
Rai, A., S. Lang, R. Welker. 2002. Assessing the validity of IS suc-
cess models: An empirical test and theoretical analysis. Inform.
Systems Res. 13(1) 50–69.
Raudenbush, S., A. Bryk. 2002. Hierarchical Linear Models: Applica-
tions and Data Analysis Methods. Sage, Newbury Park, CA.
Raudenbush, S., A. Bryk, Y. Cheong, R. Congdon, M. Toit. 2004.
HLM 6: Hierarchical Linear and Nonlinear Modeling. Scientific
Software, Lincolnwood, IL.
Ravichandran, T. 2005. Organizational assimilation of complex tech-
nologies: An empirical study of component-based software
development. IEEE Trans. Engrg. Management 52(2) 249–268.
Reagans, R., E. Zuckerman, B. McEvily. 2004. How to make the
team: Social networks vs. demography as criteria for designing
effective teams. Admin. Sci. Quart. 49(1) 101–133.
Reilly, K. 2007. AMR research releases enterprise applications
market sizing reports. Accessed May 2010, http://www.amr
-research.com/Content/View.aspx?pmillid=20564.
Robey, D., J. Ross, M. Boudreau. 2002. Learning to implement enter-
prise systems: An exploratory study of the dialectics of change.
J. Management Inform. Systems 19(1) 17–46.
Robbins-Gioia. 2002. Accessed May 2010, Press-releases. http://
www.robbinsgioia.com/news_events/012802_erp.aspx.
Rogers, E., D. Kincaid. 1981. Communication Networks: Toward a New
Paradigm for Research. Free Press, New York.
Ross, J., M. Vitale. 2000. The ERP revolution: Surviving versus thriv-
ing. Inform. Systems Frontiers 2(2) 233–241.
Sanchez, R. 1996. Strategic product creation: Managing new inter-
actions of technology, markets, and organizations. Eur. Man-
agement J. 4(2) 121–138.
Cop
yright:
INFORMS
holds
cop
yr
ight
to
this
Ar
ticles
in
Adv
ance
version,
which
is
made
av
ailab
le
to
subscr
ibers
.
The
file
ma
y
not
be
posted
on
an
y
other
w
ebsite
,
including
the
author’
s
site
.
Please
send
an
y
questions
regarding
this
policy
to
per
missions@inf
or
ms
.org.

Sasidharan et al.:
The Effects of Social Network Structure on Enterprise Systems Success
Information Systems Research, Articles in Advance, pp. 1–21, © 2011 INFORMS
21
Santhanam, R., L. Seligman, D. Kang. 2007. Post-Implementation
knowledge transfers to users and information technology pro-
fessionals. J. Management Inform. Systems 24(1) 174–203.
Sedera, D., G. Gable, T. Chan. 2004. A factor and structural equa-
tion analysis of the enterprise systems success measurement
model. Proc. 25th Int. Conf. Information Systems, Association for
Information Systems, Atlanta.
Seibert, S., M. Kraimer, R. Liden. 2001. A social capital theory of
career success. Acad. Management J. 44(2) 219–237.
Sharma, R., Y. Yetton. 2007. The contingent effects of training,
technical complexity, and task interdependence on success-
ful information systems implementation. MIS Quart. 31(2)
219–238.
Shaw, M. E. 1964. Communication networks. L. Berkowitz, ed.
Advances in Experimental Social Psychology, Vol. 1. Academic
Press, New York, 111–147.
Somers, T., K. Nelson. 2004. A taxonomy of players and activi-
ties across the ERP project life cycle. Inform. Management 41(3)
257–278.
Swanson, E. 1994. Information systems innovations among organi-
zations. Management Sci. 40(9) 1069–1092.
Sykes, T., V. Venkatesh, S. Gosain. 2009. Model of acceptance with
peer support: A social network perspective to understand
individual-level system use. MIS Quart. 33(2) 371–393.
Szulanski, G. 1996. Exploring internal stickiness: Impediments to
the transfer of best practice within the firm. Strategic Manage-
ment J. 17(Special Issue) 27–43.
Tsai, W. 2001. Knowledge transfer in intraorganizational net-
works: Effects of network position and absorptive capacity on
business unit innovation and performance. Acad. Management J.
44
(5) 996–1004.
Uzzi, B., R. Lancaster. 2003. Relational embeddedness and learning:
The case of bank loan managers and their clients. Management
Sci. 49(4) 383–400.
Venkatesh, V. 2000. Determinants of perceived ease of use: Integrat-
ing perceived behavioral control, computer anxiety and enjoy-
ment into the technology acceptance model. Inform. Systems
Res. 11(4) 342–365.
Venkatesh, V., F. Davis. 2000. A theoretical extension of the technol-
ogy acceptance model: Four longitudinal field studies. Manage-
ment Sci. 46(2) 186–204.
Venkatesh, V., M. Morris, G. Davis, F. Davis. 2003. User acceptance
of information technology: Toward a unified view. MIS Quart.
27
(3) 425–478.
Wang, E., G. Klein, J. Jiang. 2006. ERP Misfit: Country of origin
and organizational factors. J. Management Inform. Systems. 23(1)
263–292.
Wasserman, S., K. Faust. 1994. Social Network Analysis: Methods and
Applications. Cambridge University Press, New York.
West, B., K. Welch, A. Galecki. 2007. Linear Mixed Models. Chapman
and Hall, Boca Raton, FL.
Wynekoop, J., J. Senn. 1992. CASE implementation: The importance
of multiple perspectives. Proc. ACM Special Interest Group on
Comp. Person. Res. Annual Conf., New York, 63–74.
Cop
yright:
INFORMS
holds
cop
yr
ight
to
this
Ar
ticles
in
Adv
ance
version,
which
is
made
av
ailab
le
to
subscr
ibers
.
The
file
ma
y
not
be
posted
on
an
y
other
w
ebsite
,
including
the
author’
s
site
.
Please
send
an
y
questions
regarding
this
policy
to
per
missions@inf
or
ms
.org.
Wyszukiwarka
Podobne podstrony:
THE IMPACT OF SOCIAL NETWORK SITES ON INTERCULTURAL COMMUNICATION
social networks and planned organizational change the impact of strong network ties on effective cha
Ebsco Cabbil The Effects of Social Context and Expressive Writing on Pain Related Catastrophizing
Glińska, Sława i inni The effect of EDTA and EDDS on lead uptake and localization in hydroponically
Understanding the effect of violent video games on violent crime S Cunningham , B Engelstätter, M R
The Effect of Childhood Sexual Abuse on Psychosexual Functioning During Adullthood
Microwave drying characteristics of potato and the effect of different microwave powers on the dried
Harrison C White Status Differentiation and the Cohesion of Social Network(1)
the effect of water deficit stress on the growth yield and composition of essential oils of parsley
The Effect of Back Squat Depth on the EMG Activity of 4 Superficial Hip
71 1021 1029 Effect of Electron Beam Treatment on the Structure and the Properties of Hard
Jack Anderson The effects of embeddeddness on enterpreneurial proccess
the opportunity cost of social relations on the effectiveness of small worlds
The impact of network structure on knowledge transfer an aplication of
76 1075 1088 The Effect of a Nitride Layer on the Texturability of Steels for Plastic Moulds
Curseu, Schruijer The Effects of Framing on Inter group Negotiation
A systematic review and meta analysis of the effect of an ankle foot orthosis on gait biomechanics a
On the Effectiveness of Applying English Poetry to Extensive Reading Teaching Fanmei Kong
więcej podobnych podstron