
STATUS DIFFERENTIATION AND THE COHESION
OF SOCIAL NETWORKS
Matthew S. Bothner, Toby E. Stuart, and Harrison C. White
University of Chicago
Columbia University
This article examines the effects of status differentiation on the cohesion of a
social structure. Using a formal model, we simulate the fates of a hypothetical
cohort of newly hired employees, who are equals in the eyes of their boss and in
the nascent stages of sorting into a status hierarchy. We cast these employees
in a process in which they exert effort, receive public approval from the boss in
exchange, and thus come to fill different places in a status order. We then
consider the circumstances under which these workers cohere as a group and
when, by contrast, differentiation makes cohesion among them unlikely. Our
results show that the extent of the boss’s autonomy in relationship to employees
accounts for this difference in outcomes. Under an autonomous boss, as dif-
ferentiation transpires, status-based social forces break the group of workers
apart. Conversely, when the boss occupies a compromised position, group-level
cohesion coexists with differentiation. Our main contribution is the intuition
that the cohesion-related consequences of status differentiation can sub-
stantially depend on the tie between contestants and their external audience.
We conclude by developing conjectures for empirical research consistent with
our main findings.
Keywords: Status, Cohesion, Inequality, Sociology of markets
1. INTRODUCTION
How does status differentiation affect cohesion? What conditions encou-
rage actors to remain integrated even as they progressively differ in the
functions they perform and the levels of status they achieve? Interest in
this question dates back to the foundations of sociological theory.
Durkheim (1933, 1893), for instance, argued that a set of widely diffused
Direct correspondence to Matthew Bothner, University of Chicago, Graduate School of
Business, 1101 E. 58th Street, Chicago, IL 60637, matthew.bothner@gsb.uchicago.edu
773-834-5953. We thank Ronald Burt, Jeong-han Kang, Wonjae Lee, and Damon Phillips for
useful comments. This work is supported by the Charles E. Merrill Faculty Research Fund
at the University of Chicago Graduate School of Business.
Journal of Mathematical Sociology, 28: 261
7295, 2004
Copyright # Taylor & Francis Inc.
ISSN: 0022-250X print/1545-5874 online
DOI: 10.1080
=00222500490516699
261

beliefs and values is essential for preserving cohesion among occupants of
differentiated social structures. Since then many have noted how rarely
cohesive ties actually exist among those who differ in status, as well as
the importance of shared cultural traits or experiences among differ-
entiated actors if they are to remain connected. The conflict between
differentiation and cohesion is illustrated by Berger’s (1993) insight that
status-different members of a voluntary organization will sit together but
will not socialize outside the group. Similar findings are reported
throughout the organizational sociology literature, such as in Kanter
(1977) and Podolny (1993). It is thus well understood that status-based
social forces often threaten to break the ties between increasingly dif-
ferentiated members of a group, thus putting at risk the survival of the
collectivity.
We extend existing research on status and cohesion by proposing a for-
mal model that specifies the conditions under which the process of status
differentiation between actors precludes cohesion among them and when,
conversely, cohesion endures despite the increasing salience of status dif-
ferences between group members. Consistent with earlier work, which has
traced the likelihood that social actors form a tie to their similarity on a
salient dimension (Lazarsfeld and Merton, 1954; Rogers and Kincaid, 1981),
we consider a social structure cohesive insofar as its members proceed on
parallel pathways as status differentiation unfolds.
Examining the link between differentiation and cohesion is important
because status differences arise in groups of all types (e.g., for adolescent
cliques, Sherif et al., 1955; for street gangs, Whyte, 1943; for bomber crews,
Torrance, 1954; in laboratory task groups, the literature begins with Bales,
1950; for formal models, see Horvath, 1965; Skvoretz, 1981, 1988), and
because differences in status likely make it harder to obtain the perfor-
mance-related advantages of cohesion. Specifically, members of a cohesive
group potentially enjoy many benefits, such as higher motivation (Coleman,
1988; 1990), fewer barriers to interpreting, transferring, and appropriating
the value of information (Baker, 1984; Burt, 2001, 2002), as well as a higher
level of trust and resulting willingness to cooperate (Kanter, 1977;
Granovetter, 1985). Considering the close link between tie strength and
similarity on a visible dimension, we think that, at least in certain contexts,
escalating differences in status are likely to interfere with the maintenance
of cohesion. We therefore aim to distinguish such contexts from those in
which cohesion is more likely to persist.
Using a formal model of markets (White, 1981, 2002), we move toward
that goal by considering a hypothetical cohort of newly hired employees,
who are virtually equals in the eyes of their boss and in the nascent stages
of sorting into a status hierarchy. We cast these employees in a process in
which they exert effort, get public approval from the boss in exchange, and
262
M. S. Bothner et al.

thus come to fill different places in a status order. We then bring into focus
the circumstances under which these workers cohere as a group and when,
by contrast, differentiation makes cohesion among them unlikely.
Our results show that the extent of the boss’s autonomy or bargaining
power (e.g., Coser, 1975; Pfeffer and Salancik, 1978; Burt, 1980) vis-a`-vis
her employees accounts for this difference in outcomes. Under an auto-
nomous boss, as differentiation transpires, status-based social forces break
the group of workers apart. Conversely, when the boss occupies a com-
promised position, group-level cohesion coexists with differentiation. Our
main contribution is the formal result that the cohesion-related con-
sequences of status differentiation depend substantially on the tie between
contestants and their external audience (such as a boss, buyer, critic, or
patron). We do not account for differences in outcomes by turning to
variations in group composition. On the contrary, in our model it is a
condition external to the group that contours the group’s fate, determining
whether or not internal cohesion can last.
Although we later depict the dependence of cohesion on autonomy
analytically, the intuition behind our model is as follows: Under a weakly
autonomous boss,
all employees (even those of low status) are suffi-
ciently well positioned to extract greater rewards from the boss with time.
Under an autonomous boss, however,
only higher status employees are
able to proceed on a positive trajectory; those of lower status (no longer
sheltered by their collective bargaining power) now trend downward
instead, and the different trajectories of workers’ rewards undermines the
cohesion of the group. Therefore, the balance of power between an eva-
luator and his or her subordinates affects the significance (or insignif-
icance) of occupying roles of marginal status and thus governs the time-
dependent cohesion (or dissolution) among those differentially located in
the distribution. In this sense, there is an intuitive link between a group’s
vertical power and where in the status distribution a threshold appears, on
either side of which the time-varying fates of its members diverge. When
the group’s position is strong (the boss’s is weak), this threshold effec-
tively falls beneath the minimum level of status, thereby allowing the
group to cohere. When the group’s position is weak (the boss’s is strong),
the dividing line rises and the evolving fates of low and high status actors
then differ.
We turn next to the specifics of the model, which will allow us to observe
the contingent effects of status differentiation among newly hired
employees. We proceed as parsimoniously as we can, specifying only a few
main assumptions about the boss and her employees. Section 2 presents
the main features of our model, after which we discuss our measure of
cohesion in section 3 and findings in section 4. In section 5, we conclude by
developing conjectures for empirical research consistent with our findings.
Status Differentiation and Cohesion
263

2. THE ELEMENTS OF THE MODEL
2.1 The Boss
The model consists of a boss and three workers. Although at first the boss
observes no quality differences among her employees, distinctions in quality
surface as soon as they start producing. Using data on employees’ pro-
ductivity, the boss updates her view of each of them, an event that launches
an evolving status hierarchy. We assume that a feedback loop operates as
follows: The quality of each worker governs his initial productivity (and
rewards), which then affects his perceived quality or status (Podolny,
1993), which in turn contours his future productivity (and rewards), again
updating the boss’s perceptions, and so the cycle goes on. Therefore, each
employee’s fixed endowment of quality yields a time-varying level of status,
which decouples more or less from the quality endowment with time. The
upshot of this process is that the boss’s evaluations elicit a cycle in which
the most able worker in time delivers a disproportionate amount of utility,
which is also greater than his ability would predict.
The boss judges employees’ productivity (the input for rewards)
according to the following utility schedule:
U
ðy; nÞ ¼ ry
a
n
b
ð1Þ
where
U
ðy; nÞ is the utility the boss derives from y units of productivity by
an employee of quality
n. While y could have many empirical referents, we
equate
y to effort, the amount of time an employee works during an interval
in which the boss appraises the value of his contribution. The entries in the
quality vector
n range from 1 to 2, and correspond to differences in ability
or experience relevant to the boss’s aims. Within
n there are as many
elements as there are workers in the network.
Moving to the other side of Equation (1),
r is a scalar referring to the
attractiveness of all employees as a set. Were
r to rise, the boss would find
the cohort of workers more attractive collectively. Shaping returns to scale
is the exponent
a. When a < 1, for example, utility per unit falls with the
time employees invest in the workplace, so that they face diminishing
returns to effort.
We use
b to depict the level of status differentiation, which rises with
time. Were
b equal to zero, the Cobb7Douglas interaction in Equation (1)
would drop out, denoting the boss’s full innocence of differences in quality.
Consequently, when
b is very low, the workgroup (however briefly) lacks a
pecking order (Chase, 1980) and a correlative system of roles (Nadel, 1957;
White, 1963), and thereby for the moment mirrors a context in which
strangers with no prior social contact deal with each other for the first time
(Berger and Luckmann, 1966).
264
M. S. Bothner et al.

We follow several precedents by viewing this egalitarian state as tem-
porary, and soon to be followed by a progressively more skewed status
order (Bales, 1950). Social systems have shown themselves resistant to
equality, conforming instead to an ‘‘iron law of oligarchy’’ (see, e.g.,
Mayhew and Levinger, 1976). Evolving differences between perceived
quality or status
n
b
and quality
n allow us to speak of an emergent status
hierarchy and examine its effects on the cohesion of the workgroup as a
whole. We specify the unfolding differentiation captured by
b in Equation
(1) so that current ratio of the highest quality employee’s status to that of
his lowest quality rival equals the ratio of their utilities at time
t
1:
1
n
max
n
min
b
¼
U
ðy; n
max
Þ
t
1
U
ðy; n
min
Þ
t
1
ð2Þ
We further assume that the boss gets an equivalent ‘‘deal’’ from all
employees whenever they produce and receive approval. Without equiva-
lent exchanges, we posit that differentiation would be unsustainable, for
the boss would then cede all approval to the employee who offers the best
deal. So, although the boss rewards levels of effort that differ in magnitude,
and that yield different amounts of utility, she still gets the same degree of
utility or satisfaction for every unit of approval she bestows. We designate
this ratio
y, which is a constant ratio of utility U to W, where W signifies the
intangible rewards conveyed by the boss.
2
y
¼
U
ðy; nÞ
W
ðy; nÞ
ð3Þ
The value of
y results mainly from the boss’s autonomy in relation to her
employees. Various scholars have conceived of autonomy (or bargaining
power) as a social actor’s absence of dependence on a particular set of
others (Emerson, 1962; Pfeffer and Salancik, 1978; Burt, 1980; Phillips,
2001). While empirical examples of autonomy are many, an apposite case of
high autonomy is one where the boss can easily outsource the tasks per-
formed by current employees to others, or has already set up a ‘‘dual form’’
(Bradach and Eccles, 1989), in which she relies partly on in-house
employees, and partly on those outside the firm. When the boss has many
ways of reaching her production-related aims, pressure to mete out
intangible rewards to her employees is lower. Conversely, an example of a
1
We thus assume that
n
max
is fixed at 2 and that
n
min
is fixed at 1 and, by extension, that
quality represents a stable trait, not an endowment capable of growth as an employee learns.
2
In this sense, the assumption of a constant ratio of utility
U to rewards W is not only con-
sistent substantively with the sustainability of differentiation. Constancy also makes more
tractable the task of letting the parameters affecting
U, shown in equation (1), shape W, which
we begin deriving in Equation (9).
Status Differentiation and Cohesion
265

low-autonomy boss is one facing workers with many external options (as
was the situation enjoyed by information technology specialists at the
height of the internet era, for instance). Correspondingly, in our model,
when the boss’s autonomy is low, she conveys more approval to employees
in aggregate than their collective utility would predict. And when the boss’s
autonomy is high, she offers them less approval overall than would be
expected given the utility they jointly provide.
We represent the effect of the boss’s autonomy (which in turn affects
effort and approval, as we will show), by the parameter
g. Gamma dilates or
contracts the sum of the employee-level utilities:
V
¼
X
n
U
ðy; nÞ
"
#
g
ð4Þ
We portray low autonomy on the part of the boss by
g > 1, and high
autonomy on her part by
g < 1.
We also assume that total approval employees receive from the boss
equals the sum of each utility raised to gamma:
V
¼
X
n
U
ðy; nÞ
"
#
g
¼
X
n
W
ðy; nÞ ¼ W
ð5Þ
This identity allows us to write
y, the ratio of utility U to approval W, as a
function of gamma. Conceptually, the reliance of
y on g implies that the
experience of the boss when allocating intangibles results from her level of
autonomy in the workplace. Consider, for instance, the level of pleasure (or
consternation) that a leader enjoys (or endures) when rewarding sub-
ordinates on whom she depends minimally (or substantially). When the
boss is highly dependent, it is easy to imagine that her micro-level
experience during each act of dispensing intangibles reflects her low level
of autonomy with respect to her employees at a macro-level.
Although we must formally state further assumptions among employ-
ees before deriving the link between
y, the ratio of utility to approval, and
g, the absence of the boss’s autonomy or bargaining power with respect to
employees, for now we can depict a ‘‘break-even’’ value of theta
y
0
by
using Equations (3) and (5), such that the sum of
U over n raised to
gamma equals the total flow of approval:
V
¼
X
n
U
ðy; nÞ
"
#
g
¼ y
0
X
n
W
ðy; nÞ
"
#
g
¼ y
g
0
W
g
¼ W
ð6Þ
so that:
y
0
¼ W
ð1gÞ=g
ð7Þ
266
M. S. Bothner et al.

2.2 Employees
Shifting to employee-related premises, from which we will derive
y
0
and
other main outcomes, we assume first that employees monitor (through
direct observation) each other’s productivity
y and the approval W( y) they
receive. In our model, they do so to reduce uncertainty about the boss’s
preferences and thus select a level of effort that maximizes the difference
between their costs and rewards. We thus follow other sociological inter-
pretations of market-related conduct in which actors lower uncertainty
about future events by gleaning information from rivals’ prior transactions
(e.g., Podolny, 1994; Stuart, 1998).
We assume that employees are seekers of intangible rewards (approval),
following a decades-old stream of research in organization studies. Much of
the classical work on this topic falls within the ‘‘natural systems’’ view of
organizations (Scott, 1992, pp. 51
775), whose proponents considered non-
pecuniary rewards to be powerful motivators. In an early work, Barnard
(1938) argued that nonmaterial rewards, such as distinction or prestige,
were often more important than financial incentives for the task of growing
commercial organizations. The motivational benefits of the mere attention
of prominent observers then became particularly salient for organizational
scholars after the Hawthorne studies, which documented that workers
exerted more effort simply because they had been singled out for experi-
mental research (Mayo, 1945). Subsequently, as exchange theory took
shape, Homans (1961), too, portrayed people as being driven by the
pursuit of approval.
Approval is also a powerful motivator because it is fungible. When
enough prestige has flowed to a social actor, he or she may then convert
that stock into other resources, such as informal influence (Mills, 1956;
Goode, 1978; Taylor, 1978). Thus, both because of a general human desire
for approval and because approval is an exchangeable social good, we
assume employees to be approval seekers. Consistent with our model, it is
easy to imagine new employees trading effort for approval, which both
offers short-run satisfaction and long-run worth as a currency for exchange.
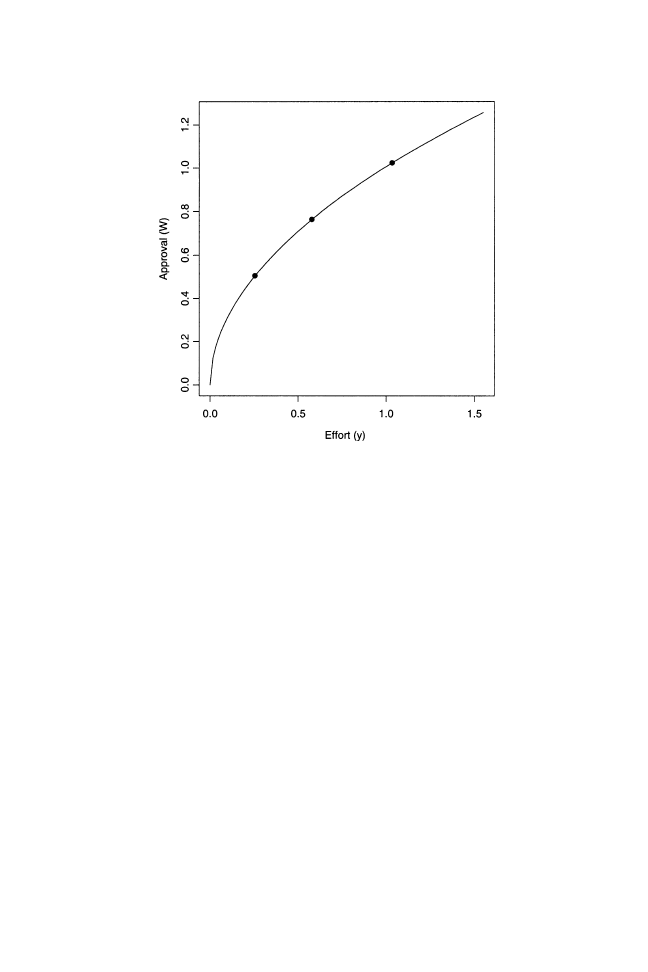
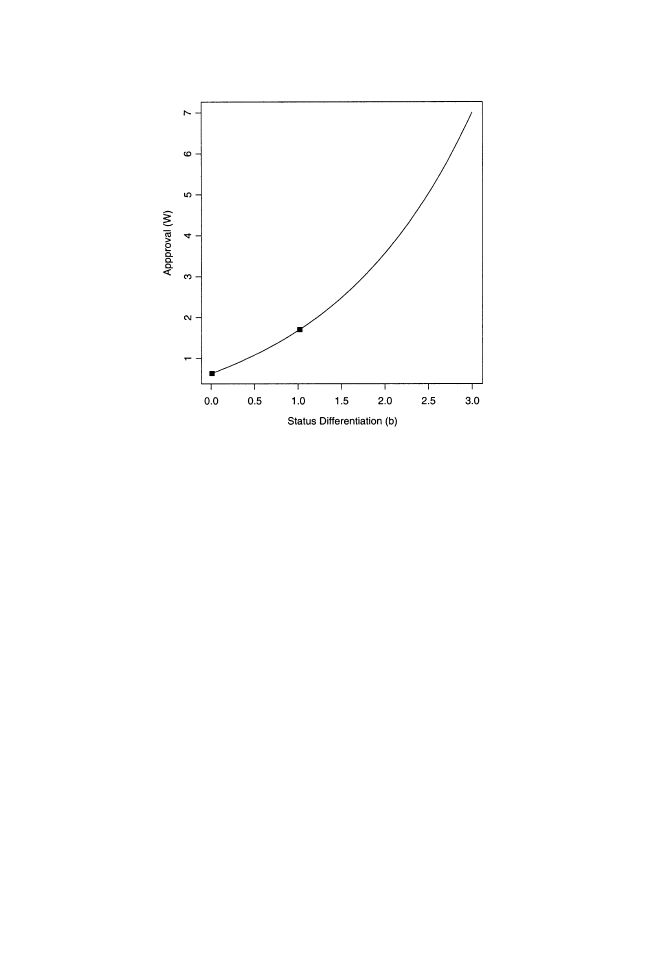
We show a hypothetical approval schedule for three employees in
Figure1, where approval
W( y) is on the vertical axis and effort y is on the
horizontal.
We assume that employees use this sort of function to make decisions
about the effort they should put forth in future rounds in which the boss
evaluates them. The approval schedule offers a collection of possibilities
based on recent levels of effort, which the boss has rewarded and which
employees have observed. Although we make many simplifying assump-
tions (such as signifying effort by a scalar), we think that our claim that
contestants choose a level of effort by collectively making sense of the fates
Status Differentiation and Cohesion
267
of others reasonably represents a main facet of competitive systems in
which the volume of production figures as the central choice variable.
We also assume that employees know their cost schedules and, along
with the profile of (
y,W( y)) pairs, the effort level y that will yield the
highest profit. We depict the cost schedule as follows:
C
ðy; nÞ ¼ qy
c
n
d
ð8Þ
C( y; n) is the cost of producing at level y for an employee of quality n. The
constant
q—the analogue of r in Equation (1)—reflects across-the-board
costs. For instance,
q would rise if working conditions became increasingly
arduous due to relocation or the need to replace an important client. When
c > 1, employees face diseconomies of scale; for c < 1, they face economies;
and for unity, constant returns. And as long as
d
6¼ 0, the entries in n are
coefficients that introduce distinctions in marginal cost. Such variations derive
from differences in underlying levels of aptitude for the demands of the job.
We follow Spence (1974) in assuming that higher quality employees find
it easier to deliver a given level of output. Spence modeled wages as a
function of years of education, which prospective employees finished
FIGURE 1
The relationship between effort
y and the approval employees receive
in exchange for their effort
W( y). The effort levels and rewards for three hy-
pothetical employees are depicted along the approval schedule. Their entries in the
quality vector
n are 1, 1.5, and 2.
268
M. S. Bothner et al.
before the firm chose whether to hire them. Conversely, we consider the
effort employees exert once inside the firm. Nevertheless, just as Spence’s
more talented (prospective) employees complete education at lower cost
(thus letting years of education signal their unobserved quality), our
highest quality employee has the shallowest cost schedule. In other words,
we assume
d < 0.
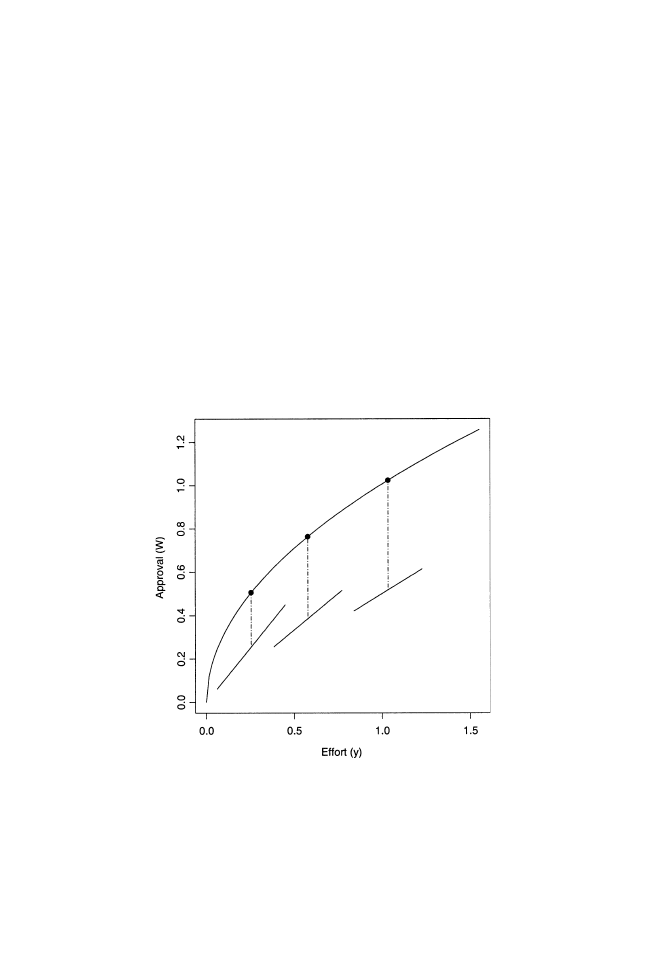
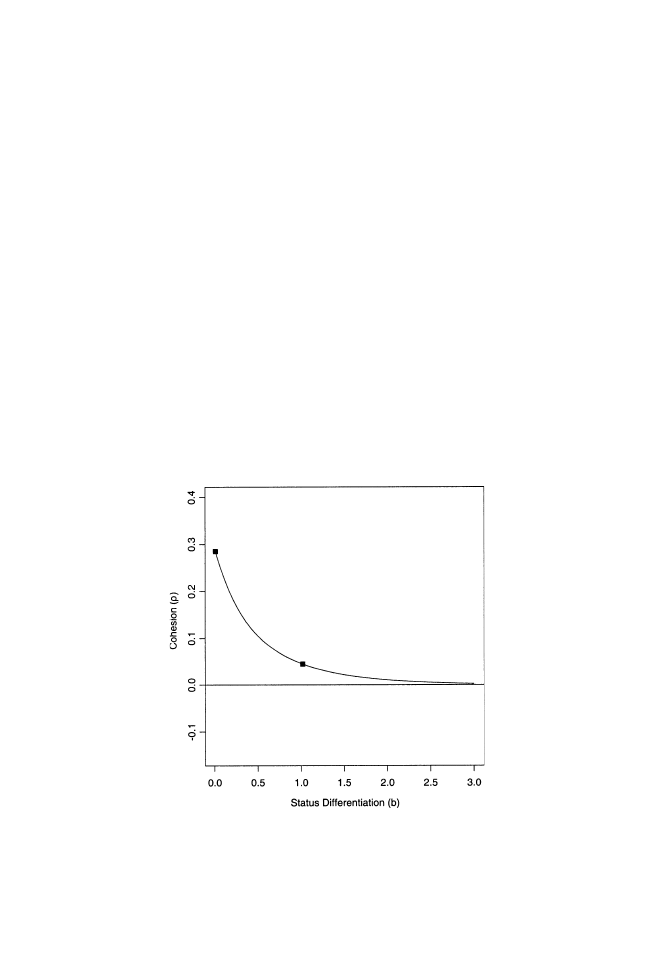
We illustrate this inverse cost-quality relationship by adding cost curves,
C( y; n), to our first plot of rewards against productivity, which we depict in
Figure 2. We make this assumption because of our overarching claim that
initially undetectable differences in ability quickly give rise to distinctions
in status that in turn affect group-level cohesion. The higher productivity
(and rewards) of the most able employee in Figure 2 reflects this. With that
employee’s higher rewards comes a greater divide between him and his
rivals in the status hierarchy, a further monopolization of rewards by the
top contestant, more variance in status, and so on.
FIGURE 2
This plot adds cost schedules,
C( y; n), for each of the three employees
shown in Figure 1. The heights of the vertical segments between the cost curves
and the approval schedule show that employees choose equilibrium levels of effort.
All parameters equal unity in Figures 1 and 2, with the exception of
a
¼ .5, b ¼ .01
and
d
¼ 1. Since d ¼ 1, the lowest quality employee faces the steepest cost
curve, which is evident in the left-most region of Figure 2.
Status Differentiation and Cohesion
269

We build a formal image of this process after deriving the core features
of our model in the next section. We start by deriving the revenue schedule
W( y), turn to equilibrium levels of effort y(n), and then specify the link
between
y
0
and
g.
2.3 Derivations
We derive the function
W( y) from Equations (1), (3) and (8).
3
We start
from our prior claim that employees choose an effort level
y that maximizes
the gap between rewards
W( y) and costs C( y):
@W
@y
¼
@C
@y
¼ cqy
c
1
n
d
ð9Þ
To get
W on the right hand side of Equation (9), we alter Equation (3) to
yield:
U
ðy; nÞ ¼ ry
a
n
b
¼ y
0
W
ðy; nÞ
ð10Þ
which we use to rewrite the quality vector
n as:
n
¼ ðy
0
W
ðy; nÞ=ry
a
Þ
1
=b
ð11Þ
This identity allows us to rewrite Equation (9) as:
@W
@y
¼ cqy
c
1
ðy
0
W
ðy; nÞ=ry
a
Þ
1
=b
h
i
d
ð12Þ
After relabeling
W( y; n) as W for simplicity and collecting terms for the
exponent on
y, the differential equation in Equation (12) takes the form:
ðy
0
W =r
Þ
d=b
@W
¼ cqy
ððbcadÞ=bÞ1
@y
ð13Þ
which we integrate:
Z
ðy
0
W =r
Þ
d=b
@W
¼
Z
cqy
ððbcadÞ=bÞ1
@y
ð14Þ
After manipulating terms, adding a constant of integration
K, and cleaning
up, we have:
W
ðyÞ ¼ ððcqðb dÞ=ðbc adÞÞðy
0
=r
Þ
d=b
y
ðbcadÞ=b
þ K Þ
b=
ðbdÞ
ð15Þ
or more simply:
W
ðyÞ ¼ ðPy
e
þ K Þ
f
ð16Þ
with suitable substitutions for
P, e, and f.
3
Appendices I-III offer more detail on the derivations discussed in this section.
270
M. S. Bothner et al.

Using Equation (16), we now identify optimal levels of productivity as a
function of the other parameters. To do so, we again set marginal rewards
equal to marginal cost as:
@W
@y
¼
@C
@y
, f ðPy
e
þ K Þ
f
1
Pey
e
1
¼ cqy
c
1
n
d
ð17Þ
Setting the constant of integration equal to zero affords a closed form
solution as:
y
¼
cqn
d
efP
f
1
=
ðef cÞ
ð18Þ
or with substitutions for
P, e, and f:
y
¼
n
b
d
cqy
0
ðb dÞ=ðrðbc adÞÞ
1
=
ðcaÞ
ð19Þ
To specify Equation (19) fully, we must also clarify the functional form
of
y
0
, through which the (absence of the) boss’s autonomy
g affects effort y
and approval
W(y). We see from Equation (7) that y
0
is the sum of all
intangible rewards raised to
ð1 gÞ=g: Therefore (as shown more fully in
Appendix III), we apply W(
)from (15) to (19), substitute W
ð1gÞ=g
for
y
0
according to (7), and sum over
n to get
P
n
W
ðy; nÞ ¼ W:
W
¼
r
q
a=c
b=d
a=c
b=d
1
a=c
X
n
n
ðbcadÞ=ðcaÞ
!
1
a=c
2
4
3
5
g=
ð1ag=cÞ
ð20Þ
We then solve for
y
0
according to Equation (7) by raising W to
ð1 gÞ=g,
yielding:
y
0
¼
r
q
a=c
b=d
a=c
b=d
1
a=c
X
n
n
ðbcadÞ=ðcaÞ
!
1
a=c
2
4
3
5
ð1gÞ=ð1ag=cÞ
ð21Þ
Consequently, the utility-per-approval experience of the boss when
rewarding employees follows directly from her autonomy or bargaining
power over them as a whole. When we insert Equation (21) into Equation
(19) as
y
0
the nature of the boss-to-employees tie affects the equilibrium
levels of employees’ effort and the approval they receive.
4
4
Considering further the equations derived thus far yields several additional results. Start-
ing with Equation (21), if
g
¼ 1 then y
0
¼ 1. Under this restricted scenario, the quality levels of
other employees have no effect on a given employee’s level of effort, as equation (19) makes
clear. Equation (19) also shows (as one would expect) that effort is decreasing in cost
q and
increasing in demand
r. Less intuitive are the facts that equilibria are unsustainable if c = a
(returns to scale must differ across cost and utility) or for
b
¼ d (differentiation in status
cannot match differentiation in cost).
Status Differentiation and Cohesion
271

3. MEASURING COHESION
With the preceding equations we devised a measure appropriate for clar-
ifying the effects of status differentiation on the cohesion of a competitive
network. We consider the network cohesive insofar as the approval
accruing to each contestant changes at the same rate with time. When this
is the case, contestants advance (or decline) on parallel tracks. When this
is not the case, contestants move along divergent pathways. Under the
second scenario, as one rival arrogates more of the boss’s approval, another
may find his absolute rewards waning fast, adversely affecting the con-
nectedness of the group.
We extend several lines of earlier research by conceptualizing cohesion
as a function of similarity in time-changing career paths. Various scholars
have noted that similarity is the primary basis for attraction: those with
common traits or experiences are more likely to establish relationships
with each other (e.g., Lazarsfeld and Merton, 1954). Underlying this
process is individuals’ preference for similarity. Although prior investiga-
tions have identified numerous dimensions on which persons may occupy
nearby locations and thus establish social connections (Festinger,
Schacter, and Back, 1950; Rogers and Kincaid, 1981; Marsden, 1988), we
think that similarity of experience in an occupational setting is particu-
larly relevant for a dynamic measure of cohesion. We do so because of the
link prior research has made between homogeneity in career-related
experiences and ease of social interaction (Alderfer, 1987; Ibarra, 1993),
and in light of the fact that many competitive settings are marked by
mutual recognition and esteem among those whose performance exceeds
a socially understood ceiling (e.g., Podolny, 1993, 1994). In our model,
when contestants progress similarly with time, the network they con-
stitute is cohesive. Contestants then see each other as viable incumbents
of the same collectivity and are thus more likely to form durable
relationships.
Consider now the converse state in which contestants move along
markedly different trajectories. Some are now rising in absolute rewards,
others are declining. Under these circumstances, prior research suggests
that cohesion will be difficult to achieve. Specifically, earlier studies
support the contention that the network will be pulled apart from both
the upper and lower reaches of its status hierarchy. Starting with the top
of the status order, the work of several social theorists suggests that
preponderant actors deliberately express (and in some cases codify and
institutionalize) disdain for lower-performing actors in an effort to define
and garner greater rewards for their own position (e.g., Patterson
1991:404-5; Tilly, 1998). Stated differently, higher-performing actors
272
M. S. Bothner et al.

consciously categorize and deride lower-performing counterparts who
reside beneath a socially defined marker to amplify the value of their
privileged role, thus eliminating the possibility of cohesion.
Correspondingly, at the base of the status order, feelings of relative
deprivation (Merton and Rossi, 1950; Crosby, 1982) are also likely to
impede the connectedness of a group. Various researchers have traced
social conflict and contention to individuals’ unfavorable comparisons of
their socially constructed expectations with their actual circumstances
(see, e.g., Gurr, 1970; Crosby, 1976). In addition, at the organizational
level, earlier research has shown that variance in rewards positively
affects turnover of employees with relatively low salaries (Pfeffer and
Davis-Blake, 1992) and reduces the chances of collaboration in the
workplace (Pfeffer and Davis-Blake, 1993). The conceptual underpinning
of these findings lies in Homans’s (1961) notion of distributive justice and
in the concept of fair exchange (Eckhoff, 1974). In this work, individuals
are thought to form judgments about the integrity of reward allocation
systems based on social comparisons: people are constant monitors of the
meting out of pecuniary rewards and praise (Markvosky, 1985). To the
extent that an individual compares unfavorably with his or her peers,
feelings of relative deprivation ensue. For this reason, organizational
demographers and network analysts have found that sharp differences
between individuals on virtually any valued characteristic invites invidious
comparisons, reduces interpersonal attraction, hinders value consensus,
renders communication more difficult, and thereby impedes social cohe-
sion (Burt, 1982; Pfeffer, 1997).
Consequently, in our model, as social actors garner the esteem of their
evaluator along parallel pathways, we assume that they (by virtue of their
similar fates) will remain strongly and fully connected. We consider this
approach useful given that, although most competitive systems evolve
away from an equal distribution of rewards, they also vary greatly in the
extent to which their occupants either rise jointly in absolute terms or
instead ramify in different directions, with some declining and others
ascending. We measure cohesion as the ratio of the lowest quality
employee’s rate of change in approval to that of the highest quality
employee’s rate of change:
r
¼
@W =@b
j
n
¼minðnÞ
@W =@b
j
n
¼maxðnÞ
ð22Þ
Calculations (shown in Appendix IV) show that the partial derivative of
approval with respect to status differentiation assumes the form:
Status Differentiation and Cohesion
273

@W
@b
¼W
adg
ðd bÞðc agÞfðbÞ
þ
c
c
a
ln
ðnÞ þ
g
1
1
ag=c
X
n
ðln nÞn
f
ðbÞ
. X
n
n
f
ðbÞ
"
###
ð23Þ
where
f
ðbÞ ðbc adÞ=ðc aÞ
Our measure of cohesion
r has many desirable properties. One is that it
equals unity when all contestants, regardless of their fixed endowment of
quality
n, advance or decline on parallel pathways. And as r departs from
unity, cohesion declines. Another advantage of the measure is the infor-
mation it conveys when its value is negative. When
r falls below zero, the
high- and low-end contestants are moving along decidedly different vec-
tors; one is rising in absolute approval, the other is falling. Under
r < 0, we
assume that none of the benefits of cohesion are realizable, and we
therefore focus on the various time points after which
r assumes negative
values in the next section.
4.1 Results
Our results show when the social organization of exchange rules out the
possibility of cohesion (and its concomitant advantages), and when con-
testants stay connected despite mounting distinctions among them. We
portray the effects of status differentiation on cohesion in two different
domains: We consider first a site in which the boss enjoys autonomy in
relation to her employees (
g < 1), after which we move to a context in
which her autonomy is weak (
g > 1). We model the fates of a triad of
employees, whose levels of quality we fix at 1, 1.5, and 2. We set
g first to .8,
.7, and .6 to depict results for an autonomous boss, and then to 1.2 for a
boss who lacks autonomy. We fix
a in Equation (2) at .5 for decreasing
returns to scale.
5
We let
b vary from .01, signifying negligible initial var-
iation among employees in perceived quality, up to 3. Consistent with
Spence (1974), we set
d equal to
1, so that the most able employee incurs
the lowest cost for a chosen level of effort. All other parameters—
c, r, and
q—stay equal to one.
6
We depict the effects of status differentiation on cohesion
r in Figure 3
for three values of
g, each representing high autonomy enjoyed by the boss
(and
g
¼ .6 marking the highest state of autonomy). In each case, r clearly
5
Calculation reported elsewhere (see White 1981) show that a necessary condition for
positive profits is
a=c < 1=.
6
Although
r and q affect important outcomes, such as levels of effort and rewards, they
cancel in equation (22) and consequently have no effect on cohesion.
274
M. S. Bothner et al.
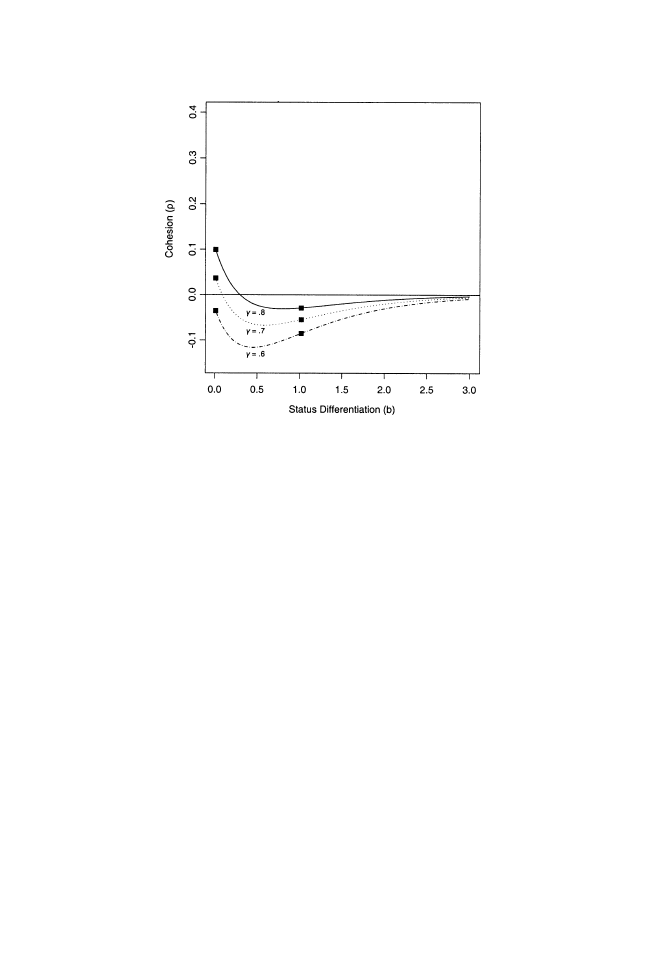
trends downward as distinctions in status grow. Substantively, this result
means that contestants sort into different trajectories, and thus are less
likely to realize the advantages of cohesion, as they progressively differ in
status. Our results also show that the point after which cohesion assumes
negative values occurs earlier, the higher the boss’s autonomy (or the lower
the level of
g). To depict this pattern differently, we also plot the absolute
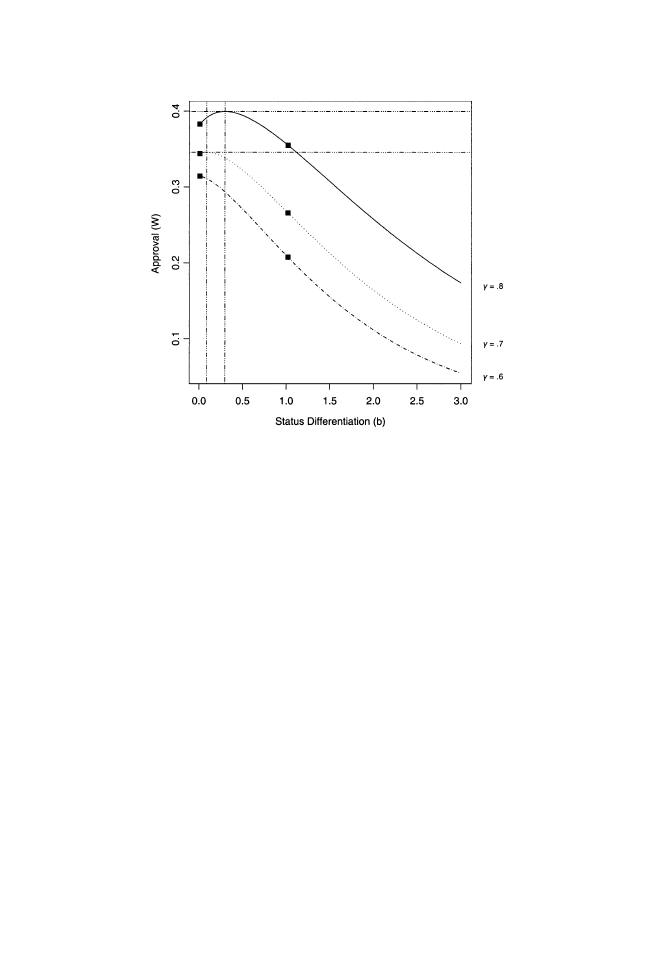
approval
W of the low quality contestant across b in Figure 4. The only
difference between Figures 3 and 4 is the outcome on the ordinate. The
functions in Figure 4 reinforce the fact that cohesion breaks down earlier,
the higher the value of gamma. Specifically, the critical value of
b at which
@W=@b
j
n
¼1
intersects zero is .297105 for
g
¼ .8, and equals .08816 for g ¼ .7,
corresponding to the values at which
r equals zero in Figure 3. Together,
Figure 3 and 4 also show that
@W=@b
j
n
¼1
< 0 for all b for
g
¼ .6, meaning
that cohesion’s benefits never surface under a highly autonomous boss.
Showing the other side of this trend, Figure 5 depicts the time-varying
approval enjoyed by the high-status actor when
g
¼ .6. Unlike the low-
status employee—whose approval approaches zero with
time—the
FIGURE 3
The effects of status differentiation on cohesion when the boss’s au-
tonomy is high, which we denote by gamma
< 1. We depict the effects of status
differentiation for three levels of gamma, where the autonomy of the boss is greatest
when gamma is lowest. We allow
b to vary from .01 to 3, so that a continuous range of
possible outcomes appear. We also mark specific levels of
b—.01 and 1.02— where
1.02 is the second level of
b derived from equation (2), if we start the competition at
b
¼ .01. All remaining figures are similarly marked at these two time points.
Status Differentiation and Cohesion
275
high-status contestant’s approval rises explosively, mirroring a salient fea-
ture of many real-world tournaments. Under our model’s assumptions, an
almost imperceptible initial lead in quality yields a relative gain in utility
added (and thus in rewards), which then fosters a further advantage on the
status axis, creating more relative gains in utility added (and in corre-
sponding rewards), and so the cycle coninues.
Various scholars have of course identified such cycles in the past. Sub-
stantial work has followed Gibrat’s (1931) law, for instance, effectively
tracing log-normal size distributions to early differences in luck. When
absolute growth (of firms’ sales or individuals’ rewards) is a function of size,
small (randomly induced) advantages at the start of a contest cumulate
into large inequalities over time (see Sutton, 1997; Carroll and Hannan,
2000, pp. 315
7319). Similarly, writing on status hierarchies and the
resulting allocation of resources among scientists, Merton (1968) stressed
the relative ease with which eminent researchers multiply their stature:
When more than one scientist independently makes the same discovery,
credit disproportionately goes to the highest-status scientist, making it
easier for him or her to make further scientific advances (and receive yet
more credit), and so the feedback loop turns.
FIGURE 4
The effect of status differentiation
b on approval W for the lowest-
status employee (whose entry in the quality vector
n equals 1), for three levels of
gamma: .8, .7, and .6. Vertical and horizontal lines intersect at the global maxima of
the approval functions in which gamma equals .8 and .7.
276
M. S. Bothner et al.
With the exception of Merton’s scientists competing in isolation, earlier
research has given insufficient attention to the effects of such cycles on the
cohesion of the social structures in which they arise. While building on the
insight that status is self-reinforcing, we extend past work by examining
the effects of status differentiation on a triad’s social integration, thus
shifting the focus from the actor to the system. And unlike the greater part
of prior demographic research, which has pictured cohesion as a function of
group members’ time-invariant traits, we view cohesion as the product
of similarities in time-changing career paths, each of which emerges out of
their collective relation with an outside evaluator.
When our measure of cohesion, shown in Equations (22) and (23),
appears alongside a measure of relative approval, the primacy of the eva-
luator’s autonomy as a causal factor becomes clear. Using Equations (15)
and (19), it follows that:
W
n
=W
max
R
n
¼ ðn
n
=n
max
Þ
ðbcadÞ=ðcaÞ
ð24Þ
Unlike our measure of cohesion, relative approval is entirely independent
of the level of the boss’s autonomy. Substituting into Equation (24)
the parameter values specified previously, we find that the low-status
FIGURE 5
The behavior of the approval of the high-status employee (for whom
n
in equations (1) and (8) equals 2) over the differentiation process transpiring
among employees when gamma equals .6.
Status Differentiation and Cohesion
277
employee’s relative approval (for whom
n
¼ 1) always moves as follows
across status differentiation
b:
R
1
¼ e
lnð2Þð2bþ1Þ
ð25Þ
Stated differently, the core feature of Equations (24) and (25) is that
gamma is missing. Unlike relative approval, which moves in exactly the
same (negative) way for the lowest quality contestant regardless of gamma,
his rate of change in
W with b, which affects the cohesion of the group,
does vary with the boss’s bargaining power.
Moving to the time-varying behavior of cohesion under a low autonomy
boss, we see in Figure 6 that
r never crosses the zero line. Additional
analyses also indicate that
r remains positive even at much higher levels of
b. This result suggests that the perfomance-related benefits of cohesion are
always (in principle) achievable under a weakly autonomous boss. Com-
paring the functions of Figures 3 and 6 to each other also shows that
cohesion falls less precipitously when the evaluator’s autonomy is lower or
gamma is higher. This difference implies that the rate of change in the
system also varies with a competitive clique’s tie to an external evaluator.
Specifically, our results point to the empirical possibility that the conduct-
related correlates of strong ties, such as frequent contact, reciprocity, and
FIGURE 6
The relationship between cohesion and status differentiation when
gamma equals 1.2. Unlike the trajectories of cohesion depicted in Figure 3, cohesion
assumes only positive values under this value of gamma.
278
M. S. Bothner et al.

mutual confiding, change less rapidly when contestants’ vertical power is
higher (Granovetter, 1985).
4.2 Extensions: Other Parameter Values
At this juncture, before turning to our findings’ broader implications, it may
be useful to explore the extent to which other parameters affect our main
results. As we have established, the movement of
r across b is invariant to
attractiveness
r and cost q. Therefore, we focus on the impact of varying a
and
c from Equations (1) and (8), respectively, as well as the quality of the
middle-level actor, whose entry in
n we fixed at 1.5. And since the value of
the middle-quality actor only affects others’ effort
y when gamma departs
from unity, as shown in Equations (19) and (21), we consider the con-
sequences of alternative starting values for gamma equal to .8 and 1.2. We
also underscore the importance of keeping the parameter
d below zero.
The general result of these further analyses is that altering the values of
other parameters leaves the original set of effects largely unchanged. A
specific result is that cohesion is higher when decreasing returns to scale
are stronger (either by lowering
a or raising c), regardless of the level of
gamma. Conversely, another result is that the effect on cohesion of chan-
ging the middle-level actor’s quality does depend on gamma.
To depict these outcomes, we start by replicating the plot of
r as a
function of status differentiation at gamma
¼ .8, shown first in Figure 3. We
do this in Figure 7, using a solid line to denote
r as a function of b with the
original parameter values. We include this function to establish a baseline
suitable for comparing effects under different parameter values. Specifi-
cally, additional functions show that cohesion is higher when
a is smaller, c
is larger, and as the quality of the middle actor equals that of the contestant
whose quality had been lowest.
Similarly, we also consider the effects of varying these three parameters
when the boss’s autonomy is low. We do this in Figure 8, where gamma
equals 1.2, just as it did in Figure 6. Again, the solid-line function depicts
cohesion as a function of status differentiation using our original set of
parameters. Aside from the new effect of the middle-actor’s quality, we see
the same effects as in Figure 7. On the one hand, in Figure 8,
r again is
higher when decreasing returns to scale (either by reducing
a or increa-
sing
c) are sharper. On the other, whereas r discernibly increased in Figure
7 as the quality of the middle actor dropped from 1.5 to 1, here
r falls with
the same shift (although almost indiscernibly).
Also, to establish that an inverse relationship between quality and cost is
a necessary condition for status differentiation, consider the outermost
exponent in Equation (15). Clearly, if
d were small and positive, b would
quickly reach a stage at which approval as a function of effort is undefined.
Status Differentiation and Cohesion
279
Consequently, to let
b increase as a function of lagged differentiation, d < 0
must hold.
5. DISCUSSION
The aim of this article has been to clarify when cohesion can coexist with
status differentiation and when rising status-based differences make the
cohesiveness of a social structure unachievable. Using a formal model, we
have shown that, although cohesion always falls as distinctions grow,
whether or not cohesion survives turns on the autonomy of an outside
evaluator. We found that cohesion persists when autonomy is low and ends
when it is high. Our results also established that this autonomy contracts
the time frame during which cohesion survives. Our main contribution has
been to show that new insights about the dynamics and structure of a social
network can arise when researchers are explicit about the effects of
external conditions on processes unfolding within a network. To do
otherwise—to focus only on internal differences in actors’ traits—is to
bypass the ways in which higher-level relations affect the processes that
FIGURE 7
The consequences of shifting other parameters previously held fixed,
when gamma equals .8. The solid
7line function depicts the behavior of cohesion
across status differentiation, as shown in Figure 3, under the choices of parameter
values described in the text. For each of the other functions, we have only varied a
single parameter, and denote its new value in the plot.
280
M. S. Bothner et al.
earlier studies have often implicitly (and incompletely) depicted as self-
contained.
Needless to say, our use of an analytical model with restrictive
assumptions limits the generality of these findings. Therefore, before
turning to more specific implications for future empirical research, we
specify several scope conditions that clarify the kinds of observable social
structures for which our results are most relevant.
5.1 Scope Conditions
Starting with the boss, we wish to underscore the importance of the pre-
dictability of her evaluations. Within our model, employees select equili-
brium levels of effort based on their inference of the approval schedule,
which is a function of effort and status differentiation. Clearly, not all
competitive contexts are overseen by an evaluator whose style of leader-
ship and logic of reward allocation are inferable. To the contrary, many
evaluators deliberately foster uncertainty among their subordinates to elicit
greater productivity from them (Leifer and White, 1986; White, 1992:281
76).
FIGURE 8
The consequences of shifting other parameters previously held fixed,
when gamma equals 1.2. The solid-line function depicts the behavior of cohesion
across status differentiation, as shown in Figure 6, under the choices of parameter
values described in the text. As in Figure 7, for each of the other functions, we have
only varied a single parameter, and denote its new value in the plot.
Status Differentiation and Cohesion
281

When this occurs, even if approval is dispensed by the boss, by design she
makes these allocations in a seemingly stochastic fashion, thereby ruling out
the continuous process of status differentiation we have depicted. Under a
strategically or unintentionally erratic boss, choices about levels of effort
would have to be made according to decision rules that differ from the
optimizing logic on which our model turns. Therefore, an important scope
condition for our model is the presence of a boss whose model of reward
allocation employees can decipher and anticipate through time.
Naturally, this first scope condition entails a second, which is that
employees observe each other’s effort and rewards. We expect to see the
trends yielded by our model in contexts where the monitoring of others is a
salient process. In modeling cohesion-related dynamics among a set of
employees, we have thus understood the evolving structure they constitute
as a market in White’s (1981) sociological terms: as a clique of producers
watching each other. Through mutual monitoring employees infer the
relationship between approval and effort and anticipate how this relation-
ship shifts as status differentiation unfolds. Consequently, the public nature
of approval allocation not only alters the level of cohesion in the network.
Such exchanges between the boss and her subordinates also guide their
choices of effort, out of which the status structure among them progres-
sively emerges.
We see the persistence of competition as another requirement for
observing our results. Although competition is taken for granted in many
formal models, it is of course by no means ubiquitous. Altruism, for
example, may surface instead as the ascendant factor behind the evolution
of a social structure (see, e.g., Gintis’ 2000 model of ‘‘strong reciprocity’’).
Yet when competition is absent or is eclipsed by self-sacrifice, it is easy to
imagine a disruption of the sorting process depicted by our framework.
Specifically, the highest status contestant might assist his lower status
counterparts, instead of expending effort on tasks from which the boss
directly derives utility. Without his commitment to a competitively induced,
equilibrium level of effort, status differentiation, and thus the reduction of
cohesion, might unfold in ways that differ entirely from our portrayal.
Conditions attached to contestants’ levels of quality also circumscribe
the generality of our findings. First, as noted above, quality and cost must
vary inversely (Spence, 1974); otherwise, quality cannot serve as the basis
for differences in status. Second, the process of status differentiation in our
model never gets started apart from differences in actual quality, although
these distinctions are scarcely visible to the boss before employees begin
producing. Yet without variation in the quality vector, employees would
exert precisely the same levels of effort (and thus obtain identical rewards)
round after round, never initiating a skewed distribution in the accrual of
intangible rewards. Ultimately, therefore, the status differentiation and
282
M. S. Bothner et al.

changes in cohesion we illustrate have their provenance in distinctions in
ability (cf. Scherer, 1970:125
7130 for luck as an alternative).
While the conditions necessary for the operation of our model certainly
do not characterize all social settings, they do reside in several. We contend
that in a number of contexts—for instance, tryouts for sports teams,
auditions for theatrical performances, first-year courses in professional
schools, and summer internships at large firms—contestants start as near
status-equivalents and then sort into a skewed hierarchy as soon as they
start producing. Our findings bear directly on such settings when con-
testants forecast evaluators’ rewards through mutual monitoring, continue
to compete with each other, and vary in quality so that a chosen expen-
diture of effort is easiest for the highest quality contestant. Under those
conditions, our findings yield two main implications, which we state as
conjectures, relevant to future research on topics related to our own.
5.2 Conjectures
We pair each conjecture with a specific assumption about the advantages of
cohesion—related to motivation, information, trust, and collaboration—
mentioned previously. Of course, the larger objectives served by such
advantages are by no means uniform. On the one hand, a cohesive group
may be able to produce better products or services for an external actor
than a sparsely connected group. This possibility mirrors the imagery of
diffusion models (Coleman, Katz, and Menzel, 1966; cf. Bothner 2003),
where cohesive ties make it easier for social actors to keep up with new
advances and better serve their constituents. On the other hand, although
earlier studies have mainly extolled the virtues of cohesion, it is equally
plausible that a cohesive workgroup poses more problems for a boss than
one whose level of cohesion is low. This possibility reflects resource
mobilization models (see McAdam, 1982:20
735 for a review), where
cohesive ties lower the costs of reconfiguring relations with authorities.
Using these divergent scenarios, we conclude with two corresponding
conjectures about the likely actions of a boss, or external evaluator more
generally, faced with status-driven changes in cohesiveness among his or
her subordinates.
Our first conjecture has to do with an external evaluator’s propensity to
engineer a culture (Kunda, 1992) congenial to the integration of contestants.
Under the assumption that cohesion in the early stages of a contest brings
forth advantages
for evaluators, we expect that autonomous evaluators
establish beliefs and values that counter the disintegrative force of status
differentiation. Statements by the boss about the sacrosanct quality of the
group as a whole, or the intrinsic ‘‘worth’’ of each member, are examples of
these cultural factors. We therefore see culture as a means of social control,
Status Differentiation and Cohesion
283

or more precisely as a ‘‘tool-kit’’ (Swidler, 1986) assembled and used by the
boss to attach contestants to each other. Similar to the first meeting of a
cross-functional product team, when representatives of various functions
freely share data before invidious comparisons set in, we found that
r was
high at first, but eventually fell below zero. And the lower the value of gamma
(the higher the boss’ autonomy), the earlier this phase transition occurred.
Substantively, this pattern suggests the cultural interventions favorable to
cohesion occur sooner, the higher the evaluator’s autonomy.
7
Our second conjecture pertains to the feedback likely to exist empiri-
cally between cohesion and autonomy. Under the assumption that cohesion
in the early stages of a contest yields advantages
for contestants, we
expect that
weakly autonomous evaluators establish beliefs and values
that advance the disintegrative force of status differentiation. Work at
the intersection of social networks and collective action offers examples of
these cohesion-induced advantages. Tilly (1978), for instance, argued that
cohesion, together with the clarity of a group’s identity, critically affects its
ability to mobilize and realize its interests (through striking, lobbying,
protesting, and so forth). With stronger bonds among insurgents, the odds
of improving their standing relative to a dominant group rise. Similarly, an
implication of Burt’s (1999) work is that the cohesion not only raises a
group’s ability to pursue its interests despite others’ opposition. Since
cohesion fuels distrust toward outsiders, it may also make a group’s
members more prone to mobilize. Where these studies converge is on the
claim that cohesion magnifies the ‘‘groupness’’ of a group (Fararo and
Doreian, 1998) and it resulting chances of mobilizing successfully at the
expense of an outside party.
When coupled with these lines of research, our findings bring into focus
the possibility that production for a weakly autonomous boss induces
feedback and a divisive cultural response on his or her part. Where earlier
work stressed the effect of greater cohesion on a chosen group’s power
over outsiders, our results point to the reverse process in which a group’s
greater power with respect to outsiders (higher gamma) renders them
more cohesive. Although we have fixed gamma when identifying our
7
Although this conjecture deliberately goes beyond the model itself, pertaining to ‘‘back-
stage’’ activities in Goffman’s (1959) terms, it is easy to imagine how to express it in the mod-
el’s language. Specifically, if we assume (as we have) that cultural intervention by the boss
increases cohesion, it could do so by raising the minimum value of the quality vector
n. This
would mean that the lowest quality actor (by virtue of a cultural intervention directed at him in
particular) increased his level of fit with the boss. Were we to model the effect of culture on
cohesion, it would then be necessary to decide between these approaches: (
a) using the
measure of cohesion presented in Equation (22) while relaxing our assumptions about the
invariant nature of quality or (
b) extending our measure of cohesion so that it becomes a
combination of structural and cultural elements.
284
M. S. Bothner et al.

results, it is not difficult to conceive of a cycle in which higher gamma
(lower autonomy on the part of the boss) promotes cohesion, which then
raises gamma further, in turn making cohesion easier to sustain, elevating
gamma again, and so on. When this process of escalation occurs empirically
(or appears likely to do so), we conjecture that a weakly autonomous boss
will then intervene on the cultural plane to divide his or her subordinates.
Such interventions have of course attracted scholarly attention in many
fields, starting in sociology with Simmel’s (1902) discussion of ‘‘divide and
rule’’ strategies (cf. Burt, 1992). Unlike the typically public attempts of an
autonomous boss to enhance cohesion, we envision a weakly autonomous
boss engaging in private efforts to force apart his or her subordinates,
thus covertly widening gaps already induced by the process of status
differentiation.
APPENDIX I: DERIVATION OF W(y):
Starting with the claim that employees choose effort at which marginal
approval equals marginal cost, shown in Equation (9) of the text (assuming
throughout
y
¼ y
0
):
@W
@y
¼
@C
@y
¼ cqy
c
1
n
d
And from Equation (3):
U
ðy; nÞ ¼ ry
a
n
b
¼ yW ðy; nÞ
so that:
n
¼ ððyW ðy; nÞÞ=ry
a
Þ
1
=b
Consequently,
n may be substituted into (9) to yield:
@W
@y
¼
@C
@y
¼ cqy
c
1
½ððyW ðy; nÞÞ=ry
a
Þ
1
=b
d
Simplifying the right-hand side (and re-labeling
W(y; n) as W ) before
collecting terms for the exponent on
y:
@W
@y
¼
@C
@y
¼ cqy
c
1
ðyW Þ
d=b
=
ðry
a
Þ
d=b
@W
@y
¼
@C
@y
¼ cqy
c
1
ðyW Þ
d=b
=
ðr
d=b
y
ad=b
Þ
Collecting terms for the exponent on
y:
y
c
1
=y
ad=b
y
c
1ad=b
y
bc=b
b=bad=b
y
ððbcadÞ=bÞ1
Status Differentiation and Cohesion
285

and reinserting
y back into the differential equation:
@W
@y
¼
@C
@y
¼ cqy
ððbcadÞ=bÞ1
ðyW =rÞ
d=b
Rearrange terms before integrating:
ðyW =rÞ
d=b
@W
¼ cqy
ððbcadÞ=bÞ1
@y
Now integrate:
Z
ðyW =rÞ
d=b
@W
¼
Z
cqy
ððbcadÞ=bÞ1
@y
Manipulating terms, adding a constant of integration, and cleaning up:
Z
W
d=b
@W
¼
Z
ðy=rÞ
d=b
cqy
ððbcadÞ=bÞ1
@y
W
d=bþ1
=
ðd=b þ 1Þ ¼ ðy=rÞ
d=b
cqy
ðbcadÞ=b
=
ððbc adÞ=bÞ þ K
ðb=ðb dÞÞW
ðbdÞ=b
¼ ðb=ðbc adÞÞðy=rÞ
d=b
cqy
ðbcadÞ=b
þ K
W
ðbdÞ=b
¼ ðcqðb dÞ=ðbc adÞÞðy=rÞ
d=b
y
ðbcadÞ=b
þ K
W
ðyÞ ¼ ððcqðb dÞ=ðbc adÞÞðy=rÞ
d=b
y
ðbcadÞ=b
þ K Þ
b=
ðbdÞ
Or simply:
W
ðyÞ ¼ ðPy
e
þ K Þ
f
with substitutions for
P, e, and f.
APPENDIX II: DERIVATION OF y(n):
Starting with optimal levels of effort and using the simplified version of
W(y) in (16):
@W
@y
¼
@C
@y
() f ðPy
e
Þ
f
1
Pey
e
1
¼ cqy
c
1
n
d
Cleaning up the left-hand side:
f
P
f
1
y
ef
e
Pey
e
1
¼ cqy
c
1
n
d
efP
f
y
ef
1
¼ cqy
c
1
n
d
y
ef
c
¼
cqn
d
efP
f
y
¼
cqn
d
efP
f
1
=
ðef cÞ
286
M. S. Bothner et al.

Using Equations (15) and (16) from the text:
e
¼
bc
ad
b
and
f
¼
b
b
d
Therefore, the exponent 1
=
ðef cÞ takes the form:
bc
ad
b
d
c
1
¼
d
b
d
ðc aÞ
1
¼
b
d
d
1
c
a
Consequently,
y may be expressed as:
y
¼
cqn
d
efP
f
b
d
d
1
c
a
Let
X
¼
b
d
d
to simplify:
y
¼
n
b
d
ðef =cqÞ
x
P
b=d
1
=
ðcaÞ
Substituting parameters for
e, f, and P in the denominator brings us to:
y
¼ n
b
d
bc
ad
cq
ðb dÞ
X
cq
ðb dÞ
bc
ad
ðy
0
=r
Þ
d=b
b=d
"
#
1
2
4
3
5
1
=
ðcaÞ
Collecting
ðy
0
=r
Þ:
y
¼ n
b
d
bc
ad
cq
ðb dÞ
X
cq
ðb dÞ
bc
ad
b=d
ðy
0
=r
Þ
"
#
1
2
4
3
5
1
=
ðcaÞ
Getting the same base, by changing
X to
X:
y
¼ n
b
d
cq
ðb dÞ
bc
ad
X
cq
ðb dÞ
bc
ad
b=d
ðy
0
=r
Þ
"
#
1
2
4
3
5
1
=
ðcaÞ
With
X
¼
b
d
d
; the result is:
y
¼
n
b
d
cqy
0
ðb dÞ=ðrðbc adÞÞ
1
=
ðcaÞ
APPENDIX III: DERIVATION u
0
VIA W
Substitute
W
ð1gÞ=g
, aggregate approval raised to
ð1 gÞ=g, for y
0
in
W(y)
and
y(n) in Equations (15) and (19), respectively.
Status Differentiation and Cohesion
287

W
¼ ½ðcqðb dÞ=ðbc adÞÞðW
ð1gÞ=g
=r
Þ
d=b
y
ðbcadÞ=b
þ K
b=
ðbdÞ
y
¼
n
b
d
cqW
ð1gÞ=g
ðb dÞ=ðrðbc adÞÞ
"
#
1
=
ðcaÞ
with
K
¼ 0:
W
¼ ðcqðb dÞ=ðbc adÞÞ
b=
ðbdÞ
ðW
ð1gÞ=g
=
g
Þ
d=
ðbdÞ
y
ðbcadÞ=ðbdÞ
Substituting
y into W yields:
W
¼
cq
ðb dÞ
bc
ad
b=
ðbdÞ
W
ð1gÞ=g
r
d=
ðbdÞ
n
b
d
cqW
ð1gÞ=g
ðb dÞ=ðrðbc adÞÞ
"
#
bc
ad
ðbdÞðcaÞ
W
¼
cq
ðb dÞ
bc
ad
b=
ðbdÞ
W
ð1gÞ=g
r
d=
ðbdÞ
cqW
ð1gÞ=g
ðb dÞ=ðrðbc adÞÞ
h
i
bc
ad
ðbdÞðacÞ
n
bc
ad
c
a
Cleaning up the right hand side by simplifying the exponent on
W:
ðW
ð1gÞ=g
Þ
d=
ðbdÞ
ðW
ð1gÞ=g
Þ
bc
ad
ðbdÞðacÞ
¼ ðW
ð1gÞ=g
Þ
1
=
ðbdÞ
h
i
d
ðW
ð1g=gÞ
Þ
1
=
ðbdÞ
h
i
ðbcadÞ=ðacÞ
¼ ðW
ð1gÞ=g
Þ
1
=
ðbdÞ
h
i
c
ðbdÞ=ðacÞ
¼ ðW
ð1gÞ=g
Þ
c=
ðacÞ
Simplifying terms on (1/
r):
ð1=rÞ
d=
ðbdÞ
ð1=rÞ
bc
ad
ðbdÞðacÞ
¼ ð1=rÞ
ad
dcþbcad
ðbdÞðacÞ
¼ ð1=rÞ
c
ðbdÞ
ðbdÞðacÞ
¼ r
c=
ðcaÞ
Simplifying
cq(b
d)/(bcad) as:
cq
ðb dÞ=ðbc adÞ
½
b
b
d
þ
bc
ad
ðbdÞðacÞ
¼ cqðb dÞ=ðbc adÞ
½
a=
ðacÞ
With these simplifications, the result is:
W
¼ ðW
ð1gÞ=g
Þ
c=
ðacÞ
r
c=
ðcaÞ
½cqðb dÞ=ðbc adÞ
a=
ðacÞ
n
ðbcadÞ=ðcaÞ
288
M. S. Bothner et al.

Now, summing both sides over
n:
W
X
n
W
¼ ðW
ð1gÞ=g
Þ
c=
ðacÞ
r
c=
ðcaÞ
½cqðb dÞ=ðbc adÞ
a=
ðacÞ
X
n
n
ðbcadÞ=ðcaÞ
Collect
W on the left-hand side:
W
ðW
ð1gÞ=g
Þ
c=
ðcaÞ
¼ r
c=
ðcaÞ
½cqðb dÞ=ðbc adÞ
a=
ðacÞ
X
n
n
ðbcadÞ=ðcaÞ
W
ðcagÞ=gðcaÞ
¼ g
c=
ðcaÞ
½cqðb dÞ=ðbc adÞ
a=
ðacÞ
X
n
n
ðbcadÞ=ðcaÞ
Pulling out
q:
W
ðcagÞ=gðcaÞ
¼ g
c=
ðcaÞ
q
a=
ðacÞ
ððcb cdÞ=ðbc adÞÞ
a=
ðacÞ
X
n
n
ðbcadÞ=ðcaÞ
W
ðcagÞ=gðcaÞ
¼ g
c=
ðcaÞ
ð1=qÞ
a=
ðcaÞ
ððbc adÞ=ðcb cdÞÞ
a=
ðcaÞ
X
n
n
ðbcadÞ=ðcaÞ
Raising both sides to (
c
a)/c:
W
1
ða=cÞg
g
¼
r
q
a=c
bc
ad
cb
cd
a=c
X
n
n
ðbcadÞ=ðcaÞ
1
a=c
Solve for
W as:
W
¼
r
q
a=c
b=d
a=c
b=d
1
a=c
X
n
n
ðbcadÞ=ðcaÞ
1
a=c
"
#
g=
ð1ag=cÞ
Using the fact that
y
0
¼ W
ð1gÞ=g
, the result is:
y
0
¼
r
q
a=c
b=d
a=c
b=d
1
a=c
X
n
n
ðbcadÞ=ðcaÞ
1
a=c
"
#
ð1gÞ=ð1ag=cÞ
Status Differentiation and Cohesion
289

APPENDIX IV: DERIVATION OF @W/ @b
Starting from Equation (20) in the text:
W
¼
r
q
a=c
b=d
a=c
b=d
1
ða=cÞ
X
n
n
ðbcadÞ=ðcaÞ
1
a=c
"
#
g=
ð1ag=cÞ
which may be reexpressed as:
W
¼
r
q
a=c
g=
ð1ag=cÞ
b=d
a=c
b=d
1
ða=cÞg=ð1ag=cÞ
X
n
n
ðbcadÞ=ðcaÞ
g
ð1a=cÞ
1
ag=c
Using the fact that individual approval equals the product of total approval
and market share:
W
¼ W
n
ðbcadÞ=ðcaÞ
P
n
n
ðbcadÞ=ðcaÞ
and letting
m
r
q
a=c
g=
ð1ag=cÞ
to simplify, we have:
W
¼ m
b=d
a=c
b=d
1
ag=
ðcagÞ
n
ðbcadÞ=ðcaÞ
X
n
n
ðbcadÞ=ðcaÞ
g
1
1
ag=c
or alternatively:
W
¼ mf ðbÞgðbÞhðbÞ
where
f
ðbÞ ¼
b=d
a=c
b=d
1
ag=
ðcagÞ
; g
ðbÞ ¼ n
ðbcadÞ=ðcaÞ
; and
h
ðbÞ ¼
X
n
n
ðbcadÞ=ðcaÞ
!
g
1
1
ag=c
Therefore:
@W
@b
¼ mðf
0
ðbÞgðbÞhðbÞ þ f ðbÞg
0
ðbÞhðbÞ þ f ðbÞgðbÞh
0
ðbÞÞ
¼
W
f
ðbÞgðbÞhðbÞ
ðf
0
ðbÞgðbÞhðbÞ þ f ðbÞg
0
ðbÞhðbÞ þ f ðbÞgðbÞh
0
ðbÞÞ
or most simply:
@W
@b
¼ W
f
0
ðbÞ
f
ðbÞ
þ
g
0
ðbÞ
g
ðbÞ
þ
h
0
ðbÞ
h
ðbÞ
290
M. S. Bothner et al.

Going back to the above expression:
f
ðbÞ ¼
b=d
a=c
b=d
1
ag=
ðcagÞ
so that:
f
0
ðbÞ ¼ ðag=ðc agÞÞ
b=d
a=c
b=d
1
ag=
ðcagÞ1
ðb=d 1Þð1=dÞ ðb=d a=cÞð1=dÞ
ðb=d 1Þ
2
"
#
f
0
ðbÞ ¼ ðag=ðc agÞÞ
b=d
a=c
b=d
1
ag=
ðcagÞ1
ða=c 1Þ
d
ðb=d 1Þ
2
"
#
Similarly:
g
ðbÞ ¼ n
ðbcadÞ=ðcaÞ
¼ e
ðlnnÞðbcadÞ=ðcaÞ
so that:
g
0
ðbÞ ¼
ðln nÞc
c
a
e
ðln nÞðbcadÞ=ðcaÞ
¼
ðln nÞc
c
a
n
ðbcadÞ=ðcaÞ
And finally:
h
ðbÞ ¼
X
n
n
ðbcadÞ=ðcaÞ
g
1
1
ag=c
¼
X
n
e
ðlnnÞðbcadÞ=ðcaÞ
g
1
1
ag=c
so that:
h
0
ðbÞ ¼
g
1
1
ag=c
X
n
e
ðlnnÞðbcadÞ=ðcaÞ
g
1
1
ag=c
1
X
n
ðln nÞc
c
a
:n
ðbcadÞ=ðcaÞ
¼
g
1
1
ag=c
X
n
n
ðbcadÞ=ðcaÞ
g
1
1
ag=c
1
c
c
a
X
n
ðln nÞn
ðbcadÞ=ðcaÞ
Therefore:
@W
@b
¼ W
ag
c
ag
b=d
a=c
b=d
1
1
ða=c 1Þ
d
ðb=d 1Þ
2
2
6
6
4
þ
ðln nÞc
c
a
þ
g
1
1
ag=c
c
c
a
P
n
ðln nÞn
ðbcadÞ=ðcaÞ
P
n
n
ðbcadÞ=ðcaÞ
3
7
7
5
Status Differentiation and Cohesion
291

@W
@b
¼ W
adg
ða cÞ
ðc agÞðb dÞðbc adÞ
þ
ðln nÞc
c
a
2
4
þ
c
ðg 1Þ
ð1 ag=cÞðc aÞ
P
n
ðln nÞn
ðbcadÞ=ðcaÞ
P
n
n
ðbcadÞ=ðcaÞ
3
5
To simplify, define
f
ðbÞ ðbc adÞ=ðc aÞ; which allows us to conclude
with:
@W
@b
¼ W
"
adg
ðd bÞðc agÞfðbÞ
þ
c
c
a
ln
ðnÞ þ
g
1
1
ag=c
X
n
ðln nÞ n
f
ðbÞ
X
n
n
f
ðbÞ
"
#
"
##
REFERENCES
Alderfer, C. P. (1987). An Intergroup perspective on group dynamics. Pp.190
7222. In
Handbook of Organizational Behavior, J. W. Lorsch (ed.). Englewood Cliffs, NJ: Prentice
Hall.
Baker, W. E. (1984). The Social Structure of a National Securities Market.
American Journal
of Sociology, 39(4), 7757811.
Bales, R. F. (1950).
Interaction Process Analysis: A Method for the Study of Small Groups,
Cambridge, Mass.: Addison-Wesley Press.
Barnard, C. I. (1938).
The Functions of the Executive. Cambridge, Mass.: Harvard University
Press.
Berger, P. L. (1993). Sociology of Religion and Sociology of Knowledge. Graduate Seminar,
Boston University.
Berger, P. L. and Luckmann, T. (1966).
The Social Construction of Reality: A Treatise in the
Sociology of Knowledge. Garden City, N.Y.: Doubleday.
Bothner, M. S. (2003). Competition and Social Influence: The Diffusion of the Sixth-Generation
Processor in the Global Computer Industry.
American Journal of Sociology, 108:
1175
71210.
Bradach, J. L. and Eccles, R. G. (1989). Price, Authority, and Trust: From Ideal Types to Plural
Forms.
Annual Review of Sociology, 15, 977118.
Burt, R. S. (1980). Autonomy in a Social Topology.
American Journal of Sociology, 85(4),
892
7925.
Burt, R. S. (1982).
Toward a Structural Theory of Action: Network Models of Social
Structure, Perception, and Action. New York: Academic Press.
Burt, R. S. (1992).
Structural Holes: The Social Structure of Competition. Cambridge:
Haward University Press.
Burt, R. S.(1999). Entrepreneurs, Distrust, and Third Parties, In
Shared Cognition in
Organizations: The Management of Knowledge, L. Thompson, J. Levine and D. Messick.
(eds.). Lawrence Erlbaum.
292
M. S. Bothner et al.

Burt, R. S.(2001). Bandwidth and Echo: Trust, Information, and Gossip in Social Networks, In
Networks and Markets, A. Casella and J. E. Rauch (eds.). Russell Sage Foundation.
Burt, R. S.(2002). The Social Capital of Structural Hotels, In
New Directions in Economic
Sociology, M. F. Guille´n, R. Collins, P. England, and M. Meyer (eds.). Russell Sage Foun-
dation.
Carroll, G. R. and Hannan, M. T.(2000).
The Demography of Corporations and Industries.
Princeton, New Jersey: Princeton University Press.
Chase, I. D.(1980). Social Process and Hierarchy Formation in Small Groups: A Comparative
Perspective.
American Sociological Review, 45: 9057924.
Coleman, J. S.(1990).
Foundations of Social Theory. Cambridge, Mass.: Belknap Press of
Harvard University Press.
Coleman, J. S.(1988). Social Capital in the Creation of Human Capital.
American Journal of
Sociology, Supplement S957S120.
Coleman, J. S., Katz, E. and Menzel, H.(1966)
Medical Innovation: A Diffusion Study.
Indianapolis: Bobbs-Merrill Co.
Coser, R. L.(1975). The Complexity of Roles as a Seedbed of Individual Autonomy, In L. A.
Coser (ed.).
The Idea of Social Structure: Papers in Honor of Robert K. Merton.
New York: Harcourt Brace Jovanovich.
Crosby, F. (1976). A Model of Egoistical Relative Deprivation.
Psychological Review, 83:
85
7113.
Crosby, F. (1982).
Relative Deprivation and Working Women. Oxford: Oxford University
Press.
Durkheim, E. [1893] (1933).
The Division of Labor in Society. Translated by George Simp-
son. New York: Free Press.
Eckhoff, T. Einang. (1974).
Justice: Its Determinants in Social Interaction. Rotterdam:
Rotterdam University Press.
Emerson, R. M. (1962). Power-Dependence Relations.
American Sociological Review, 27:
31
740.
Fararo, T. J. and Doreian, P. (1998). The Theory of Solidarity: An Agenda of Problems. Pp.
1
731. In The Problem of Solidarity: Theories and Models, P. Doreian and T. J. Fararo
(eds.). Gordon and Breach Publishers.
Festinger, L. Schacter, S. and Back, K. W. (1950).
Social Pressure in Informal Groups.
New York: Harper.
Gibrat, R. (1931).
Les Ine´galite´s Economiques. Paris: Sirey.
Gintis, H. (2000). Strong Reciprocity and Human Solidarity.
Journal of Theoretical Biology,
206: 1697179.
Goffman, E. (1959).
The Presentation of Self in Everyday Life. Garden City, New York:
Doubleday.
Goode, W. J. (1978).
The Celebration of Heroes: Prestige as a Social Control System.
Berkeley: University of California Press.
Granovetter, M. (1973). The Strength of Weak Ties.
American Journal of Sociology, 78:
1360
71380.
Granovetter, M. (1985). Economic Action and Social Structure: The Problem of Embedded-
ness.
American Journal of Sociology, 91(3), 4817510.
Gurr, T. R. (1970).
Why Men Rebel. Princeton, New Jersey: Princeton University Press.
Homans, G. C. (1961).
Social Behavior: Its Elementary Forms. New York: Harcourt, Brace &
World.
Horvath, W. J. (1965). A Mathematical Model of Participation is Small Group Discussions.
Behavioral Science, 10, 1647166.
Ibarra, H. (1993). Personal Networks of Women and Minorities in Management: A Conceptual
Framework.
The Academy of Management Review, 18: 56787.
Status Differentiation and Cohesion
293

Kanter, R. M. (1977).
Men and Women of the Corporation. New York: Basic Books.
Kunda, G. (1992).
Engineering Culture: Control and Commitment in a High-Tech
Corporation. Philadelphia: Temple University Press.
Lazarsfeld, P. F. and Merton, R. K. (1954). Friendship as social process: a substantive
and methodological analysis. Pp. 18
766, In Freedom and control in Modern Society.
M. Berger, T. Abel, and C. Page (eds.). New York: Van Nostrand.
Leifer, E. M. and White, H. C. (1986). Wheeling and Annealing: Federal and Multidivisional
Control. Pp. 223
7242, In The Social Fabric. J. F. Short (ed). Beverly Hills, CA: Sage.
Markovsky, B. (1985). Toward a Multilevel Distributive Justice Theory.
American Sociological
Review, 50(6), 8227839.
Marsden, P. V. (1988). Homogeneity in Confiding Relations.
Social Networks, 10: 57776.
Mayhew, B. H. and Levinger, R. L. (1976). On the Emergence of Oligarchy in Human
Interaction.
American Journal of Sociology, 81(5), 101771049.
Mayo, E. (1945).
The Social Problems of an Industrial Civilization. Boston: Graduate
School of Business Administration, Harvard University.
McAdam, D. (1982).
Political Process and the Development of Black Insurgency,
1930
71970. Chicago: University of Chicago Press.
Merton, R. K. (1968). The Matthew Effect in Science.
Science, 159 (3810), Pp. 56763.
Merton, R. K. and Rossi, A. S. (1950). Contributions to the Theory of Reference Group
Behavior Pp. 279
7334, In Social Theory and Social Structure, Robert K. Merton.
New York: Free Press.
Mills, C. W. (1956).
The Power Elite. New York: Oxford University Press.
Nadel, S. F. (1957).
The Theory of Social Structure. London: Cohen & West.
Ouchi, W. G. (1980). Markets, Bureaucracies, and Clans.
Administrative Science Quarterly,
25(1), 1297141.
Patterson, O. (1991).
Freedom in the Making of Western Culture. New York: Basic Books.
Pfeffer, J. (1997).
New Directions for Organization Theory: Problems and Prospects.
New York: Oxford University Press.
Pfeffer, J. and Davis-Blake, A. (1990). Determinants of Salary Dispersion in Organizations.
Industrial Relations, 29: 38757.
Pfeffer, J. and Davis-Blake, A. (1992). Salary Dispersion, Location in the Salary Distribution,
and Turnover among College Administrators.
Industrial and Labor Relations Review,
45: 7537763.
Pfeffer, J. and Salancik, G. R.(1978).
The External Control of Organizations: A Resource
Dependence Perspective. New York: Harper & Row.
Phillips, D. J. (2001). The Promotion Paradox: Organizational Mortality and Employee Pro-
motion Chances in Silicon Valley Law Firms, 1946
71996. American Journal of Sociology,
106(4).
Podolny, J. M. (1993). A Status-Based Model of Market Competition.
American Journal of
Sociology, 98(4), 8297872.
Podolny, J. M. (1994). Market Uncertainty and the Social Character of Economic Exchange.
Administrative Science Quarterly, 39: 4587483.
Rogers, E. M. and Kincaid, D. L. (1981).
Communication Networks. New York: Free Press.
Scherer, F. M. (1970).
Industrial Market Structure and Economic Performance. Chicago:
Rand McNally & Company.
Scott, W. R. (1992).
Organizations: Rational, Natural, and Open Systems. New Jersey:
Prentice Hall.
Sherif, M. White, B. J. and Harvey, O. J.(1955). Status in Experimentally Produced Groups.
American Journal of Sociology, 60(4), 3707379.
Simmel, G. (1902). The Number of Members as Determining the Sociological Form of the
Group. II
American Journal of Sociology, 8(2), 1587196.
294
M. S. Bothner et al.

Skvoretz, J. (1981). Extending Expectation States Theory: Comparative Status Models of
Participation in N Person Groups.
Social Forces, 59(3), 7527770.
Skvoretz, J. (1988). Models of Participation in Status-Differentiated Groups.
Social
Psychology Quarterly, 51(1). 43757.
Spence, A. M. (1974).
Market Signaling. Cambridge: Harvard University Press.
Stuart, T. E. (1998). Network Positions and Propensities to Collaborate: An Investigation of
Strategic Alliance Formation in a High-Technology Industry.
Administrative Science
Quarterly, 43(3), 6687698.
Sutton, J. (1997). Gibrat’s Legacy.
Journal of Economic Literature, 35: 40759.
Swidler, A. (1986). Culture in Action: Symbols and Strategies.
American Sociological Review,
51(2), 2737286.
Taylor, P. A. (1987). The Celebration of Heroes Under Communism: On Honors and the
Reproduction of Inequality.
American Sociological Review, 52(2), 1437154.
Tilly, C. (1978).
From Mobilization to Revolution. Reading, Mass.: Addison7Wesley Pub. Co.
Tilly, C. (1998).
Durable Inequality. Berkeley, Calif.: University of California Press.
Torrance, E. P. (1954). Some Consequences of Power Differences on Decision Making in
Permanent and Temporary Three-Man Groups.
Research Studies, State College of
Washington, 22: 1307140.
White, H. C. (1963).
An Anatomy of Kinship: Mathematical Models for Structures of
Cumulated Roles. Englewood Cliffs, N.J.: Prentice-Hall.
White, H. (1981). Where Do Markets Come From?
American Journal of Sociology, 87:
517
7547.
White, H. (1992).
Identity and Control: A Structural Theory of Social Action. Princeton,
New Jersey: Princeton University Press.
White, H. (2002).
Markets from Networks: Socioeconomic Models of Production. Princeton,
New Jersey: Princeton University Press.
Whyte, W. F. (1943).
Street Corner Society: The Social Structure of an Italian Slum.
Chicago, IL: The University of Chicago Press.
Status Differentiation and Cohesion
295
Document Outline
Wyszukiwarka
Podobne podstrony:
Lee Institutional embeddedness and the formation of allieance networks a longitudinal study
THE IMPACT OF SOCIAL NETWORK SITES ON INTERCULTURAL COMMUNICATION
The effects of social network structure on enterprise system success
Microwave drying characteristics of potato and the effect of different microwave powers on the dried
THE POLITICS OF DIFFERENCE AND COMMUNITY AND THE ETHIC OF UNIVERSALISM
Harris, Sam Drugs and the Meaning of Life
Jack London White Fang and the Call of the Wild
pacyfic century and the rise of China
Pragmatics and the Philosophy of Language
Haruki Murakami HardBoiled Wonderland and the End of the World
drugs for youth via internet and the example of mephedrone tox lett 2011 j toxlet 2010 12 014
Osho (text) Zen, The Mystery and The Poetry of the?yon
Locke and the Rights of Children
Concentration and the Acquirement of Personal Magnetism O Hashnu Hara
K Srilata Women's Writing, Self Respect Movement And The Politics Of Feminist Translation
86 1225 1236 Machinability of Martensitic Steels in Milling and the Role of Hardness
Becker The quantity and quality of life and the evolution of world inequality
The World War II Air War and the?fects of the P 51 Mustang
The Manhattan Project and the?fects of the Atomic Bomb
więcej podobnych podstron