
53
Cost-Estimation Methods for Drying
Zbigniew T. Sztabert and Tadeusz Kudra
CONTENTS
53.1 INTRODUCTION
Reliable estimates of the fixed capital investment (FCI)
of a drying system as well as the system’s fixed and
operating costs are essential in the preliminary equip-
ment selection or when comparing different competing
systems. In general, estimation of the costs involved in a
drying process follows the well-known methods used
widely in the process industries [1–9]. This chapter pro-
vides the empirical information on shortcut methods
that may be used to quicken the predictions of FCI and
operating costs on the basis of the previously prepared
process balances and one-parameter equipment sizing.
The method described here is useful for preparing the
rough cost estimates applicable to many conventional
drying systems. However, extending this information to
unique or newest methods of drying must be regarded
with caution. When capital cost estimates of a definitive
investment are required to obtain budget authorization,
competitive quotes from vendors have to be requested,
as these quotes are the most reliable estimates.
A dryer itself is only one component of the overall
drying system. The system may comprise preprocessing
equipment (extruders, grinders, mixers, and blenders),
feeders, product-discharge devices, and postprocessing
equipment such as gas cleaners (cyclones, filters, and
scrubbers) and solvent-recovery systems (condensers
and separators). In some cases, heat-recovery systems
(exhaust-gas recycle, run-around coil, heat pump, or
heat wheel) may also be used. Thus, drying systems
for the same end product can be different. Therefore,
the total fixed costs as well as the operating costs should
be calculated for the complete drying system.
Cost components of drying are usually divided
into the following two groups:
1. Fixed costs (fixed charges), which are incurred for
a long period of time, tend to be unaffected by
fluctuations in the level of production activity.
They include: depreciation of equipment and
buildings, interest charges for the investment cap-
ital, plant protection, insurance, fixed part of
taxes and rents, fixed part of maintenance costs,
and executive salaries (administration, overhead).
2. Variable costs (operating costs) tend to vary
with the production level. They include: cost
of raw materials, cost of product degradation,
costs of energy and utilities, direct labor (oper-
ating, works transport, supervision, and la-
boratory control), interest on working capital,
royalties, variable part of maintenance costs,
and miscellaneous direct costs.
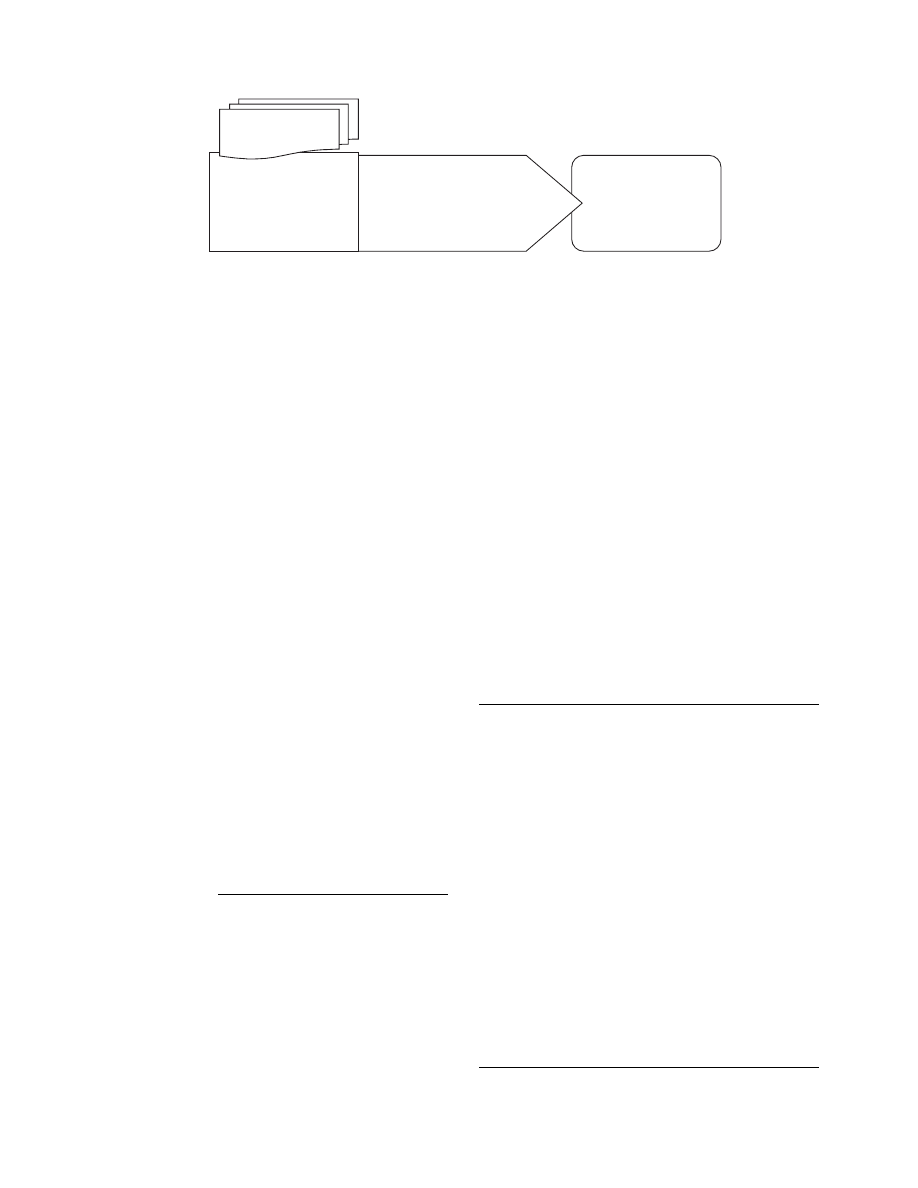
The estimation process of drying costs is schemat-
. The foll owing is a
detailed presentation of the method for preliminary
estimates preparation, together with a worked ex-
ample of cost estimates.
53.2 FREE-ON-BOARD COST AND
INSTALLED COST OF THE EQUIPMENT
Equipment-price data concern the free-on-board
(FOB) cost and the installed cost of the equipment.
The installed cost of a drying system covers the cost
ß
2006 by Taylor & Francis Group, LLC.
of the pur chased equipment , co st of equipment instal-
lation, and costs of piping, wiring, and instrumentation.
These costs can be estimat ed on the basis of ven dors’
data or, with less a ccuracy, on the basis of known
costs for the equipment or syst em bui lt previous ly,
assum ing a great de gree of simila rity.
Data for equ ipment costs obt ained from techni cal
literatu re are usuall y ba sed on the techni cal an d e co-
nomic cond itions of the pa st. Among the various
methods accounti ng for price chan ges due to inflation
and inevi table fluctuat ions in econ omic condition s,
the method of the Chem ical Engineer ing Pl ant Cost
Index (based on the 1957/ 1959 cost level and ab bre-
viated as CE Index) and the method of the Marshal l
and Swi ft All-I ndustry Equip ment Cost Index (for -
merly known as the M arshall an d Stevens Ind ex) a re
the mo st commonl y used. This last inflation index
(formula ted in the US market in the year 1926 wi th
the set value of 1 00, and ab breviated as M&S Ind ex)
is recomm ended for updating the costs of high-l evel
process eq uipments [4,10]. The upda ted M &S Index
as well as the CE Index are listed regularly in Chem -
ical Eng ineering , a periodi cal publish ed by McGra w-
Hill, New York [11] , and are valid for cost upda ting
in US$ and for the US market. A part of such listing
for the equipment -cost indice s over the pe riod 1989–
2004 is given in Tabl e 53.1. The followi ng formu la
using M&S Index is wid ely acc epted for equipment -
cost upda ting:
Updated cost
¼ Original cost
M&S Index at updated time
M&S Index at the time of original cost
(53 : 1)
The M&S Index an d the CE Index c an also be used
for world-pr ice c omparison , if the changes in costs
accordi ng to the local eco nomics , type of indust ry,
and kind of equipment (besi des time) a re accounted
for [12] .
For scale -up or scale -down of the drying syst em,
the cost of the equipment of the same type but of
different capacity can be predict ed approxim ately
from the followin g emp irical correl ation:
Predicted cost
¼ Original cost
[desired capacity=original capacity]
n
(53:2)
where desir ed capacity is the capacit y of the eq uip-
ment for whi ch the cost is to be estimat ed and origi nal
capacity is the capa city of the same- type equ ipment
for whi ch the cost is known (original cost). Val ues of
the exp onent n for the typic al equipment used in
drying systems are lis ted in
given he re or in the refer ence literat ure (e.g ., [4,13]) ,
n
¼ 0.6 can be taken for rou gh estimat ion. The expo -
nent n may vary with the design detai ls. For exampl e,
in the case of cloth dust collectors, n ranges from 0.70
to 0.86. The cost estimated according to Equation
53.2 must be corrected not only for the inflation
index according to Equation 53.1 but also for the
Preliminary
estimation of fixed
and variable costs
of drying
Prediction of plant cost:
1. FOB cost of equipment
2. Installed cost of system
3. Total direct cost of system
4. Fixed capital investment
Calculations:
1. Mass and heat
balances
2. One-parameter
equipment sizing
Drying system
version
FIGURE 53.1 The steps of preliminary estimation of drying cost.
TABLE 53.1
Marshall and Swift All-Industry Equipment Cost
Index and Chemical Engineering Plant Cost Index
(1989–2004)
Year
M&S
Index
CE Index
Year
M&S
Index
CE
Index
1989
895.1
355.4
1997
1056.8
386.5
1990
915.1
357.6
1998
1061.9
389.5
1991
930.6
361.3
1999
1068.3
390.6
1992
943.1
358.2
2000
1089.0
394.1
1993
964.2
359.2
2001
1093.9
394.3
1994
993.4
361.1
2002
1104.2
395.6
1995
1027.5
381.1
2003
1123.6
402.0
1996
1039.2
381.7
2004
1178.5
444.2
Source: Marshall and Swift Equipment Cost Index. Chem. Eng.,
last pages of every issue (excerpted by special permission from
Chemical
Engineering
(2005).
Copyright
2005,
by
Access
Intelligence, New York, NY 10038).
ß
2006 by Taylor & Francis Group, LLC.

local eco nomic situati on when install ation will be
erected in a cou ntry other than the United State s
[14]. Plavsic [12] has given a num ber of useful refer -
ences [15–20 ] and pr ovided a simp lified ‘‘direct fact or-
ing’’ method for convert ing the US data to numb ers
that are applic able elsewhere . Howe ver, furt her dis-
cussio n of this aspect is beyond the scope of this
chapter .
Ver y app roximate co st of carbon steel dryers can
be calculated as [4]
C
¼ (M& S Index) 30 þ 36 : 74
W
(17 : 77
þ T )
(53 : 3)
where C is the installe d cost (US$ in the year of the
M&S Index) cov ering the dr yer and auxil iaries, includ-
ing foundati ons and erection, but no secondary dus t
collectors or buildin g; W is the evapo ration capacit y,
kg mois ture/h; and T is the inlet-ai r temperatur e ( 8 C).
This relation, howeve r, does not reflect the material
propert ies, so the calculated prices are unde restima ted.
The graphs accordi ng to Equation 53.3 are presen ted
in
for the M&S Index equal to 1100.
Asi de from the general form ula, numerous da ta
on dryer cost depen dence on ev aporation capacity
exist in literat ure for the given dryers and defi nite
operatin g parame ters [13, 21,22]. For exampl e, co st
of a spray dryer with a pr essure nozzle atomi zer,
residen ce time of 16 s, inlet- and outlet-ai r tempe ra-
ture of 538 an d 121 8 C, respectivel y, can be calcula ted
as [21] :
Price
¼ 13793 :8
E
0 :435
(first-qu arter-199 5 US $)
(53 : 4)
where E is the evaporat ive load (181 < E < 38,780
kg/h) and the price includes the 304-stai nless steel
dryer body , the access platform , support steel , bur ner,
air-heate r shell, feedi ng system, and instrument ation.
Insula tion, refractor y mate rial, fan, a nd soli ds-rec ov-
ery syst em a re not included.
The ab ove method of prices present ation is
restricte d to a na rrow range of technol ogy. Taking
into accoun t that dryer cost de pends mainl y on its
size and the material of constr uction, drying indice s
such a s dryer through put, evaporat ion rate, or unit
heat co nsumpt ion shou ld not be used as parame ters
for cost estimat ion, mainl y be cause the same indice s
may be obtaine d for dryers of different size by
manipul ating the ope rating condition s. This situ ation
changes when a contrac t relating to techn ology and
equipment is consider ed—then a depen dence of dry er
cost on evaporat ion capacit y can be a valuabl e criter-
ion for dryer selection.
The best charact eristic parame ters for preli minary
cost esti mation of most dryers a re:
.
The volume of the drying chamber (e.g., for
spray or rotar y dryers )
.
The surface area of the suppo rting grid, shelve s,
belt con veyors etc.
.
The heat- transfer area in case of co ntact dryers
Usually, the estimat ed fabricati on cost of a dryer can
be calculated from the follo wing correlati on:
P
¼ (M& S Index) A Q
c
(US$ in the year of M &S Index)
(53 : 5)
where Q is the capacit y of a dryer defi ned eithe r by its
effecti ve volume (V ) or by its characteris tic surface
area (S ), de pending on the dryer type. Valu es of the
coeffici ent A and expo nent c for some common
dryers , determ ined from the available cost data, a re
listed in
The fabricatio n co st of a drying unit besides its
size dep ends also on the mate rial of co nstruc tion; it is
the lowest for carbo n steel. If the process requir es a
TABLE 53.2
Typical Expo nents Re lating Equ ipment Cost
to Capa city
Equipment Capacity Range Unit Exponent
Centrifugal fan 0.4–40 m
3
/s 0.44
Cyclone 0.01–4 m
3
/s 0.61
Multiple cyclone 4–94 m
3
/s 0.66
Dust collector (cloth) 1–470 m
3
/s 0.78
Electrostatic precipitator 23–470 m
3
/s 0.74
Gravity spray scrubber
0.7–189
m
3
/s
0.66
Venturi scrubber
3.3–38
m
3
/s
0.46
Impingement scrubber
1–23
m
3
/s
0.78
Centrifugal scrubber
3.3–47
m
3
/s
0.73
Ribbon blender
a
0.2–7
m
3
0.54
Cage-type disintegrator
0.3–6
kg/s
0.68
Roll crusher
3–66
kg/s
0.97
Screen (vibrating)
0.2–6
m
2
0.66
Bucket elevator
a
3–50
m
0.52
Belt conveyor
a
5–19
m
2
0.50
Screw conveyor
b
0.4–0.8
m
2
0.53
Pan dryer
1–19
m
2
0.50
Vacuum-shelf dryer
1.4–92
m
2
0.54
Tunnel dryer
2–10
m
2
0.50
Roto-Louvre rotary dryer
4–93
m
2
0.62
a
Carbon steel.
b
Stainless steel, conveyor length
diameter.
Source: Sztabert, Z.T., in A.S. Mujumdar, Ed., Drying of Solids,
Sarita Prakashan, New Delhi, 1990, pp. 136–153.
ß
2006 by Taylor & Francis Group, LLC.
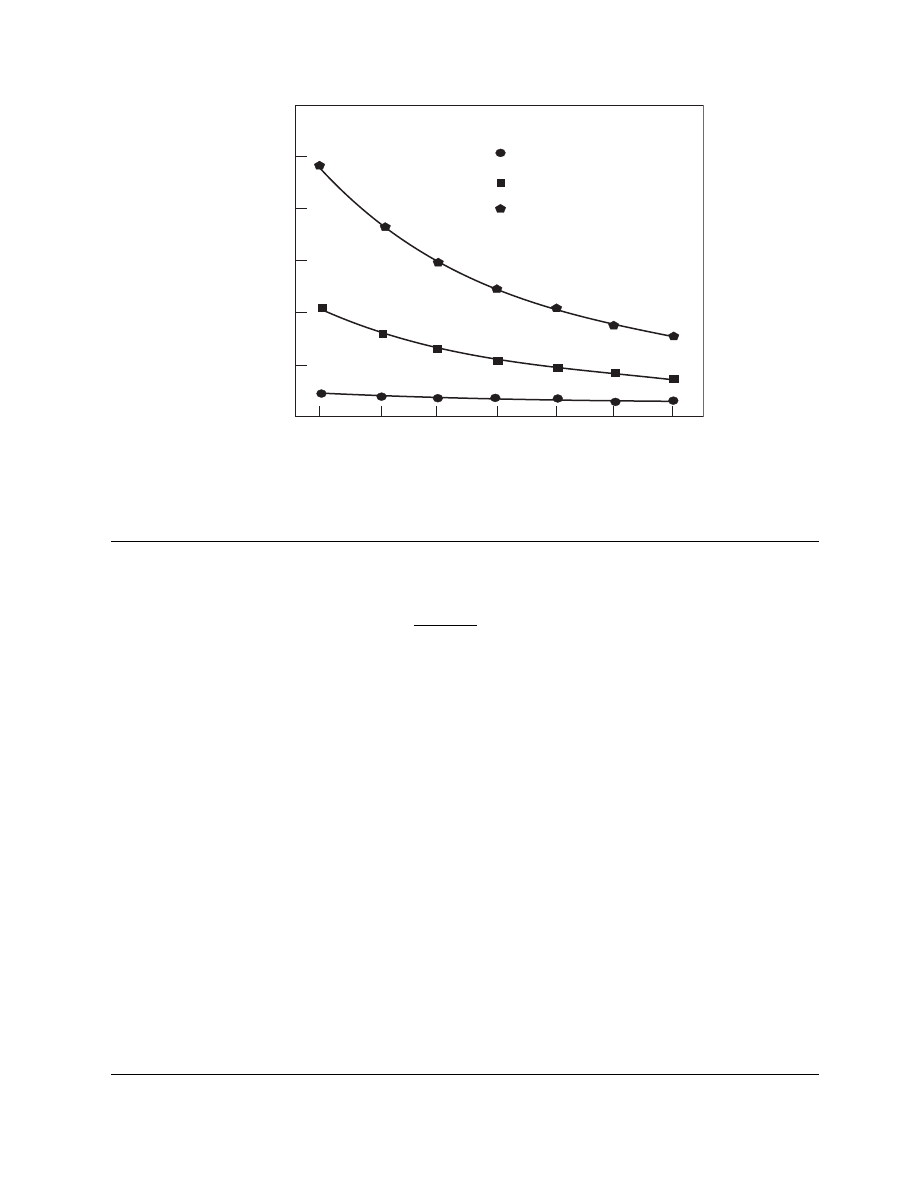
Cost, (US$)
20,000
70,000
120,000
170,000
220,000
270,000
320,000
70 100 130 160 200 250 300
T, (⬚C)
W = 20 kg/h
W = 100 kg/h
W = 500 kg/h
FIGURE 53.2 The dependence of dryer cost on evaporation capacity in kg moisture/h and inlet-air temperature in 8C,
according to
¼ 1100).
TABLE 53.3
Param eters A and c in
Dryer Type
Capacity Range
Parameter
Construction
Equipment Included
A
c
Cabinet (atmospheric)
16 < V < 160
7
0.50
Aluminum
Heater, instrumentation
Cabinet (low vacuum)
5 < V < 30
18
0.62
Aluminum
Heater, instrumentation, vacuum pump
Vacuum with unheated agitator
0.02 < V < 9
66
0.30
Carbon steel
Vacuum with unheated agitator
0.02 < V < 9
103
0.42
304-stainless steel
Vacuum double-cone tumbler
0.1 < V < 14
80
0.70
304-stainless steel
Indirect rotary (steam tube)
3 < V < 300
55
0.58
Carbon steel
a
Instrumentation
Drum (single or double)
1 < S
b
<
40
21
0.50
Cast iron
Drive, fan
Belt conveyor (through-flow)
18 < S
c
<
50
21
0.59
304-stainless steel
Drive, fan, steam heater
Direct rotary, flue-gas heated
20 < S < 300
17
0.68
Carbon steel
d
Drive, burner, heat exchanger, fan, dust
collector, instrumentation
Direct rotary, hot-air heated
20 < S < 300
14
0.66
Carbon steel
d
Drive, burner, heat exchanger, fan, dust
collector, instrumentation
Fluid bed (batch)
0.003 < V
e
<
0.66
141
0.47
304-stainless steel
Heater, fan, filter, instrumentation
Spray
1 < V < 300
47
0.52
304-stainless steel
Heater, atomizer, fan, filter,
instrumentation
Vibrated bed
1 < S
f
<
12
9
0.70
Carbon steel
g
a
For 304-stainless steel, cost is multiplied by 1.7.
b
Drum peripheral surface area.
c
Deck surface area.
d
For 304-stainless steel, cost is multiplied by 1.5.
e
Bed volume.
f
Surface area of vibrated grid.
g
For 304-stainless steel, cost is multiplied by 1.64.
Note: Dryer capacity is defined by dryer volume V in m
3
or surface area S in m
2
.
ß
2006 by Taylor & Francis Group, LLC.
more chemical- resistant material, a claddin g may be
applie d in so me cases. In certain drying operatio ns,
optimu m de sign of the equipment as well as pro duct-
quality requ irements calls for the use of not only more
durable but also more expensi ve material s. In general ,
drying equipment built of 304-stai nless steel typic ally
costs from 1.5 to 1.7 tim es more than that made of
carbon steel and 2 to 3 times more if built of titanium .
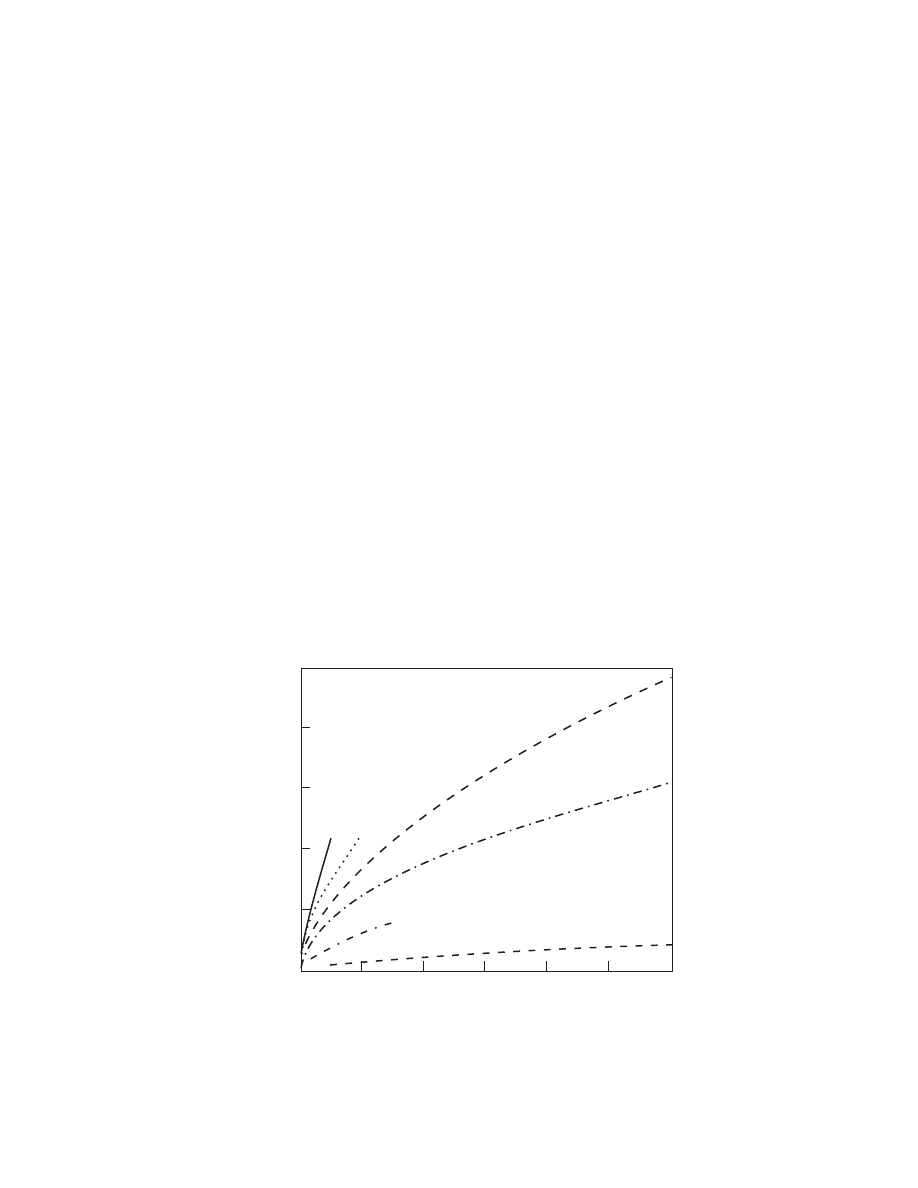
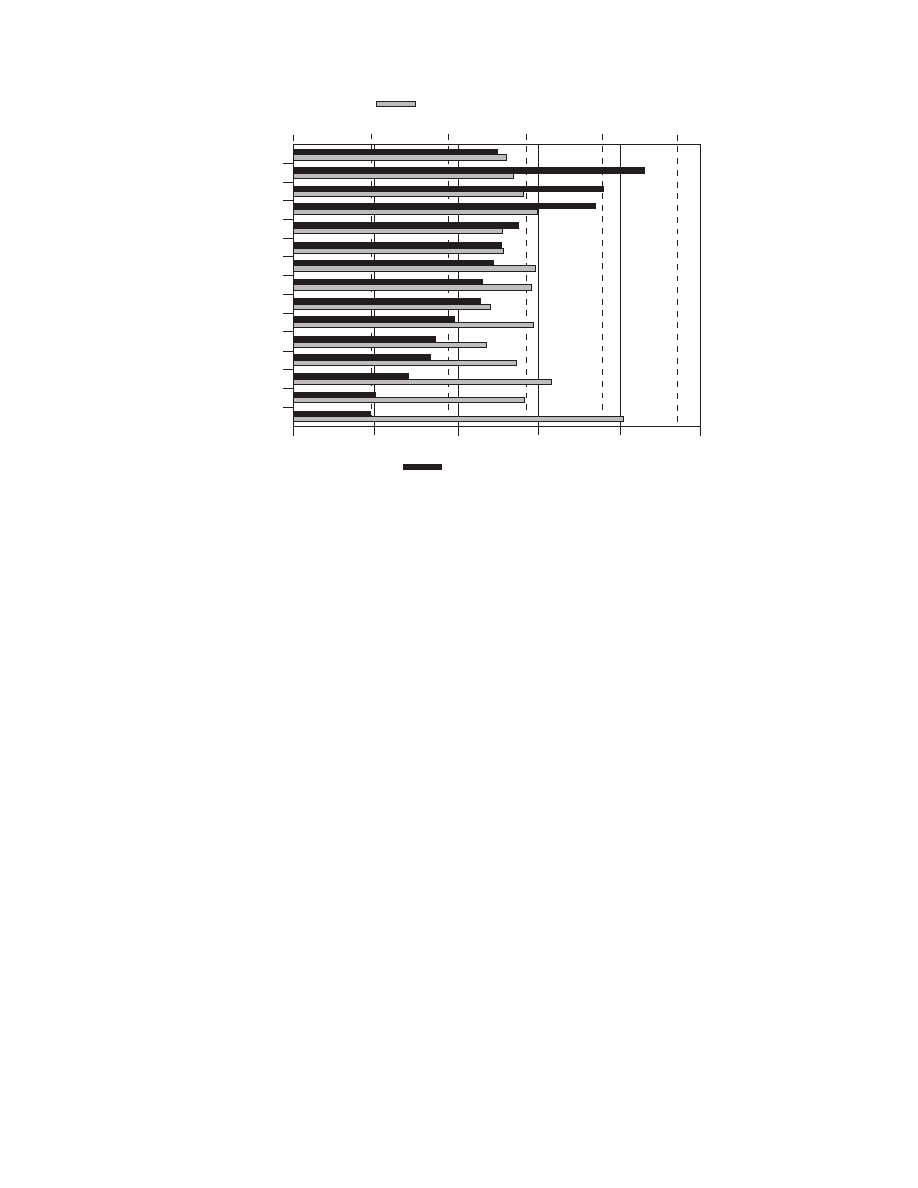
The co st depen ds also on the au xiliary e quipment ,
and this is a reason for some uncerta inty in co st
predict ion from literat ure sources withou t vend ors’
data. Figu re 53.3 present s, as an exampl e, the pur -
chase co st for severa l dryers in relat ion to their ca p-
acity that is updated to the yea r 2000 wi th the M&S
Index equal to 1089.
Once the FOB costs of all equipment compri sing
the drying syst em are establ ished, the install ed cost
and other costs of the plan t, as well as fixed costs , can
be estimat ed us ing the factor method of cost estima-
tion. Usually, the follo wing co mponents of inst alled
cost are consider ed:
1. FOB cost (vendo rs’ prices or estimat ed prices)
2. Assembly, piping, wiring, instrumentation using
vendors’ data, or the following factors:
.
Fully eq uipped compact syst em—25 to 3 0%
of FOB cost
.
Fully equipped syst em, deliv ered in many
parts —40 to 45% of FOB cost
.
Equip ment delivered without piping and in-
strumen tation—71 to 99% of FOB cost
3. Freight (funct ion of trans port method, weight,
and dist ance, or 7% of [componen t 1
þ com-
ponent 2])
The total direct co st of the plant ex pressed in
terms of the ‘‘batter y limit s’’ is much higher than the
install ed cost of the equ ipment becau se of addition al
costs such as
.
Buildi ngs, laborat ories , wareh ouses
1. If a dryer syst em is inst alled insid e a build-
ing, the cost of the bui lding is fact ored in as
20 to 35% of the inst alled cost.
2. If a dryer system is outsi de of the buildin g,
the cost of the building is factored in as 1 5%
of the inst alled cost.
.
Utility-supply facilities, site development,
other direct expenses (20 to 40% of the in-
stalled cost).
To roughly estimate the total direct cost of the dry-
ing installation, it is recommended to multiply the
equipment FOB cost by a factor of 2.25 if the equip-
ment is made of carbon steel or by 2.75 if stainless-steel
equipment is used [22]. These figures include the cost of
piping, instrumentation, electrical connections, insula-
tion, building space, and engineering when applied to
0
20
40
60
80
100
120
0
200,000
400,000
600,000
800,000
1,000,000
V, (m
3
)
6
5
4
3
2
1
Cost, (US$)
FIGURE 53.3 FOB costs (US$, in the year 2000) vs. dryer volume in m
3
of selected dryers according to
: 1,
atmospheric cabinet dryer (aluminum); 2, vacuum cabinet dryer (aluminum); 3, spray dryer fully equipped (304-stainless
steel); 4, steam tube rotary dryer (carbon steel) with instrumentation; 5, vacuum dryer with unheated agitator (304-stainless
steel); 6, double-cone tumbler dryer (304-stainless steel).
ß
2006 by Taylor & Francis Group, LLC.

spray, flash, rotary, or fluid-bed continuous dryers. In
specific cases, however, different factors may have to be
used. For instance, the costs of instrumentation and
piping may be included in the purchase price of a fully
equipped dryer [23].
Besides the total direct cost, the FCI of a drying plant
contains
.
Contractor’s fee (10 to 27% of direct plant cost)
.
Insurance, customs, taxes, land, and other
owner’s costs (as per local regulations or 7% of
direct plant cost)
.
Contingencies (10 to 30% of direct plant cost)
.
Procurement, supervisory, administration, and
other owner expenses related to the plant (5 to
15% of direct plant cost)
Overall, the FCI of a drying plant that is sensitive
to the dryer type and the product processed may be
much higher, even by 3 times of the equipment cost.
A number of dryers that form multistage, combined,
or hybrid drying systems are often assembled from the
components purchased from different suppliers.
Therefore, the cost of the entire installation is not
directly related to the dryer capacity but depends
greatly on the cost of the ancillary equipment. When
other operations such as conveying, grinding, or
screening must be performed simultaneously with dry-
ing, the investment and operating costs can be reduced
significantly by allowing for a partial write-off of the
dryer cost for these secondary functions [13].
53.3 FIXED COST
Fixed costs (fixed charges) of a drying process are
incurred for a long period of time and tend to be
unaffected by fluctuations in the production level.
The factor method of fixed-cost estimating is based
on some simplifications such as:
.
Fixed cost of drying is a function of installed
cost of a drying system and FCI.
.
Variable part of maintenance cost is given to-
gether with fixed part as a percentage of FCI.
The factors depend on the current economic conditions
that should be analyzed up front, especially interest
charges for the investment. Also the inflation index for
local currency should be taken into account. In devel-
oped countries, the estimation of an annual fixed cost for
drying can be made on the basis of the following factors:
.
Depreciation of equipment—7 to 9% of in-
stalled cost
.
Depreciation of buildings, utility facilities, site
improvement—5% of these costs
.
Interest charges on the investment—3 to 5% of
FCI
.
Fixed taxes and rent—2% of FCI
.
Plant protection, insurance—1% of FCI
.
Maintenance cost (fixed and variable):
1. Complex system, explosive or toxic raw ma-
terials, significant number of rotating or vi-
brating parts—10% of FCI
2. Simple system—5% of FCI
.
Executive salaries and other fixed costs
6%
of FCI
53.4 VARIABLE COST
The variable cost of drying is the last item in the cost-
estimation process and it is predicted on the basis of
heat and mass balances, shortcut factors, or, if avail-
able, vendors’ data, unit cost of raw materials, labor,
and utilities.
The cost of raw material depends on the applied
technology and required characteristics of the end
product. In any case, this cost should take into ac-
count the transportation costs to the considered site.
When one compares several drying methods for the
same product, it may be convenient to judge only
costs of the lost and degraded material.
The cost of labor depends significantly on the
mode of a drying process: batch or continuous. The
labor cost of batch processes depends on the quantity
of handled material, the type of the equipment, the
method of material transportation, the method of
feeding, and the schedule of plant operation. Rough
estimation can be made considering the following
rule: 2 man-hour/(m
3
of dried material)
þ 1/3 man/
dryer/shift. The unit cost of labor should reflect the
local economic conditions and the cost should include
the insurance, taxes, and social charges. The labor
cost of continuous drying with an automatic process
control is almost independent of the production rate
because supervision of control panels and supervision
of the feeding and discharge systems do not depend
on the throughput of the drying system. Overall, with
the increasing automation, the direct labor cost de-
creases, but they are somewhat offset by the increase
in labor cost to maintain the control devices and
higher initial capital costs. Rough estimation can be
made considering the following rule: 1/2 man/dryer/
shift
þ operating labor of the other equipment in add-
ition to the dryer.
The utilities costs are usually estimated on the
basis of mass and heat balances, on the equipment
characteristics, and on the utilities’ prices. The prices
ß
2006 by Taylor & Francis Group, LLC.
of util ities have to be co rrected for local co ndition s
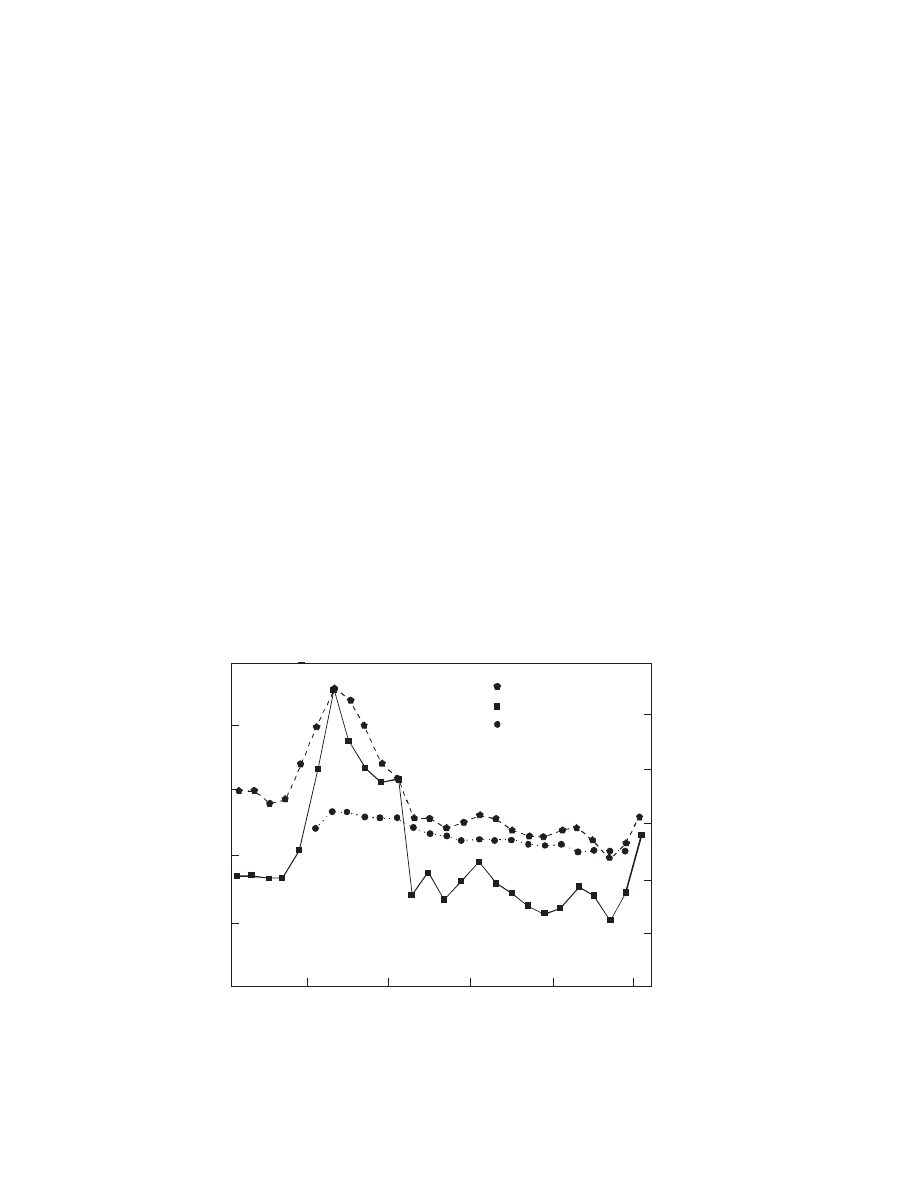
and historical trends . The main constr aint at this
point is the cost of energy becau se of unstabl e prices
of fuels, which may signi ficantl y vary bot h in the long
and sho rt term s. The hist orical trends are sho wn in
Figure 53.4, wher e one ca n see the well- known effe cts
of the Irani an Revol ution and the Iran–I raq W ar
during 1979–198 0 on the crude oil and seconda ry
fuel prices . Besides fuel-pri ce fluctuat ion caused by
historical ev ents, there is also a seasonal fluc tuation
influenced by sup ply and de mand. For examp le, price
of heati ng oil given by NYMEX increa sed from 32
/c/L in Sep tembe r 200 4 to 40 /c/L in Octo ber and
Novem ber 2004, and then decreas ed to 34 /c/L in
January 2005 [24].
Fuel -prices da ta an d estimat ion for the years 2001–
2006 in the US market are present ed in
Trends of elect ricity prices indicate slow er increase
than the increa se of natural gas and oil prices [26] .
In lon g term s, the most stable prices are ch aracteris -
tically for elect ricity and coal though the cost of c oal
delivery and managi ng may be signifi cant. Average
costs of co al recei pts at elect ric-uti lity plants in
the United States by some states in dollar s (Sprin g,
2000) per sho rt ton are present ed in
More infor mation on fuel prices can be found on the
http: //www.w trg.com/ prices.htm
The problem of energy price vo latility can be re-
solved by dividin g the utility price into separate term s,
each of them be ing a produ ct of a certa in coefficie nt
and the price parame ter [27]. The first term reflect s
the co nventio nal inflati on rate whi le the second one
repres ents the con tribution from the fuel price:
P
utility
¼ A (CE Inde x) þ B P
fuel
(53 : 6)
The utility cost coeffici ents A and B are charact eristic
of the con sidered utility and can be given eithe r by a
single number, as in the ca se of purchased electrici ty
(A
¼ 0.0001 3 an d B ¼ 0.01), or by a correl ation, as in
the case of compres sed air ( A
¼ 0.0000 5 q
0.3
ln p
and B
¼ 0.0009 ln p, where q and p are the total air-
plant capacit y and the delivered a ir pressur e, respect -
ively). Tabul ated data on the utilit y co st coeffici ents
are given by Ulrich [27,28]. The CE Ind ex in Equation
53.6 is the Plant Cost Index report ed monthl y in
Chemic al Eng ineering .
The varia ble maint enance cost, accordi ng to the
previous assum ption, is estimat ed toget her with a
fixed part in relation to FCI.
1975 1980 1985 1990 1995 2000
0
10
20
30
40
50
60
250
200
150
100
50
0
Gasoline
Crude oil
Bitum. Coal
Year
1 Barrel, petroleum (US) = 158.987 L
1 Gallon (US) = 3.785 L
1 Short Ton = 907.185 kg
US$ /Barrel
US /Gallon ; US$ /Short Ton
FIGURE 53.4 Average US first-purchase price of crude oil (1996 US$/barrel)—the right scale, gasoline price (1995 US /c/
gallon)—the left scale, and bituminous coal in 1996 US$/short ton—the left scale. (From US Energy Information Agency
(
ß
2006 by Taylor & Francis Group, LLC.

TABLE 53.4
Fuel Prices for the Years 2001–2006 (United States)
Year 2001 2002 2003 2004 2005 2006
Crude oil spot prices (FOB) ($/barrel) 21.2 (March) 22.5 (March) 26.5 (March) 31.1 (March) 47.6 (March)
Crude oil West Texas intermediate ($/barrel) 31.12 (year) 41.44 (year) 58.77 (year prediction) 63.46 (year prediction)
No. 2 heating oil, wholesale ($/gallon) 0.76 (year) 0.69 (year) 0.88 (year) 1.13 (year) 1.70 (year prediction) 1.76 (year prediction)
Natural gas, City Gate ($/thousand cubic feet) 5.72 (year) 4.12 (year) 5.8 (year) 6.6 (year) 7,18 (June)
Natural gas, average Wellhead ($/thousand cubic feet) 4.01 (year) 2.95 (year) 4.89 (year) 5.50 (year) 7.81 (year prediction) 7.64 (year prediction)
Natural gas residential average price ($/thousand cubic feet) 9.63 (year) 7.89 (year) 9.51 (year) 10.74 (year) 13.03 (year prediction) 15.33 (year prediction)
Electricity nominal industrial average retail prices ( /c/kWh) 5.04 (year) 4.88 (year) 5.13 (year) 5.11 (year) 5.71 (June)
Electricity residential average prices ( /c/kWh) 8.62 (year) 8.46 (year) 8.70 (year) 8.92 (year) 9.22 (year prediction) 9.37 (year prediction)
Imported coal average prices ($/short ton) 33.72 (year) 35.51 (year) 31.45 (year) 37.52 (year) 46.49 (June)
Coal (11,700 Btu, 0.8 lb SO
2
/mm Btu) spot price ($/t) 18 (September) 17 (September) 30 (September) 37 (September)
Coal for electric power sector ($/million Btu)
1.23 (year)
1.25 (year)
1.27 (year)
1.35 (year)
1.55 (year prediction)
1.62 (year prediction)
ß
2006
by
Taylor
&
Francis
Group,
LLC.
Servicing the working capital depends on the
credit value and its type, as well as on the interest
rate. It is reasonable to assume the credit to be equal
to the variable cost of a drying process. In developed
countries the interest charges on the working capital
can be estimated as 4 to 7% of the annual credit, but it
is strongly recommended to consider local conditions.
Royalties usually do not occur; but when a
profit is calculated on the basis of new technology,
royalties should be taken into consideration as a
cost item.
When comparing the competing drying technolo-
gies, it is recommended to relate the capital invest-
ment (FCI) and the annual drying costs to the annual
production rate. Usually, comparable estimates are
made on optimistic and pessimistic assumptions of
the level of costs (level of factors). With progress in
computer-aided design, a number of software pro-
grams have been custom-developed in order to provide
the engineers with an efficient tool for calculations
of approximate cost [29,30]. Although such software
programs are necessarily provided without warranty
of any kind, the reliability of the estimate of +30%
covers the majority of the cases tested. An implemen-
tation of a process simulator with a cost evaluator is
useful for the analysis of variants of a new plant,
especially for
.
Process calculation and equipment sizing
.
Estimating fixed investment cost
.
Performing a scheduling calculation, including
direct and indirect labor costs
.
Providing a detail evaluation of production cost
.
Evaluating project profitability
53.5 DRYING COST ESTIMATE:
A WORKED EXAMPLE
The following example of the cost-estimate procedure
made in the year 2005, for example, illustrates the
method of a preliminary cost evaluation for a drying
process.
Problem description: Based on the previously cal-
culated balance and one-parameter dryer sizing, the
‘‘factored estimate’’ for a cost of the laundry detergent
formulating and drying in a spray dryer is to be done.
The system will be located in Pennsylvania in the year
2006. The required capacity of the dryer is 4.9 t of the
product per hour (production period: 7,200 h/y; 35,280
t of dry product per annum) of which the moisture
content should be about 7% w/w. The feed moisture
content is 32.5% w/w, the feed temperature is 808C,
and the price of raw materials in the slurry in the year
2003 was US$1.48/kg (dry weight).
0
10
20
30
40
50
0
10
20
30
40
50
Coal: US$/short ton
Natural gas: US$/100 MJ
US total
New York
Michigan
Pennsylvania
Illinois
Kansas
Iowa
North Dakota
Nebraska
Oklahoma
Wisconsin
Indiana
Arkansas
New Jersey
Massachusetts
FIGURE 53.5 Average delivered cost of fossil fuel receipts at US Electric Utility Plants by state; coal: April–June 2000, US$/
short ton; gas: 1999, US$/100 MJ. (From Federal Energy Regulatory Commission, FERC Form 423, ‘‘Monthly Report of
Cost and Quality of Fuels for Electric Plants.’’)
ß
2006 by Taylor & Francis Group, LLC.
The task is to pr edict the cost of drying in a spray
system in the year 2006.
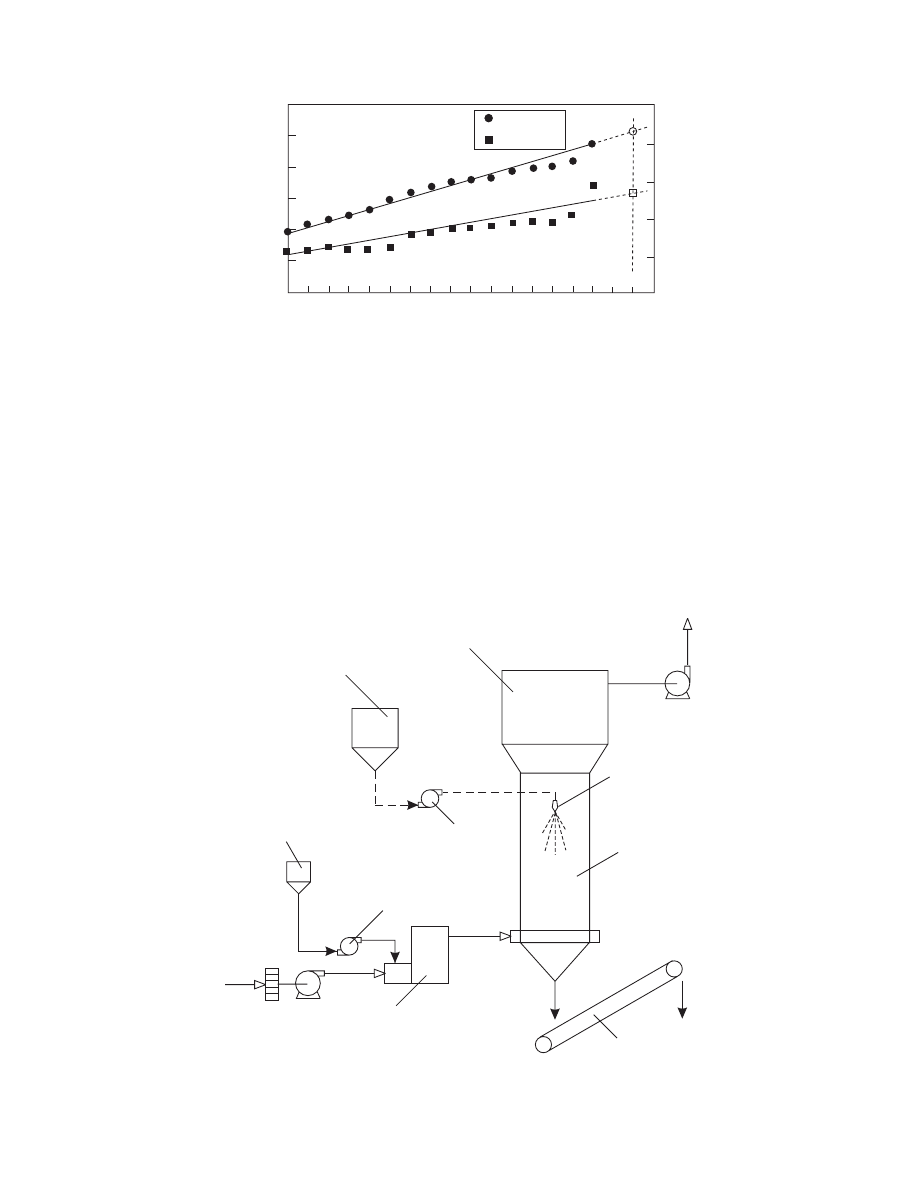
Solu tion: Based on the data presented in
, the M &S Index and the C E Index in the
year 2006 are predicted by linear extrapolation,
as shown in Figure 53.6. The values of the indices
are:
M&S Index
2006
¼ 1221.7
CE Index
2006
¼ 432.1
From previous experience, it is known that the
laundry detergent can effectively be formulated and
dried in a countercurrent spray dryer using combus-
tion gases at 240 and 1208C at the dryer inlet and
1989
1992
1995
2001
1998
2004
2007
Year
M&S Index
1200
1400
1100
1000
900
800
700
CE Index
300
350
400
450
550
500
M&S Index
CE Index
FIGURE 53.6 Trends in the M&S Index (left scale) and the CE Index (right scale) in the years 1989–2004 with extrapolation
to the year 2006.
Conveyor
Fuel
tank
Burner with a
mixing chamber
Air
Slurry tank
Feed pump
Fuel pump
Pressure
nozzle
Bag filter
Exhaust
Spray
dryer
Product
FIGURE 53.7 Flow sheet of the system for drying of the laundry detergent slurry.
ß
2006 by Taylor & Francis Group, LLC.

outlet, respectivel y. The volume tric evapo ration rate
under these condition s is 3.5 kg H
2
O/m
3
h.
For the prelimina ry c ost estimat e, an assump tion
is made that ambie nt air is heated by the co mbustion
of fuel oil; the flue gases a re then mixe d with fres h air
to ensure the requir ed gas tempe ratur e. Taking into
accoun t the specifics of the dr ying technol ogy, mois -
ture content of the feed, a s wel l a s fine s that are
likely to be entrai ned with the drying gas, the dry ing
plant sho uld co nsist of a slurry feedin g syst em, an oil
burner with a second ary air-mi xing ch amber, a dr yer
with pressur e nozzles, an d an exhaust -gas cleaning
system (
). As product co oling, mixing of
supplem ents, and pa ckaging are down stream pro -
cesses, they are outsi de of the ba ttery limits of the
consider ed pro ject. The basic material of constru ction
should be stainles s steel .
The following values a re known from the heat and
mass balances :
The mass flow rate of the flue gas–air mixtu re
enteri ng a dryer: 44,000 kg/h
The quantit y of fuel oil fed to the bur ner: 300 L/h
(inclu ding he at losse s)
The power of electrica l motor s: 190 kW
Accor ding to the specified values of the dryer
capacity and the v olumetric evap oration rate (3.5 kg
H
2
O/m
3
h), the dryer volume should be 570 m
3
.
Hence, the dryer FO B c ost in the year 2006 can be
calculated from
P
¼ 1221 :7 47 570
0 :52
¼ 1,554,000
(in the year 2006, US $)
Accor ding to the data present ed in
, the
above value includes the cost of a dryer, a fan, a filter ,
a heater , and the inst rument ation. The co st of the
remaining equ ipment calcul ated on the ba sis of the
past cost data is US$201,00 0 (in the year 2006). Then
the cost of the entire drying system is to be
US$1, 757,000 . The install ed cost of the syst em shou ld
contai n the co mponents present ed in Tabl e 53.5. As a
result of calcul ations, the fixed cost for drying of
35,280 t/y of the laun dry detergen t is predicted for
the year 2006 at the level of US$1,449,780 per annum,
resulting with US$41.09/t of dried product.
TABLE 53.5
Application of the Factor Method for Predicting Fixed Capital Investment and Fixed Cost of Drying (Data
for the Presented Example)
It.
Cost
Factor Range and Cost Basis
Estimate (US$)
A
FOB cost of equipment
Vendors’ data or actualized
previous data
1,757,000
B
Assembly, piping, wiring, instrumentation (1,757,000
0.4)
30–99% of FOB cost
702,000
C
Freight ([1,757,000
þ 702,000] 0.07)
Weight, distance, or 7% of (A
þ B)
172,200
D
Installed cost
(A
þ B þ C)
2,632,000
E
Building (2,632,000
0.3)
15–35% of installed cost
789,600
F
Utility facilities, site development (2,632,000
0.2)
20–35% of installed cost
526,400
G
Direct cost of plant
(D
þ E þ F)
3,948,000
H
Insurance, custom, taxes (3,948,000
0.07)
7% of direct cost
276,360
I
Contractor’s fee (3,948,000
0.2)
10–27% of direct cost
789,600
J
Contingencies (3,948,000
0.15)
10–30% of direct cost
592,200
K
Procurement, supervisory, administration,
and other owner expenses related to the plant (3,948,000
0.07)
5–15% of direct cost
276,360
L
Fixed capital investment
(G
þ H þ I þ J þ K)
5,882,520
1
Depreciation of drying system (2,632,000
0.09)
7–9% of installed cost
236,880
2
Depreciation of building, utility facilities and site improve
([789,600
þ 526,400] 0.05)
5% of building, utility facilities
and site improve costs
65,800
3
Interest charges on the investment (5,882,520
0.055)
3–5% of FCI
294,130
4
Constant taxes and rent (5,882,520
0.02)
2% of FCI
117,650
5
Plant protection, insurance (5,882,520
0.01)
1% of FCI
58,830
6
Maintenance (4,843,000
0.055)
5–10% of FCI
323,540
7
Executive salaries and other fixed costs (5,882,520
0.06)
6% of FCI
352,950
8
Fixed cost of drying (annual)
1,449,780
9
Unit fixed cost of drying
41.09/t
ß
2006 by Taylor & Francis Group, LLC.

According to the forecast for the year 2006, the
cost of fuel oil (loco system) will probably approxi-
mate 46.5 /c/L and the unit cost of electrical energy
will be of about 6 /c/kWh. The unit cost of raw
materials in the year 2006 predicted on the basis of
the price in the year 2003 as US$1.48/kg (dry weight)
as well as the values of the CE Index
2003
and the
predicted CE Index
2006
is
1:48
432:1
402:0
¼ $1:59=kg
The unit labor cost with insurance, tax, social, and
other personal expenses is expected at US$27/h and
the interest rate of about 4%. The variable cost items
for drying of the laundry detergent slurry calculated
according to the presented method are summarized in
Table 53.6. The predicted variable cost is about
US$1,685,699 per annum and US$47.78/t of dried
product. Then, the expected unit cost of drying of the
laundry detergent in the year 2006 will most likely be
US$41:09=t
þ US$47:78=t ¼ US$88,87=t
Because the fixed part of the unit cost includes the
variable part of the maintenance cost (as in the as-
sumption), the value to be compared with the costs of
alternative technologies for drying of the laundry
detergent should be the sum of both costs, i.e.,
US$0.089/kg.
SUMMARY
Very often, the published cost data (a primary re-
source is Chemical Engineering) refer to a specific
year and apply to a location of the plant in North
America. It is therefore necessary to correct the cost
estimate for the inflation index and also for different
geographical locations. Local cost of energy, as well
as the local regulations (environmental, taxes, cus-
tom) and legislative requirements, must be considered
carefully on a case-by-case basis to estimate the dry-
ing costs at different locations using the published
cost data for the United States. Also, no warranty
can be made concerning the accuracy of the published
correlations or data on costs of dryers, ancillary equip-
ment, as well as fuel and energy costs, but these data
are very useful for the shortcut methods of cost ana-
lyzing and for preliminary prediction of costs of a
drying process on optimistic and pessimistic levels.
ACRONYMS
CE Index
Chemical Engineering Plant Cost Index
FCI
Fixed capital investment
FOB
Free-on-board
M&S Index Marshall and Swift Index
w/w
Weight by weight
REFERENCES
1. J.S. Page. Conceptual Cost Estimating Manual. Hous-
ton, TX: Gulf Publishing Company Book Division,
1984.
2. M.S. Peters and K.D. Timmerhaus. Plant Design and
Economics
for
Chemical
Engineers.
New
York:
McGraw-Hill, 1980.
3. T. Peters and J. Timmerhaus. Chemical Plant Cost and
Designs. New York: McGraw-Hill, 1993.
4. C.H. Chilton (Ed.). Cost Engineering in the Process
Industries. New York: McGraw-Hill, 1960.
5. R.S. Hall, W.M. Vatavuk, and J. Matley. Chem. Eng.
95(17): 66–75, 1988.
6. A. Chauvel, P. Leprince, Y. Barthel, C. Raimbault, and
J.P. Arlie. Manual of Economic Analysis of Chemical
Process. New York: McGraw-Hill, 1981.
7. J.W. Hackney. Control and Management of Capital
Projects. New York: Wiley, 1965.
8. D. Noden. Chem. Proc. Eng. 50(10): 67–70, 1969.
9. J.J. McKetta, Ed. Unit Operations Handbook. New
York: Marcel Dekker, 1993.
TABLE 53.6
Predicted Variable Cost of Drying (Data for the Presented Example)
It.
Cost
Cost Basis
Estimate (Annual, US$)
A
Fuel
300 L/h
7200 h 46.5 /c/L
1,004,400
B
Electricity
190 kW
7200 h 6.3 /c/kWh
86,184
C
Labor
2 workers
8760 h $27/h
473,040
D
Royalties
Neglected
0
E
Lost of raw material
5 kg/h
7200 h $1.59/kg
57,240
F
Working capital servicing
(A
þ B þ C þ D þ E) 4%
64,835
G
Variable cost
1,685,699
H
Unit variable cost of drying
(G/35,280 t)
47.78/t
ß
2006 by Taylor & Francis Group, LLC.

10. Z.T. Sztabert. In: A.S. Mujumdar, Ed. Drying of Solids .
New Delhi: Sarita Prakashan, 1990, pp. 136–153.
11. Marshall and Swift Equipment Cost Index. Chem. Eng .
Last pages of every issue.
12. B. Plavsic. Chem. Eng . 100(8): 100–104, 1993.
13. R.H. Perry, D.W. Green, and J.O. Maloney. Perry’s
Chemical Engineers’ Handbook. New York: McGraw-
Hill, 1984.
14. L. Pintelon and F. Van Puyvelde. Chem. Eng . 104(8):
98–104, 1997.
15. A . V . B r i d ge w a t e r . Chem. Eng. 8 6( 24 ) : 1 19 – 12 1,
197 9.
16. J.T. Gallagher. Chem. Eng . 76(6): 196–202, 1969.
17. K.M. Guthrie. Chem. Eng . 76(6): 114–142, 1969.
18. I.V. Klumpar and S.T. Slavsky. Chem. Eng . 92(15):
73–75, 1985.
19. I.V. Klumpar and S.T. Slavsky. Chem. Eng . 92(17):
76–77, 1985.
20. C.A. Miller. Chem. Eng. 86(14): 89–93, 1979.
21. W.M. Vatavuk. Chem. Eng . 102(8): 68–71, 1995.
22. C.M. Van’t Land. Industrial Drying Equipment. New
York: Marcel Dekker, 1991.
23. S.F. Sapakie and T.A. Renshow. In: B. McKenna, Ed.
Engineering and Food: Processing Application , Vol. 2.
Amsterdam: Elsevier, 1984, pp. 927–937.
24. OilEnergy.com. Nymex Heating Oil Price.
25. U.S. Energy Information Administration.
26. Energy Shop.com. Brokers of Natural Gas & Electri-
http://www.energyshop.com/es/default.cfm
27. G.D. Ulrich. Chem. Eng. 79(2): 110, 1992.
28. G.D. Ulrich. A Guide to Chemical Engineering Process
Design and Economics. New York: Wiley, 1984.
29. N. Basta. Chem. Eng. 102(4): 151–154, 1995.
30. J.C. Kemp, N.J. Hallas, and D.E. Oakley. Develop-
ments
in
Aspen
Technology
Drying
Software.
Proc. IDS2004, Sao Paulo, Brazil, pp. 767–774,
2004.
ß
2006 by Taylor & Francis Group, LLC.

Document Outline
- Table of Contents
- Chapter 053: Cost-Estimation Methods for Drying
Wyszukiwarka
Podobne podstrony:
Semi Empirical Method for Estimating the Combustion Wave Transition through the Contact Surface in a
Free Energy Bedini Device And Method For Pulse Charging A Battery Patent Info 2004
Fibonacci Practical Fibonacci Methode For Forex Trading
Improvements in Fan Performance Rating Methods for Air and Sound
Combinatorial Methods for Polymer Science
Metallographic Methods for Revealing the Multiphase Microstructure of TRIP Assisted Steels TŁUMA
Methodology for Assessment Biodiversity
Influence of drying methods on drying of bell pepper (Tunde Akintunde, Afolabi, Akintunde)
FOREX Systems Research Practical Fibonacci Methods For Forex Trading 2005
Numerical Methods for Engineers and Scientists, 2nd Edition
Advanced Methods for Development of Wind turbine models for control designe
ASTM D638â99 (1999) [Standard Test Method for Tensile Properties of Plastics] [13p]
NACA TM 948 A Simple Approximation Method for Obtaining the Spanwise Lift Distribution
Gas chromatography–mass spectrometry method for determining
Checking methods for internal memory size of Galaxy S6 S6Edge Rev2 0
Ken Marshal Practical Fibonacci Methods For Forex Trading
Simple Method for Measuring Recognition Acuity
Cost Estimation Manual
MODELING OF THE ACOUSTO ELECTROMAGNETIC METHOD FOR IONOSPHERE MONITORING EP 32(0275)
więcej podobnych podstron