
Cover photograph:
Unloading fish as part of the daily arrival of fishing boats on Lake Victoria near Entebbe, Uganda;
©FAO/Roberto Faidutti.

From drain to gain in
capture fisheries rents
A synthesis study
FOOD AND AGRICULTURE ORGANIZATION OF THE UNITED NATIONS
Rome, 2010
FAO
FISHERIES AND
AQUACULTURE
TECHNICAL
PAPER
538
by
Gordon R. Munro
Department of Economics and Fisheries Centre
University of British Columbia, Canada
or
Centre for the Economics and Management of Aquatic Resources (CEMARE)
University of Portsmouth, United Kingdom of Great Britain and Northern Ireland

The designations employed and the presentation of material in this information
product do not imply the expression of any opinion whatsoever on the part
of the Food and Agriculture Organization of the United Nations (FAO)
concerning the legal or development status of any country, territory, city or area
or of its authorities, or concerning the delimitation of its frontiers or boundaries.
The mention of specific companies or products of manufacturers, whether or
not these have been patented, does not imply that these have been endorsed or
recommended by FAO in preference to others of a similar nature that are not
mentioned.
The views expressed in this information product are those of the author(s) and
do not necessarily reflect the views of FAO.
ISBN 978-92-5-106575-4
All rights reserved. FAO encourages reproduction and dissemination of material
in this information product. Non-commercial uses will be authorized free of
charge upon request. Reproduction for resale or other commercial purposes,
including educational purposes, may incur fees. Applications for permission
to reproduce or disseminate FAO copyright materials and all other queries on
rights and licences, should be addressed by e-mail to copyright@fao.org and
to the Chief, Publishing Policy and Support Branch, Office of Knowledge
Exchange, Research and Extension, FAO, Viale delle Terme di Caracalla, 00153
Rome, Italy.
© FAO 2010

iii
Preparation of this document
This document presents a synthesis of case studies undertaken to assess resource
rent losses in the world’s marine capture fisheries. The synthesis covers both studies
undertaken within the World Bank and FAO Rent Drain Project as well as other
case studies. The document also contains a summary of the key findings of the
World Bank and FAO study The Sunken Billions: The Economic Justification for
Fisheries Reform.

iv
Abstract
The World Bank/FAO report, The Sunken Billions, argues that the world’s capture
fishery resources are non-performing assets with rates of return, or yields, not
exceeding zero. The cost to the world economy is in the order of US$50 billion per
annum in forgone resource rent. Cases studies commissioned by the World Bank
and FAO support these conclusions and show that economic overexploitation of
capture fishery resources is spread throughout the world, to be found both within
developed and developing fishing states regardless of their economic systems.
The question is what needs to be done to reverse the situation and ensure that
the world’s capture fishery resources come to make their full potential contribution
to the world economy. In order for this potential to be realized, there will need to
be a programme of massive resource investment in the overexploited fish stocks. As
with any such programme, positive investment requires that costs and sacrifices be
borne today in the hope of an economic return in the future. Establishing effective
resource investment programmes within coastal state exclusive economic zones will
be difficult, particularly in the developing world. However, the greatest challenges
are likely to be found in establishing such investment programmes for shared
stocks in the high seas. That said, some of the case studies provide encouraging
lessons with examples of fish stock restorations that are successful in economic, as
well as biological, terms.
Munro, G.R.
From drain to gain in capture fisheries rents: a synthesis study.
FAO Fisheries and Aquaculture Technical Paper. No. 538. Rome, FAO. 2010. 49p.

v
Contents
Preparation of this document
iii
Abstract
iv
Tables and figures
vi
Acknowledgements
vii
Abbreviations and acronyms
viii
1. Introduction
1
2. The rent loss from marine capture fishery resources: an
overview
3
2.1 Capture fishery resources and natural capital
3
2.2 Capture fishery resources and resource rent
3
2.3 The basis of the rent loss estimates
8
2.4 Rent loss estimates: the results
14
3. Origins of the rent drain
17
3.1 The inherent difficulties of capture fisheries management
17
3.2 The inexhaustibility of ocean capture fishery resources
17
3.3 Mining the “inexhaustible” capture fishery resources
18
3.4 Resource management measures: partially conservationist, but
economically destructive
21
3.5 Subsidies
23
3.6 Shared fish stocks
23
4. The way forward
25
4.1 Origins of the rent drain recalled, and levels of fisheries in need of
economic reform
25
4.2 Level 1 fisheries
26
4.3 Level 2 fisheries
32
4.4 Level 3 fisheries
35
5. Summary and conclusions
43
References
45

vi
1. Empirical data used as model inputs and estimation of model
parameters
10
2. Fleet profits: 2004 base year and 1993 FAO study
12
3. Main results: point estimates of resource rents
15
4. Estimate of fisheries subsidies with direct impact on fishing capacity
per year, 2000
23
Tables
1. Annual catch (marine and inland) per capture fisher, 1970–2000
5
2. Fleet productivity development (total decked vessels)
6
3. Maximum sustainable yield (MSY) and maximum economic yield (MEY)
8
4. Comparative yield–effort curves corresponding to the logistic (Schaefer)
and Fox biomass growth functions
9
5. Pacific halibut season length, 1980–2005
30
6. Sablefish season length, 1981–2005
30
7. Pacific halibut: quota values and trend line
31
8. Sablefish: quota values and trend line
31
Figures

vii
Acknowledgements
The author wishes to acknowledge gratefully the many contributors to this
study. They include its coordinators Rolf Willmann (Fisheries and Aquaculture
Department, FAO) and Kieran Kelleher (Agriculture and Rural Development
Department, World Bank), Ragnar Arnason (University of Iceland), who developed
the theory and modelling underpinning the study, Nicole Franz (consultant), who
helped with the statistical analyses, and Andrew Smith and Stefania Vannuccini
(FAO), who provided advice and helped with data compilation. The study was
undertaken as part of the World Bank’s PROFISH Partnership. Study contributors
included the participants of two study design workshops: Max Agüero, Jan Bojo,
Kevin Cleaver, John Dixon, Lidvard Gronnevet, Marea Hatziolos, Eriko Hoshino,
Glenn-Marie Lange, Matteo J. Milazzo, Giovanni Ruta, Kurt E. Schnier, William
E. Schrank, Jon Strand, Laura Tlaiye, Gert van Santen, John Ward, Ron Zweig; and
Serge Garcia, Rognvaldur Hannesson and John Sutinen. The author wishes to thank
in particular the contributors of case studies: Max Agüero, Ragnar Arnason, Trond
Bjørndal, Pongpat Boonchuwong, Stephen Cunningham, Waraporn Dechboon,
Haye Didi, Eriko Hoshino, Lionel Kinadjian, Long Nguyen, Dale Marsden,
Yoshiaki Matsuda, Masud Ara Mome, Fall ould Mouhamedou, Xiaojie Nie, Carlos
Paredes, Purwanto, Rashid Sumaila, Simon Wahome Warui and Yang Zijiang.

viii
Abbreviations and acronyms
DWFS
distant-water fishing state
EEZ
exclusive economic zone
EU
European Union
ICCAT
International Commission for the Conservation of Atlantic Tunas
ICES
International Commission for the Exploration of the Sea
IPHC
International Pacific Halibut Commission
IQ
individual quota
ITQ
individual transferable quota
MEY
maximum economic yield
MSY
maximum sustainable yield
PA
principal–agent
PROFISH
Global Program on Fisheries
PV
present value
RFMO
regional fisheries management organization
SSB
spawning stock biomass
TAC
total allowable catch
UNEP
United Nations Environment Programme

1
1. Introduction
In 2005, the World Bank published the report Where is the Wealth of Nations?
Measuring Capital for the 21st Century (World Bank, 2005). The report contains a
significant gap in that, owing to the then unavailable data, it has nothing to say on
natural capital in the form of fishery resources. In response to this gap, the World
Bank, under its Global Program on Fisheries (PROFISH), mounted a workshop
in 2006 in cooperation with FAO with the objective of correcting the knowledge
deficit (Kelleher and Willmann, 2006).
The workshop recognized the need to focus on, and highlight, the current level
of global economic rent loss in marine capture fisheries and to raise awareness
on the economic objectives of fisheries management. In so doing, the workshop
identified two alternative approaches to the task.
One approach is to estimate the rent and rent loss in each of the world’s
fisheries, or in a representative sample of them. This is a major undertaking. An
alternative simpler approach is to regard the global ocean fishery as one aggregate
fishery. This second approach has several advantages. The data requirements are
considerably reduced. Many of these global fisheries data are readily available
and the model manipulation and calculations are a fraction of those required for a
study of a high number of individual fisheries. The aggregate approach, regarding
the fisheries as a single fishery, was considered by the workshop to be the only
way to obtain, quickly and inexpensively, reasonable estimates of the global
fisheries rent loss, and to do so in a transparent and replicable manner.
On this basis, the workshop recommended that two independent studies
be prepared on the estimation of the loss of economic rents in global marine
fisheries. Each estimate would serve as a cross-check on the other. The first study
would estimate the global rent drain (or potential loss of net benefits) through an
aggregate model of the global fishery. The second companion study would consist
of a set of case studies on economic rents in a representative group of fisheries and
endeavour to extrapolate the results of the case studies to the global level.
In essence, The Sunken Billions: The Economic Justification for Fisheries Reform
(World Bank and FAO, 2009) is a report on the first study. With the case studies
not available to its authors, the report has a very limited number of illustrations
and examples.
The commissioned set of case studies is now largely complete. The purposes
of this synthesis report is to summarize the major findings of The Sunken Billions
report, and then to supplement and buttress these findings by drawing upon the
available case studies. Thus, for example, where The Sunken Billions report talks

From drain to gain in capture fisheries rents
—
A synthesis study
2
in general terms of the overexploitation of capture fishery resources, it is now
possible to point to specific examples of such overexploitation from both the
developed and developing world.
While the case studies commissioned by the World Bank and FAO will provide
the basis for most of the supplementary material, the synthesis report will not
restrict itself to these studies. Other case studies, and articles, will be drawn upon
as deemed appropriate.

3
2. The rent loss from marine
capture fishery resources: an
overview
2.1 CAPTuRe FISheRy ReSOuRCeS And nATuRAl CAPITAl
The World Bank report Where is the Wealth of Nations? (World Bank, 2005) argues
that both the current national income and the prospects for future development of
any nation rest upon that nation’s portfolio of real capital assets. This portfolio is
seen to consist of produced, natural and intangible capital assets, with the latter, in
turn, to be seen as a mix of human and social capital. Development is to be viewed
as a process of real asset portfolio management (World Bank, 2005, pp. 1–5).
The World Bank 2005 report divides natural capital into two components:
exhaustible natural resources, such as hydrocarbons and minerals; and living,
or renewable, natural resources, such as agricultural land, forests and fisheries.
Unlike exhaustible natural resources, renewable natural resources are capable of
providing a sustainable flow of net economic benefits into the indefinite future
and are, to quote the World Bank, “truly a gift of nature” (World Bank, 2005,
p. 7). Marine capture fishery resources constitute a segment of the world’s stock
of natural capital in the form of renewable natural resources and are thus “truly a
gift of nature”.
The report Where is the Wealth of Nations? points out that natural capital
is particularly important in the real capital portfolios of developing nations.
According to the report (World Bank, 2005, p. 8) the net economic returns
from natural capital, loosely referred to as resource rent, play two key roles in
development:
• providing the basis of subsistence, particularly in the poorest nations;
• providing a source of development finance, by furnishing the wherewithal
for investment in other forms of capital, e.g. produced and human capital.
2.2 CAPTuRe FISheRy ReSOuRCeS And ReSOuRCe RenT
The potential significance of the natural capital in the form of capture fishery
resources to the world economy can be gauged from the facts that fisheries based
upon these resources are yielding annual harvests in the order of 85 million tonnes,
which have a “first” gross value of slightly less than US$80 billion. Furthermore,
these fisheries provide employment, direct and indirect, to more than 120 million
people (World Bank and FAO, 2009). Thus, the significance of world capture
fishery resources, actual and potential, to the world economy is not in dispute.

From drain to gain in capture fisheries rents
—
A synthesis study
4
The question that has to be asked of any set of capital assets, produced or
natural, is what economic returns, what flow of net economic benefits, the assets
are providing to society through time. In the case of capture fishery resources, as
with other forms of natural capital, these net economic benefits are referred to as
resource rents. Using 2004 as its base year, The Sunken Billions report, estimates
that, if these capture fishery resources were being managed optimally, they would
be yielding approximately US$50 billion per annum more in resource rent than
they are currently doing. The cumulative loss to society from this less than
optimal resource management in the period 1974–2008, is estimated to be in excess
of US$2 trillion (World Bank and FAO, 2009).
The estimated per annum rent loss of US$50 billion demands further
investigation. It could be that world capture fisheries are yielding significant
resource rent but that, through improved management, the net economic yields,
or returns, could be somewhat higher. Thus, for example, the hake fishery, shared
by Angola, Namibia and South Africa, and the Iceland cod fishery, both fit
the pattern. Both fishery resources are subject to reasonably effective resource
management, and the fisheries based on the resources are producing positive
resource rents. However, the fishery resources are not realizing their full economic
potential.
The Angolan–Namibian–South African hake resource and the Icelandic cod
resource were overexploited in the past. In order for the two fisheries to yield
their maximum net economic returns through time, a programme of resource
investment, i.e. building up the resources, would have to be undertaken (Sumaila
and Marsden, 2008; Arnason, 2008).
However, The Sunken Billions report is not stating simply that overall world
marine capture fisheries are yielding positive resource rents but could do better.
Rather, the report is stating that, if optimally managed, these fisheries could
be expected to yield resource rents in the order of US$45 billion per year. The
resources are, in fact, yielding resource rents in the order of minus US$5 billion
per year. In other words, overall world capture fisheries are currently making a
negative contribution to economic development and to the alleviation of poverty
(World Bank and FAO, 2009, Table 4.1).
Negative capture fishery resource rents are not just a developed fishing state
phenomenon. They are to be found in developing fishery states as well. To take
one example, a case study from Malaysia focuses on capture fisheries in the Straits
of Malacca (Yew, 2008). There is convincing evidence that both demersal and
pelagic fisheries in the northern Straits of Malacca are yielding negative rents,
and that the fisheries are thus making a negative contribution towards Malaysia’s
economic development (Yew, 2008, Table 3.4).
The negative resource rents reported in The Sunken Billions report are net of
subsidies, which means that they may not be sustainable. However, one is given
no assurance that the global rents from marine capture fishery resources will rise
above zero.
The rent loss from marine capture fishery resources: an overview
5
The negative to zero rents yielded by world capture fishery resources are
reflected in the state of the resources themselves. FAO estimates that 25 percent
of the capture fishery resources are overexploited, depleted or recovering, from a
biological point of view, i.e. the resources are below their maximum sustainable
yield (MSY) levels. Another 50 percent are “fully exploited” from a biological
standpoint. As The Sunken Billions report emphasizes, “fully exploited” from
a biological perspective invariably means overexploited from an economic
perspective. Thus, from an economic perspective, 75 percent of the capture fishery
resources are overexploited (World Bank and FAO, 2009).
The economic overexploitation of world capture fishery resources is not fully
reflected in the fish stock levels. It also manifests itself in the fish stock mix. The
more valuable species have been exploited to a much greater degree than those
of lower value. Indeed, the global harvests from capture fishery resources are
concentrated to an ever-increasing degree on the lower valued species (World
Bank and FAO, 2009).
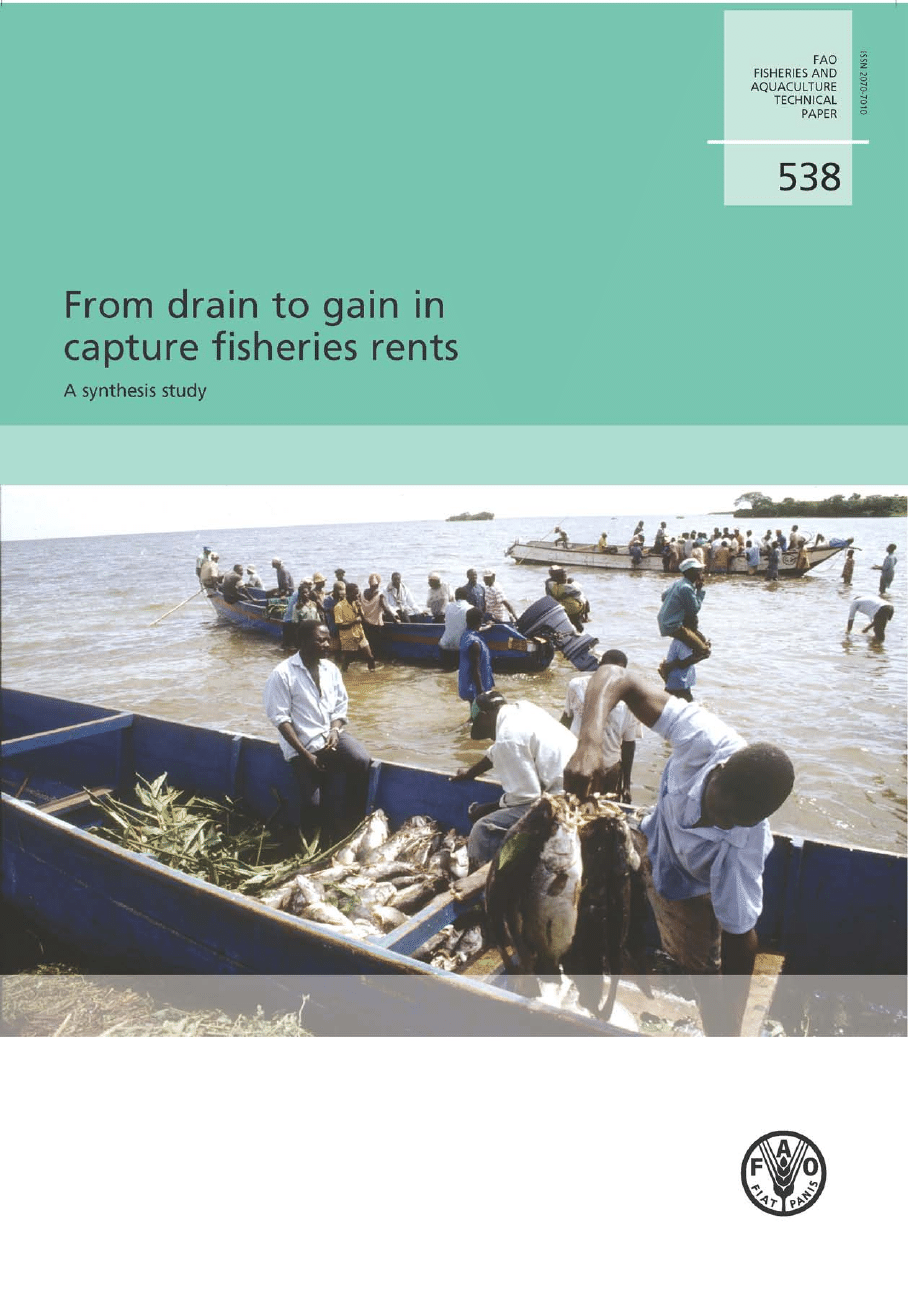
The effects of the economic deterioration of world capture fisheries show up
dramatically in terms of fisher and vessel productivity (Figure 1).
The significance of this decline in average output per fisher has to be seen in
the context of the enormous technological developments that have taken place in
the world’s capture fisheries during this period, including large-scale motorization
of traditional small-scale fisheries, the expansion of active fishing techniques
such as trawling and purse-seining, the introduction of increasingly sophisticated
fish-finding and navigation equipment, and the growing use of modern means of
communication. This technological progress has increased labour productivity
in many fisheries. However, at the aggregate global level, the resource constraint
FIGURE 1
Annual catch (marine and inland) per capture fisher, 1970–2000
Source: World Bank and FAO, 2009, Figure 2.8.
3
3.5
4
4.5
5
5.5
1970
1980
1990
2000
Tonnes
p
e
r
fi
s
h
e
r
p
e
r
y
e
a
r
Year
From drain to gain in capture fisheries rents
—
A synthesis study
in combination with widespread open-access conditions (discussed below) has
prevented an increase in average labour productivity in the world’s capture
fisheries. On the contrary, productivity has declined significantly, a decline caused
by a shrinking resource base and a growing number of fishers.
As the number of fishing vessels has also increased significantly in recent
decades, by 75 percent in numerical terms in the past 30 years (World Bank and
FAO, 2009), at the global level the productivity-enhancing investments in capture
fisheries have on average yielded small returns and have stymied growth in labour
productivity and incomes in the sector.
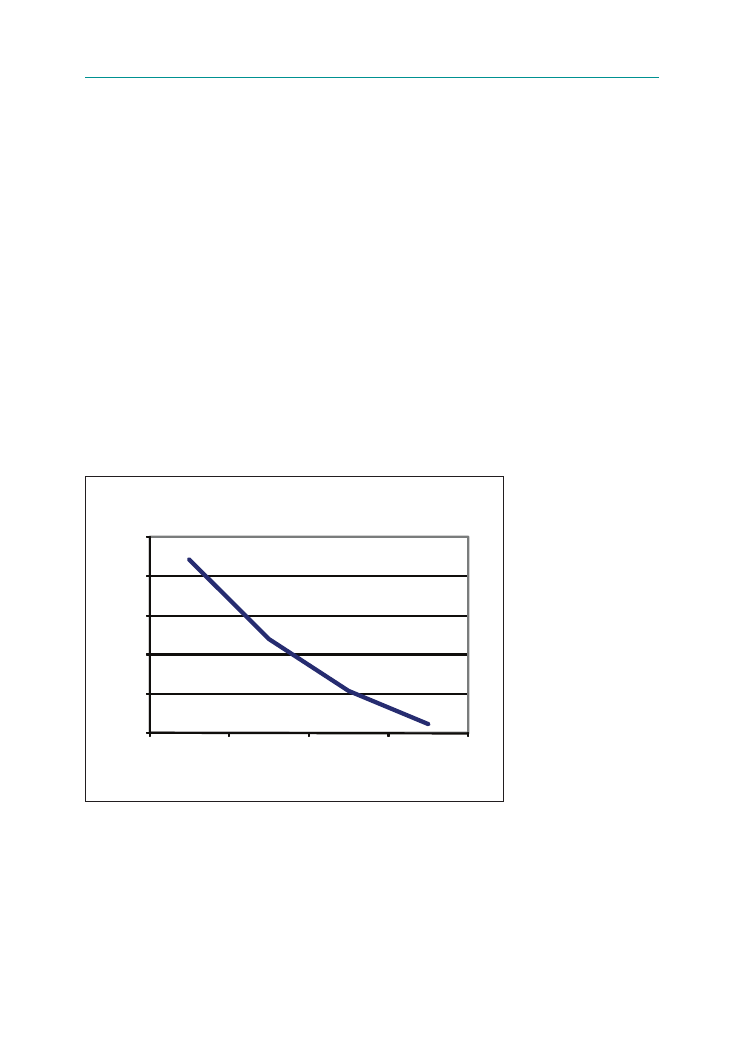
With regard to vessel productivity, it can be noted to begin with that fishing
capacity is the amount of fishing effort that can be produced in a given time by a
fishing vessel or fleet under full utilization for a given fishery resource condition
(FAO, 2000).
Both the increase in vessel numbers and in vessel technology have enhanced the
capacity of the global fleet and facilitated access to an expanding range of marine
fishery resources and more efficient use of these resources.
Fitzpatrick (1996) estimated that the technological coefficient, a parameter of
vessel capacity, had grown at a rate of 4.3 percent per annum. Assuming that this
trend has continued, growth in technological efficiency coupled with growth in
the number of vessels suggests a steeply rising global fleet capacity. The capacity
index shown in Figure 2 is a multiple of the total number of decked vessels and the
technological coefficient. The trend line of the catch/capacity index demonstrates
that the global harvesting productivity has on average declined by a factor of six.
The exploitation of a growing number of marginal fish stocks partly explains
this decline, but the buildup of fishing overcapacity is clearly a major contributing
FIGURE 2
Fleet productivity development (total decked vessels)
Source: World Bank and FAO, 2009, Figure 2.11.
20
40
60
80
100
120
140
0.0
0.5
1.0
1.5
2.0
2.5
3.0
3.5
1970
1980
1985
1990
1995
2000
2005
Ca
tc
h
pe
r v
es
se
l/ca
tc
h
pe
r
un
it
ca
pa
ci
ty
(to
nn
es
)
Nu
m
be
r o
f d
ec
ke
d
ve
ss
el
s/
Fl
ee
t c
ap
ac
ity
i
nd
ex
(f
is
hi
ng
p
ow
er
)
(m
ill
io
n)
Decked vessels (number)
Fleet capacity index (fishing power)
Year
Catch per vessel (tonnes)
Catch per unit capacity (tonnes)

The rent loss from marine capture fishery resources: an overview
7
factor. Thus, the gains from technological progress have generally not been realized
because the fish stocks limits call for a concomitant reduction in the number of
vessels in order to allow for improved vessel productivity.
The decline in physical productivity is compounded by a decreasing spread
between average harvesting costs and average ex-vessel fish prices, causing
depressed profit margins and reinvestment. Although this has a dampening effect
on growth in fleet capacity, depressed fleet reinvestment may retard a shift to more
energy-efficient harvesting technologies and a reduction in the carbon footprint
of the fishing industry.
Many countries have adopted policies to limit the growth of national fishing
capacity, both to protect the aquatic resources and to make fishing more
economically viable for the harvesting enterprises (FAO, 2007). This has proved
difficult and costly to implement in many instances. Even where numbers of
vessels have been successfully reduced (Curtis and Squires 2007), the reduction
in fishing effort has been considerably less than proportional. This is because it
is the less efficient vessels that tend to exit the fishery and expansion in technical
efficiency counters the reduction in vessel numbers.
The global fleet has attempted to maintain its profitability in several ways:
by reducing real labour costs; by fleet modernization; and by introducing
fuel-efficient technologies and practices, particularly in developed countries.
Vessels are also reported to remain in harbour for increasingly longer periods of
the year, focusing harvesting on peak fishing seasons.
The receipt of government financial support has also assisted both vessel
operators and crews, for example, through income compensation for crews.
Subsidies in the world’s marine fisheries have received growing attention in recent
years because of their generally destructive effects, and they are further discussed
later in this report.
Thus, when one talks of the significance of world capture fishery resources
to the world economy, the emphasis must be on the word potential. There are
capture fishery resources in the world that are yielding significant positive net
economic returns. However, overall, the world marine capture fishery resources
have to be categorized as non-performing capital assets.
Two questions arise. The first is how the estimates of resource rent loss were
determined. Are these estimates, in fact, alarmist? It will be argued that, if the
estimates are open to criticism, it is because they are probably too conservative. It
is likely that the estimates understate the true rent loss, and that they do so by a
considerable margin.
The second question to be addressed is how this dismaying state of affairs
arose. Without an answer to this second question, it is not possible to explore and
investigate means of correcting the state of affairs and ensuring that this fisheries
component of the world’s portfolio of natural capital assets begins to realize its
economic potential by making a contribution, exceeding zero, to world economic
development and to the alleviation of world poverty. The two questions are to be
addressed in turn.
From drain to gain in capture fisheries rents
—
A synthesis study
2.3 The basis of The renT loss esTimaTes
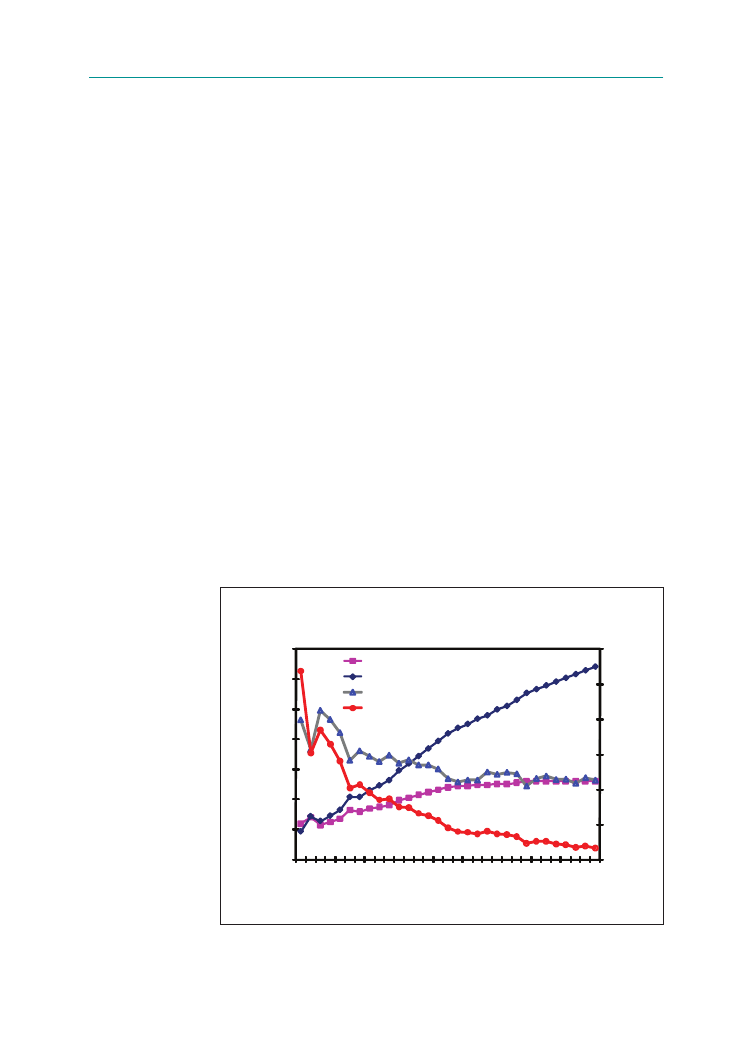
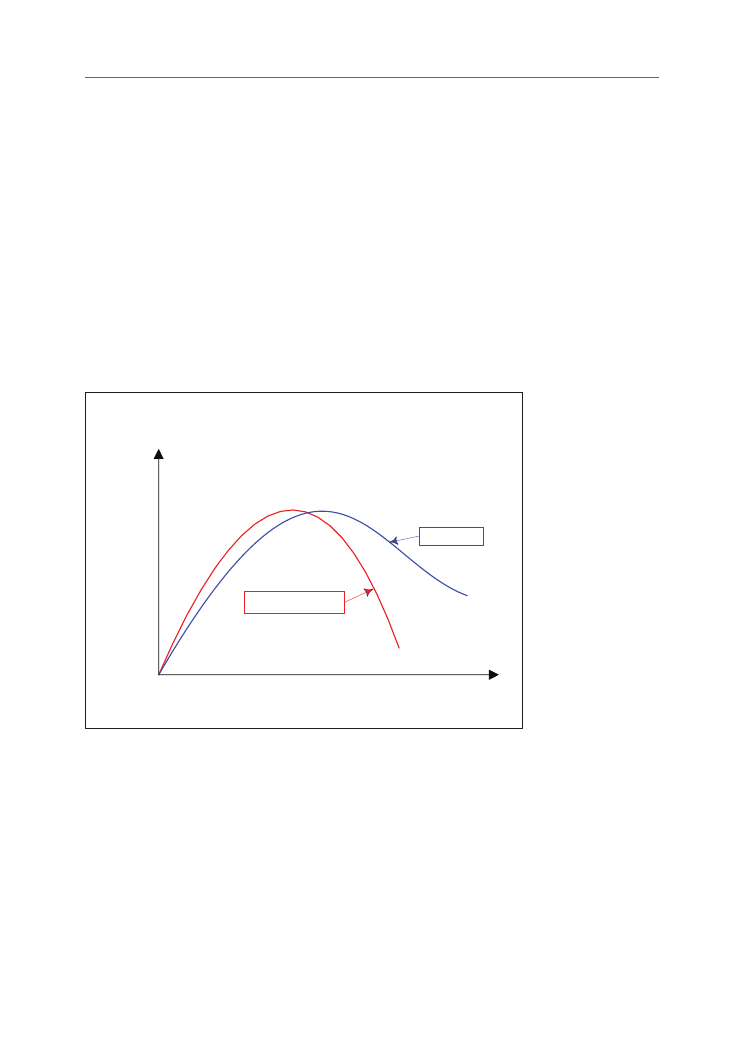
2.3.1 economic rent and maximum economic yield
The concepts of resource rent from the fishery and maximum economic yield
(MEY) as opposed to maximum sustainable yield (MSY), as perceived by the
authors of The Sunken Billions report, are illustrated in Figure 3.
Thus, resource rent is seen as the difference between total revenue arising from
fishing effort (catch times price of harvested fish) and total fishing effort cost.
2.3.2 The aggregate model described
Based on work by Arnason (2007), the authors of The Sunken Billions report
constructed an aggregate model to estimate rent loss for the global marine capture
fishery. The model entails several major abstractions from the real world. In
particular, the model assumes that global fisheries can be modelled as a single fish
stock with an aggregate biomass growth function. Similarly, the global fishing
industry is represented by an aggregate fisheries profit function, composed
of an aggregate harvesting function, relating the harvest to fishing effort and
biomass, and an aggregate cost function relating fishing effort to fisheries costs.
The justification rests on the fact that treating the diverse global marine capture
fisheries as a single aggregate fishery allows for a model with a manageable number
of parameters. It should be added that the authors of The Sunken Billions report
undertook extensive sensitivity analysis and stochastic simulations to establish
reasonable upper and lower bounds and confidence limits for the global fishery
rent losses.
FIGURE 3
maximum sustainable yield (msY) and
maximum economic yield (meY)
Source: World Bank and FAO, 2009, Box 3.2.
Catch at MEY
Fishing effort
Catch at MSY
Catch/yield curve
Cost curve
MEY
Fishing effort at
maximum
sustainable yield
Fishing effort at
maximum
economic yield
Negative
rents
Positive rents
Catch/
yield
The rent loss from marine capture fishery resources: an overview
9
Fisheries, and the rents that they generate, are dynamic and are rarely in
equilibrium. This implies that there are several approaches to the calculation of
rent losses. This study compares maximum sustainable resource rent to the actual
resource rent in the base year (2004). The difference is taken to represent the rent
loss in the base year. The rent loss estimate assumes that the existing biological
overfishing is entirely reversible in the long run. Finally, the estimate does not take
account of the costs of restoring the global fishery to economic health.
The population dynamics of the aggregate biomass (the global fishery)
are modelled through two biological models: (i) a logistic, or Schaefer-type,
model; and (ii) a Fox model. The main difference between these two biomass
growth functions is that the Fox model assumes that the biomass is much more
resilient to increasing fishing effort; in other words, the harvest will not decline
proportionately as fishing effort increases (Figure 4).
This is consistent with the experience from the global fishery that, even
though many of the most valuable demersal fish stocks have become depleted,
the aggregate global harvest has continued to increase and has not contracted
significantly in spite of ever-increasing fishing effort.
The shape of the yield–effort curve is given principally by the carrying capacity,
or pristine state of the fish stock (or stocks), the MSY and the parameters of the
harvesting (catch production) function. Of these parameters, estimates of the MSY
are more robust than estimates of the other two parameters, as comprehensive
global marine fish catch statistics are available for more than 50 years and
harvest trends have been relatively stable for nearly two decades in the range of
79–88 million tonnes.
FIGURE 4
Comparative yield–effort curves corresponding to the logistic
(Schaefer) and Fox biomass growth functions
Source: World Bank and FAO, 2009, Figure 3.1.
Schaefer/logistic
Fox
Fishing effort
Catch/
catch value

From drain to gain in capture fisheries rents
—
A synthesis study
10
Table 1 lists the basic data used to estimate model parameters and model
assumptions. The data sources and the justification for the assumptions are
provided in the set of commentaries below.
The year 2004 is taken as the base year for the model as several robust data sets
are available for that period. Where data for 2004 are deficient, adjusted data from
other years, or series of years, are used.
2.3.2.1 Globalmaximumsustainableyieldandcarryingcapacity
The global MSY is assumed to be higher than the reported marine catch
in the base year (85.7 million tonnes, FAO FISHSTAT) plus estimated
discards (7.3 million tonnes), which gives a total of 93 million tonnes. A value
of 95 million tonnes is used in the model. This value is higher than the
93 million tonnes given earlier, but lower than 101 million tonnes, the sum of the
maximum reported catch for each species group in the past (FAO FISHSTAT). It
is also in the same range as that of 100 million tonnes suggested by Gulland (1971)
and lower than the maximum of 115 million tonnes suggested in the earlier work
by Christy and Scott (1965).
This estimate of the global MSY refers to conventional fisheries only. For
example, Antarctic krill is the subject of increasing attention as new harvesting
technologies develop and markets for Omega-3 fish oils expand. A major
expansion of this fishery could substantially raise the global MSY.
Since the 1990s, reported marine catches have fluctuated between 79 and
86 million tonnes without an apparent trend (FAO, 2007). In light of the estimate
of MSY, this suggests that current global fish stocks are smaller than those
corresponding to MSY.
2.3.2.2 Biomassgrowthinthebaseyear
The fact that aggregate reported catches from the global marine fisheries have
been relatively stable since the 1990s (above) is consistent with the aggregate
global biomass being approximately constant. In this period, in response to
TABLE 1
empirical data used as model inputs and estimation of model parameters
model input values
units of measurement
(i) Biological data
Maximum sustainable yield
95.0
Million tonnes
Global biomass carrying capacity
453.0
Million tonnes
Biomass growth in 2004
–2.0
Million tonnes
(ii) Fishing industry data
Landings in 2004
85.7
Million tonnes
Value of landings in 2004
78.8
Billion US$
Fisheries profits in 2004
–5.0
Billion US$
(iii) Parameter assumptions
Schooling parameter
0.7
No units
Elasticity of demand with respect to biomass
0.2
No units
Source: World Bank and FAO, 2009, Table 3.1.

The rent loss from marine capture fishery resources: an overview
11
fishing pressure, climatic factors and other influences, some stocks have declined
markedly, for example, demersal stocks such as cod and hake in parts of the
Atlantic Ocean. Other stocks have increased, such as some pelagics in the North
Atlantic Ocean, while other large stocks have remained largely unchanged
(FAO, 2005). Overall, it appears unlikely that in the base year, 2004, there was a
significant net increase or decline in global stocks of commercial marine species.
However, because global reported catches in 2004 were close to the upper bound
of annual global catches since the 1990s and reported catches in 2005 were lower, it
is conservatively assumed that in 2004 global marine commercial biomass growth
was negative, or –2 million tonnes.
2.3.2.3 Volumeoflandinginthebaseyear,andreportedandrealmarine
fisheriescatches
In accordance with official FAO statistics (FAO FISHSTAT), the global catch
in the base year (2004) is taken to be 85.7 million tonnes. Acknowledging the
deficiencies of the FAO FISHSTAT records, FAO has repeatedly called for more
comprehensive and accurate reporting of fish catches (Tietze et al., 2001). The level
of acknowledged misreporting and underreporting of catch has been addressed
with varying degrees of success by different authors. The reasons for misreporting
vary widely from deliberate underreporting of quota species and deficiencies in
transmission of information to FAO, to widespread underestimates of small-scale
fisheries production and possible substantial overestimates of fish production
in the case of China and other countries. The estimates of underreporting vary
widely from 1.2 to 1.8 times the catch reported to FAO in relatively well-managed
fisheries, to several times the reported catch in countries with extensive and isolated
small-scale fisheries, or with high levels of illegal fishing (Oceanic Développment,
2001; Kelleher, 2002; MRAG and UBC, 2008; Zeller and Pauly, 2007; Watson and
Pauly, 2001). However, in the absence of a robust basis for adjusting the reported
to the estimated real catch, the FAO FISHSTAT values remain the core data set
for this study.
2.3.2.4 Valueoflandingsinthebaseyear
The value of landings in 2004 is discussed in detail in The Sunken Billions report.
The details are not repeated here. Based on published production value data and
other information, it is estimated that this value was US$78.8 billion (FAO, 2007).
This corresponds to an average landed price of US$0.918 per kilogram.
2.3.2.5 Harvestingcosts
Harvesting costs have to be treated with due caution because of the weak and
incomplete data on the world’s fishing fleets. The data sets used include:
• A robust set of fleet and productivity data for 21 major fishing nations that
contribute about 40 percent to global marine capture production. These data
are biased towards industrial fisheries, but are considered to be representative
of industrial fisheries.

From drain to gain in capture fisheries rents
—
A synthesis study
12
• Detailed cost data available for the European fleets (EU 25), which contribute
about 6 percent to the global marine catch.
• A recent set of costs and earnings data for India’s industrial and small-scale
fisheries (Kurien, 2007). These fisheries contribute about 2.5 percent to
global marine fish harvest. This data set has been taken to represent tropical
developing countries’ small-scale fisheries.
The reader is encouraged to turn to The Sunken Billions report for an in-depth
discussion of the harvesting cost estimates.
2.3.2.6 Profitability
The world’s fishing fleet is estimated to have had an operating profit of
US$5.5 billion in 2004. However, the fleet incurred an additional cost of capital
estimated at US$10.5 billion. Consequently, the global fisheries profitability is
estimated to be negative in the order of US$5 billion (a deficit of US$5 billion) in
2004, the base year. These estimates are net of financial subsidies, that is, subsidies
have already been subtracted.
Once again, the reader may turn to The Sunken Billions report for a detailed
discussion of the profitability estimates.
Table 2 presents details of estimates for the base year 2004, and compares these
with estimates undertaken in the study Marine Fisheries and the Law of the Sea: A
Decade of Change (FAO, 1993). The base year for the 1993 study was 1989.
Profit estimates for the global fishing fleet suffer from a scarcity of reliable
fleet cost and earnings data. Fisheries cost and earnings or profitability data are
not systematically collected by many countries, and these data are particularly
deficient for small-scale, artisanal and subsistence fishing. Even where such
data are collected, fishers are often reluctant to provide complete and accurate
global information, and available information is often distorted by subsidies or
taxes. Nonetheless, although based on limited samples, there are indications that
substantial numbers of fisheries are unprofitable or are experiencing declining
profitability (Lery, Prado and Tietze, 1999; Tietze et al., 2001; Tietze et al., 2005;
Watson and Seidel, 2003; Hoshino and Matsuda, 2007).
TABLE 2
Fleet profits: 2004 base year and 1993 FAO study
1993 FAO study
2004 base year
(US$ billions)
Value of catch
70.0
78.8
Fuel costs
14.0
22.5
Labour costs
22.7
22.7
Other operating costs
55.9
28.1
Operating profit/loss
–22.6
5.5
Total cost of capital
31.9
10.5
Global fleet profitability (deficit)
–54.4
–5.0
Source: World Bank and FAO, 2009, Table 3.3.

The rent loss from marine capture fishery resources: an overview
13
2.3.2.7 Schoolingparameters
Harvests from species with a strong tendency to congregate in relatively dense
schools or shoals (such as herrings, anchovies and sardines) are often little
influenced by the overall biomass of the stock (Hannesson, 1993). The opposite is
true for species that are relatively uniformly distributed over the fishing grounds
(such as cod or sharks). For these species, harvests tend to vary proportionately
with the available biomass for any given level of fishing effort.
The schooling parameter reflects these features of fisheries and normally has
a value between zero and unity. The lower the schooling parameter, the more
pronounced the schooling behaviour, and the less dependent the harvest is on
biomass. For many commercial species (for example, many bottom-dwelling
or demersal species and shellfish), it would be close to unity (Arnason, 1984).
For pelagic species (such as tuna, herring and sardine), it is often much lower
(Bjørndal, 1987).
The significance of the schooling parameter lies in the vulnerability of the
resource to overexploitation. A high schooling parameter leads to the result that
harvesting costs rise significantly as the resource is depleted. If the schooling
parameter is, for example, equal to unity, harvesting costs will go to infinity as
the resource biomass approaches zero (Bjørndal and Munro, 1998; Clark, Munro
and Sumaila, 2010). In other words, there is a powerful economic brake guarding
against severe resource exploitation. On the other hand, if the schooling parameter
is very low, the aforementioned economic brake is non-functioning – harvesting
costs do not soar as the resource is depleted. The fishery resource can readily be
driven to the verge of extinction, as will be seen at a later point in this chapter
(Clark, Munro and Sumaila, 2010).
In the harvesting function for the global fishery, the average schooling
parameter should reflect the schooling behaviour of the different fisheries. An
average of schooling parameters by fishery groups weighted by their MSY levels
gives an aggregate schooling parameter of about 0.7.
2.3.2.8 Elasticityofdemandwithrespecttobiomass
In the global fisheries model employed in The Sunken Billions report, the average
price of landings depends on the global marine commercial biomass according
to a coefficient referred to as the elasticity of demand with respect to biomass.
The model uses a value of 0.2 for this parameter, which means that, if the global
biomass doubles, then the average price of landing increases by 20 percent. The
coefficient and the value of the coefficient are based on following rationale.
Fishing activities initially target the most valuable fish stocks and the most
profitable fisheries. These high-value species tend to be those high in the marine
food chain. As the fishing effort increases, the most valuable stocks become
depleted and the fishing activity targets less valuable fish stocks (in some cases in
deeper waters on the continental slopes) or targets species at lower trophic levels.

From drain to gain in capture fisheries rents
—
A synthesis study
14
This is known as “fishing down and through the food webs”. With an ever-larger
share of the catch being accounted for by lower-valued species, the average price
of the aggregate catch is steadily reduced.
However, when the reverse takes place, under a governance regime that
restores biomasses and the health of fish stocks, the average price will tend to rise.
However, this generalization must be qualified in terms of the trophic level of the
target species. If the target species is a high-value prey species (e.g. shrimp), then
rebuilding the stock of predators (e.g. fish at a higher trophic level that eat shrimp)
may in fact reduce average prices (Hannesson, 2002). Nevertheless, in general, as
stocks rebuild there will tend to be more larger fish in the catch. Larger fish are
generally more valuable, which results in a higher average price for the global
catch.
Under an effective fisheries management system, the unit price of landed fish
usually increases substantially (Homans and Wilen, 1997; Homans and Wilen,
2005). For example, in fisheries based on individual transferable quotas (ITQs)
(one of many choices for improved fisheries management), the average price of
landings increases substantially compared with the price before introduction of
the ITQ scheme (Herrmann, 1996). The reasons include more selective fishing
practices, better handling of caught fish and better coordination between demand
for fish and the supply of landings. The increased price is not necessarily related
to the more valuable composition of the catch referred to earlier. Finally, there
is growing evidence that heavily fished resources are less stable (Anderson et al.,
2008), so that stock recovery is likely to stabilize supplies and prices and improve
the efficiency of harvesting.
2.3.2.9 Managementcostsandsubsidies
In its modelling, The Sunken Billions report does not consider the costs of
resource management, which are very real costs from the point of view of society.
Furthermore, subsidies are not separately identified in the cost estimates. The
existence of subsidies has the effect of reducing the observed costs. In light of
these major omissions, the estimated rent drain indicated in The Sunken Billions
report must be seen as being decidedly conservative. The true rent drain loss
quite possibly exceeds by a significant margin the estimate of US$50 million per
annum.
In addition, the rent loss estimate does not take into account all economic
benefits, actual and potential, from the fisheries. Downstream (through processing)
economic benefits go unaccounted for, as do those associated with recreational
fisheries, marine tourism and those arising from healthy coral reefs.
2.4 RenT lOSS eSTImATeS: The ReSulTS
As indicated above, the loss of net economic benefits, expressed as forgone rents,
is estimated to be in the order of US$50 billion in the base year, 2004. Owing to
model and input limitations, this estimate is to be seen as the most probable of

The rent loss from marine capture fishery resources: an overview
15
possible values, with an 80 percent confidence level that the true level lies between
US$37 billion and US$67 billion.
The rent loss estimate ranges between US$45 and US$59 billion in the base
year depending on whether the underlying biomass growth function applied is
the Schaefer logistic or the Fox function. Table 3 summarizes the main results of
these calculations for the two biomass growth functions. The Fox biomass growth
function estimates a higher current fisheries rent loss primarily because the current
level of overexploitation is substantially greater when the Fox function applies. A
priori, there is no reason to choose one biomass growth function above the other
and the point estimate of US$50 billion assumes an equal probability of each
function applying.
Based on the loss of net benefits in 2004, the real cumulative global loss
of wealth in the last three decades period is estimated at US$2.2 trillion. This
estimate is made by assuming a linear relationship between the rents and the state
of the world’s fish stocks as reported by FAO at various intervals since 1974.
The estimated rent loss in the base year (2004) is projected from 1974 to 2007,
and raised on the basis of the changing percentage of global fish stocks, reported
by FAO as fully exploited or overexploited. A conservative opportunity cost of
capital of 3.5 percent is assumed. For further details, readers may refer to The
Sunken Billions report.
An important “main result” is that, if sustainable resource rents from the
fisheries are even to approach the maximum, a substantial programme of
investment in natural fisheries capital and a concomitant reduction in fishing effort
are required. The Schaefer logistic and Fox estimates differ only in terms of the
magnitude of the investment required.
The implication of this result is that markedly excessive disinvestment in the
natural fisheries capital occurred in the past, and could be still ongoing. Why this
massive natural capital disinvestment, and accompanying rent drain, transpired is
the question now to be explored.
TABLE 3
main results: point estimates of resource rents
Current
Optimal
difference
units
Schaefer logistic Fox Schaefer logistic
Fox
Schaefer logistic
Fox
Biomass Million tonnes
148.4
92.3 314.2
262.9
165.8
170.6
Harvest
Million tonnes
85.7
85.7 80.8
81.6
–4.9
–4.1
Effort
Index
1.0
1.0 0.56
0.46 –0.44
–0.54
Rents
US$ billion
–5.0
–5.0
39.502
54.035 44.502
59.035
Source: World Bank and FAO, 2009, Table 4.1.


17
3. Origins of the rent drain
3.1 The InheRenT dIFFICulTIeS OF CAPTuRe FISheRIeS mAnAgemenT
It has long been recognized that marine capture fisheries are very difficult to
manage effectively. Generally, the fish cannot be seen prior to capture; the fish
are, with few exceptions, mobile. Moreover, there are species interactions and the
effects of environmental shocks that are unobservable. As a consequence, in the
past, it was difficult, or more to the point costly, to establish effective property
rights to the resources, be these property rights private or public. Capture fishery
resources were seen as the quintessential “common pool” (open to all) resources.
3.2 The InexhAuSTIbIlITy OF OCeAn CAPTuRe FISheRy ReSOuRCeS
Up until the twentieth century, the inherent and inescapable difficulties of
capture fisheries management did not seem to matter a great deal. Capture fishery
resources were viewed as “free capital”, beyond overexploitation.
Arguably, one of the greatest biologists in nineteenth century Britain was
Thomas Huxley. During the first half of the 1880s, he held the position of
Inspector of Fisheries. While in that position, he stated:
“The cod fishery, the herring fishery, the pilchard fishery, the mackerel
fishery, and probably all of the great sea fisheries, are inexhaustible: that
is to say that nothing we do seriously affects the number of fish. And any
attempt to regulate these fisheries seems consequently … to be useless.”
(cited in Gordon, 1954, p. 126)
The belief that the great sea fishery resources were inexhaustible helped to
enshrine the “common pool” nature of high-seas ocean fisheries in international
law, in the form of the “freedom of the seas”, first set forth in the early seventeenth
century. The high seas were seen to consist of all ocean waters beyond the narrow
coastal state territorial seas (historically extending out from shore to only three
nautical miles).
Under the “freedom of the seas” doctrine, the resources of the high seas,
including fishery resources, were deemed to be res communis. That is to say,
they were to be seen as the property of all (Orrego Vicuña, 1999). The belief in
the inexhaustibility of the ocean fishery resources had an economic basis. When
the “freedom of the seas” doctrine was first propounded, the state of fisheries
technology was such that heavy exploitation of high-seas fishery resources was
prohibitively costly (not to say dangerous). This remained more or less true until
after the mid-nineteenth century.

From drain to gain in capture fisheries rents
—
A synthesis study
1
3.3 mInIng The “InexhAuSTIble” CAPTuRe FISheRy ReSOuRCeS
The economic protection of high-seas fishery resources was, in fact, beginning to
fray even as Huxley spoke in the early 1880s. Fishing technology was changing
rapidly, bringing with it a fall in harvesting costs. The shift from sail to steam is a
prime example.
The vanishing of this economic protection and transformation of “free” natural
fisheries capital to scarce natural capital took time to be recognized fully. While
there were a few attempts at serious resource conservation in the early twentieth
century, such as in the North Pacific fur seal fishery (1911) and the Pacific halibut
fishery (1923), the management of ocean fisheries remained minimal until after the
close of the Second World War (National Research Council, 1999).
Once the economic protection of ocean fishery resources had been stripped
away by fisheries technological progress, the perverse (from society’s point of view)
incentive consequences of the “common pool” nature of the resources manifested
themselves. The primary consequence pertains to investment/disinvestment in this
form of natural capital.
No rational would-be investor will undertake an investment unless the expected
stream of net economic returns from the investment (discounted at the appropriate
rate of interest) – the so-called present value (PV) of the net economic returns – is
at least equal to the cost of the investment. In a “common pool” fishery, an
individual fisher can count on no positive return on an investment in the resource.
If some fishers refrain from harvesting in order to build up the resource, they may
do nothing more than increase the harvests of their competitors.
It can be shown that fishers in such fisheries will act as if they are applying
a rate of discount (interest) to future returns from the fishery equal to infinity.
Tomorrow’s returns from the fishery count essentially for nothing (Clark and
Munro, 1975). This, in turn, means that the rational fisher is given every incentive
to treat the resource as a non-renewable resource, namely as a resource to be
mined.
It has already been noted that the most valuable species have been subject to
the most intensive exploitation. This is consistent with the mining pattern.
Easy-to-reach and most valuable species are exploited first. After they have
been depleted, fleets move on to less valuable species. One of the more dramatic
examples involves whaling. By the turn of the twentieth century, the most valuable
of the whale species, the southern right whale, had been severely depleted. The
whaling industry then turned to and depleted successively less valuable species,
namely the humpback, blue, fin, sperm and sei species (Hilborn, Oresanz and
Parma, 2005).
The sequential exploitation follows the classic pattern of the mining of minerals
(or the exploitation of hydrocarbons). The most valuable ore bodies are exploited
first. Less and less valuable ore bodies are then exploited until the point is reached
at which mining ceases to be profitable and the mine is abandoned.
A particularly clear example is provided by a 2002 study sponsored by the
United Nations Environment Programme (UNEP) on Argentinean fisheries.

Origins of the rent drain
19
Prior to the late 1980s, the Argentine fishing sector had been underdeveloped.
Then, particularly after signing fisheries exploitation agreements with the
European Union (EU), the fishing sector began expanding, with the focus being
on hake stocks and to a lesser degree on blue whiting stocks (UNEP, 2002).
In the late 1980s and the 1990s, the fisheries sector became one of the most
dynamic sectors of the Argentinean economy. What the UNEP refers to as the
“happy years” was a period of ineffectively controlled growth in the fisheries, in
which massive total allowable catch TAC “overages” were commonplace. By the
end of the 1990s, there was clear evidence of severe overexploitation of both hake
and blue whiting stocks (UNEP, 2002). The high economic fishery returns and
rapid growth had been a “fool’s paradise” type of prosperity based, to a marked
degree, on the running down, the mining, of the natural fisheries capital.
The UNEP study estimates that the loss to future Argentinean generations
of the resource overexploitation (expressed in PV terms and assuming no stock
restoration) is equal to ten times the net economic benefits enjoyed during the
“fool’s paradise” prosperity of the late 1980s and 1990s. Indeed, assuming no
stock recovery, the net PV of future returns from the resources (using a reasonable
discount rate) is negative (UNEP, 2002).
Another example is provided by the Norwegian spring-spawning herring
resource of the North Atlantic. Historically one of the largest fishery resources of
that ocean region, the resource is characterized by a low schooling parameter, and
is thus vulnerable to overexploitation.
Until the 1960s, segments of the resource in the middle of the North Atlantic
were protected economically from gross overexploitation. However, by the 1960s,
technological developments in fishing led to this economic protection being
eliminated.
The International Commission for the Exploration of the Sea (ICES) estimates
that the minimum level of the spawning stock biomass (SSB) of the resource,
below which it should not be allowed to fall, is 2.5 million tonnes (Bjørndal, 2008).
In the late 1960s, the evidence of gross overexploitation of the resource, of the
clear breaching of this minimum, became overwhelming. A harvest moratorium
was declared. The SSB continued to decline, reaching an estimated low of
two thousand tonnes in 1972, i.e. 0.08 percent of the ICES declared SSB minimum.
In other words, the resource had been mined almost to the point of extinction
(Arnason, Magnusson and Agnarsson, 2000, pp. 293–319).
Partly through good fortune, the herring resource recovered, but only after a
20-year harvest moratorium. The Norwegian spring-spawning herring example
will be drawn upon again in the discussion to follow, at a later point, on the way
forward.
While the Argentinean fisheries and Norwegian spring-spawning herring
provide particularly striking examples of capture fishery resource mining, the
World Bank–FAO commissioned case studies provide numerous additional
examples from both developed and developing fishing states. The commissioned

From drain to gain in capture fisheries rents
—
A synthesis study
20
case studies employed modelling techniques identical to those used in The Sunken
Billions report.
A few such additional examples may suffice. The case study on the Japanese
squid fishery reports that the fishery has been operating under close to open-access
conditions. The rent from the fishery is negligible and the biomass is estimated
to be no more than 10 percent of the economically optimal level (Hoshino and
Matsuda, 2007, p. 25). In the Bangladeshi hilsa shad artisanal fishery, the biomass
is estimated to be less than 50 percent of the economically optimal levels
(Moma, 2007). The same holds true for the Lake Victoria Nile perch fishery
resource, which is shared by Kenya, Uganda and the United Republic of Tanzania
(Warui, 2008), and for the Bali Strait sardine fishery (Purwanto, 2008a). Similar
results are to be found in the Bohai Sea and Yellow Sea fisheries off China (Yang
and Nie, 2008) and the Gulf of Thailand (Boonchuwong and Dechboo, 2008).
The catch per unit of effort in the Bohai Sea has declined to less than one-tenth
of its value at the end of the 1950s and there has been a massive shift in catch
composition to short-lived less valuable species. A similar development has been
observed in the Yellow Sea even though the decline in the catch per unit of effort
has been less drastic. Yang and Nie estimate the combined rent loss in the Bohai
and Yellow Seas at US$1 billion per annum. The fishery resources in the Gulf of
Thailand have been subjected to excessive levels of fishing effort for perhaps as
long as two to three decades. Significant rent losses are associated with overfishing
and greatly excessive fleet sizes for all three of the studied fisheries, namely for
demersal resources, Indo-Pacific mackeral and anchovy (Boonchuwong and
Dechboo, 2008).
The situation is no different in the Vietnamese fisheries of the Gulf of Tonkin
(Long, 2008). During the last two decades (i.e. 1986
—
2006), with the rapid
development of marine capture fisheries all over the country, the fisheries in
the Gulf of Tonkin have shown strong growth. However, deployed aggregate
horsepower, an indicator of fishing effort, increased nearly 12-fold while catches
increased by less than 3 times. As a consequence of overfishing, marine resources
have declined severely, especially in near shore waters. This decline and the
increasing number of fishing boats have led to reduced incomes for fishers.
Reference was made above to the Icelandic cod and Namibian hake fisheries, in
which successful resource management schemes have been introduced. However,
even these successfully managed fisheries display the effects of past mining of
the resources. It is estimated that the Icelandic cod resource is at least 40 percent
below the economically optimal level (Arnason, 2008), while the hake resource,
which Namibia shares with Angola and South Africa, is estimated to be 80 percent
below the optimal level (Sumaila and Marsden, 2008).
An especially interesting case is the octopus fishery of Mauritania, which is
the country’s most valuable fishery and which is under active management. While
resource rent estimation is difficult owing to the inherent variability of this very
short-lived species, global production models suggest that rent is in the order
of US$60 million per annum. The development of age-structured bioeconomic

Origins of the rent drain
21
models that attempt to integrate resource variability suggests that maximum
resource rents are higher and at least US$75 million dollars per annum. However,
some part of this is currently being recovered so that lost resource rents are
around US$40 million. Part of current fishing capacity consists of EU vessels
fishing under an agreement between Mauritania and the EU. While this agreement
provides a substantial financial return to Mauritania, this return is different to
the resource rent available from good fisheries management. Under the present
management system, the financial gain from the licensing agreement comes at the
cost of excessive capacity and effort. Therefore, the main challenge is to design
institutional arrangements that will allow genuine resource rents to be generated
sustainably (Cunningham et al., 2008).
3.4 ReSOuRCe mAnAgemenT meASuReS: PARTIAlly COnSeRvATIOnIST,
buT eCOnOmICAlly deSTRuCTIve
The growing recognition, after the end of the Second World War, of the fishery
resource mining problem led to responses such as domestic and international
controls on harvesting, and the placing of much of the ocean capture fishery
resources under coastal state jurisdiction, through the implementation of the
exclusive economic zone (EEZ) regime under the 1982 UN Convention on the
Law of the Sea. That these measures have been less than entirely successful is
evidenced by the continued mining of the resources.
The controls on harvesting, domestic and international, did nothing to change
the fisher incentives to mine the resources, and did nothing to halt the harvesting-
cost-reducing advances in fishing technology. As harvesting costs fell over time,
fishery resources that had hitherto enjoyed economic protection became open to
exploitation, thereby necessitating yet further harvest controls. Typically, the new
controls have been implemented only after extensive resource overexploitation has
occurred. With the perverse fisher incentives in place, there has, in effect, been a
race between harvest control measures and advances in fishing technology.
There is more. Many fishery resources should be viewed as spatially linked
substocks (Sanchirico and Wilen, 2005). If the substocks far from shore are
commercially unexploitable, then these substocks constitute natural reserves,
which prevent the stock complex from severe overexploitation. With technological
advances and the ongoing fall in harvesting costs, what was hitherto commercially
unexploitable becomes profitable to exploit. The natural reserves disappear and
the stock complex becomes vulnerable, e.g. Norwegian spring-spawning herring.
Even where harvest control measures have been effective in halting the mining
of the resources, the control measures, when applied in the past, often had
destructive economic consequences. Introducing harvest controls through the
implementation of TACs, or the equivalent hereof, and doing nothing else all but
guarantees the emergence of excess fleet capacity and severe economic waste.
Under these conditions, the restricted season-by-season harvest becomes the
“common pool”. As fishers compete for shares of the “common pool” harvest,
excess fleet capacity inevitably emerges. An example is provided by the large

From drain to gain in capture fisheries rents
—
A synthesis study
22
pollock fishery off Alaska in the Bering Sea and Gulf of Alaska. Prior to the advent
of the EEZ regime, United States exploitation of the fishery had been minimal.
Exploitation of the fishery had been the domain of distant-water fleets. With the
coming of the EEZ regime, the distant-water fleets were phased out of the Alaska
pollock fishery, to be replaced by a new United States fleet.
The United States resource managers were very successful in protecting the
resource from overexploitation, but they did nothing to control the fleet size. By
the time measures were finally taken to control the fleet size in the early 1990s, it
was estimated that the United States fleet capacity was two and a half times greater
than that required to take the TAC (National Research Council, 1999).
Economic waste emerges in such fisheries, first through the very existence of
redundant vessel capital. Economic waste also arises from the steadily declining
season length. As fleet capacity grows, the shorter is the time required for the
TAC to be taken. Reduced season length can easily lead to inferior products,
inefficient fishing methods, and to processing plants facing cost-magnifying cycles
of throughput gluts followed by throughput famines.
The usual response to the competition for shares of the “common pool”
harvest – the “race for the fish” – as exemplified by the United States pollock
fishery, is to introduce measures to restrict the number of vessels allowed to
engage in the fishery. These schemes, commonly referred to as limited entry, or
licence limitation, schemes are often accompanied by decommissioning schemes
designed to remove excess fleet capacity built up before the introduction of licence
limitation.
Traditionally, under such licence limitation schemes, the owners of the licensed
fishing vessels are allowed to compete for shares of the TAC, or the equivalent.
It seemed clear that, if the fleet were reduced to a size commensurate with the
expected TAC, nothing more would be required.
The experience in many such fisheries has been that effective fleet capacity is,
in fact, difficult to control. With the fishers competing for harvest shares, capacity
continues to grow, even if the number of vessels remains constant. Fishing capacity
has many components. Controlling all of them is beyond the capabilities of most
resource managers.
An example is provided by the Canadian Pacific halibut fishery. Canada shares
the Pacific halibut resource with the United States of America, in Alaska. At a
very early stage (1923), Canada and the United States of America established a
cooperative resource management arrangement – the International Pacific Halibut
Commission (IPHC), which produced exemplary results in terms of resource
conservation.
In 1979, after Canada had implemented its EEZs, the Canadian authorities
introduced a limited entry scheme for its share of the Pacific halibut fishery. The
licensed vessels competed for shares of the halibut TAC.
In the following decade, the number of vessels remained effectively controlled.
However, the actual resource harvesting capacity was not controlled. The
harvesting season steadily decreased, clearly indicating growing capacity. The

Origins of the rent drain
23
Pacific halibut harvest season has a maximum length of about 240 days per year.
By the end of the 1980s, the season length had been reduced to six days per year.
There was no evidence of resource depletion. Indeed, the TAC was actually
increased over the decade because of increased resource abundance. However,
with respect to economic rent, such evidence as exists suggests strongly that, once
resource management costs are factored in, the resource rent being generated by
the fishery was distinctly negative (Munro et al., 2009).
3.5 SubSIdIeS
Both the problem of the mining of the capture fishery resources and the problem
of economic waste associated with fleet overcapacity, even when the resources are
maintained, have been severely aggravated by the widespread use of government
subsidies. While not all subsidies are harmful, it has been estimated that about
50 percent are damaging, both biologically and economically (Munro and
Sumaila, 2002). The Sunken Billions report presents an estimate of annual
subsidies that have a direct impact on fishing capacity.
More than US$10 billion in subsidies that directly influence fishing capacity and
foster rent dissipation were provided in 2000 (Table 4). Almost 80 percent of the
total global subsidy is provided by developed countries. Transfers of public funds
and support to the fisheries sector are directed at a spectrum of goods ranging
from the purely public to the purely private. The issue of subsidies is closely
linked to the policies and principles underlying fiscal regimes for fisheries, which
must untangle the web of weak property rights prevalent in most fisheries.
3. ShARed FISh STOCkS
Lastly, there is a major source of difficulty in the management of capture fishery
resources management that has come to be recognized fully only following the
advent of the EEZ regime. The establishment of the EEZ regime was seen as placing
large amounts of hitherto international “common pool” capture fishery resources
under coastal state jurisdiction. However, most capture fishery resources are
mobile, with the consequence that the typical coastal state finds that it is sharing
some of its EEZ fishery resources with neighbouring coastal states (transboundary
TABLE 4
estimate of fisheries subsidies with direct impact on fishing capacity per year, 2000
Subsidy types
developing
countries
developed
countries
global total
% of global
total
(US$ billion)
(%)
Fuel
1.30
5.08
6.38
63.5
Surplus fish purchases
0.00
0.03
0.03
0.3
Vessel construction, renewal and
modernization
0.60
1.30
1.90
18.9
Tax exemption programmes
0.40
0.34
0.74
7.3
Fishing access agreements
0.00
1.00
1.00
9.9
Global total
2.30
7.75
10.05
100.0
Source: World Bank and FAO, 2009, Table 2.2.

From drain to gain in capture fisheries rents
—
A synthesis study
24
stocks) or with distant-water fishing states (DWFSs) in the high seas adjacent to
the EEZ (highly migratory and straddling stocks). It can be demonstrated that, if
states sharing such resources do not cooperate effectively in the management of
the resources, the outcome will be comparable to a classic open-access fishery, i.e.
resource overexploitation (Munro, Van Houtte and Willmann, 2004; Lodge et al.,
2007).
Indeed, the lack of effective cooperative management of highly migratory
and straddling stocks, and the resultant resource overexploitation following the
close of the UN Third Conference on the Law of the Sea in 1982, led to the UN
convening another international conference to address the management of these
resources, the 1993–95 UN Fish Stocks Conference. The 1995 UN Fish Stocks
Agreement arising therefrom has led to the now ongoing implementation of the
regional fisheries management organization (RFMO) regime.
What the 1995 UN Fish Stocks Agreement does not address are the remaining
discrete high-seas stocks. Hitherto, most of these stocks had not offered
commercially viable fishing opportunities – in other words, they had enjoyed
economic protection. The history of world ocean capture fisheries provides all but
absolute assurance that the protection will prove to be temporary.
The significance of these shared fish stocks – transboundary, highly migratory,
straddling and discrete high seas – is not trivial. It is estimated that harvests of
these stocks may account for as much as one-third of the global ocean capture
fishery harvests (Munro, Van Houtte and Willmann, 2004). Thus, in looking
forward to the optimal economic management of world capture fishery resources,
the shared fish-stock management problem becomes impossible to ignore.

25
4. The way forward
It is not the intention in this chapter to set forth detailed, concrete plans for
achieving the maximization of capture fisheries resource rent. The aim is to set
forth some general principles and what amounts to a research agenda. Developing
a set of detailed plans for resource rent maximization requires a second, and
companion, project (perhaps with a title like “Rent Lost and Rent Regained”).
4.1 ORIgInS OF The RenT dRAIn ReCAlled, And levelS OF FISheRIeS
In need OF eCOnOmIC ReFORm
It will be recalled that the root cause of the rent drain in capture fisheries lies in the
perverse (from society’s point of view) incentive structure confronting fishers in
“common pool” types of fisheries. The fishers are given every incentive to regard
the fishery resources as non-renewable resources to be mined. If measures are
taken to restrict harvesting (in order to conserve the fishery resources) but nothing
effective is done to limit fleet access to the fishery, the restricted harvest, TAC
or the equivalent, becomes the “common pool”, with the inevitable emergence
of excess fleet and human capital, leading to resource rent dissipation. Unless
the fishers are effectively blocked in responding to the perverse incentives, or
the incentives themselves are altered, reversing the rent drain becomes an all but
hopeless task.
Realizing the goal of maximizing resource rent requires: (i) that the perverse
incentive problem be resolved; and (ii) that a major rebuilding of the resources be
undertaken. It will be recalled that resource rent maximization requires that world
capture fishery resources be at least doubled in size.
On this basis, one can think of fisheries requiring reform being at three levels.
Level 1 consists of fisheries in which the resource managers have, by some means,
succeeded in maintaining the stocks at, or building the stocks up to, the optimal
level, but in which, through continued existence of perverse fisher incentives, the
resource rent has been allowed to drain away. Resource investment is not required,
but the correction of fisher incentives is. For these fisheries, the reversal of the rent
drain, while not without its difficulties, is a simpler undertaking than is the case in
Level 2 and Level 3 fisheries.
Level 2 consists of fisheries that are essentially the reverse of Level 1 fisheries.
The perverse fisher incentive problem has been effectively addressed. Resource
rent is being generated, but not maximized, because the resource is well below
the optimal level owing to past overexploitation. Rebuilding the resource to the
optimal level is an exercise in investment in natural capital in the form of fishery
resources. Any investment in real capital, be the capital produced or natural, is a

From drain to gain in capture fisheries rents
—
A synthesis study
2
costly, and possibly lengthy and uncertain, undertaking. The fact that the incentive
problem has been dealt with gives hope that the required resource investment
programme can be undertaken, with some reasonable hope of success.
Level 3 consists of fisheries in which the perverse fisher incentives are
unaddressed, in which the resource is well below the optimal level, and in
which any resource investment that is occurring is negative. The first objective
of management in such fisheries must be to ensure that the rate of resource
investment is no lower than zero.
4.2 level 1 FISheRIeS
Level 1 fisheries are fisheries where goals are easiest to achieve as far rent
generation is concerned.
Level 1 fisheries may well be uncommon, but specific examples can be
identified. Two such examples are provided by the recent study commissioned by
Fisheries and Oceans Canada, referred to at an earlier point (Munro et al., 2009).
The two fisheries in question are the Canadian Pacific halibut fishery and the
British Columbia sablefish fishery. Both have unusual histories.
4.2.1 The Canadian Pacific halibut and british Columbia sablefish
fisheries
The Pacific halibut fishery of Canada and the United States of America began
slowly in the 1880s, as the Atlantic halibut fleet began relocating to Pacific waters,
after the severe depletion of the Atlantic halibut stocks (a counter example to
Huxley’s assertion on the inexhaustibility of ocean fish stocks [above]). The
Pacific halibut fishery grew, particularly as the expanding North American
transcontinental railways, with refrigerated rail cars, and the completion of the
Panama Canal opened up eastern North American markets for the fish.
During the First World War, the Pacific halibut fishing industry coalesced and
began exerting pressure on the governments of Canada and the United States of
America to come together to exert international control over the fishery. With the
experience of the Atlantic halibut fishery in mind, the industry’s efforts resulted in
the establishment of the IPHC in 1923 (IPHC, 2009). Pacific halibut stands as one
of those rare instances in which the fishing industry demands the implementation
of government fisheries regulation before serious damage has been done to the
stocks.
The British Columbia sablefish fishery was a very minor fishery until the
implementation of the Canadian EEZs after the mid-1970s. When the fishery
showed signs of significant development, after the mid-1970s, the Government
of Canada, fully aware of the consequences of non-action on its part, introduced
harvest controls (Munro et al., 2009).
The harvest controls were, and are, effective, for both Pacific halibut and British
Columbia sablefish. The stocks were saved from significant depletion, with the
result that both fisheries were candidates for inclusion in the Level 1 category.

The way forward
27
Pacific halibut is a good example of a shared (transboundary) stock. The fact
that there was, and is, a strong cooperative management regime in place meant that
the first requirement for effective economic management of the resource had been
met. It is now widely recognized that non-cooperative management of a shared
fish stock can easily lead to results comparable with a wholly unregulated
open-access fishery (Munro, Van Houtte and Willmann, 2004).
The Government of Canada was also aware of the consequences of harvest
controls unaccompanied by controls over fleet size. Indeed, it had pioneered the
introduction of limited entry schemes, commencing with the British Columbia
salmon fishery. The implementation of the Canadian EEZs gave the Government
of Canada the opportunity to introduce limited entry schemes in both its sablefish
fishery and in Canada’s segment of the Pacific halibut fishery. It had seized these
opportunities by the early 1980s. As indicated above, both limited entry schemes
were accompanied by what can be described an Olympics style TAC, i.e. the
vessels granted access to the fishery were to compete for shares of the TAC. This
was standard practice for limited entry schemes in general at that time.
Several years ago, FAO introduced the concepts of incentive-blocking and
incentive-adjusting approaches to fisheries management (Gréboval et al., 1999).
The former approaches concern measures designed to prevent fishers from
responding to the perverse incentives described earlier. Incentive-adjusting
approaches are concerned with measures designed to transform perverse fisher
incentives into benign ones. Both the imposition of TACs and the limited entry
schemes described above could be seen as incentive-blocking approaches. In the
case of the two fisheries under consideration, the incentive-blocking approach in
the form of TACs was successful in conserving the resources.
In attempting to analyse the history of the two British Columbia fisheries, the
study carried out for Fisheries and Oceans Canada (Munro et al., 2009) employs
two closely related modes of analysis that will be useful in examining Level 2
and Level 3 category fisheries, as well as Level 1 fisheries. The authors of the
study note one inescapable fact of life in the two fisheries, namely the strategic
interaction between and among the fishers, and between the fishers as a group and
the resource managers, which in the case of Canada are to be found wholly within
Fisheries and Oceans Canada. The obvious mode of analysis then is the theory
of strategic interaction, more popularly known as the theory of games, which has
been used extensively in the study of international fisheries (Munro, Van Houtte
and Willmann, 2004).
There are two broad categories of games: non-cooperative, or competitive,
games; and cooperative games. In cooperative games, the “players” are assumed
to be coldly rational, with each “player” being prepared to cooperate only if
it believes that it will be better off by cooperating than it would be by playing
competitively. The stability of such cooperative games is always at risk of being
undermined by “player” non-compliance (cheating) and by free riding, which can
be defined as the enjoyment of the fruits of cooperation by non-participants in
the game (i.e. poaching). The concepts of non-cooperative and cooperative games

From drain to gain in capture fisheries rents
—
A synthesis study
2
will be seen to be of relevance to the strategic interaction among the fishers. The
pre-1923 Pacific halibut industry could be seen as a fisher cooperative game in
operation.
Within the theory of games, there is subclass of non-cooperative games known
as leader–follower games, a version of which is referred to as principal–agent
analysis (PA analysis), used widely used by economists in many fields. This PA
analysis is of direct relevance to the interaction between the fishers in the two
British Columbia fisheries and Fisheries and Oceans Canada.
The principal, be it a person, a firm, a country or a state/province, wishes to
see undertaken certain tasks that it is unable to do itself. Therefore, it acquires the
services of one or more agents to undertake these tasks. Classic examples are an
owner of a firm hiring a manager, and a landowner leasing farmland to a tenant
farmer. The PA analysis has application far beyond these simple examples, e.g.
industry regulators and the firms being regulated (Sappington, 1991).
In any event, in the context of Canadian fisheries, Fisheries and Oceans Canada
could be seen as constituting the principal, while the fishers constituted the agents.
The PA paradigm can be formally described as follows (see Clarke and
Munro, 1987, pp. 83–86).
A strict hierarchical relationship exists in which the principal (leader) chooses
an incentive scheme (e.g. set of regulations) to be applied to the agents (followers).
The principal’s incentive scheme, along with the actions taken by the agents,
determines both the returns to the agents and to the principal. As seen from the
perspective of the principal, a first-best situation exists where the principal can,
at minimal cost, contractually and enforceably specify the actions of the agents.
Wishes, urges and desires of the agents contrary to the best interests of the
principal are entirely suppressed. The agents are essentially robots.
In the normal second-best situation, the principal lacks the power or, more
to the point, finds it too costly to force a set of actions upon the agents. Thus,
the agents have some freedom of choice. The principal can hope to influence the
agents’ choices only indirectly through the incentive scheme. This gives rise to
the concept of an incentive gap, which is the difference between the actual return
to the principal and what it would receive under a first-best situation. It reflects
the insufficiency of the principal’s incentive scheme in compensating for its
inability to monitor perfectly the agents’ actions. At the heart of the PA problem
is monitoring imperfection (Clarke and Munro, 1987).
One can now consider two closely related modes of analysis in the case of the
two British Columbia fisheries. The comfortable view of many economists at the
beginning of the 1980s was that, while there would be competition among the
licensed fishers in a limited entry fishery, the competition (interaction) would be
minor and easily controlled. If the vessels plus crew had been identical, if input
substitution in the fishing fleet had been impossible, and if the technology had been
frozen in the two Canadian fisheries, then indeed the competition (interaction)
would have been minor and easily controlled. However, none of these conditions
held. For example, technology was anything but frozen in the two fisheries.

The way forward
29
The result was that circumvention of the intent of the limited entry scheme was
feasible, which meant, in turn, that competition among the licence holders was
definitely possible. Even if all fishers had been aware that such competition was
mutually harmful in terms of their economic returns from the fishery, each and
every fisher would, in the absence of scope for meaningful cooperation, have had
no option but to compete. Any fishers who held back from competing were all but
guaranteeing the loss of a part, if not all, of their share of the TAC.
One of the most famous of all non-cooperative games is known as the
“prisoner’s dilemma”, which derives its name from a story told by the author to
illustrate his point (Tucker, 1950). The author’s point is that, in a non-cooperative
game, the “players” will be driven to adopt strategies that they know are harmful.
In the situation described in the two fisheries, the fishers were engaged in what
might be described as a non-cooperative subgames, which provided, in turn,
almost textbook examples of the prisoner’s dilemma.
In both fisheries, season lengths declined to small fraction of their potentials,
indicating severe excess capacity. While no precise estimates were possible, one
could conjecture that the resource rents were negative from a national perspective.
The authors of the study (Munro et al., 2009) state that, in PA analysis terms,
the non-cooperative subgames among the fishers had led to a yawning and
unsustainable incentive gap. Out of desperation, Fisheries and Oceans Canada,
with industry support, shifted to an incentive-adjusting approach in the form of
individual quotas (IQs), later to become individual transferable quotas (ITQs).
The authors of the study then ask if there was any evidence that the ITQs
eliminated strategic interaction among the halibut fishers or among the sablefish
fishers. The answer is that there was no such evidence. They conclude that, if
the IQ schemes do no more than re-establish non-cooperative games among the
two sets of fishers, perhaps under a different guise, then little or nothing is to be
gained. They argue that success will only be achieved (the incentive gap reduced
to tolerable proportions) if the IQ scheme leads to the fisher subgame being
transformed from a competitive to a cooperative one.
In order for there to be a cooperative game, there must first be in place
a workable mechanism for the sharing of the economic benefits among the
“players”. Initially, IQ schemes were seen to provide such a mechanism. However,
the existence of the sharing mechanism is not in itself sufficient.
If a cooperative game is to have a stable solution, a fundamental condition
that must be satisfied is that each and every player must be convinced that it will
receive a return – a payoff – at least as great as it would under competition
(see FAO, 2002). If non-compliance (cheating) is left unchecked or if free
riding (poaching) is rampant, this condition, known as the individual rationality
constraint, will not be met even if the allocated shares appear to be “fair”.
While not absolutely conclusive, the evidence that exists suggests that effective
cooperative fisher games have replaced the destructive non-cooperative games in
these two fisheries. Figures 5 and 6 indicate the season lengths in the two fisheries
before and after the introduction of ITQs.
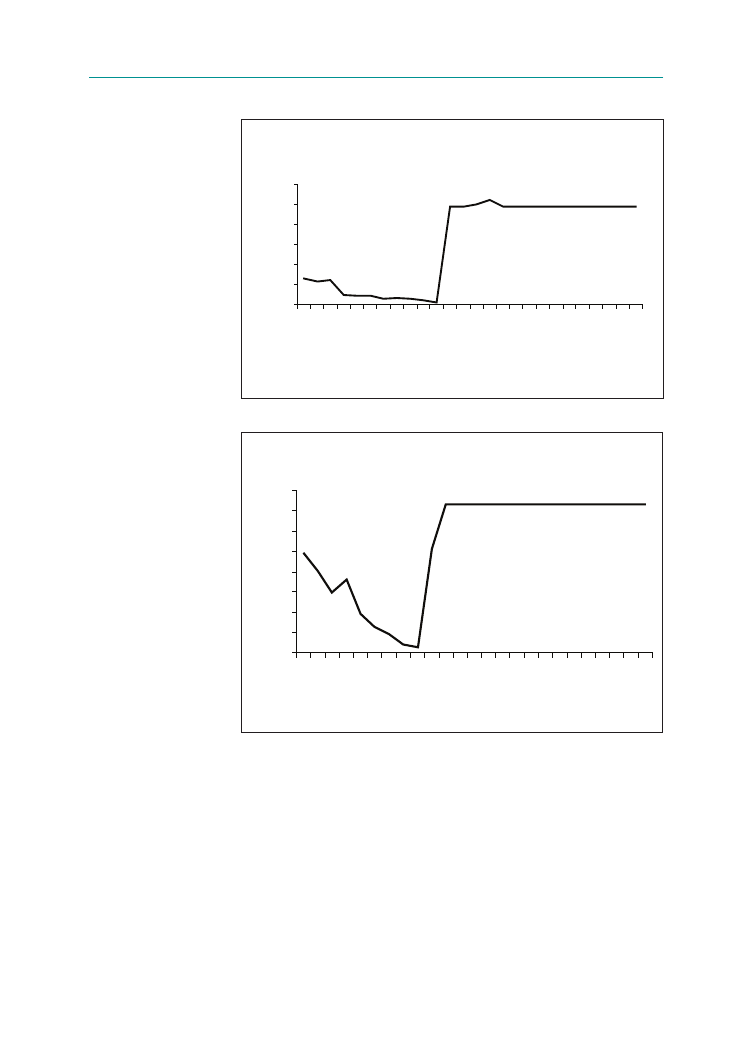
From drain to gain in capture fisheries rents
—
A synthesis study
30
Excess capacity, if not eliminated in physical terms, was “defanged”. In the case
of both fisheries, season length rose rapidly to the maximum after the introduction
of ITQs.
Adequate fleet cost data were not available to the authors of the study. The
harvest quotas were and are actively traded. Quota price data are available
(Figures 7 and 8). As the quotas are de facto long term (Munro et al., 2009), the
quota prices could be seen as reflecting the market participants’ estimates of future
private sector net returns from the fisheries.
FIGURE 5
Pacific halibut season length, 190–2005
Source: Munro et al., 2009, Figure 1.
0
50
100
150
200
250
300
1980
1985
1990
1995
2000
2005
Year
Se
as
on
le
ng
th
(d
ay
s)
FIGURE 6
Sablefish season length, 191–2005
Source: Munro et al., 2009, Figure 4.
0
50
100
150
200
250
300
350
400
1981
1986
1991
1996
2001
Year
Se
as
on
le
ng
th
(d
ay
s)
2005
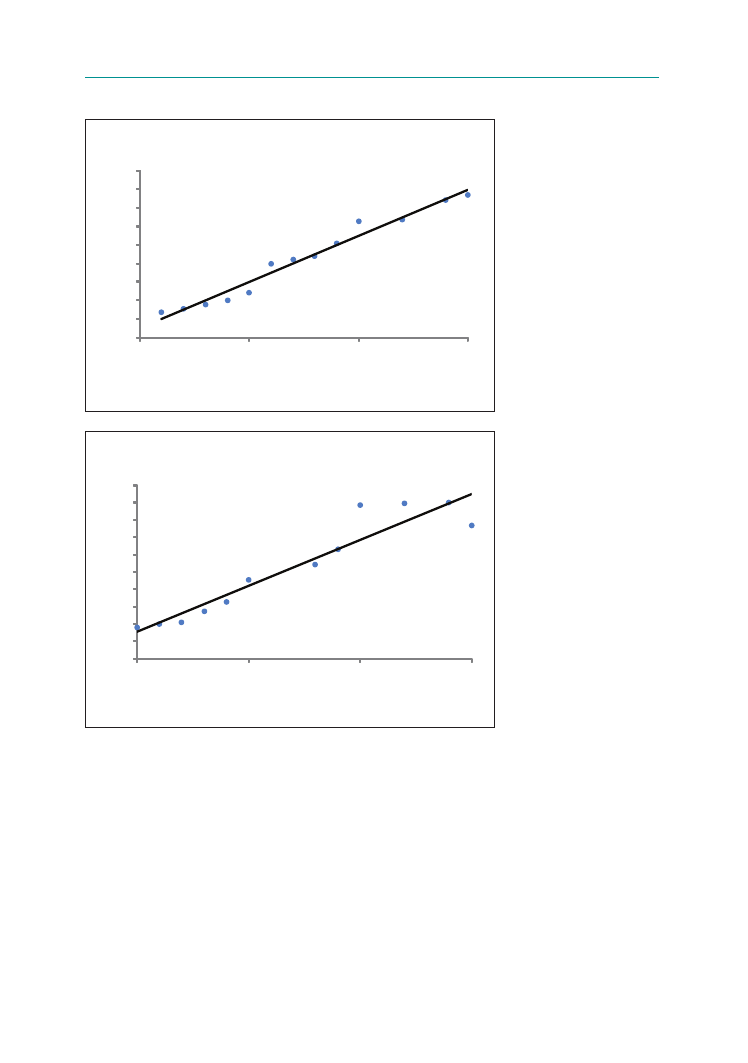
The way forward
31
The authors note that the ITQ schemes involve higher management costs,
and they accompany the figures with tables showing substantially increased
licence fees received by the government. Overall, the evidence suggests significant
positive rent flowing from the fisheries.
What one can conclude from this Level 1 fishery experience is:
• The incentive-blocking approach to resource management, as it pertained
to fleet and human capacity, was completely ineffective. The inability to
control capacity led to a rent destroying non-cooperative game among the
fishers.
• The introduction of catch shares in the form of ITQs did, in these instances,
lead to a resource-rent-creating cooperative game among the fishers. That
said, one must guard against concluding from this experience that ITQs offer
Figure 7
Pacific halibut: quota values and trend line
Source: Munro et al., 2009, Figure 3.
Figure 8
Sablefish: quota values and trend line
Source: Munro et al., 2009, Figure 6.
0
10
20
30
40
50
60
70
80
90
1990
1995
2000
2005
Year
Q
uo
ta
va
lu
e
(2
00
5
US$
p
er
k
g)
0
10
20
30
40
50
60
70
80
90
100
1990
1995
2000
2005
Year
Q
uo
ta
va
lu
e
(2
00
5
US$
p
er
k
g)

From drain to gain in capture fisheries rents
—
A synthesis study
32
the only route to achieving cooperative games among fishers. There will be
many cases in which ITQs are inappropriate. However, alternatives exist.
In their detailed paper on small-scale fisheries in developing fishing states,
Kurien and Willmann (2009) argue that ITQs are indeed inappropriate for
many, if not most, of these fisheries. The desired results – turning fisher
competition into cooperation –can, they argue, be achieved through the
establishment of community-based fisheries management schemes. Public
authorities would continue to play an important management role, so that
the schemes might best be described as co-management schemes – the
principal–agent paradigm again.
• In order to effect the transformation of fisher competition into cooperation,
substantial management capacity is demanded of the resource managers. To
take one example, if the resource managers in the Canadian case described
had proved to be incapable of establishing an effective monitoring scheme,
the ITQ schemes would have degenerated into non-cooperative fisher
games, with all that that implies. Kurien and Willmann (2009) stress the
critical importance of capacity building.
A question not hitherto considered is: Could the same results produced by
catch-rights-based management be achieved through the traditional incentive-
adjusting technique of taxes (positive and negative)? No answer is immediately
available. It is noted that, for reasons good or ill, taxes have been little used in
fisheries management.
The Canadian Level 1 experience leads to a further implicit conclusion.
Suppose that resource rebuilding is called for, and that a successful resource
investment programme is implemented. If the resource investment programme is
not accompanied by a management scheme designed to prevent the emergence of
excess capacity, the return on the resource investment – expressed as an increase
in sustainable resource rent – will equal zero. Thus, it is all but pointless, from an
economic perspective, to undertake a resource investment programme until the
incentive problem has been resolved.
4.3 level 2 FISheRIeS
The Icelandic cod fishery can be seen as the archetypal Level 2 fishery. The fishery
is the most valuable of the Icelandic demersal fisheries, with a potential annual
landed value of US$1 billion. An ITQ scheme was introduced into the fishery in
1984, and then strengthened in 1991 (Arnason, 2008). The perverse fisher incentive
problem appears to have been dealt with successfully. The fishery is currently
generating significant rents, estimated to be in the order of US$240 million per
annum as of 2005 (Arnason, 2008, p. 6).
However, that said, the fishery had been heavily overexploited prior to the
introduction of ITQs. The introduction of ITQs, combined with reductions in
the TAC, has succeeded in bringing the overexploitation of the resource to a
halt, but it has not succeeded in rebuilding the resource. It is estimated that the

The way forward
33
biomass is less than 60 percent of the optimal stock size. It is estimated further
that the rent forthcoming from the fishery is no more than 36 percent of the
maximum (Arnason, 2008, p. 6). Thus, if one accepts the estimates, one is forced
to the conclusion that the potential return on investment in the resource is
substantial. The problem is how to put into effect an effective resource investment
programme.
The first question that has to be raised, and one which has to answered more
by biologists than by economists, is to what extent the promises of investment
returns are realities, and to what extent the promises are chimeras. The Sunken
Billions report operates on the assumption that “existing biological overfishing
is entirely reversible in the long run” (World Bank and FAO, 2009, p. 31). The
assumption is of questionable validity for a significant number of fishery resources.
There is evidence of depleted fishery resources that either cannot recover to their
former levels of abundance or can be expected to do so only after many decades
(Hutchings, 2000; Clark, Munro and Sumaila, 2010). What is required is an
investigation to determine what one might term the set of feasible fishery resource
investment opportunities. Thus, for example, does Icelandic cod represent a real
investment opportunity – the non-recovery of the resource being due to the fact
that the TAC has not been reduced sufficiently – or is the resource, to all intents
and purposes, non-recoverable beyond its present level?
Consider now the feasible set of fishery resource investment opportunities,
and the second and third questions that need to be addressed. The questions
prove to be closely related. The second question pertains to the optimal resource
investment programme, which, in turn, is concerned, in the first instance, with
the optimal rate of positive resource investment. The most rapid rate of positive
resource investment is achieved by declaring an outright harvest moratorium until
the optimal biomass level is achieved. As a general rule of thumb, once the target
stock of capital (of any form) is identified, one should move towards the target
with all possible speed unless there are penalties associated with rapid rates of
investment. The third question pertains to the incentive structure that must be in
place for the relevant fishers in order for the resource investment programme to
have any reasonable chance of success.
Concerning the second question, the optimal rate of positive resource
investment, an example is provided by the case study on the Lake Victoria Nile
perch fishery (Warui, 2008). The biomass of the resource is estimated to be between
37 and 50 percent of the optimal biomass, depending on whether the logistic or the
Fox biological model is used. The study examines the possible resource investment
programmes, and compares the one that would maximize the PV of rent from
the resource through time with what the author terms a “reasonable” investment
programme (Warui, 2008, pp. 46–49). The PV-maximizing programme involves
declaring a harvest moratorium for about three years until the optimal biomass
level, or close to the optimal biomass level, is achieved. In other words, the PV-
maximizing resource investment programme consists of investing in the resource

From drain to gain in capture fisheries rents
—
A synthesis study
34
at the maximum rate of speed. The “reasonable” resource investment programme
calls for some harvesting during the resource investment phase, and in so doing
calls, in turn, for a slower rate of investment in the resource.
One could ask whether investing in the resource at the most rapid rate would
not cause severe disruption to the fishing industry, and to the communities
dependent upon the industry for employment. The answer depends critically upon
what economists term the “malleability” of the produced capital in the fishing fleet
and the human capital involved in the fishery. The “malleability” of such capital
concerns the ease with which such capital can be shifted into and out of the fishery,
with perfectly “malleable” fleet and human capital being capital that can be easily
and costlessly shifted in and out of the fishery. The concept of “malleable” capital
is analogous to the concept of “liquid” capital in finance. If the produced and
human capital in the fishery is perfectly “malleable” (and if the price of harvested
fish and the unit cost of fishing effort are independent of the harvest rate), then the
most rapid rate of investment in the resource is economically optimal and should
impose no social cost.
Consider once again the case of Norwegian spring-spawning herring. It will
be recalled that the resource suffered a devastating decline in the late 1960s and
early 1970s. The remnants of the resource were confined to Norwegian waters.
The Norwegian resources managers declared an outright harvest moratorium that,
more or less, remained in effect for 20 years. It proved easy for the Norwegian
authorities to shift the vessels engaged in the herring fishery to other fisheries. In
terms of the herring fishery in question, the fleet capital and human capital were
both very malleable. Hence, one can argue that the Norwegian resource investment
programme was optimal in economic terms (Gréboval and Munro, 1999).
One can reasonably assert that fisheries in which the relevant produced and
human capital are perfectly malleable are the exceptions rather than the rule. In
those many fisheries in which the produced and human capital in the fishery are
not perfectly malleable, where there are significant costs and difficulties in shifting
the capital out of the fishery, the most rapid rate of investment in the resource
will have negative social consequences, perhaps severe ones. However, it is also
the fact that, when the produced/human capital in the fishery is non-malleable,
investing in the resource at the most rapid rate is decidedly suboptimal in strict
economic terms. That is to say, such a resource investment programme will not
maximize the PV of the rent from the fishery through time. As was demonstrated
several decades ago, a resource investment programme closer to what Warui (2008)
terms a “reasonable” investment programme is optimal in economic terms (Clark,
Clarke and Munro, 1979).
There is an exception to this rule. If the resource has been severely depleted,
a temporary harvest moratorium may be optimal. Having said this, with non-
malleable fleet and human capital, the moratorium should not remain in place
until the optimal biomass level has been achieved (for details, see Clark, Clarke
and Munro, 1979).

The way forward
35
From all of this, an obvious conclusion follows. The optimal resource
investment programme must be expected to vary from Level 2/Level 3 fishery to
fishery.
Concerning the third question, it is useful to return to the PA framework of
analysis. The resource managers must design an incentive scheme that will give
the fishers an incentive to invest in the resource. The first question is whether
the fishers are to be called upon to bear all or part of the cost of the resource
investment. If the fleet/human capital is perfectly malleable, then the problem does
not arise. In the many cases in which the fleet/human capital is less than perfectly
malleable, one could, in the first instance, think of a scheme in which the state bore
the cost of investment by compensating the fishers for temporary reduced harvest
opportunities (see Grafton, Kompass and Hilborn, 2007; Kurien and Willmann,
2009). That such schemes could be accompanied by the threat of possibly severe
moral hazard problems is obvious.
If the fishers are to bear a part or all of the cost of the resource investment,
then the incentive-adjusting schemes discussed in the context of Level 1 fisheries
carry a much greater burden. Eliminating the “race for the fish” is not enough.
The design must be such that the fishers are assured a significant share of the
investment payoff, with the proviso that the payoff be contingent upon the success
of the resource investment. Thus, it would seem to be obvious that, if harvest
rights are employed, they should be long in term, in fact if not in strict law, and
the harvest shares should be expressed as a percentage of the TAC.
It is also obvious that the fishers should have a considerable degree of certainty
about future resource management policy. If, for example, the resource managers’
policy is perceived by fishers as being capricious, then the fishers will, if rational,
heavily discount all future returns from the resource investment.
Beyond this, one can say little about the optimal incentive scheme other than
that it will require a great deal of planning and thought and that it is certain to vary
from fishery to fishery.
4.4 level 3 FISheRIeS
Level 3 fisheries, in which the fisher incentives have not been corrected and in
which negative resource investment is still occurring, constitute the ultimate
challenge in terms of rent restoration. The case studies indicate that, while
difficult, progress can nonetheless be achieved in developing, as well as developed,
fishing states. One of the more dramatic cases of success is that of the Indonesian
Arafura shrimp fishery (Purwanto, 2008b).
Up until early in this decade, the fishery was plagued with rampant
non-compliance and poaching by Indonesians and foreigners, with consequent
overexploitation of the resource and dissipation of the resource rent. It is
estimated that, in 2000, the biomass was no more than 50 percent of the optimal
level. The resource rent was positive, but was equal to less than 6 percent of the
optimal level (Purwanto, 2008b, Table 4.1). Under the new fisheries legalisation
promulgated in 2004, surveillance and enforcement were greatly strengthened,

From drain to gain in capture fisheries rents
—
A synthesis study
3
the right incentives were created by devolving management authority upon the
provincial government, which, in turn, gained the active support and cooperation
of the relevant fishing communities.
By 2005, the biomass had increased to almost 75 percent of the optimal level.
The resource rent was estimated to be more than 90 percent of the optimal level
(Purwanto, 2008b, Table 4.1). As the shrimp resource is a fast-growing one, quick
payoffs to resource investment are to be expected. Nonetheless, the results are
remarkable.
In this section, particular emphasis will be given to a class of Level 3 fisheries
where the problems of putting the fisheries on the path to recovery are displayed
with particular clarity. The fisheries are of a type heretofore mentioned only
in passing, namely internationally shared fishery resources. The discussion of
fisheries under the heading of the “way forward” has to this point focused on
fishery resources that are either not shared to any extent, or, if they are shared, it
is found that the sharing leads to no significant resource management problems
(e.g. Pacific halibut).
It will be recalled that internationally shared fishery resources are not
insignificant with regard to the resource rent re-capture issue as they provide
the basis of up to one-third of the harvests of marine capture fisheries (Munro,
Van Houtte and Willmann, 2004). The economics of the management of such
resources is now reasonably well understood, drawing by necessity upon the
theory of strategic interaction (theory of games) – owing to the fact that strategic
interaction between and among the states exploiting the resources lies at the heart
of the problem.
The economics of non-cooperative management of shared fishery resources,
based upon the theory of competitive games, is straightforward. Non-cooperative
management carries with it the high risk of overexploitation of the resources. This
is a manifestation of the “prisoner’s dilemma” discussed above.
The complex part of the economics of the management of internationally
shared fishery resources is focused on the means of ensuring stable cooperative
management of these resources through time. The economics draws upon the
theory of cooperative games. A cooperative game subject to instability that
remains uncorrected soon degenerates into a competitive game, with all that that
implies.
The theory informs us that the ease of achieving stability through time depends
in the first instance upon the number of “players”, i.e. the number of states
involved in the exploitation of the resource. Where the number of “players” is
only two, achieving stability is relatively easy. Thus, it is no surprise that the
cooperative management of Pacific halibut and that of groundfish resources in the
Barents Sea have proved to be stable over time. Only two states, Canada and the
United States of America, are involved in the cooperative management of Pacific
halibut; only two states are dominant in the cooperative management of Barents
Sea groundfish resources, Norway and the Russian Federation. Once the number

The way forward
37
of “players” exceeds two, difficulties arise, with the difficulties increasing almost
exponentially as the number of “players” increases.
The greatest difficulties are encountered in the management of internationally
shared fishery resources found all or in part in the high seas, i.e. outside of the
coastal state EEZs, namely highly migratory and straddling stocks that are to be
found in the EEZs and the adjacent high seas, and discrete high-seas stocks. Under
the terms of the 1995 UN Fish Stocks Agreement, highly migratory and straddling
stocks are to be managed through RFMOs that are to have both coastal states
and relevant DWFSs as members (Lodge et al., 2007; UN, 1995). The Northwest
Atlantic Fisheries Organization, the Northeast Atlantic Fisheries Commission,
and the Western and Central Pacific Fisheries Commission are all examples.
Achieving the stability through time of the cooperative fishery games
that are the RFMOs is aggravated by the fact that the number of “players” is
typically large, and by the fact that the high-seas portions of areas under RFMO
jurisdiction are, in many instances, plagued with “unregulated” fishing, i.e. free
riding by non-RFMO members. An additional source of instability arises from
the fact that RFMOs are required by the 1995 UN Fish Stocks Agreement (UN,
1995) to accommodate new members, which are typically DWFSs that could not,
or did not see fit to, become “charter” members of the RFMO. The so-called “new
member” problem is one of the most difficult confronting the emerging RFMO
regime (Lodge et al., 2007).
The case studies present an example of an RFMO that is working reasonably
well, Norwegian spring-spawning herring (Bjørndal, 2008), and one that provides
an example of a Level 3 fishery, namely the RFMO governing the Northeast
Atlantic and Mediterranean bluefin tuna fisheries (Bjørndal, 2009). The RFMO
for these bluefin tuna fisheries takes the form of the International Commission for
the Conservation of Atlantic Tunas (ICCAT).
When in a healthy state, the Northeast Atlantic/Mediterranean bluefin tuna
fishery ranges from the Canary Islands to Norway, through the Mediterranean
to the Black Sea. The harvested fish are some of the most valuable in the world,
with an individual fish being able to command a price of up to US$100 000
(Bjørndal, 2009).
At present, some 25–30 states are involved in the fishery. At the peak of the
fishery, up to 50 states were involved. The fact that the number of active states
involved in the fishery has been substantially reduced is due, argues Bjørndal
(2009), to the fact that the resource has been severely depleted. Bjørndal maintains
that the resource-rent-maximizing SSB is in the order of 800 000 tonnes. The
current SSB is estimated to be in the order of 100 000 tonnes. This is the lowest
SSB for the resource in recorded history. Indeed, the resource faces a significant
risk of outright collapse (Bjørndal, 2009; MacKenzie, Mosegaard and Rosenberg,
2009).
The current resource rent is actually positive, being estimated by Bjørndal at
about US$35 million per year. However, the continuation of this level of rent is
uncertain given the parlous state of the biomass. The US$35 million per year can

From drain to gain in capture fisheries rents
—
A synthesis study
3
be compared with the Bjørndal estimate of annual resource rent, under optimal
conditions, of about US$550 million (Bjørndal, 2009, p. 11).
The root of the problem is straightforward enough. The cooperative game that
is the ICCAT-based RFMO governing the tuna resources has degenerated into
a competitive game. The management advice provided by the ICCAT is largely
ignored (Bjørndal, 2009). The economics of non-cooperative management of
shared fishery resources predicts that the shared fishery can readily take on all of
the characteristics of a pure open-access one. Bjørndal maintains that the fishery
is to all intents and purposes just that. The steady, almost inexorable, decline in
the SSB in the past 30 years is entirely consistent with a pure open-access fishery
(Bjørndal, 2009).
With the support of the EU, the ICCAT has called for the implementation of
a recovery programme, i.e. a programme of resource investment. However, given
the severely reduced state of the biomass, MacKenzie, Mosegaard and Rosenberg
(2009) argue that recovery may take many years even if fishing mortality is
drastically reduced. In other words, the states currently exploiting the resource
will be called upon to bear heavy investment costs.
The economics of cooperative fisheries management makes it clear that the
needed cooperation will be forthcoming only if compliance is ensured. If a moral
and otherwise law-abiding member state of the RFMO is convinced that cheating
by other RFMO members will go unchecked, this otherwise law-abiding member
state will probably conclude that it would be no better off under cooperation,
and probably less well off, than it would be under competition. Cooperation will
founder. Ensuring compliance in a cooperative fisheries game with 25–30 “players”
is a formidable undertaking.
There is another problem. Suppose that somehow the compliance problem is
effectively resolved, and suppose that substantial resource investment is achieved.
At its peak, the fishery had up to 50 participating states. What is to prevent
the 20–25 states that left the fishery demanding re-admission to the club once
the resource investment programme has achieved success? If those returning
states were re-admitted and granted significant shares of the TAC, they would
effectively be free riders, having borne none of the cost of investment. It is not at
all clear that, under the 1995 UN Fish Stocks Agreement, the would-be returning
states could be denied re-admission.
If the would-be returnees cannot be denied re-admission, then it would be
foolish to suppose that the current members of the RFMO could not anticipate the
future free riding. The anticipated free riding could lead many current members
to conclude that they would be better off under competition. Once again, the
proposed cooperative resource investment programme would be stillborn (Kaitala
and Munro, 1997; Munro, Van Houtte and Willmann, 2004). It can be argued that,
without a resolution of the so-called “new member” problem, the outlook for the
future of the resource is bleak.
A stark contrast is provided by the case of Norwegian spring-spawning
herring, to which reference has already been made. When healthy, the resource has

The way forward
39
historically been one of the largest and most valuable in the Northeast Atlantic.
When healthy, the resource migrates from its spawning grounds in Norwegian
waters as far west as Iceland. In so doing, the resource passes through international
waters, which means that it is to be classified as a straddling stock (Bjørndal,
2008).
It will be recalled that the resource crashed in the late 1960s and early 1970s,
and that its SSB was reduced to 2 000 tonnes, 0.08 percent of the critical minimum
level of 2.5 million tonnes. Massive resource re-investment was called for and it did
occur. Today the resource is healthy, with the SSB at more than 6.5 million tonnes
(Bjørndal, 2008). So what went right?
First, the remnants of the resource were confined to Norwegian waters. Thus,
it ceased, for the time being, to be a shared fishery resource. Second, as indicated
above, the Norwegian fleet and human capital involved in the fishery was highly
malleable with respect to the fishery. It was politically easy for the Norwegian
resource managers to declare a harvest moratorium, which more or less remained
in place for 20 years. Finally, there was an element of luck in that environmental
conditions allowed for a recovery of the resource from its desperately low state.
By 1994, there were signs that the recovered resource was re-commencing its
migratory pattern, and was thus once again becoming a shared stock. There was a
realization among the relevant states that cooperative management was required if
another disaster was to be averted. Indeed, the states recognized that, if the stock
were to crash again, no recovery might be forthcoming.
The first attempts to develop a cooperative regime involved the Faroe Islands,
Iceland, Norway and the Russian Federation. These attempts were largely
unsuccessful, with an important reason being that an important player, in the form
of the EU, had been left out. The EU can claim a very small coastal state interest
in the resource, but more importantly, its fleets were able to operate in the high
seas through which the resource passed in its migration – the typical free rider
problem.
By late 1996, the EU had been brought in to the cooperative arrangement. The
recently concluded 1995 UN Fish Stocks Agreement provided a useful framework
for the now inclusive agreement (Munro, 2001). The emerging RFMO was to
operate under the Northeast Atlantic Fisheries Commission.
For several years, the cooperative game in the form of the Norwegian
spring-spawning herring cooperative management arrangement seemed to be
stable and to be effective in terms of both conservation and resource rent
generation. In contrast to the Northeast Atlantic/Mediterranean bluefin tuna
cooperative resource management arrangement, the number of “players” was
small (a cooperative straddling stock fishery game with only five “players” is small
indeed). There were no troublesome would-be new members appearing on the
horizon. One can conjecture that the absence of a new member problem was not
unconnected with the fact that two of the “players” were, and are, politically very
powerful – the EU and the Russian Federation.

From drain to gain in capture fisheries rents
—
A synthesis study
40
However, a problem arose in 2002, which was of a type that can afflict any
RFMO. When one talks about the stability of the RFMO cooperative fisheries
game, it is not enough to talk about current stability. One has to be concerned
with the stability of the RFMO through time, what economists refer to as the
“resiliency” or, more technically, the time consistency problem. Any RFMO
can be expected to be subject to unpredictable shocks, which may be political,
economic or environmental in nature. If the RFMO lacks the resilience and
flexibility to respond to and absorb these shocks, the RFMO may founder
(Miller and Munro, 2004; Munro, 2009).
The harvest-sharing rule in the Norwegian spring-spawning herring RFMO is
based upon the so-called zonal attachment of the herring on its migratory path,
with this being based, in turn, on the amount of the resource in each zone and
the amount of time spent by the resource in each zone. In 2002, the Norwegians
claimed that the zonal attachment of the resource to the Norwegian EEZ was in
fact substantially greater than had been thought to be the case when the cooperative
resource management arrangement (including the EU) had been agreed upon in
1996. The Norwegians demanded a greater share of the TAC. Iceland and other
“players” refused. While not being formally terminated, the cooperative resource
management arrangement seized up. There was no mechanism in the arrangement
to deal with shocks such as those arising from shifting migratory patterns. Thus,
the cooperative resource management arrangement was found to lack resilience.
The cooperative fishery game began to show worrying signs of degenerating into
a competitive one.
The “prisoner’s dilemma” began slowly manifesting itself in different ways. The
original cooperative resource management arrangement had various bilateral side
arrangements, which had the effect of increasing the global economic rent from
the fishery. Thus, for example, non-Norwegian “players” were granted permission
to harvest parts of their quotas in the Norwegian zone in order to allow them
to harvest the herring when the fish were at their most valuable state. With the
exception of the Russian Federation, all non-Norwegian “players” were banned
from the Norwegian EEZ after 2002, thereby reducing the global resource rent
pie. In addition, the RFMO was in the practice of accepting ICES scientific advice
in setting the global TAC. Players now began setting their own quotas unilaterally,
with the to-be-expected result that the sum of the individual quotas exceeded the
ICES recommended global TAC by a significant margin (Bjørndal, 2008).
By the end of 2006, a new cooperative management arrangement had been
agreed to, with Norway gaining a modest increase in its quota. While the details
on the negotiations leading to the new arrangement are not available in their
entirety, it is not unlikely that, in looking into the abyss after a dangerous three-
to-four year hiatus, all “players” realized that a cooperative arrangement, while
less than perfectly satisfactory to all, was much to be preferred to no arrangement
at all.

The way forward
41
Bjørndal demonstrates that the resource rent from the fishery could be increased
by fine tuning the harvesting arrangements. Nonetheless, the resource rent is very
substantial and would have seemed unachievable 35 years ago (Bjørndal, 2008).
4.4.1 International and intra-eeZ incentive structures
In the discussion of Level 1 and 2 fisheries, emphasis was given to the importance of
correct incentive structures within the EEZ. In the discussion of Level 3 fisheries,
most of the discussion has been on internationally shared fishery resources, and
the fundamental importance of states sharing the resources having the incentive to
cooperate in the management of the resources through time. It is now appropriate
to ask whether there is any interrelationship between the two sets of incentives.
The answer is a straightforward one, namely that there is an interrelationship.
Consider a shared fishery resource in which the states sharing the resource have
ineffective intra-EEZ management of their respective shares of the resource, so
that the intra-EEZ rent from the resource is completely dissipated. In the theory
of strategic interaction (theory of games), there is the concept of the cooperative
surplus. This is the difference between the sum of the payoffs to the players under
cooperation minus the sum of the payoffs to the players under competition. If the
intra-EEZ rent from the resource is completely dissipated, the cooperative surplus
maybe negligible, which means in turn that the incentive to establish a cooperative
management regime will be at a minimum (Munro, 2007).
Conversely, suppose that each sharing state is attempting to establish an
intra-EEZ effective harvesting-rights scheme, but suppose further that they are
unsuccessful in establishing an effective cooperative resource management regime.
It is easy to show that this lack of international success can readily undermine
the attempts to establish intra-EEZ effective harvesting-rights schemes – the
“prisoner’s dilemma” again. After all, it was the realization that the non-
cooperative management of the high-seas portions of highly migratory and
straddling fish stocks was undermining the attempts at intra-EEZ management
of these resources that led to the 1993–95 UN Fish Stocks Conference and the
subsequent 1995 UN Fish Stocks Agreement (Munro, 2007).


43
5. Summary and conclusions
The Sunken Billions report (World Bank and FAO, 2009) estimates conservatively
that, owing to inadequate management of marine capture fishery resources, the
world is facing an ongoing resource rent loss of the order of US$50 billion per
year. The case studies reveal that the rent loss is occurring in both developed and
developing fishing states, independent of the nature of the states’ political and
economic regimes. Capitalist and socialist fishing states alike share in the rent loss
dishonour.
However, far from being alarmist, this conclusion understates the gravity of
the problem. A close reading of the report shows that, while there are prosperous
capture fisheries, the overall resource rent from the world capture fisheries is, at
best, equal to zero. Thus, the natural capital in the form of world capture fisheries
resources must be seen as a set of non-performing assets that, on balance, are
making no net contribution to world economic development.
The question then is how to correct this situation so that this great stock
of natural capital will be seen as providing the world with a positive economic
return.
This report attempts to provide no definitive answers. A second project, a “rent
gain” project, is required to search out the answers. Rather, the present report can
only hope to point to avenues of research that will need to be explored.
To begin, one has to ask how the world has come to find itself in this position.
Up until 125 years ago, few worried about the overexploitation of ocean capture
fishery resources as they appeared to be inexhaustible – free “natural” capital. The
state of fishing technology was such that large amounts of these resources were
protected by economics. It was too costly to exploit them extensively.
With ongoing advances in fishing technology reducing fishing costs, the
economic protection afforded capture fishery resources steadily evaporated, with
free “natural” capital being transformed into decidedly scarce “natural” capital.
The world was then confronted with the full consequences of “common pool”
fishery resources, in which the property rights to the resources, private or public,
are ill defined or non-existent. As economists have recognized for more than
half a century, in such circumstances, fishers are faced with a set of incentives
that are perverse from society’s point of view, leading inevitably to resource
overexploitation and dissipation of resource rent.
Hence, the key issue in attempting rent recapture is that of dealing with perverse
incentives. The incentives to be faced are first those that have to be addressed on
an intra-EEZ basis, and second those that have to be dealt with on an international
basis. It is suggested that, in examining fisheries in need of management reform,
one can think of three levels of fisheries. The first, and easiest, consists of fisheries

From drain to gain in capture fisheries rents
—
A synthesis study
44
that can be viewed on a strictly intra-EEZ basis and that, through good fortune,
have not experienced significant resource depletion but in which the resource rent
has been nonetheless been dissipated through ineffective management.
In FAO terminology, intra-EEZ perverse incentives can be dealt with by
incentive-blocking measures or by incentive-adjusting ones. The former have
had some limited success blocking fisher incentives to overexploit the resource,
but very little success in dealing with other incentives leading to other source of
dissipation, such as the buildup of excess capacity. Incentive-adjusting measures
are called for, with the most commonly used ones consisting of harvesting-
rights schemes, such as ITQs, but also territorial use rights in fisheries and fisher
cooperatives.
The Sunken Billions report makes it evident that, if anything approaching the
resource rent potential of capture fisheries is to be achieved, there will have to be
massive rebuilding of the hitherto depleted resources. In other words, a major
investment programme in the “natural” capital of fisheries is called for. The second
level of fisheries in need of reform is seen to consist of those fisheries that were
subject to extensive overexploitation in the past but in which the fisher incentives
have been adjusted to the extent that there is no longer an incentive on the part of
the fishers to deplete the resource further and to the extent that some resource rent
is forthcoming. However, as no positive investment in the resource has occurred,
the rent re-capture process is thus incomplete.
Any positive investment in real capital involves a current cost that is borne
in the hope of returns in the future. The question is how to adjust the fisher
incentives further so that they will have an incentive to invest in the resources, or
at least not impede the resource investment programme. There are no immediate
answers to this question.
The third level of fisheries consists of fisheries in which the incentives remain
uncorrected and in which resource investment, if it is occurring, is negative.
For those third-level fisheries for which international considerations are not a
significant issue, the first step is to introduce incentives schemes that will curb the
fisher incentive to overexploit the resources, and that will lead to the generation
of resource rent – in other words to transform the fisheries, at a minimum, into
second-level fisheries.
The most difficult of the third-level fisheries are those in which international
considerations are of paramount importance, in other words internationally
shared fishery resources. Ineffective resource management cooperation among
the relevant fishing states will result in incentives to overexploit the resources
and dissipate resource rent arising, not just on a fisher basis, but on a state basis
as well. Of these difficult third-level fisheries, the most difficult are those to be
found either all or in part in the high seas. With respect to such high-seas fisheries,
the case studies provide an example of a spectacular failure to prevent resource
overexploitation and rent dissipation. However, encouragingly, they also provide
an example of a spectacular success in positive resource investment and the
regaining of resource rent.

45
References
Anderson, C.N.K., Hsieh, C.-H., Sandin, S.A., Hewitt, R., Hollowed, A.B.,
Beddington, J., May, R.M. & Sugihara, G. 2008. Why fishing magnifies fluctuations
in fish abundance. Nature, 452(7189): 835–839.
Arnason, R. 1984. Efficient harvesting of fish stocks: the case of the Icelandic
DEMERSAL Fisheries. Department of Economics, University of British Columbia.
(PhD dissertation)
Arnason, R. 2007. An EXCEL program to estimate parameters and calculate fisheries
rents. Rome, FAO.
Arnason, R. 2008. Rents and rent drain in the Icelandic cod fishery. Revised draft.
Prepared for the World Bank PROFISH Program, Washington, DC.
Arnason, R., Magnusson, G. & Agnarsson, S. 2000. The Norwegian spring spawning
herring fishery: a stylized game model. Marine Resource Economics, 15: 293–320.
Bjørndal, T. 1987. Production economics and optimal stock size in a North Atlantic
fishery. Scandinavian Journal of Economics, 89: 145–164.
Bjørndal, T. 2008. Rent in the fishery for Norwegian spring spawning herring. Final
draft. Prepared for the World Bank PROFISH Program, Washington, DC.
Bjørndal, T. 2009. Rent in the Northeast Atlantic and Mediterranean bluefin tuna
fishery. Final draft. Prepared for the World Bank PROFISH Program, Washington,
DC.
Bjørndal, T. & Munro, G. 1998. The economics of fisheries management: a survey. In
T. Tietenberg & H. Folmer, eds. The International Yearbook of Environmental and
Resource Economics 1998/1999, pp. 153–188. Cheltenham, UK, Edward Elgar.
Boonchuwong, P. & Dechboon, W. 2008. Rent drain estimation of the Thai fisheries in
the Gulf of Thailand. Final draft. Prepared for the World Bank PROFISH Program,
Washington, DC.
Christy, F.T. & Scott, A. 1965. The common wealth in ocean fisheries. some problems
of growth and economic allocation. Resources for the Future. Baltimore, USA, and
London, The Johns Hopkins Press.
Clark, C. & Munro, G. 1975. The economics of fishing and modern capital theory:
a simplified approach. Journal of Environmental Economics and Management, 2:
92–106.
Clark, C., Clarke, F. & Munro, G. 1979. The optimal exploitation of renewable
resource stocks: problems of irreversible investment. Econometrica, 47: 25–47.
Clark, C., Munro, G. & Sumaila, U.R. 2010. Limits to the privatization of fishery
resources. Land Economics, 86: 209–218.
Clarke, F. & Munro, G. 1987. Coastal states, distant water fishing nations and extended
jurisdiction: a principal–agent analysis. Natural Resource Modelling, 2: 81–108.

From drain to gain in capture fisheries rents
—
A synthesis study
4
Cunningham, S., Didi, H., Mouhamedou, F.O. & Kinadjian, L. 2008. Estimation
of the loss of economic rent in cephalopod fisheries: case study of the octopus fishery
of Mauritania. Final draft. Prepared for the World Bank PROFISH Program,
Washington, DC.
Curtis, R. & Squires, D. (eds). 2007. Fisheries buybacks. Oxford, UK, Blackwell.
FAO. 1993. Marine fisheries and the Law of the Sea: a decade of change. Special
chapter (revised) of The State of Food and Agriculture 1992. FAO Circular No. 853.
Rome. 75 pp.
FAO. 2000. Report of the Technical Consultation on the Measurement of Fishing
Capacity. Mexico City, Mexico, 29 November–3 December 1999. FAO Fisheries
Report No. 615. Rome. 51 pp.
FAO. 2002. Report of the Norway-FAO Expert Consultation on the Management of
Shared Fish Stocks, Bergen, Norway, 7–10 October 2002. FAO Fisheries Report
No. 695. Rome. 42 pp.
FAO. 2005. Review of the state of world marine fishery resources. FAO Fisheries
Technical Paper No. 457. Rome. 242 pp.
FAO. 2007. The State of World Fisheries and Aquaculture 2006. Rome. 162 pp.
Fitzpatrick, J. 1996. Technology and fisheries legislation. In FAO, ed. Precautionary
approach to fisheries. Part 2. Scientific papers. FAO Fisheries Technical Paper
No. 350/2. Rome, FAO.
Gordon, H.S. 1954. The economic theory of a common property resource: the fishery.
Journal of Political Economy, 62: 124–142.
Grafton, R.Q., Kompass, T. & Hilborn, R.W. 2007. Economics of overexploitation
revisited. Science, 318: 1601.
Gréboval, D. & Munro, G. 1999. Overcapitalization and excess capacity in world
fisheries: underlying economics and methods of control. In D. Gréboval, G. Munro,
C. Newton, D. Squires & J. Kirkley. Managing fishing capacity: selected papers on
underlying concepts and issues, pp. 1–48. FAO Fisheries Technical Paper No. 386.
Rome, FAO.
Gréboval, D., Munro, G., Newton, C., Squires, D. & Kirkley, J. 1999. Managing
fishing capacity: selected papers on underlying concepts and issues. FAO Fisheries
Technical Paper No. 386. Rome, FAO. 206 pp.
Gulland, J.A. 1971. The fish resources of the ocean. West Byfleet, UK, Fishing News
(Books) Ltd.
Hannesson, R. 1993. Bioeconomic analysis of fisheries. Oxford, UK, Fishing News
Books.
Hannesson, R. 2002. The economics of fishing down the food chain. Canadian
Journal of Fisheries and Aquatic Sciences, 59(5): 755–758.
Herrmann, M. 1996. Estimating the induced price increase for Canadian Pacific
halibut with the introduction of the individual vessel quota program. Canadian
Journal of Agricultural Economics, 44(2): 151–164.
Hilborn, R., Orensanz, J. & Parma, A. 2005. Institutions, incentives and the future of
fisheries. Philosophical Transactions of the Royal Society B, 360: 47–57.

References
47
Homans, F. & Wilen, J. 1997. A model of regulated open access use. Journal of
Environmental Economics and Management, 32: 1–21.
Homans, F. & Wilen, J. 2005. Markets and rent dissipation in regulated open access
fisheries. Journal of Environmental Economics and Management, 49: 381–404.
Hoshino, E. & Matsuda, Y. 2007. Resource rents in two Japanese fisheries. Final draft.
Prepared for the World Bank PROFISH Program, Washington, DC.
Hutchings, J. 2000. Collapse and recovery of marine fisheries. Nature, 406: 882–885.
International Pacific Halibut Commission (IPHC). 2009. (available at http://www.
iphc.washington.edu).
Kaitala, V. & Munro, G. 1997. The conservation and management of high sea fishery
resources under the New Law of the Sea. Natural Resource Modelling, 10: 87–108.
Kelleher, K. 2002. The costs of monitoring, control and surveillance of fisheries in
developing countries. FAO Fisheries Circular No. 976. Rome, FAO. 47 pp.
Kelleher, K. & Willmann, R. 2006. ‘The rent drain’: towards an estimate of the loss of
resource rents in the world’s fisheries. Report of the FAO/World Bank Study Design
Workshop, 17–18 January, World Bank, Washington, DC.
Kurien, J. 2007. Estimation of some aspects of the economics of operation of marine
fishing crafts in India. A study for the PROFISH Big Numbers Project. Penang,
Malaysia, and Rome, WorldFish and FAO. (mimeo)
Kurien, J. & Willmann, R. 2009. Small-scale fisheries in the fish rights context. Paper
prepared for the Conference on Efficient Fisheries Management: Fishing Rights and
Flexibility, 27–28 August, Reykjavik.
Lery, J.-M., Prado, J. & Tietze, U. 1999. Economic viability of marine capture fisheries:
findings of a global study and an interregional workshop. FAO Fisheries Technical
Paper. No. 377. Rome, FAO. 142 pp.
Lodge, M., Anderson, D., Løbach, T., Munro, G., Sainsbury, K. & Willock, A. 2007.
Recommended best practices for regional fisheries management organizations: report
of an independent panel to develop a model for improved governance by regional
fisheries management organizations. London, Chatham House.
MacKenzie, B., Mosegaard, H. & Rosenberg, A. 2009. Impending collapse of the
bluefin tuna in the Northeast Atlantic and Mediterranean. Conservation Letters, 2:
25–34.
Marine Resources Assessment Group (MRAG) & University of British Columbia
(UBC). 2008. The global extent of illegal fishing. Final report. 28 April 2008.
Miller, K. & Munro, G. 2004. Climate and cooperation: a new perspective on the
management of shared fish stocks. Marine Resource Economics, 19: 367–393.
Moma, A. 2007. The potential of artisanal hilsa fishery: economically efficient fisheries
policy. Department of Fisheries, Bangladesh and University of Iceland/United
Nations University.
Munro, G. 2001. The United Nations Fish Stocks Agreement of 1995: history and
problems of implementation. Marine Resource Economics, 15: 265–280.
Munro, G. 2007. Internationally shared fish stocks, the high seas and property rights
in fisheries. Marine Resource Economics, 22: 425–443.

From drain to gain in capture fisheries rents
—
A synthesis study
4
Munro, G. 2009. Game theory and the development of resource management policy:
the case of international fisheries. Environment and Development Economics, 14
Part 1: 7–27.
Munro, G. & Sumaila, U.R. 2002. Subsidies and their potential impact on the
management of the ecosystem of the North Atlantic. Fish and Fisheries, 3:
233–250.
Munro, G., Van Houtte, A. & Willmann, R. 2004. The conservation and management
of shared fish stocks: legal and economic aspects. FAO Fisheries Technical Paper
No. 465. Rome, FAO. 79 pp.
Munro, G., Turris, B., Clark, C., Sumaila, U.R. & Bailey, M. 2009. Impacts of
harvesting rights in Canadian Pacific fisheries. Statistical and Economic Analysis
Series Nos. 1–3. Ottawa, Fisheries and Oceans Canada.
National Research Council. 1999. Sustaining marine fisheries. Washington, DC,
National Academy Press.
Oceanic Développement. 2001. Cost benefit comparison of different control strategies.
Project of final report. In association with Richard Banks Ltd., Megapesca Lda.
Orrego Vicuña, F. 1999. The changing international law of high seas fisheries.
Cambridge, UK, Cambridge University Press.
Pauly, D., Christensen, V., Guénette, S., Pitcher, T.J., Sumaila, U.R., Walters, C.
J., Watson, R. & Zeller, D. 2002. Toward sustainability in world fisheries. Nature,
418: 689–695.
Purwanto, P. 2008a. Resource rent generated in the Bali Strait sardine fishery in a
fluctuating environment. Final draft. Prepared for the World Bank PROFISH
Program, Washington, DC.
Purwanto, P. 2008b. Resource rent generated in the Arafura shrimp fishery. Final draft.
Prepared for the World Bank PROFISH Program, Washington, DC.
Sanchirico, J. & Wilen, J. 2005. Optimal spatial management of renewable resources:
matching policy scope to ecosystem scale. Journal of Environmental Economics and
Management, 50: 23–46.
Sappington, D. 1991. Incentives in principal–agent relationship. Journal of Economic
Perspectives, 5: 45–66.
Sumaila, U.R. & Marsden, D. 2008. FAO/World Bank rent drain study – case study
of the Namibian hake fishery. Final draft. Prepared for the World Bank PROFISH
Program, Washington, D.C.
Tietze, U., Prado, J., Le Ry, J. & Lasch, R. 2001. Techno-economic performance of
marine capture fisheries and the role of economic incentives, value addition and
changes of fleet structure: findings of a global study and an interregional workshop.
FAO Fisheries Technical Paper No. 421. Rome, FAO. 79 pp.
Tietze, U., Thiele, W., Lasch, R., Thomsen, B. & Rihan, D. 2005. Economic
performance and fishing efficiency of marine capture fisheries. FAO Fisheries
Technical Paper No. 482. Rome, FAO. 68 pp.
Tucker, A.W. 1950. A two-person dilemma. Stanford University. (unpublished)
United Nations (UN). 1995. United Nations Conference on Straddling Fish Stocks
and Highly Migratory Fish Stocks. Agreement for the Implementation of the

References
49
Provisions of the United Nations Convention on the Law of the Sea of 10 December
1982 Relating to the Conservation and Management of Straddling Fish Stocks and
Highly Migratory Fish Stocks. U.N. Doc. A/Conf./164/37.
United Nations Environment Programme (UNEP). 2002. Integrated assessment of
trade liberalization and trade-related policies: a country study on the fisheries sector
in Argentina. New York, USA, and Geneva, Switzerland, UN.
Warui, S.W. 2008. Rents and rents drain in the Lake Victoria Nile perch fishery. Kenya,
Ministry of Livestock and Fisheries Development; and University of Iceland/United
Nations University.
Watson, R. & Pauly, D. 2001. Systematic distortions in world fisheries catch trends.
Nature, 414: 534–536.
Watson, J.M. & Seidel, R. 2003. 2003 economic survey of the North Sea and west of
Scotland whitefish fleet. Edinburgh, UK, Seafish.
World Bank. 2005. Where is the wealth of nations? Measuring capital for the 21st
century. Washington, DC. (also available at http://siteresources.worldbank.org/
INTEEI/214578-1110886258964/20748034/All.pdf).
World Bank & FAO. 2009. The sunken billions: the economic justification for fisheries
reform. Advance edition. Washington, DC, Agriculture and Rural Development,
World Bank.
Yang, Z. & Nie, X. 2008. FAO/World Bank rent drain study: China case study –
fisheries in the Bohai Sea and the Yellow Sea. Final draft. Prepared for the World
Bank PROFISH Program, Washington, DC.
Yew, T.S. 2008. Economic valuation of marine fishery resource changes in the Straits of
Malacca: a resource accounting approach. Final draft. Prepared for the World Bank
PROFISH Program, Washington, DC.
Zeller, D. & Pauly, D. (eds). 2007. Reconstruction of marine fisheries catches for key
countries and regions (1950–2005). Fisheries Centre Research Reports 15(2). The
Fisheries Centre, University of British Columbia. 163 pp.


Wyszukiwarka
Podobne podstrony:
1980 From Latin to Romance in Sound Charts
William Weber From miscellany to homogenity in Concert Programming
Adaptive Filters in MATLAB From Novice to Expert
Notto R Thelle Buddhism and Christianity in Japan From Conflict to Dialogue, 1854 1899, 1987
Far Infrared Energy Distributions of Active Galaxies in the Local Universe and Beyond From ISO to H
Kevin Breel has decided to confess in public that he suffers from depression
ebooksclub org Women and Race in Contemporary U S Writing From Faulkner to Morrison American Literat
A Sarong in my Backpack Adventures from Munich to Pushkar
Adaptive Filters in MATLAB From Novice to Expert
2004 Variation and Morphosyntactic Change in Greek From Clitics to Affixes Palgrave Studies in Langu
Full Toroidal Variable Drive Transmission Systems in Mechanical Hybrid Systems From Formula 1 to Ro
Air staging to reduce emissions from energy crop combustion in small
Andrei Marmor Social Conventions From Language to Law Princeton Monographs in Philosophy 2009
Armstrong; From Huponoia to Paranoia On the Secular Co optation of Homeric Religion in Vico, Feuerba
John N Duvall Race and the White Identity in Southern Fiction From Faulkner to Morrison
History of Race Relations in the America from Slavery to Pre doc
From micro to nano contacs in biological attachment WŁOSKI !
Bryant Theodore, MSW Self Discipline In 10 Days How To Go From Thinking To Doing
Estimation of Dietary Pb and Cd Intake from Pb and Cd in blood and urine
więcej podobnych podstron