
TRAINING INTELLIGENT AGENTS USING
HUMAN INTERNET DATA
ELIZABETH SKLAR
y
ALAN D. BLAIR
z
PABLO FUNES
y
JORDAN POLLACK
y
y
DEMO Lab, Dept. of Computer Science,
Brandeis University,
Waltham, MA 02454-9110, USA
E-mail: sklar,pablo,pollack@cs.brandeis.edu
z
Dept. of Computer Science,
University of Melbourne,
Parkville, Victoria, 3052, AUSTRALIA
E-mail: blair@cs.mu.oz.au
We describe a method for training intelligent agents using human data collected at
a novel Internet learning site where humans and software agents play games against
each other. To facilitate human learning, it is desirable to select proper opponents
for humans so that they will advance and not become bored or frustrated. In the
work presented here, we use human data as the basis for constructing a population
of graded agents, so that in future we can choose opponents (from this population)
that will challenge individual human learners appropriately.
Keywords:
human-agent interaction, neural networks, learning
1 Introduction.
Hidden inside every mouse click and every key stroke is valuable information
that can be tapped, to reveal something of the human who entered each action.
Commercial products like MicrosoftWord provide context sensitive \wizards"
that observe their users and pop up to assist with current tasks. Internet sites
like
altavista
a
recognise keywords in search requests, oering alternate sugges-
tions to help users hone in on desired information. At the
amazon.com
b
book
store, after nding one title, other books are recommended to users who might
be interested in alternate or follow-up reading. On many sites, advertisements
which at rst seem benign, slowly adapt their content to the user's input,
subtly wooing unsuspecting surfers.
a
http://www.altavista.com
b
http://www.amazon.com
1

Data mining the click-stream to customize to the individual user is nothing
new. In 1991, Cypher demonstrated \Eager", an agent that learned to recog-
nise repetitive tasks in an email application and oered to jump in and take
over for the user
1
. In 1994, Maes used machine learning techniques to train
agents to help with email, lter news messages and recommend entertainment,
gradually gaining condence at predicting what the user wants to do next
5
.
The work presented here examines these ideas in the context of a com-
petitive Internet learning community
8
. In this special type of environment,
humans and software agents act as opponents and the competition inherent in
their encounters serves to motivate the human population and to provide selec-
tion criteria for an evolving population of software agents. While competition
in and of itself can act as a powerful motivator, it must be applied carefully in
a human learning environment | because the ultimate goal is for participants
to learn, not simply to win. Here, winning too frequently can mean that the
human is not being challenged with new situations and therefore is not learn-
ing. Thus, encounters should be arranged so that humans are neither bored
by matches that are too easy nor frustrated by matches that are too hard.
One hypothesis is that the perfect learning opponent is one whose skills are
similar to those of the learner, but are just enough more advanced so that, by
stretching, the learner can win most of the time. The trick then is to provide a
series of perfect learning opponents that can step the learner through the task
domain. But designing a set of perfect learning partners that would work for
all users is an arduous, if not impossible, task.
Our long term aim is to use human input of varying levels as the basis for
constructing a population of graded agents, and then, for individual learners,
to select opponents (from this population of agents) that are just beyond the
human learner, but still within reach. The work presented here focuses on the
initial stages of this project, where we have dened a control architecture for
the agents and devised a method for training the agents by observing human
behaviour in a simple task domain.
2 Task Domain.
In earlier work
2
, we built a Java version of the real-time video game Tron and
released it on the Internet
c
(illustrated in gure 4). Human visitors play against
an evolving population of intelligent agents, controlled by genetic programs
(
gp
)
4
. On-line since September 1997, the Tron system has collected data on
over 200,000 games played by over 4000 humans and 3000 agents.
c
http://www.demo.cs.brandeis.edu/tron
2
Tron became popular in the 1980's, when Disney released a lm featuring
futuristic motorcycles that run at constant speeds, making right angle turns
and leaving solid wall trails { until one crashes into a wall and dies. We ab-
stract the motorcycles and represent them only by their trails. Two players {
one human and one agent { start near the middle of the screen, heading in the
same direction. Players may move past the edges of the screen and re-appear
on the opposite side in a wrap-around, or
tor
oidal
, game arena. The size of
the arena is 256
256 pixels. The agents are provided with 8 simple sensors
with which to perceive their environment (see gure 1). The game runs in
simulated real-time (i.e. play is regulated by synchronised time steps), where
each player selects moves:
left
,
right
or
straight
.
6
2
5
7
1
3
0
4
Figure 1 Agent sensors. Each sensor evaluates the distance in pixels
from the current position to the nearest obstacle in one direction, and
returns a maximum value of 1
:
0 for an immediate obstacle (i.e. a wall
in an adjacent pixel), a lower number for an obstacle further away,
and 0
:
0 when there are no walls in sight.
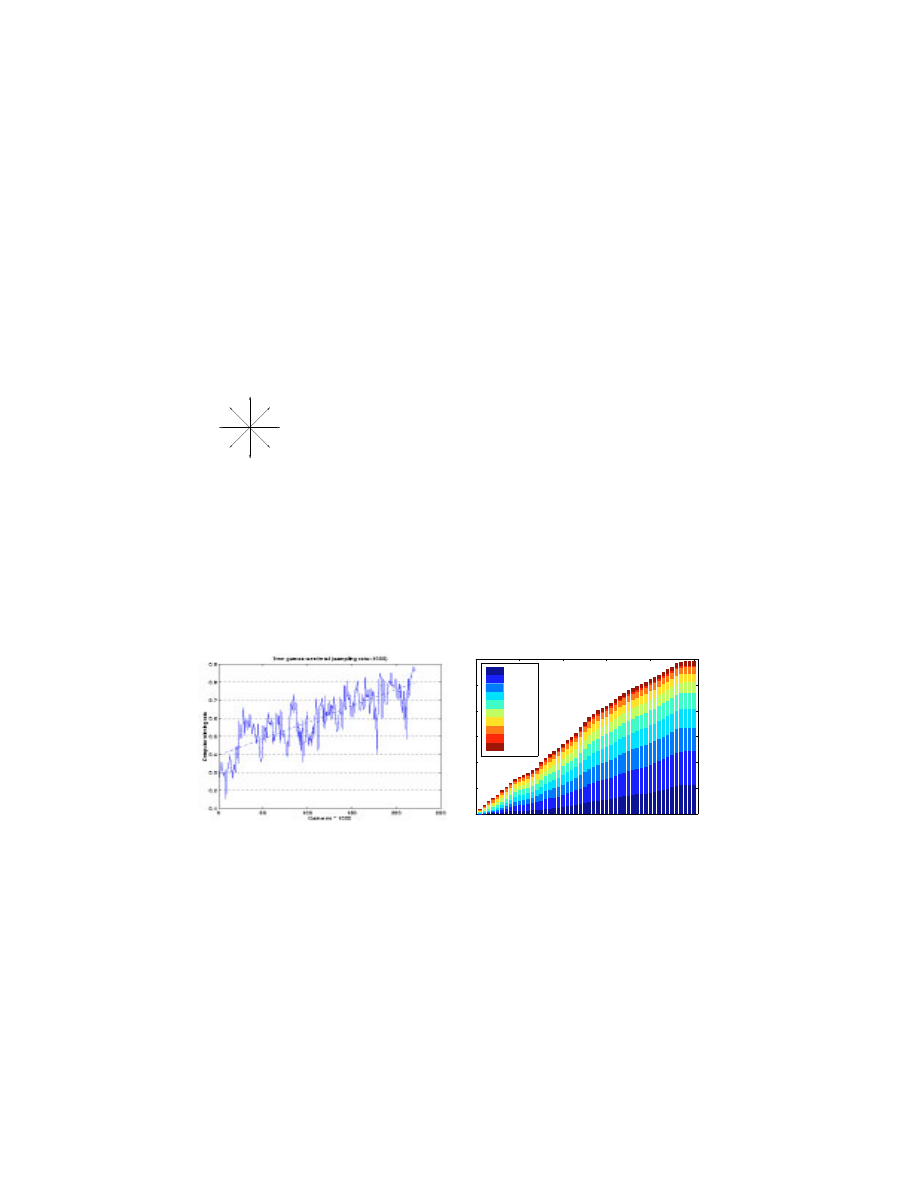
Our general performance measure is the
win rate
, calculated as the num-
ber of games won divided by the number of games played. The overall win
rate of the agent population has increased from 28% at the beginning of our
experiment (September 1997) to nearly 80%, as shown in gure 2(a). During
this time, the number of human participants has increased. Figure 2(b) illus-
trates the distribution of performances within the human population, grouped
by (human) win rate. While some segments of the population grow a bit faster
than others, overall the site has maintained a mix of human performances.
0
500
1000
1500
2000
2500
3000
range of days: from September 1997 to January 1999
number of players in each group
10%
20%
30%
40%
50%
60%
70%
80%
90%
100%
(a) Agent win rate.
(b) Distribution of human population.
Figure 2 Results from the Internet experiment.
The data collected on the Internet site consists of these win rate results
as well as the content of each game (referred to as the
moves string
). This
3

includes the length of the game (i.e. number of time steps) and, for every turn
made by either player, the global direction of the turn (i.e. north, south, east
or west) and the time step in which the turn was made.
3 Agent Training and Control.
We trained agents to play Tron, with the goal of approximating the behaviour
of the human population in the population of trained agents. The training
procedure, which uses
sup
ervise
d
le
arning
6
;
10
, is as follows. We designate a
player to be the
tr
ainer
and select a sequence of games (i.e. moves strings)
that were played by that player, against a series of
opp
onents
. We replay these
games; after each time step, play is suspended and the sensors of the trainer
are evaluated. These values are fed to a third player (the agent being trained),
referred to as the
tr
aine
e
, who makes a prediction of which move the trainer
will make next. The move predicted by the trainee is then compared to the
move made by the trainer, and the trainee's control mechanism is adjusted
accordingly.
The trained agents are controlled by a feed-forward neural network (see
gure 3). We adjust the networks during training using the backpropagation
algorithm
7
with Hinton's cross-entropy cost function
3
. The results presented
here were obtained with
momentum
= 0
:
9 and
learningrate
= 0
:
0002.
nodes
straight
tanh
sigmoid
left
right
sensors
input
nodes
hidden
output
nodes
Figure 3 Agent control architecture. Each agent is controlled by a feed-forward neural
network with 8 input units (one for each of the sensors in gure 1), 5 hidden units and 3
output units { representing each of the three possible actions (
l ef
t
,
r
ig
ht
,
str
aig
ht
); the one
with the largest value is selected as the action for the agent.
4 Challenges.
The supervised learning method described above is designed to minimize the
classication error of each move (i.e. choosing
left
,
right
or
straight
). How-
ever, a player will typically go
straight
for 98% of time steps, so there is a
danger that a trainee will minimize this error simply by choosing this option
100% of the time; and indeed, this behaviour is exactly what we observed in
many of our experiments. Such a player will necessarily die after 256 time
4

steps (see gure 4a). Conversely, if turns are emphasized too heavily, a player
will turn all the time and die even faster (gure 4b).
(a) a trainee that
makes no turns
(b) a trainee that only
makes turns
(c) a trainee that
learns to turn
(d) the trainer
Figure 4 A comparison of dierent trainees. All had the same trainer; trainee variations
include using 12-input network and dierent move evaluation strategies. All games are played
against the same
gp
opponent. The player of interest is represented by the solid black line
and starts on the left hand side of the arena.
The discrepancy between minimizing move classication error and playing
a good game has been noted in other domains
9
and is particularly pronounced
in Tron. Every left or right turn is generally preceded by a succession of
straight moves and there is a natural tendency for the straight moves to drown
out the turn, since they will typically occur close together in sensor space. In
order to address this problem, we settled on an evaluation strategy based on
the frequency of each type of move. During training, we construct a table
(table 1) that tallies the number of times the trainer and trainee turn, and
then emphasize turns proportionally, based on these values.
Table 1 Frequency of moves table, for the best human trainer.
trainee
l ef
t
str
aig
ht
r
ig
ht
l ef
t
852
5360
161
trainer
str
aig
ht
5723 658290
5150
r
ig
ht
123
4668
868
5 Experiments and Results.
We trained two populations of players: one with
gp
trainers and one with
human trainers. Although our goal is to approximate the behaviour of the
human population, we initially tuned our training algorithm by training agents
to emulate the behaviour of the
gp
players from the Internet site. These
gp
s
are deterministic players (so their behaviour is easier to predict than humans'),
thus providing a natural rst step toward our goal. Separate training and
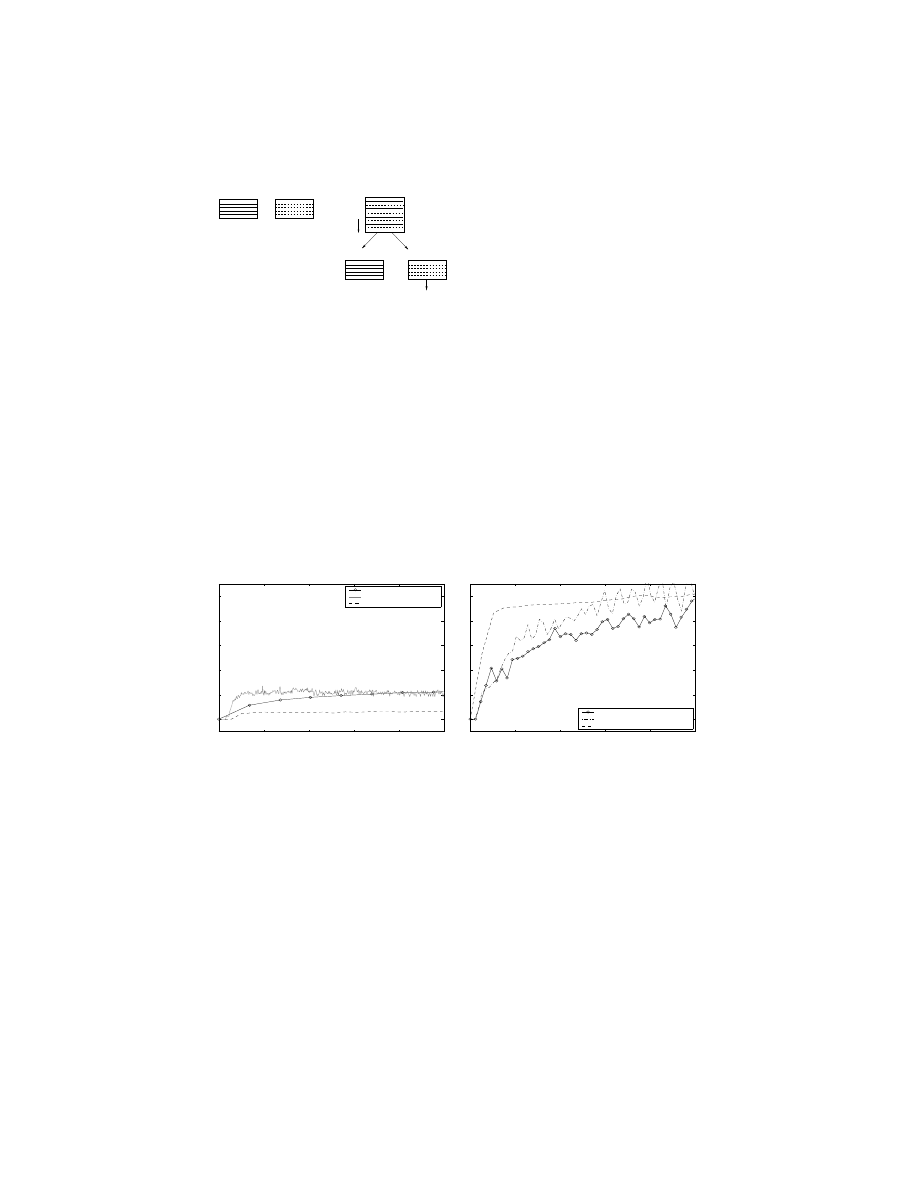
evaluation sets were compiled for both training eorts, as detailed in Figure 5.
5
evaluation set = agents100
Internet data
time
U
data for GP trainees
training set
evaluation set
data for human trainees
agents1000 = GPs > 1000 Internet games
(69 agents)
humans500 = humans > 500 Internet games
(58 humans)
agents100 = GPs < 1000 Internet games, and
(135 agents)
> 100 Internet games
GPs
evaluation set
agents1000
vs
agents100
agents1000
humans500
vs
vs
agents1000
training set
Figure 5 Data sets for training and evaluation. The 69
gp
s who had played more than 1000
games on the Internet site (
agents1000
) were used as trainers; the 135 who had played more
than 100 but less than 1000 games (
agents100
) were used for evaluation purposes. The 58
humans who had played more than 500 games on the Internet site (
humans500
) were used
as human trainers. Each
gp
trainer played against agents1000 to produce a training set
and against agents100 to produce an evaluation set. The games played by humans500 were
alternately placed into training and evaluation sets, and then the evaluation set was culled
so that it consisted entirely of games played against members of the agents100 group.
We examine our training eorts in three ways. First, we look directly at
the training runs and show the improvement of the networks during training.
Second, we present the win rates of the two populations of trainees, obtained
from playing them against a xed set of opponents, and consider: does our
technique produce controllers that can play Tron at all? Finally, we make a
comparison between trainers and the trainees, addressing: does our technique
produce a population that approximates the behaviour of its trainers?
0
1
2
3
4
5
x 10
6
0
0.1
0.2
0.3
0.4
0.5
number of training cycles
correlation coefficient
best trainer and trainee
worst trainee
worst trainer
0
1
2
3
4
5
x 10
6
0
0.1
0.2
0.3
0.4
0.5
number of training cycles
correlation coefficient
best trainer and worst trainee
best trainee
worst trainer
(a) humans
(b)
gp
s
Figure 6 Change in correlation coecient during training runs.
Our measure of improvement during training is based on the frequency of
moves table and how it changes. Referring back to table 1, if the trainee were
a perfect clone of its trainer, then all values outside the diagonal would be 0
and the
c
orr
elation
c
o
ecient
between the two players would be 1. In reality,
the
gp
trainees reach a correlation of 0
:
5 or so, while the human trainees
peak at around 0
:
14. For comparison, we computed correlation coecients for
6
127 random players
d
, resulting in a much smaller correlation of 0
:
003. Figure 6
shows the change in correlation coecient during training for selected trainees.
0
0
10
20
30
40
50
60
70
80
90
100
win rate (%)
individual players, in sorted order by win rate
original
trainees
0
0
10
20
30
40
50
60
70
80
90
100
win rate (%)
individual players, in sorted order by win rate
original
trainees
(a) humans
(b)
gp
s
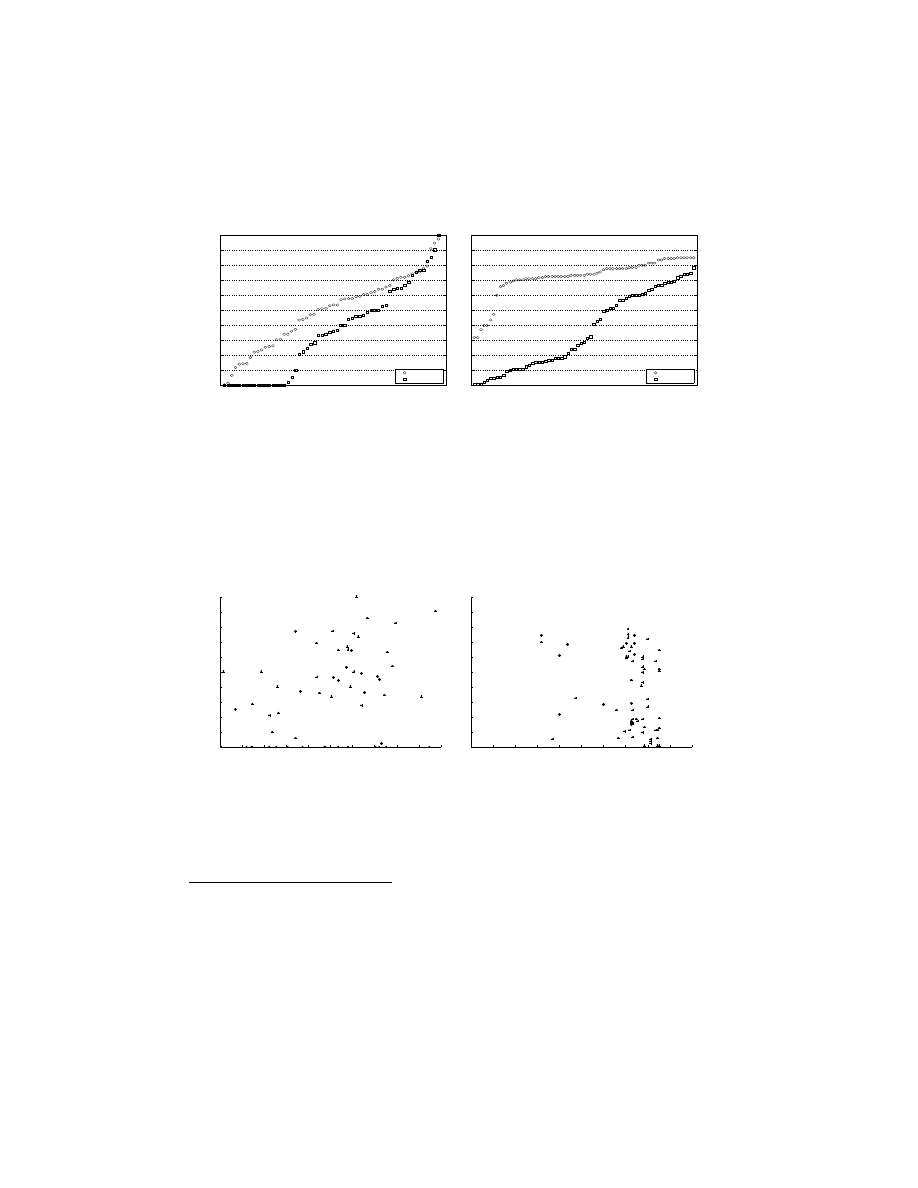
Figure 7 Win rates of trainer and trainee populations. The horizontal lines denote bound-
aries for grouping players (according to win rate); the human trainers produce a population
of trainees with a distribution across these groupings fairly similar to their own.
The win rates in the evaluation games for the trainers and trainees are
plotted in gure 7. Here, the players are sorted within each population ac-
cording to their win rate, so the ordering of individuals is dierent within
each trainer and trainee population. The plot demonstrates that a variety of
abilities has been produced.
0
10
20
30
40
50
60
70
80
90
100
0
10
20
30
40
50
60
70
80
90
100
win rate of trainers (%)
win rate of trainees (%)
0
10
20
30
40
50
60
70
80
90
100
0
10
20
30
40
50
60
70
80
90
100
win rate of trainers (%)
win rate of trainees (%)
(a) humans
(b)
gp
s
Figure 8 Win rates of trainers compared to trainees.
An interesting way of examining the trainees is shown in gure 8, where
the win rate of individual trainees is plotted against the win rate of their
corresponding trainers. Notice that the best human trainer has given rise to
the best trainee (see gures 9a and 9b), while the best
gp
trainer has produced
d
i.e. players that choose a move randomly at each time step.
7
the worst trainee (see gures 9c and 9d). A few of the trainees play very poorly.
These are cases where the network either fails to make any turns or makes
turns at every move (in spite of the strategy described in section 4). Also, in
a number of cases, the trainee outperforms its trainer.
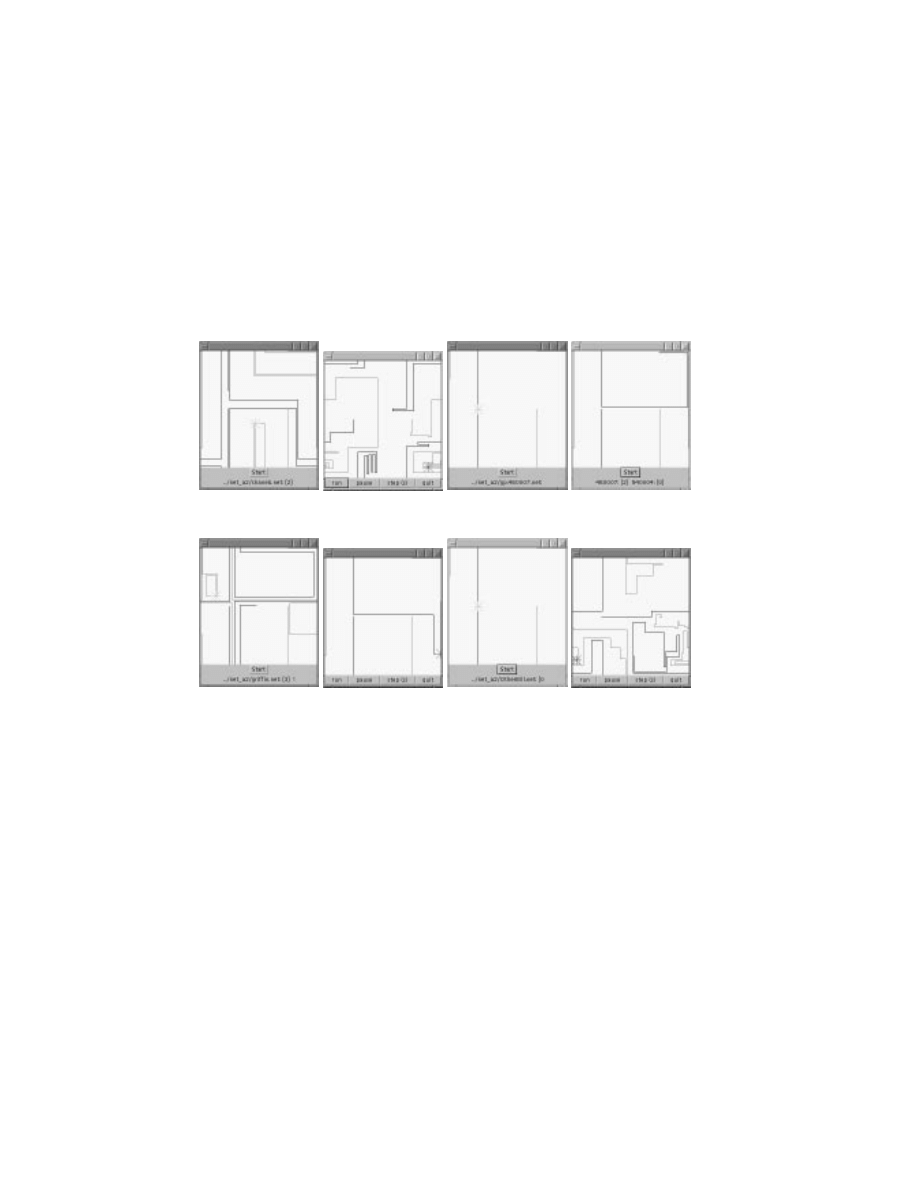
Finally we step away from statistics and highlight some of the trainers and
their trainees by showing selected games against the same opponent. Note two
situations where a trainer that is a bad player produces a trainee that plays
well (gures 9e and 9f), and a trainer that is a good player produces a trainee
that plays poorly (gures 9g and 9h).
(a) trainee
(b) trainer
(c) trainee
(d) trainer
best human trainer is also best trainee
best
gp
trainer is also worst trainee
(e) trainee
(f) trainer
(g) trainee
(h) trainer
bad player can produce good trainee
good player can produce bad trainee
Figure 9 Sample games of individual trainers and trainees. All games are played against
the same
gp
opponent. The player of interest is represented by the solid black line and starts
on the left hand side of the arena.
6 Discussion.
The overwhelming dominance of the
straight
move inherent in the Tron do-
main makes it dicult for most controllers to learn when to turn. Indeed, this
characteristic proved to be extremely challenging, and initially we produced
hundreds of networks that never learned to turn. The evaluation strategy that
8

we settled with (based on the frequency of moves table) has allowed players
to learn eectively. However, we believe that this method works to produce
players that turn only when necessary, and cannot result in more varied be-
haviours such as those illustrated in gures 4d, 9b and 9h. While this precise
evaluation strategy is highly domain dependent, the technique may be quite
valuable for training in domains where one input tends to swamp others and
for learning to generalize human behaviour in more complex domains.
We make several observations about the results we have obtained, specu-
lating on the discrepancies between trainers and trainees and addressing the
issues raised at the beginning of section 5. How can we explain a trainer that
wins 2% of the time, yet produces a trainee that wins 50% of the time (see
gure 8a)? The trainee is not being trained on whether it wins or not | in
fact the trainee doesn't know if it wins at all. The trainee learns only from a
sequence of moves. If the trainer makes nine good moves and then a bad one
ends the game, the trainee has still gained from 90% of this experience.
Does our method produce controllers that can play a decent game of Tron?
Yes { and one conclusion we can draw from our statistics is that a population of
humans can act as eective trainers for a graded population of agents, because
there is naturally more variation in behaviour both across an entire population
of humans and within a single stochastic human player. It is important for
articially trained players to experience a wide variety of behaviours, otherwise
they will not be robust and will only perform well against players with styles
similar to those of their trainers.
Were we able to produce a population that approximates the behaviour
of its trainers? This is a dicult question to answer. While the correlation
between individual
gp
trainers and trainees based on choice of move is much
higher than that for humans, the correlation between win rates of individual
trainers and trainees
e
is better for humans. We speculate that the discrep-
ancies may be due to artifacts of the domain and the nature of each type of
controller. Features that contribute include:
gp
s are deterministic players (vs.
non-deterministic humans), and
gp
s share a limited view of their environment,
using the same sensors that are employed by the trainee networks. The hu-
man players, in contrast, have a global view of the playing arena which is not
practical for articial controllers in this context.
Humans often produce dierent responses when presented with the same
situation multiple times. Clearly then, it is not possible for a deterministic con-
troller to model the behaviour of the humans exactly. Further work is exploring
adding some measure of non-determinism to the controller. Nonetheless, we
propose to take advantage of networks that are able to lter out mistakes that
e
against the same opponent
9

humans make and thus achieve performance superior to that of their trainers
| as was the case for 19 of the 58 human trainees.
Our ultimate goal is to produce a population of graded agents, taking
human behaviour as the basis for constructing the graded population, and then
to select opponents from this population that are appropriate learning partners
for humans at various stages of advancement. The methods demonstrated here,
albeit in a limited domain, represent a rst step in building such a population
of agents.
Acknowledgments.
Support for this work was provided by the Oce of Naval Research under
N00014-98-1-0435 and by a University of Queensland Postdoctoral Fellowship.
References.
1. Cypher, A., Eager: Programming Repetitive Tasks by Example,
Proceedings
of CHI'91
(1991).
2. Funes,P., Sklar,E., Juille,H. & Pollack,J., Animal-Animat Coevolution: Using
the Animal Population as Fitness Function,
Proceedings of SAB'98
(1998).
3. Hinton,G., Connectionist learning procedures,
Articial Intelligence 40
(1989).
4. Koza,J., Genetic Programming: On the Programming of Computers by Means
of Natural Selection, (MIT Press, 1992).
5. Maes,P., Agents That Reduce Work and Information Overload,
Communica-
tions of the ACM 35(7)
(1994).
6. Pomerleau,D., Neural Network Perception for Mobile Robot Guidance (Kluwer
Academic, 1993).
7. Rumelhart,D., G.Hinton & R.Williams, Learning representations by back-
propagating errors,
Nature 323
(1986).
8. Sklar,E., Agents for Education: Bringing Adaptive Behavior to an Internet
Learning Community,
Dissertation Proposal
, Brandeis University, (1999).
9. Tesauro,G., Practical issues in temporal dierence learning,
Machine Learn-
ing 8
(1992).
10. Wyeth,G., Training a Vision Guided Robot,
Machine Learning 31
(1998).
10
Wyszukiwarka
Podobne podstrony:
SCHOOL PARTNERSHIPS ON THE WEB USING THE INTERNET TO FACILITATE SCHOOL COLLABORATION by Jarek Krajk
Plants Communicate Using An Internet Of Fungus
Detecting Internet Worms Using Data Mining Techniques
3 Data Plotting Using Tables to Post Process Results
international human rights movie
CQC Training Using IDPA System
Getting Started with Data Warehouse and Business Intelligence
Frédéric Mégret The Nature of International Human Rights Obligations
3 Data Plotting Using Tables to Post Process Results
Using NLP on Yourself 06 Quieting A Negative Internal Voice
25 Intelligent cryptographic data bank
DoD Counterintelligence and Human Intelligence
Simulation of Packet Data Networks Using OPNET
Full Potential Training Using Heart Rate
Internet Security Using Namecoin and MinimaLT
więcej podobnych podstron