Leadership TPC-H Benchmark
™
Performance & Price/Performance
using Red Hat Enterprise Linux 6
Non-Clustered TPC-H
Benchmark
™
VectorWise Database
Red Hat Enterprise Linux 6
Intel Xeon based Server
Version 5.0
June 2012

www.redhat.com 2
Leadership TPC-
H Benchmark™
Performance & Price/Performance
using Red Hat Enterprise Linux 6
1801 Varsity Drive
Raleigh NC 27606-2072 USA
Phone: +1 919 754 3700
Phone: 888 733 4281
Fax: +1 919 754 3701
PO Box 13588
Research Triangle Park NC 27709 USA
The following terms used in this publication are trademarks of other companies as follows:
TPC Benchmark,TPC-H, QphH and $/QphH are trademarks of the Transaction Processing
Performance Council (TPC).
Red Hat, Red Hat Enterprise Linux and the Red Hat "Shadowman" logo are registered trademarks of
Red Hat, Inc. in the United States and other countries
All other trademarks referenced herein are the property of their respective owners.
© 2012 by Red Hat, Inc. This material may be distributed only subject to the terms and conditions set
forth in the Open Publication License, V1.0 or later (the latest version is presently available at
http://www.opencontent.org/openpub/
The information contained herein is subject to change without notice. Red Hat, Inc. shall not be liable
for technical or editorial errors or omissions contained herein.
Distribution of modified versions of this document is prohibited without the explicit permission of Red
Hat Inc.
Distribution of this work or derivative of this work in any standard (paper) book form for commercial
purposes is prohibited unless prior permission is obtained from Red Hat Inc.
The GPG fingerprint of the
CA 20 86 86 2B D6 9D FC 65 F6 EC C4 21 91 80 CD DB 42 A6 0E

3 www.redhat.com
Table of Contents
2. Overview of the TPC Benchmark H: The Decision Support Benchmark ............................... 5

www.redhat.com 4
1. Executive Summary
The recently published TPC-H benchmark results using a VectorWise database provide Red
Hat Enterprise Linux 6 with leadership performance and price/performance in the following
non-clustered TPC-H scale factor categories:
1. 100 GB
2. 300 GB
3. 1 TB
The results presented in Tables 1 through 6 and Figures 3 through 8 may be found at
. All results and claims are as of June 5
th
, 2012.
Leadership TPC-H Performance using Red Hat Enterprise Linux (RHEL) as of June 5
th
,
2012:
top 4 non-clustered 100GB performance results,
the top 3 non-clustered 300GB performance results, and
the top 2 non-clustered 1,000GB performance result
http://www.tpc.org/tpch/results/tpch_perf_results.asp?resulttype=noncluster
Leadership TPC-H Price/Performance using Red Hat Enterprise Linux (RHEL) as of June 5
th
,
2012:
top 4 non-clustered 100GB price/performance results,
the top 3 non-clustered 300GB price/performance results, and
the top 2 non-clustered 1,000GB price/performance result
http://www.tpc.org/tpch/results/tpch_price_perf_results.asp?resulttype=noncluster
As described in the rest of this paper, RHEL is the best platform for running Decision
Support applications from a performance as well as a price/performance perspective.

5 www.redhat.com
2. Overview of the TPC Benchmark H: The Decision
Support Benchmark
The TPC Benchmark
™
H (TPC-H) is a decision support benchmark. It consists of a suite of
business oriented ad-hoc queries and concurrent data modifications. The queries and the
data populating the database have been chosen to have broad industry-wide relevance while
maintaining a sufficient degree of ease of implementation. This benchmark illustrates decision
support systems that
Examine large volumes of data;
Execute queries with a high degree of complexity;
Give answers to critical business questions.
TPC-H evaluates the performance of various decision support systems by the execution of
sets of queries against a standard database under controlled conditions. The TPC-H queries:
Give answers to real-world business questions;
Simulate generated ad-hoc queries(e.g., via a point and click GUI interface);
Are far more complex than most OLTP transactions;
Include a rich breadth of operators and selectivity constraints;
Generate intensive activity on the part of the database server component of the system
under test;
Are executed against a database complying to specific population and scaling
requirements;
Are implemented with constraints derived from staying closely synchronized with an
on-line production database.
TPC-H operations are modeled as follows:
The database is continuously available 24 hours a day, 7 days a week, for ad-hoc
queries from multiple end users and updates against all tables, except possibly during
infrequent (e.g., once a month) maintenance sessions;
The TPC-H database tracks, possibly with some delay, the state of the OLTP database
through on-going updates which batch together a number of modifications impacting
some part of the decision support database;
Due to the world-wide nature of the business data stored in the TPC-H database, the
queries and the updates may be executed against the database at any time, especially
in relation to each other. In addition, this mix of queries and updates is subject to
specific ACID (Atomicity, Consistency, Isolation, Durability) requirements, since
queries and updates may execute concurrently;

www.redhat.com 6
To achieve the optimal compromise between performance and operational
requirements the database administrator can set, once and for all, the locking levels
and the concurrent scheduling rules for queries and updates.
The minimum database required to run the benchmark holds business data from
10,000 suppliers. It contains almost ten million rows representing a raw storage
capacity of about 1 GB. Compliant benchmark implementations may also use one of
the larger permissible database populations (e.g. 1000 GB).
The performance metrics reported by TPC-H measure multiple aspects of the
capability of the system to process queries. The TPC-H metric at the selected size
(QphH@Size) is the performance metric. To be compliant with the TPC-H standard, all
references to TPC-H results for a given configuration must include all required
reporting components. The TPC believes that comparisons of TPC-H results measured
against different database sizes are misleading and discourages such comparisons.
The TPC-H database must be implemented using a commercially available database
management system (DBMS), and the queries executed via an interface using
dynamic SQL. The specification provides for variants of SQL, as implementers are not
required to have implemented a specific SQL standard in full. TPC-D uses terminology
and metrics that are similar to other benchmarks, originated by the TPC and others.
Such similarity in terminology does not in any way imply that TPC-H results are
comparable to other benchmarks. The only benchmark results comparable to TPC-H
are other TPC-H results compliant with the same revision.
Despite the fact that this benchmark offers a rich environment representative of many
decision support systems, this benchmark does not reflect the entire range of decision
support requirements. In addition, the extent to which a customer can achieve the
results reported by a vendor is highly dependent on how closely TPC-H approximates
the customer application. The relative performance of systems derived from this
benchmark does not necessarily hold for other workloads or environments.
Extrapolations to any other environment are not recommended.
Benchmark results are highly dependent upon workload, specific application
requirements, and systems design and implementation. Relative system performance
will vary as a result of these and other factors. Therefore, TPC-H should not be used
as a substitute for a specific customer application benchmarking when critical capacity
planning and/or product evaluation decisions are contemplated.
2.1 The TPC-H Business Environment
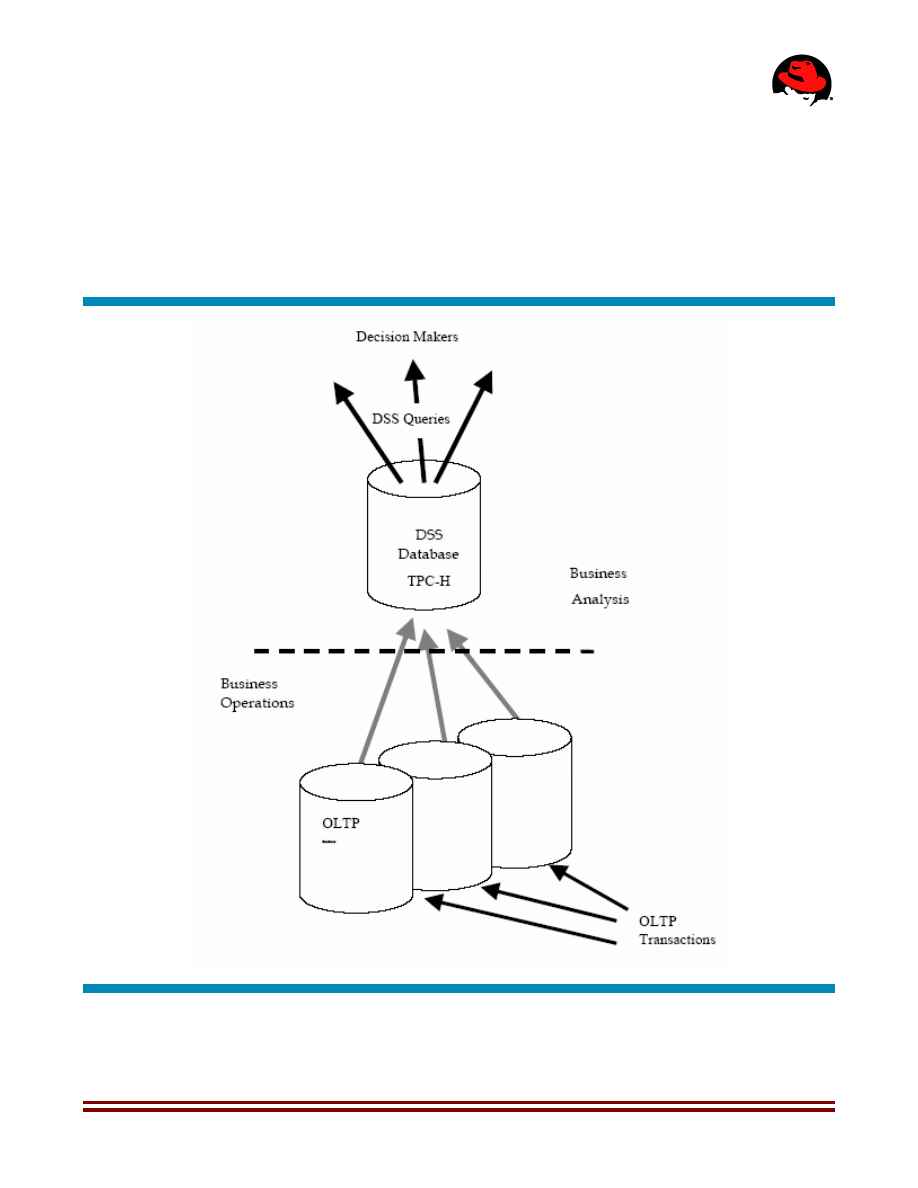
Figure 7 illustrates the TPC-H business environment and highlights the basic differences
between TPC-H and other TPC benchmarks.
7 www.redhat.com
Other TPC benchmarks model the operational end of the business environment where
transactions are executed on a real time basis. The TPC-H benchmark, however, models the
analysis end of the business environment where trends are computed and refined data are
produced to support the making of sound business decisions. In OLTP benchmarks the raw
data flow into the OLTP database from various sources where it is maintained for some
period of time. In TPC-H, periodic refresh functions are performed against a DSS database
whose content is queried on behalf of or by various decision makers.
Figure 1: The TPC-H Business Environment
www.redhat.com 8
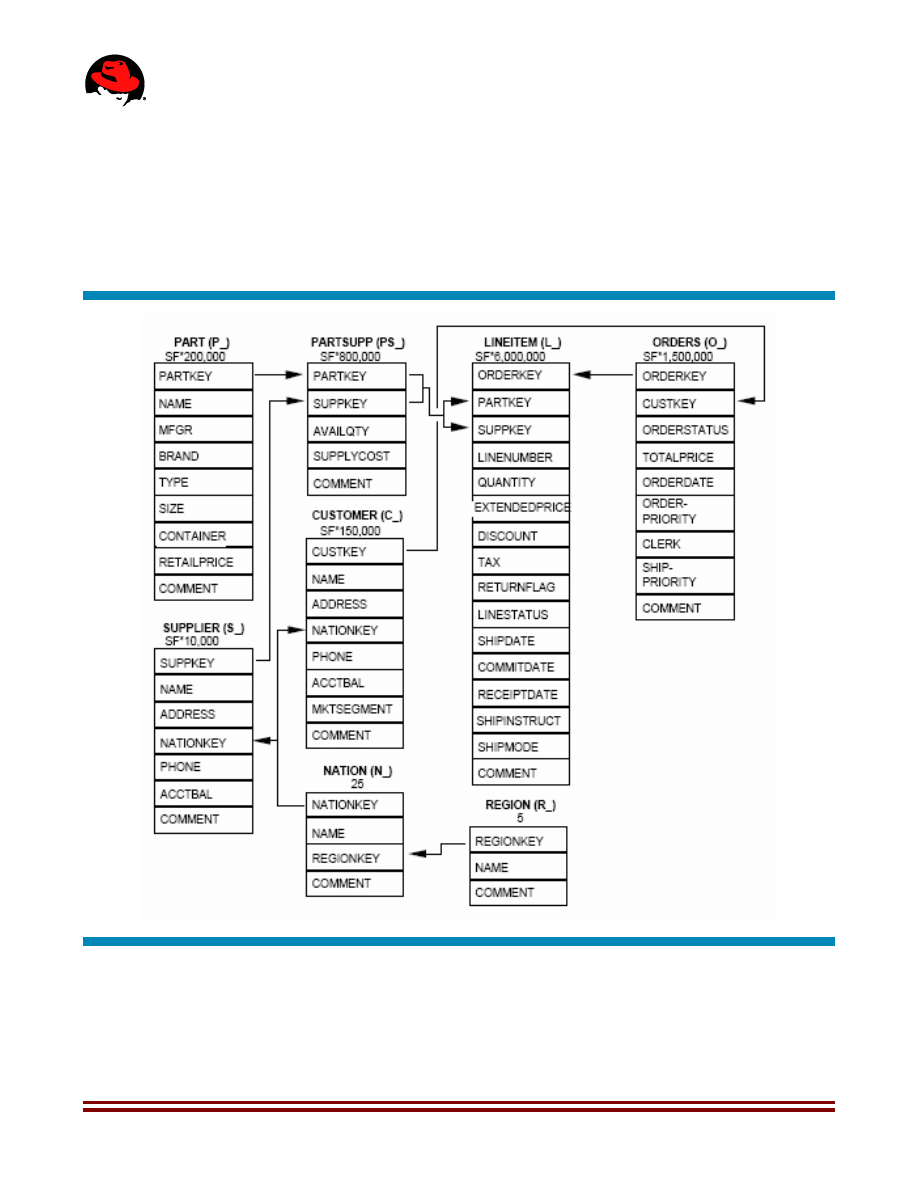
2.2 The TPC-H Schema
The components of the TPC-H database are defined to consist of eight separate and
individual tables (the Base Tables). The relationships between columns of these tables are
illustrated in Figure 8: The TPC-H Schema.
Figure 2: The TPC-H Schema

9 www.redhat.com
2.3 TPC-H Queries
There are 22 TPC-
H ‘Queries’ plus 2 ‘Refresh Functions’:
1. Pricing Summary Report Query (Q1)
This query reports the amount of business that was billed, shipped, and returned.
2. Minimum Cost Supplier Query (Q2)
This query finds which supplier should be selected to place an order for a given part in
a given region.
3. Shipping Priority Query (Q3)
This query retrieves the 10 unshipped orders with the highest value.
4. Order Priority Checking Query (Q4)
This query determines how well the order priority system is working and gives an
assessment of customer satisfac-tion.
5. Local Supplier Volume Query (Q5)
This query lists the revenue volume done through local suppliers.
6. Forecasting Revenue Change Query (Q6)
This query quantifies the amount of revenue increase that would have resulted from
eliminating certain company-wide discounts in a given percentage range in a given
year. Asking this type of "what if" query can be used to look for ways to increase
revenues.
7. Volume Shipping Query (Q7)
This query determines the value of goods shipped between certain nations to help in
the re-negotiation of shipping contracts.
8. National Market Share Query (Q8)
This query determines how the market share of a given nation within a given region
has changed over two years for a given part type.
9. Product Type Profit Measure Query (Q9)
This query determines how much profit is made on a given line of parts, broken out by
supplier nation and year.
10. Returned Item Reporting Query (Q10)
The query identifies customers who might be having problems with the parts that are
shipped to them.
11. Important Stock Identification Query (Q11)
This query finds the most important subset of suppliers' stock in a given nation.

www.redhat.com 10
12. Shipping Modes and Order Priority Query (Q12)
This query determines whether selecting less expensive modes of shipping is
negatively affecting the critical-prior-ity orders by causing more parts to be received by
customers after the committed date.
13. Customer Distribution Query (Q13)
This query seeks relationships between customers and the size of their orders.
14. Promotion Effect Query (Q14)
This query monitors the market response to a promotion such as TV advertisements or
a special campaign.
15. Parts/Supplier Relationship Query (Q16)
This query finds out how many suppliers can supply parts with given attributes. It might
be used, for example, to determine whether there is a sufficient number of suppliers for
heavily ordered parts.
16. Small-Quantity-Order Revenue Query (Q17)
This query determines how much average yearly revenue would be lost if orders were
no longer filled for small quantities of certain parts. This may reduce overhead
expenses by concentrating sales on larger shipments.
17. Large Volume Customer Query (Q18)
The Large Volume Customer Query ranks customers based on their having placed a
large quantity order. Large quantity orders are defined as those orders whose total
quantity is above a certain level.
18. Discounted Revenue Query (Q19)
The Discounted Revenue Query reports the gross discounted revenue attributed to the
sale of selected parts handled in a particular manner. This query is an example of code
such as might be produced programmatically by a data mining tool.
19. Potential Part Promotion Query (Q20)
The Potential Part Promotion Query identifies suppliers in a particular nation having
selected parts that may be can-didates for a promotional offer.
20. Suppliers Who Kept Orders Waiting Query (Q21)
This query identifies certain suppliers who were not able to ship required parts in a
timely manner.
21. Global Sales Opportunity Query (Q22)
The Global Sales Opportunity Query identifies geographies where there are customers
who may be likely to make a purchase.
22. New Sales Refresh Function (RF1)
This refresh function adds new sales information to the database.

11 www.redhat.com
23. Old Sales Refresh Function (RF2)
This refresh function removes old sales information from the database.

www.redhat.com 12
3. TPC-H Methodology & Metrics
TPC-H is a benchmark that simulates a Decision Support System or Business Intelligence
database environment. The performance of a system is measured when the system is tasked
with providing answers for business analyses on a dataset. These analyses include:
Pricing & Promotions Analysis
Supply & Demand Management Analysis
Profit & Revenue Management Analysis
Customer Satisfaction Studies
Market Share Studies
Shipping Management Analysis
The server system runs a read-intensive Decision Support System (DSS) style database to
provide the results for the business analyses. The DSS database is designed to mimic a
repository of commercial order-processing Online Transaction Processing Databases. The
analyses are performed are 100GB, 300GB, 1000GB, 10,000GB, 30,000GB or even
100,000GB scale factor (=size) datasets.
3.1 TPC-H Runs
The business analysis workload of the TPC-
H consists of “ad-hoc” database queries with a
high degree of complexity. The intention is that the exact queries are not known beforehand,
which is often the case for DSS databases.
The TPC-H benchmark runs the business analyses in two different ways
– it performs a
Power Test and a Throughput Test.
3.1.1 TPC-H Power Test
The TPC-H Power Test workload performs significant sequential disk
I/O as the single user’s
queries perform index and table scans over the substantial datasets. The DSS database’s
query optimizer typically splits the query into a number of parts and runs them in parallel,
distributing the data retrieval across the disk arrays attached to the server system. The
workload generally consists of read activity, though there are bursts of database inserts and
updates performed during queries called “refresh functions”, which simulate OLTP databases
periodically feeding data into the DSS system. There is typically a considerable amount of
tempdb activity as the results of complex joins, aggregations and interim results are stored for
the business analyses.
The TPC-H Power Test measures the query execution power of the system when connected
with a single user. It runs the analyses in a serial manner
– the queries and update functions
13 www.redhat.com
run one at a time and the elapsed time is measured. This test yields the TPC-H Power @
Size metric.
3.1.2 TPC-H Throughput Test
The TPC-H Throughput Test is essentially several instances of the Power Test being run
simultaneously using different query parameters. This results in database buffer cache
contention in system memory as the various streams compete for buffer space. The
sequential read activity tends to become more random as the multiple streams access the
disk drives simultaneously. The processors on the system also become busier from running
more processes and switching tasks.
The TPC-H Throughput Test measures the ability of the system to process the most queries
(and update functions) in the least amount of time in a multi-user environment. Each
simulated user runs its own version of the TPC-H Power Test simultaneously. The number of
simulated users for this test is selectable with a mini
mum number of users or “streams”
detailed by the TPC-H specification for each scale factor. This test yields the TPC-H
Throughput @ Size metric.
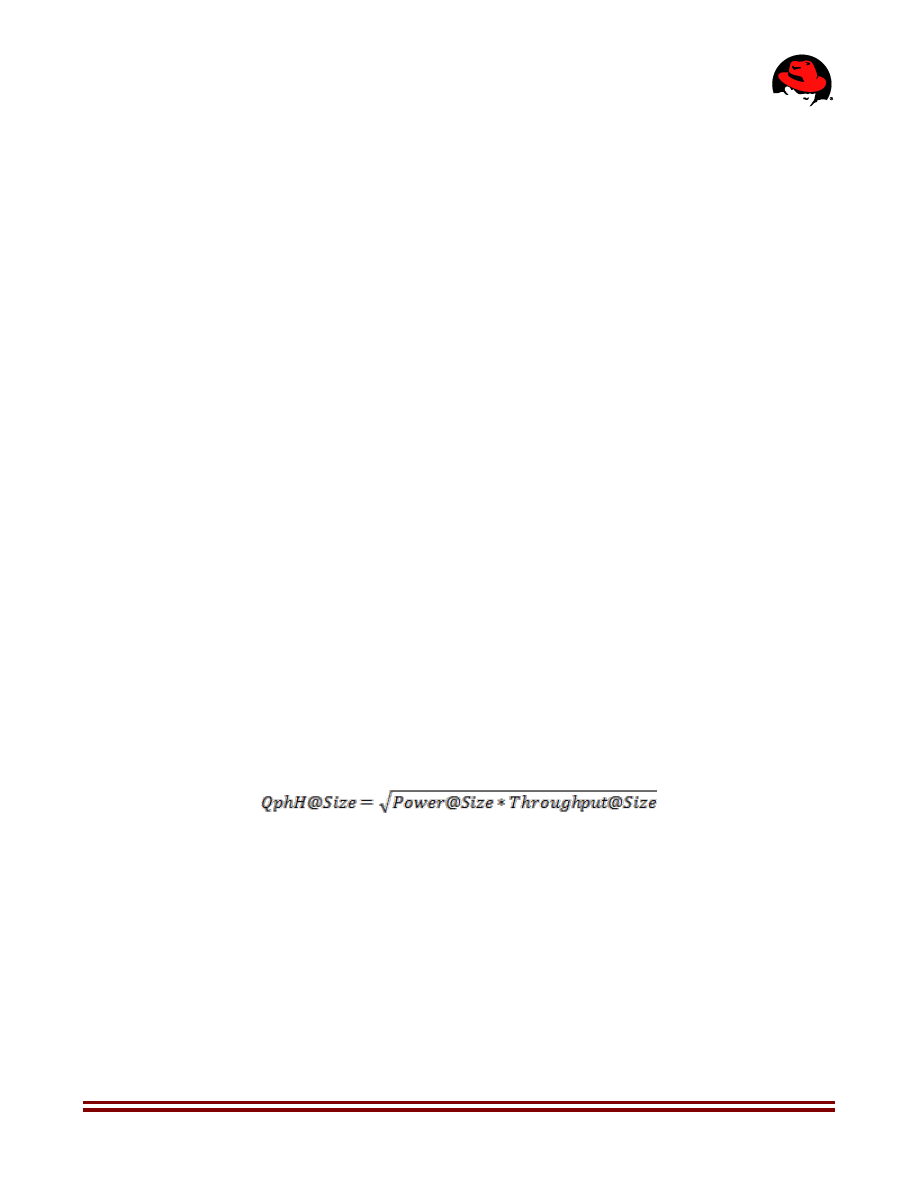
3.2 TPC-H Performance Metric
The primary performance metric for the TPC-H benchmark is the Composite Queries-Per-
Hour (QphH). Composite Queries Per Hour (QphH) is calculated as a geometric mean from
the results from the TPC-H Power Test and the TPC-H Throughput Test. The more QphH, the
better the benchmark result. As per TPC rules, QphH is always represented as TPC-H QphH
@ Size.
3.3 TPC-H Price/Performance Metric
TPC-H also has a pricing component, which is the total cost of the benchmark system
(hardware and software) including 3 years worth of 24x7 4-hour response time support,
divided by the Composite Queries Per Hour (ie price/performance). This is represented as
TPC-H $(currency) / QphH @ Size. The lower the price/performance, the more cost effective
the system.

www.redhat.com 14
3.4 Comparing TPC-H Results
When comparing TPC-H results, be sure to compare results of the same scale factor. For
example, comparing a system that ran 19323QphH@100GB with a system that ran
12,225QphH@300GB is not a fair comparison, whereas comparing a system that ran 102,375
QphH@1TB with a system that ran 81,515 QphH@1TB is.
The overall TPC-H performance of a group of systems may be compared using the
TPC-H Composite Queries-Per-Hour (QphH) metric.
The price/performance of a group of systems may be compared using the $/QphH
metric.
The system power of a single user may be compared using the TPC-H Power metric.
The throughput and ability to process the most queries in the shortest amount of time
may be compared using the TPC-H Throughput metric.
All published TPC-H results are stored on the TPC website at
http://www.tpc.org
. When
making comparisons, it is useful to download the 3-4 page benchmark Executive Summary
rather than try to wade through the more detailed Full Disclosure Report. The Executive
Summary will include the price/performance, QphH, TPC-H Power, and TPC-H Throughput
metrics, along with a full price sheet including all of the hardware and software used in the
benchmark.
15 www.redhat.com
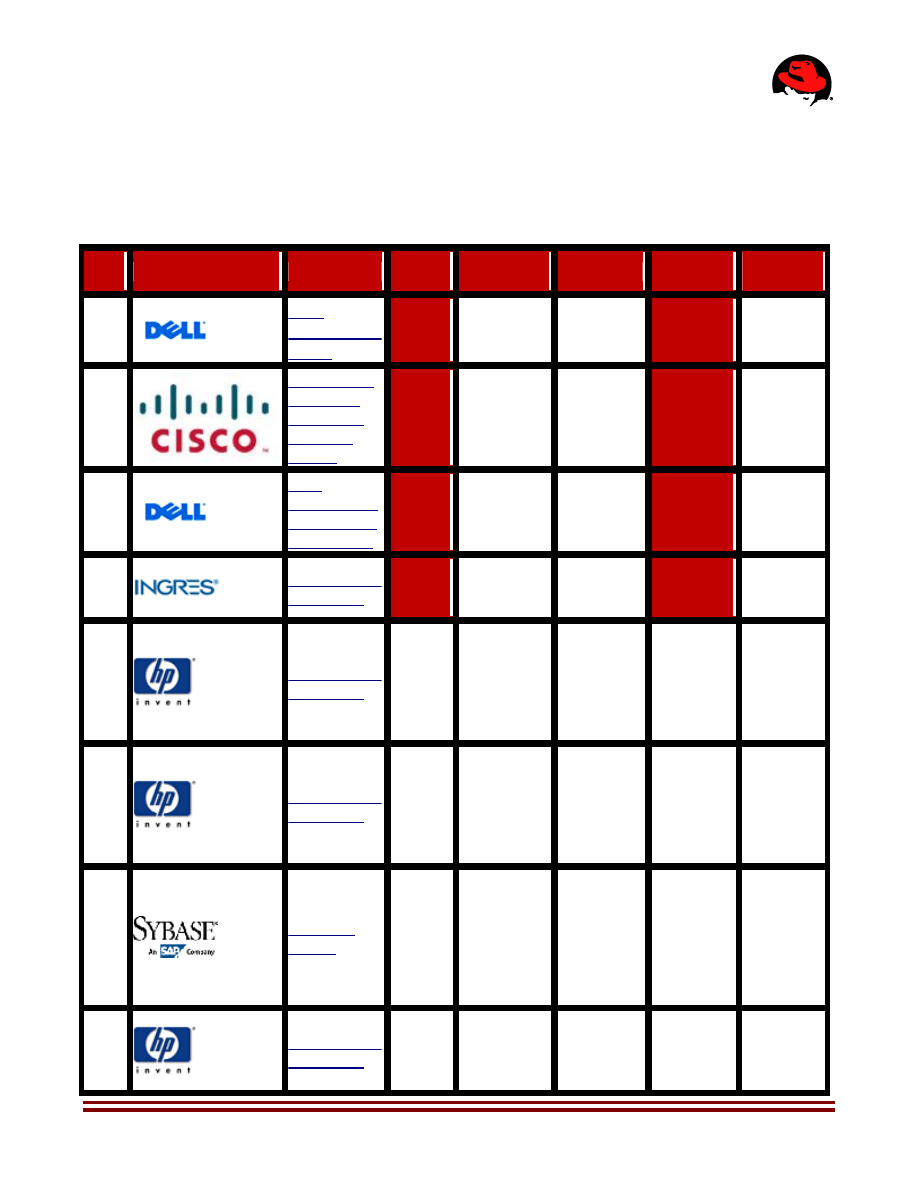
4. RHEL: Top Non-Clustered TPC-H Performance
4.1 100 GB Results
Rank Company
System
QphH
Price/QphH Database
Operating
System
Date
Submitted
1
403,230
.12 USD
VectorWise
2.0.1
RedHat
Enterprise
Linux.6.1
05/13/12
2
Cisco UCS
C250 M2
Extended-
Memory
Server
332,481
.15 USD
VectorWise
2.0.1
RedHat
Enterprise
Linux.6.0
02/14/12
3
Dell
PowerEdge
R610 using
VectorWise
303,289
.16 USD
VectorWise
1.6
RedHat
Enterprise
Linux.6.0
05/23/11
4
251,561
.38 USD
VectorWise
1.5
RedHat
Enterprise
Linux.6.0
02/09/11
5
73,974 .58 USD
Microsoft
SQL
Server
2008 R2
Enterprise
Edition
Microsoft
Windows
Server
2008 R2
Enterprise
Edition
07/02/10
6
71,438 .51 USD
Microsoft
SQL
Server
2008 R2
Enterprise
Edition
Microsoft
Windows
Server
2008 R2
Enterprise
Edition
07/14/10
7
53,501 1.14 USD
Sybase IQ
Single
Application
Server
Edition
v.15.1 ESD
#1
Sun
Solaris 10
12/04/09
8
51,422 1.07 USD
Microsoft
SQL
Server
2008
Microsoft
Windows
Server
2008
08/27/09
www.redhat.com 16
Enterprise
x64 Edt
SP1
Enterprise
x64 Edt
SP2
9
51,085 1.09 USD
Microsoft
SQL
Server
2008
Enterprise
x64 Edt
SP1
Microsoft
Windows
Server
2008
Enterprise
x64 Edt
SP2
09/04/09
10
50,738 1.79 USD
Microsoft
SQL
Server
2008
Enterprise
x64 Edt
SP1
Microsoft
Windows
Server
2008
Enterprise
x64 Edt
SP2
10/07/09
Table 1: TPC-H (100GB) Top Ten in Performance
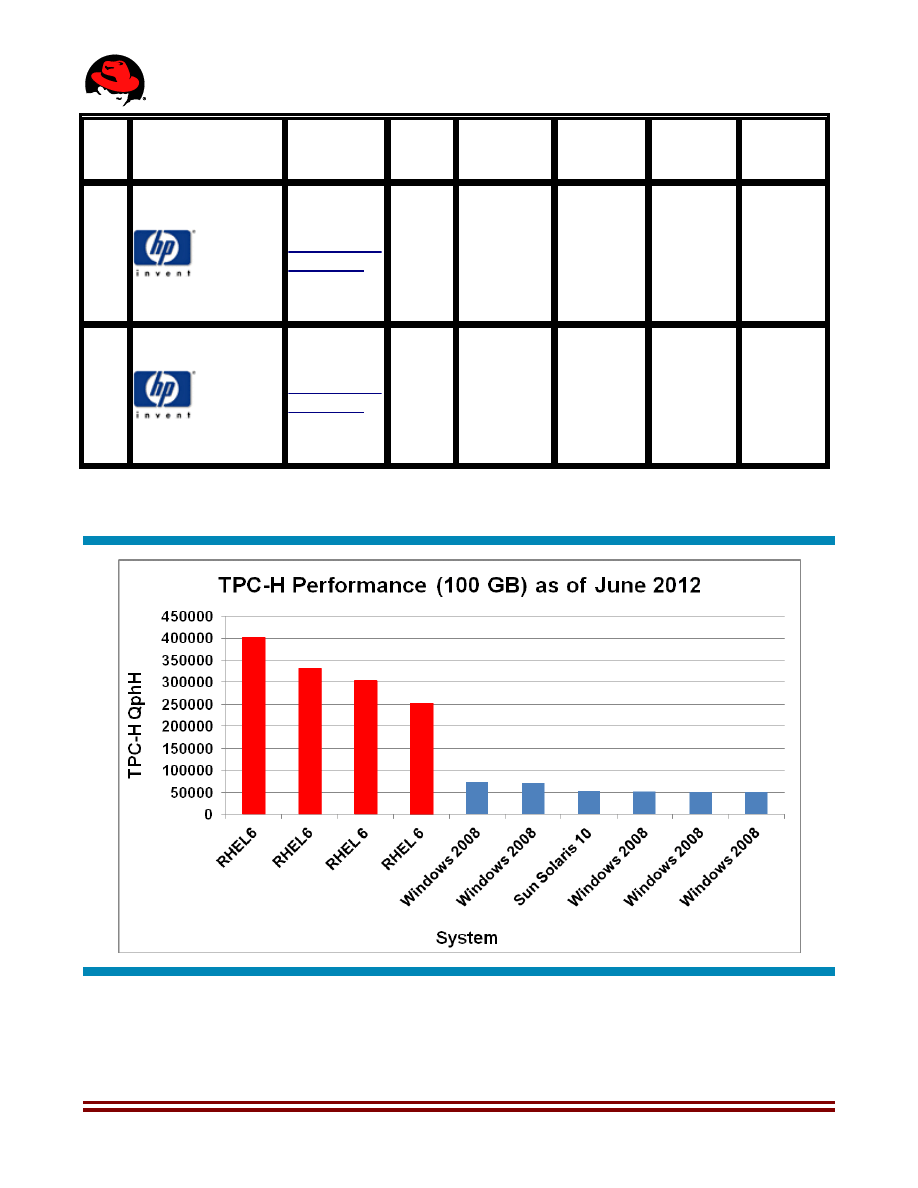
Figure 3: TPC-H (100 GB) Top Ten in Performance
17 www.redhat.com
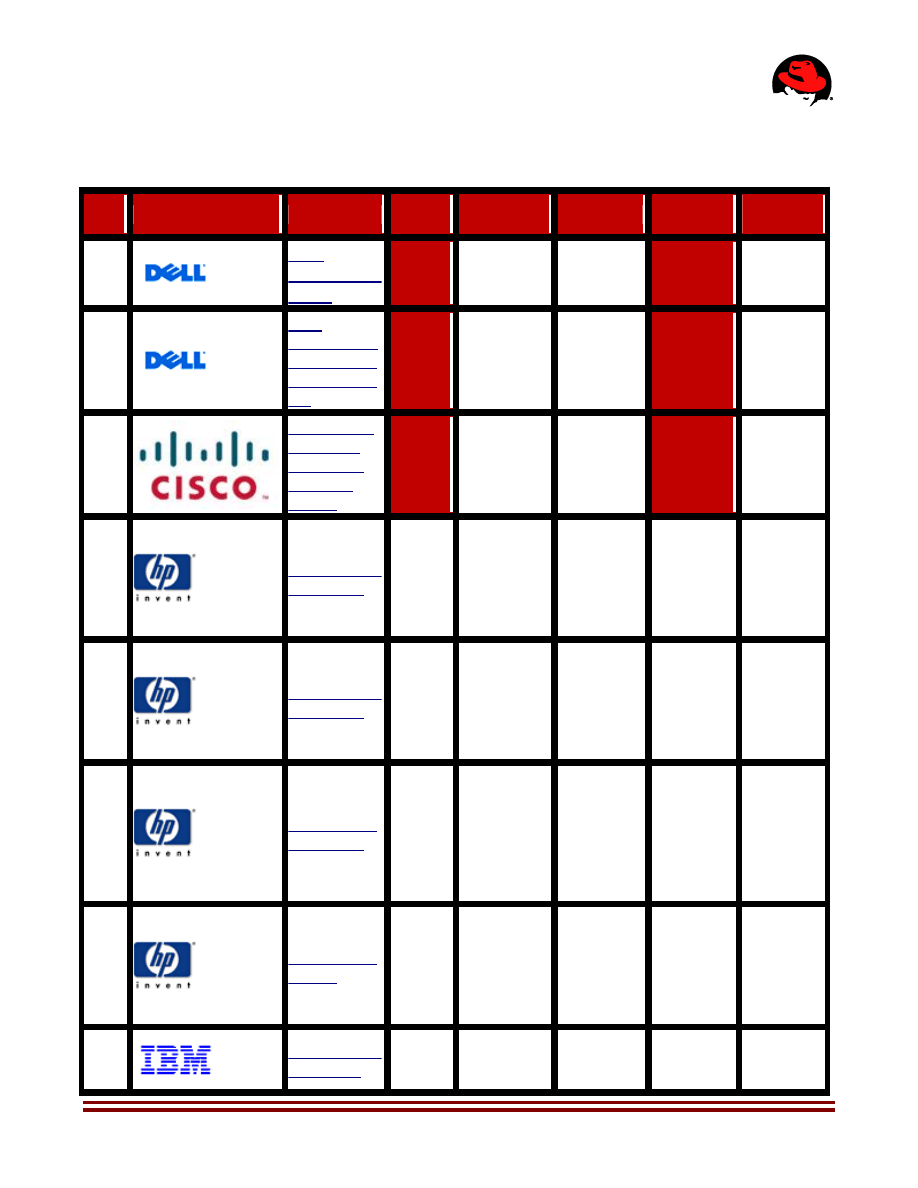
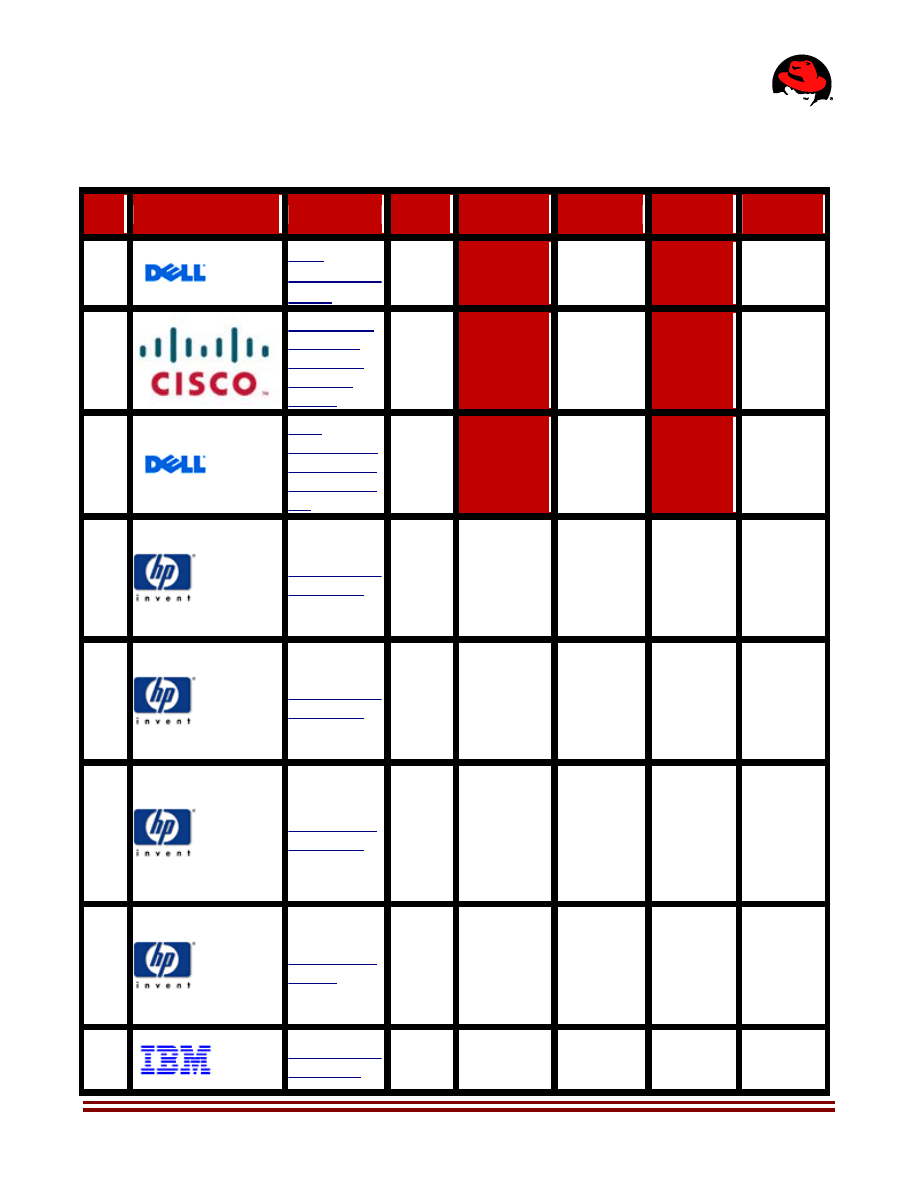
4.2 300 GB Results
Rank Company
System
QphH
Price/QphH Database
Operating
System
Date
Submitted
1
410,594
.28 USD
VectorWise
2.0.1
RedHat
Enterprise
Linux.6.1
05/13/12
2
Dell
PowerEdge
R910 using
VectorWise
1.6
400,931
.35 USD
VectorWise
1.6
RedHat
Enterprise
Linux.6.0
05/03/11
3
Cisco UCS
C250 M2
Extended-
Memory
Server
331,658
.34 USD
VectorWise
RedHat
Enterprise
Linux.6.0
02/13/12
4
121,345 .65 USD
Microsoft
SQL
Server
2008 R2
Enterprise
Edition
Microsoft
Windows
Server
2008 R2
Enterprise
Edition
09/14/10
5
107,561 1.08 USD
Microsoft
SQL
Server
2008 R2
Enterprise
Edition
Microsoft
Windows
Server
2008 R2
Enterprise
Edition
06/21/10
6
91,558 1.94 USD
Microsoft
SQL
Server
2008
Enterprise
x64 Edt
SP1
Microsoft
Windows
Server
2008
Enterprise
x64 Edt
SP1
07/31/09
7
57,684 3.24 USD
Microsoft
SQL
Server
2008
Enterprise
x64 Edition
Microsoft
Windows
Server
2008
Enterprise
x64 Edition
11/17/08
8
46,034 5.40 USD
Microsoft
SQL
Server
Microsoft
Windows
Server
11/28/07
www.redhat.com 18
2005
Enterprise
Edt (x64)
2003
Enterprise
x64 Ent.
R2
9
18,298 13.67 USD
Microsoft
SQL
Server
2005
Enterprise
Edt (x64)
Microsoft
Windows
Server
2003
Enterprise
x64 Edition
10/31/06
10
12,225 11.71 USD
Microsoft
SQL
Server
2005
Enterprise
Edt (x64)
Microsoft
Windows
Server
2003
Enterprise
x64 Edition
01/26/06
Table 2: TPC-H (300GB) Top Ten in Performance
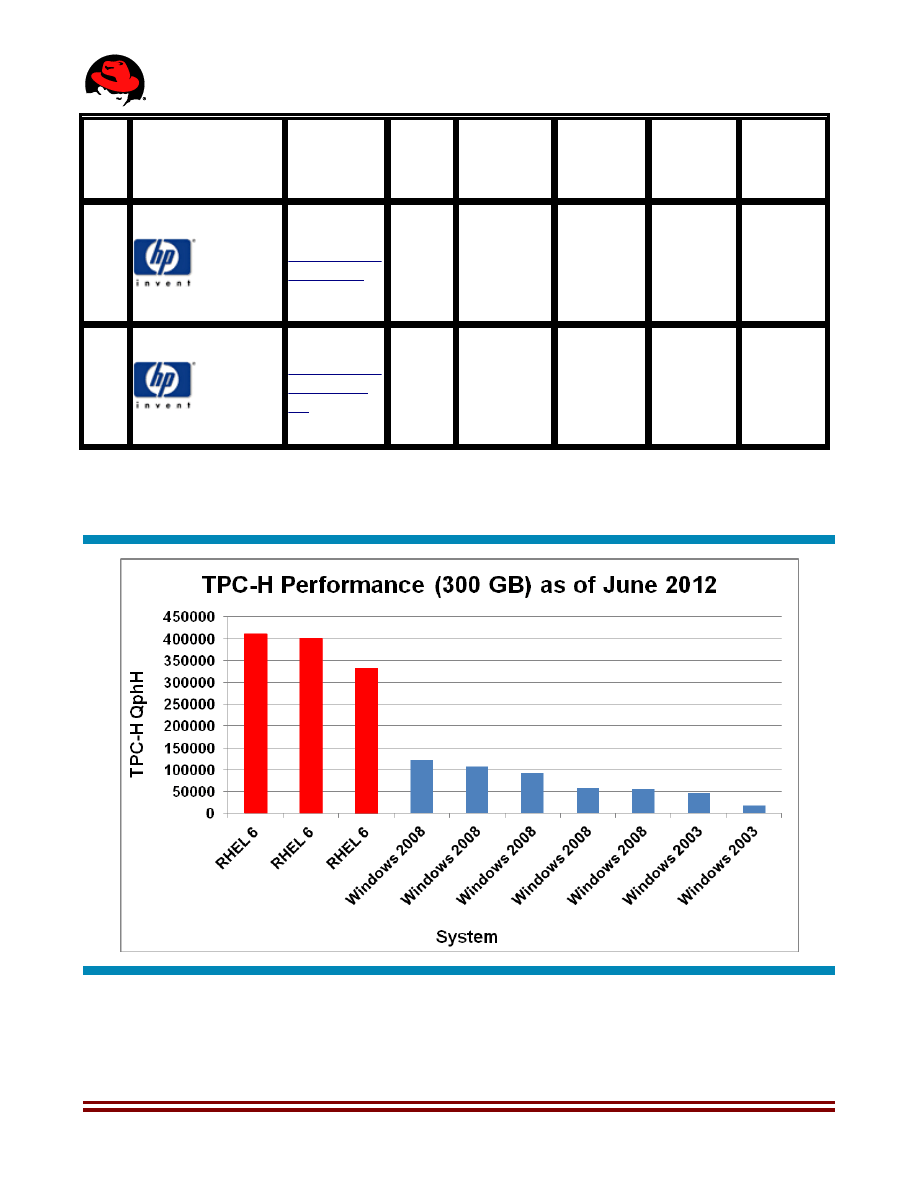
Figure 4: TPC-H (300 GB) Top Ten in Performance
19 www.redhat.com
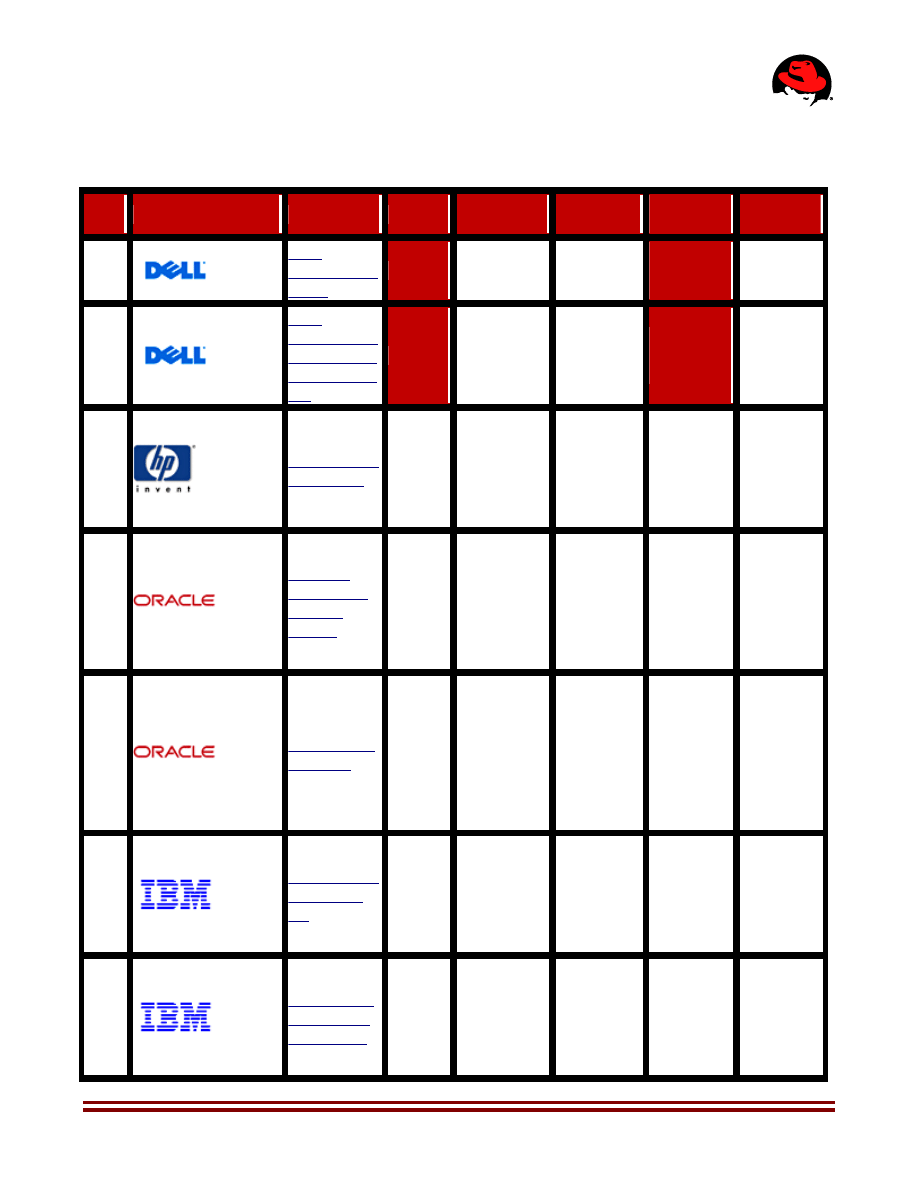
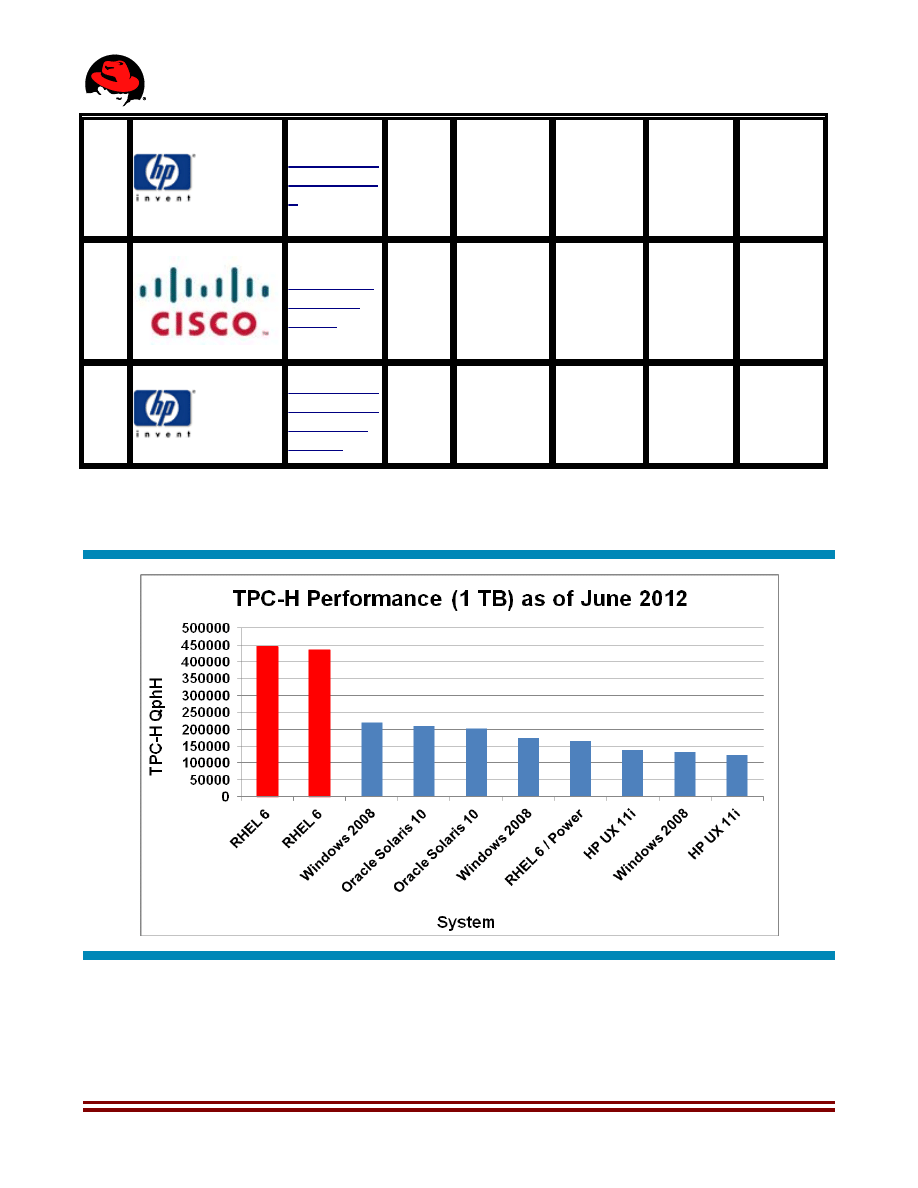
4.3 1,000 GB Results
Rank Company
System
QphH
Price/QphH Database
Operating
System
Date
Submitted
1
445,529
.75 USD
VectorWise
2.0.1
RedHat
Enterprise
Linux.6.1
06/01/12
2
Dell
PowerEdge
R910 using
VectorWise
1.6
436,788
.88 USD
VectorWise
1.6
RedHat
Enterprise
Linux.6.0
05/03/11
3
219,887 1.86 USD
Microsoft
SQL
Server
2008 R2
Enterprise
Edition
Microsoft
Windows
Server
2008 R2
Enterprise
Edition
08/30/11
4
209,533 9.53 USD
Oracle
Database
11g R2
Enterprise
Edition
with
Partitioning
Oracle
Solaris 10
06/03/11
5
201,487 4.60 USD
Oracle
Database
11g
Release 2
Enterprise
Edition
with
Partitioning
Oracle
Solaris 10
8/11
09/26/11
6
173,961 1.37 USD
Microsoft
SQL
Server
2008 R2
Enterprise
Edition
Microsoft
Windows
Server
2008 R2
Enterprise
Edition
04/05/11
7
164,747 6.85 USD
Sybase IQ
Single
Application
Server
v.15.2
ESD#2
Red Hat
Enterprise
Linux 6 for
Power
12/15/10
www.redhat.com 20
8
140,181 12.15 USD
Oracle
Database
11g
Release 2
Enterprise
Edt.
HP-UX 11i
v3
04/26/10
9
134,117 1.30 USD
Microsoft
SQL
Server
2008 R2
Enterprise
Edition
Microsoft
Windows
Server
2008 R2
Enterprise
Edition
12/07/11
10
HP Integrity
Superdome-
Dual-Core
Itanium
123,323 20.54 USD
Oracle
Database
11g
Enterprise
Edition
HP-UX
11.i v3 64
bit
04/29/09
Table 3: TPC-H (1,000GB) Top Ten in Performance
Figure 5: TPC-H (1,000 GB) Top Ten in Performance
21 www.redhat.com
5. RHEL: Top TPC-H Non-Clustered
Price/Performance
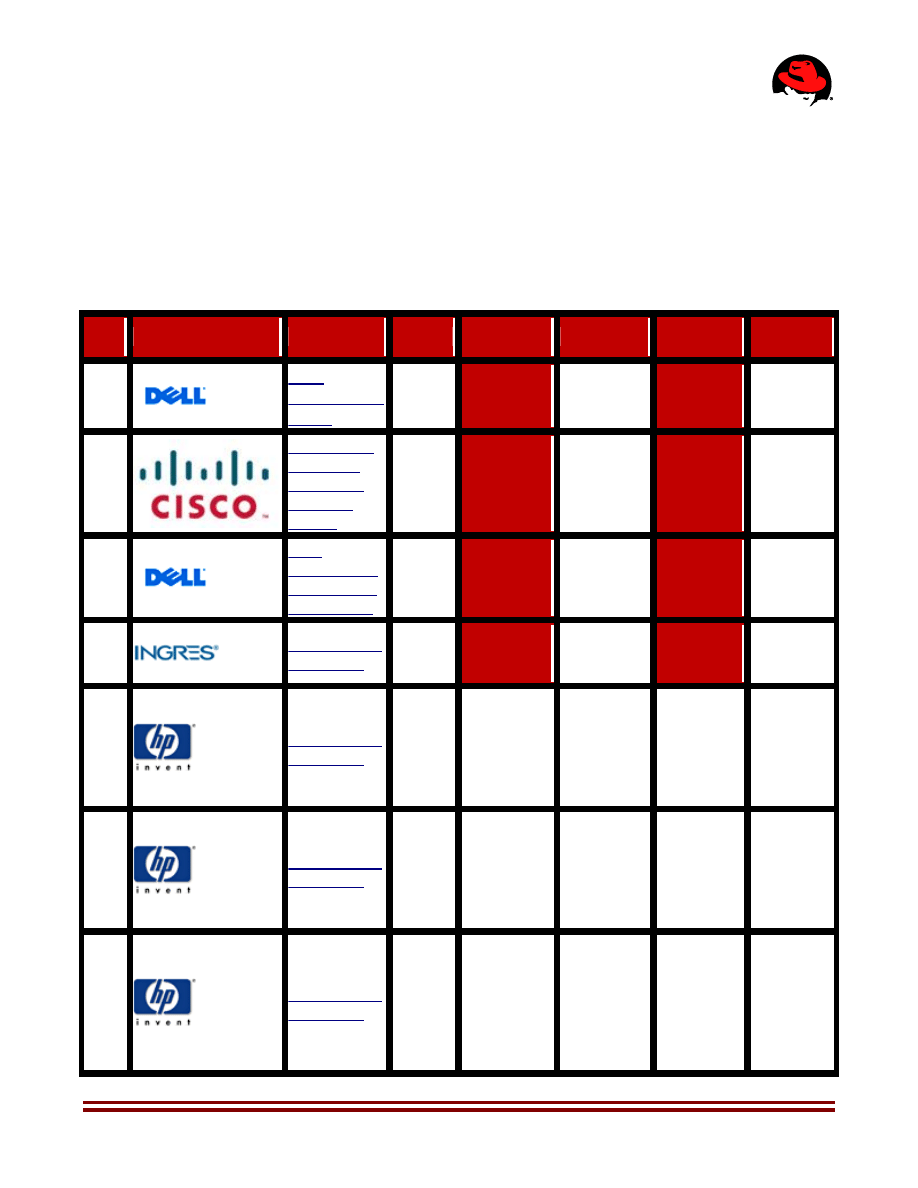
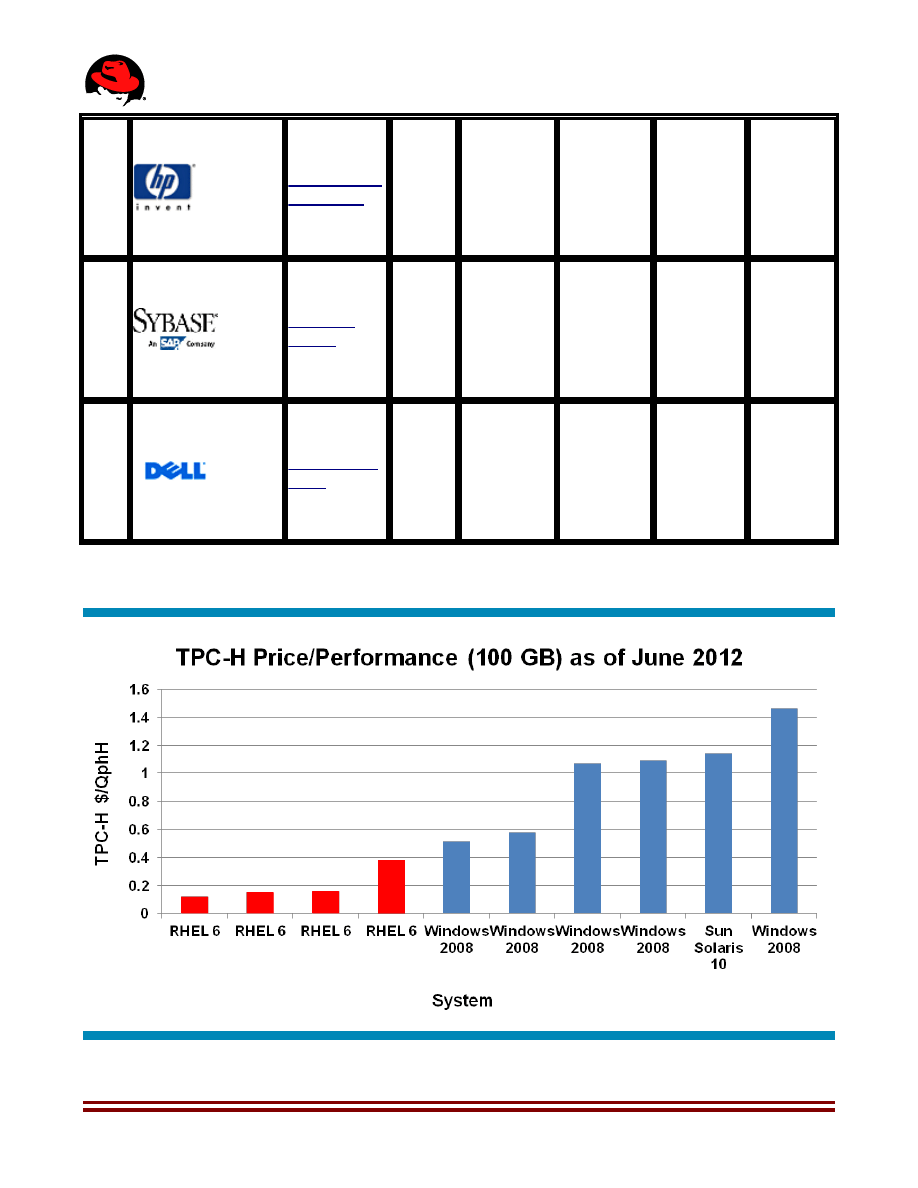
5.1 100 GB Results
Rank Company
System
QphH
Price/QphH Database
Operating
System
Date
Submitted
1
403,230
.12 USD
VectorWise
2.0.1
RedHat
Enterprise
Linux.6.1
05/13/12
2
Cisco UCS
C250 M2
Extended-
Memory
Server
332,481
0.15 USD
VectorWise
2.0.1
RedHat
Enterprise
Linux.6.0
02/14/12
3
Dell
PowerEdge
R610 using
VectorWise
303,289
0.16 USD
VectorWise
1.6
RedHat
Enterprise
Linux.6.0
05/23/11
4
251,561
0.38 USD
VectorWise
1.5
RedHat
Enterprise
Linux.6.0
02/09/11
5
71,438 0.51 USD
Microsoft
SQL Server
2008 R2
Enterprise
Edition
Microsoft
Windows
Server
2008 R2
Enterprise
Edition
07/14/10
6
73,974 0.58 USD
Microsoft
SQL Server
2008 R2
Enterprise
Edition
Microsoft
Windows
Server
2008 R2
Enterprise
Edition
07/02/10
7
51,422 1.07 USD
Microsoft
SQL Server
2008
Enterprise
x64 Edt
SP1
Microsoft
Windows
Server
2008
Enterprise
x64 Edt
SP2
08/27/09
www.redhat.com 22
8
51,085 1.09 USD
Microsoft
SQL Server
2008
Enterprise
x64 Edt
SP1
Microsoft
Windows
Server
2008
Enterprise
x64 Edt
SP2
09/04/09
9
53,501 1.14 USD
Sybase IQ
Single
Application
Server
Edition
v.15.1 ESD
#1
Sun Solaris
10
12/04/09
10
28,772 1.46 USD
Microsoft
SQL Server
2008
Enterprise
x64 Edt
SP1
Microsoft
Windows
Server
2008
Enterprise
x64 Edt
SP1
06/02/09
Table 4: TPC-H (100GB) Top Ten in Price/Performance
Figure 6: TPC-H (100 GB) Top Ten in Price/Performance
23 www.redhat.com
5.2 300 GB Results
Rank Company
System
QphH
Price/QphH Database
Operating
System
Date
Submitted
1
410,594
.28 USD
VectorWise
2.0.1
RedHat
Enterprise
Linux.6.1
05/13/12
2
Cisco UCS
C250 M2
Extended-
Memory
Server
331,658
0.34 USD
VectorWise
2.0.1
RedHat
Enterprise
Linux.6.0
02/13/12
3
Dell
PowerEdge
R910 using
VectorWise
1.6
400,931
0.35 USD
VectorWise
1.6
RedHat
Enterprise
Linux.6.0
05/03/11
4
121,345 0.65 USD
Microsoft
SQL
Server
2008 R2
Enterprise
Edition
Microsoft
Windows
Server
2008 R2
Enterprise
Edition
09/14/10
5
107,561 1.08 USD
Microsoft
SQL
Server
2008 R2
Enterprise
Edition
Microsoft
Windows
Server
2008 R2
Enterprise
Edition
06/21/10
6
91,558 1.94 USD
Microsoft
SQL
Server
2008
Enterprise
x64 Edt
SP1
Microsoft
Windows
Server
2008
Enterprise
x64 Edt
SP1
07/31/09
7
57,684 3.24 USD
Microsoft
SQL
Server
2008
Enterprise
x64 Edition
Microsoft
Windows
Server
2008
Enterprise
x64 Edition
11/17/08
8
46,034 5.40 USD
Microsoft
SQL
Server
Microsoft
Windows
Server
11/28/07
www.redhat.com 24
2005
Enterprise
Edt (x64)
2003
Enterprise
x64 Ent.
R2
9
12,225 11.71 USD
Microsoft
SQL
Server
2005
Enterprise
Edt (x64)
Microsoft
Windows
Server
2003
Enterprise
x64 Edition
01/26/06
10
18,298 13.67 USD
Microsoft
SQL
Server
2005
Enterprise
Edt (x64)
Microsoft
Windows
Server
2003
Enterprise
x64 Edition
10/31/06
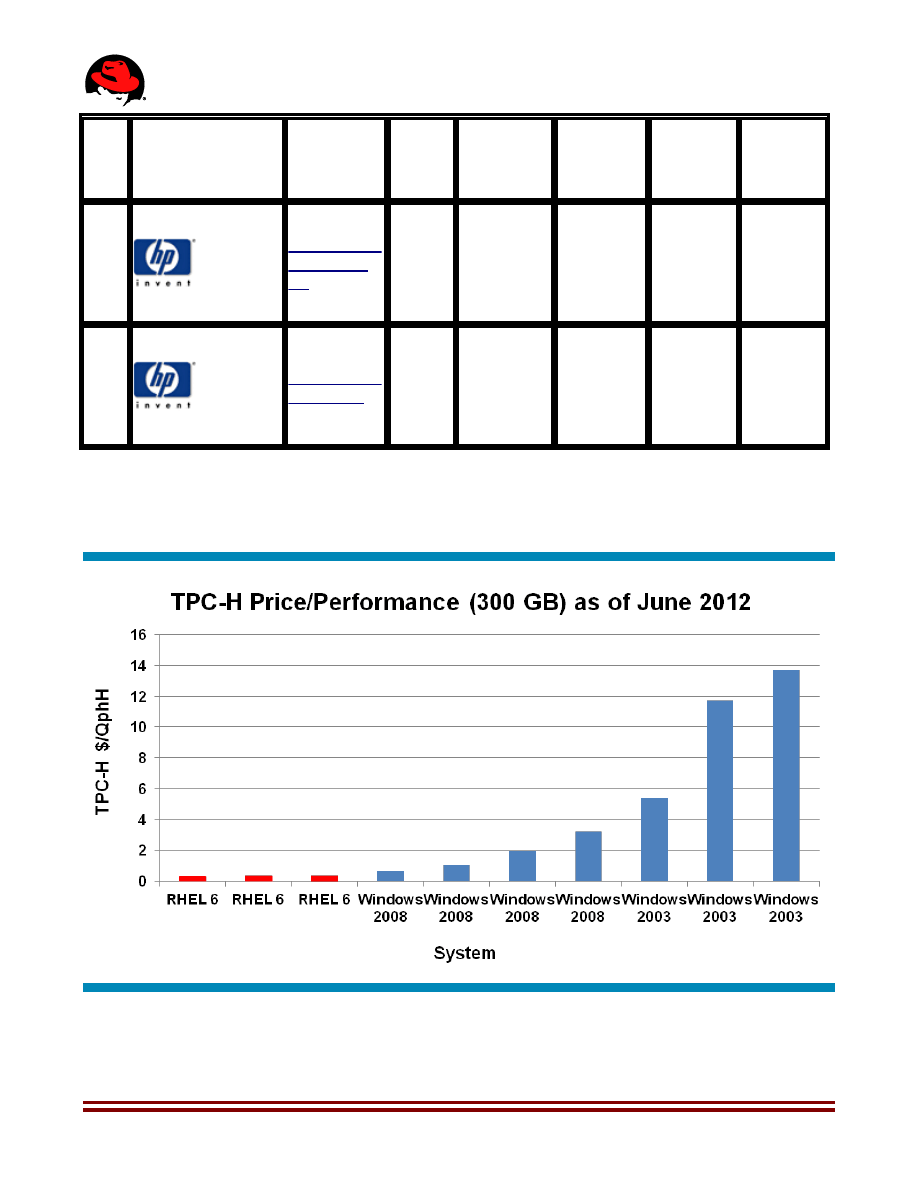
Table 5: TPC-H (300GB) Top Ten in Price/Performance
Figure 7: TPC-H (300 GB) Top Ten in Price/Performance
25 www.redhat.com
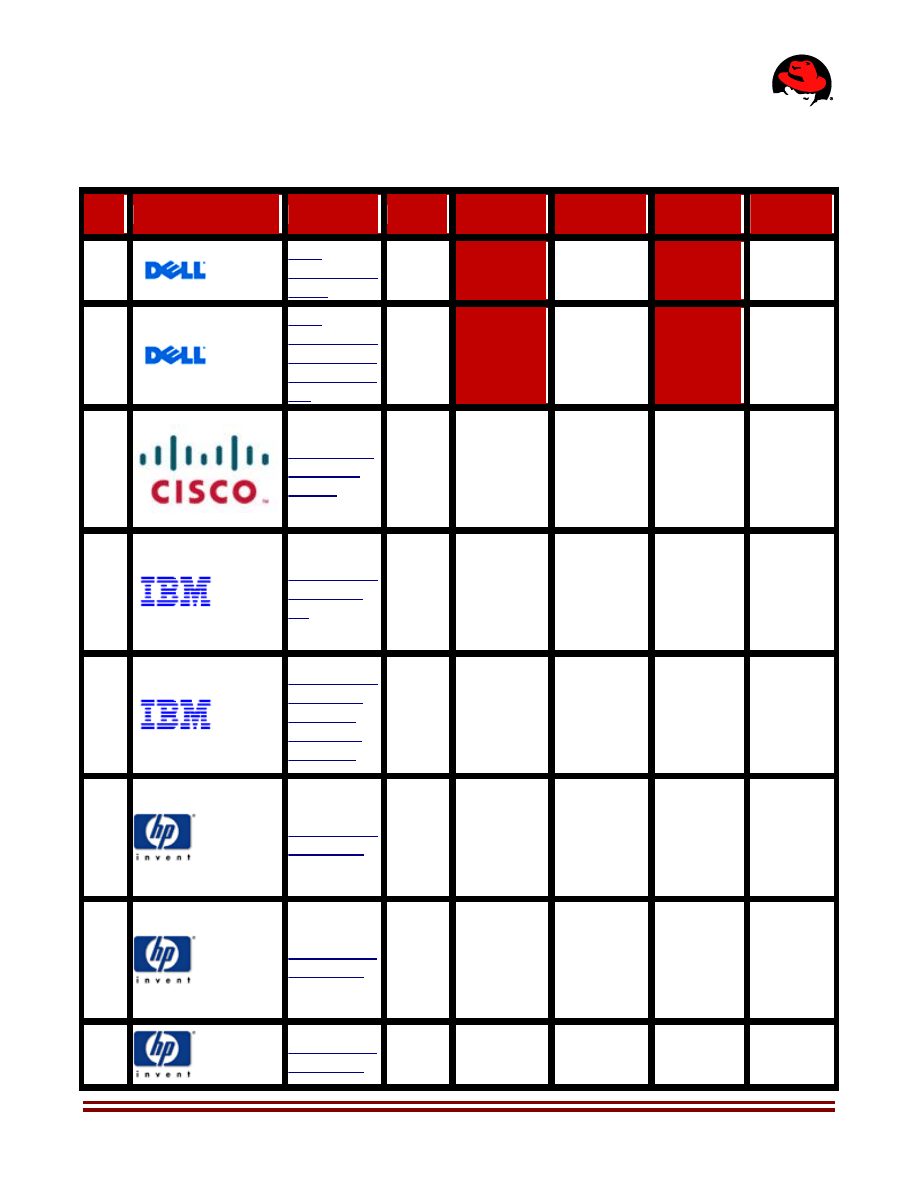
5.3 1,000 GB Results
Rank Company
System
QphH
Price/QphH Database
Operating
System
Date
Submitted
1
445,529
0.75 USD
VectorWise
2.0.1
RedHat
Enterprise
Linux.6.1
06/01/12
2
Dell
PowerEdge
R910 using
VectorWise
1.6
436,788
0.88 USD
VectorWise
1.6
RedHat
Enterprise
Linux.6.0
05/03/11
3
134,117 1.30 USD
Microsoft
SQL Server
2008 R2
Enterprise
Edition
Microsoft
Windows
Server
2008 R2
Enterprise
Edition
12/07/11
4
173,961 1.37 USD
Microsoft
SQL Server
2008 R2
Enterprise
Edition
Microsoft
Windows
Server
2008 R2
Enterprise
Edition
04/05/11
5
IBM System
x3850 X5
with IBM
MAX5 for
System x
101,719 1.76 USD
Microsoft
SQL Server
2008 R2
Enterprise
x64 Edition
Microsoft
Windows
Server
2008
Enterprise
Ed x64 R2
03/03/11
6
219,887 1.86 USD
Microsoft
SQL Server
2008 R2
Enterprise
Edition
Microsoft
Windows
Server
2008 R2
Enterprise
Edition
08/30/11
7
81,514 2.90 USD
Microsoft
SQL Server
2008
Enterprise
Edition
Microsoft
Windows
Server
2008 R2
Enterprise
Edition
11/09/09
8
102,375 3.63 USD
Sybase IQ
Single
Application
Red Hat
Enterprise
Linux 5.3
02/01/10
www.redhat.com 26
Server
Edition
v.15.1 ESD
#1
9
201,487 4.60 USD
Oracle
Database
11g
Release 2
Enterprise
Edition with
Partitioning
Oracle
Solaris 10
8/11
09/26/11
10
164,747 6.85 USD
Sybase IQ
Single
Application
Server
v.15.2
ESD#2
Red Hat
Enterprise
Linux 6 for
Power
12/15/10
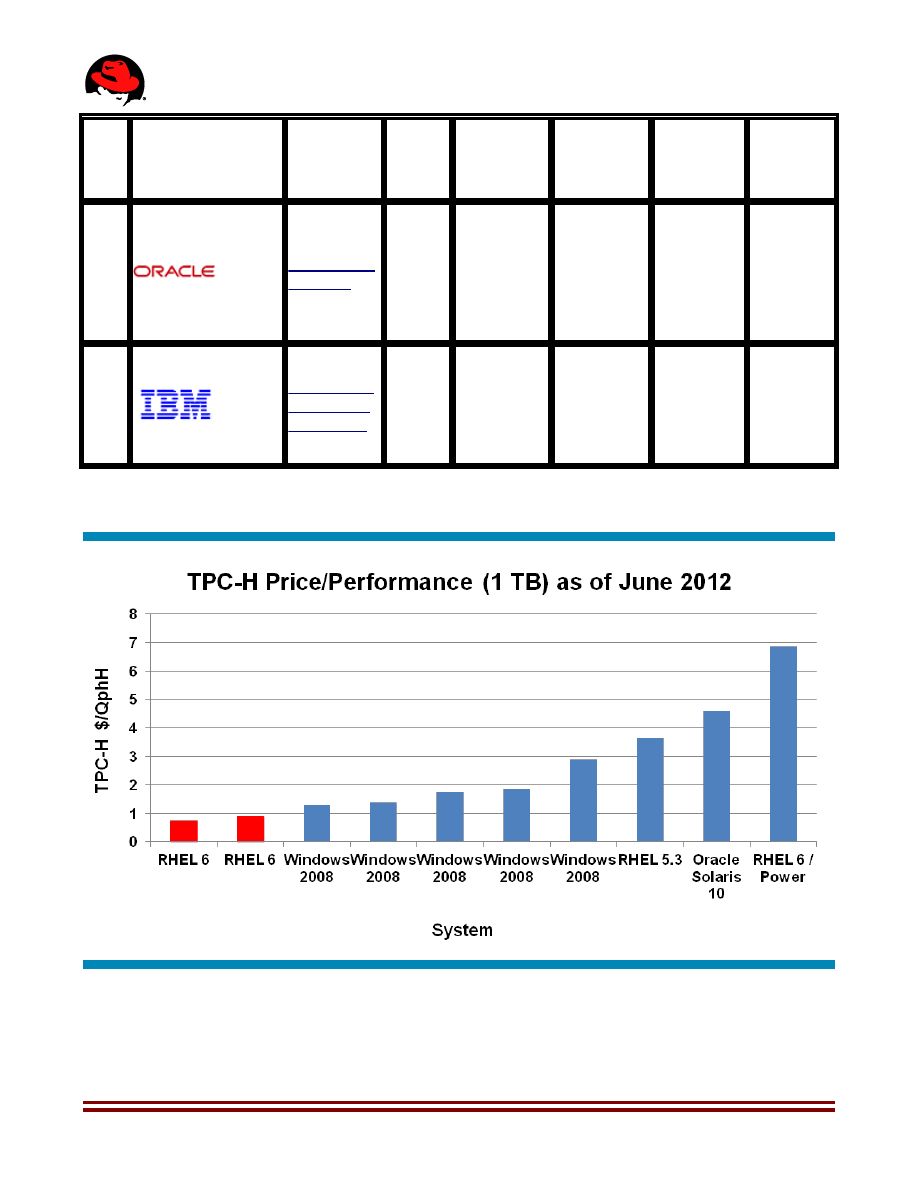
Table 6: TPC-H (1,000GB) Top Ten in Price/Performance
Figure 8: TPC-H (1,000 GB) Top Ten in Price/Performance
27 www.redhat.com
6. 100 GB TPC-H Performance-Leadership Run
6.1 System Configuration
Number of Nodes
1 x Dell PowerEdge R720
Processors/Cores/Threads/Type 2/16/16/Intel Xeon Processor E5-2690 2.90GHz
Memory
192 GB
Disk Controller
PERC H710P integrated RAID controller with 1GB
NVRAM
Disk Drives
16 x 146GB 15K RPM SAS 6G
Total Disk Storage
2.336 TB
LAN Controller
Intel Ethernet I350 QP 1Gb Network Daughter Card
Database
VectorWise 2.0.1
Operating System
RedHat Enterprise Linux 6.1
6.2 Parameter Settings
Settings must be provided for all customer-tunable parameters and options which have been
changed from the defaults found in actual products, including but not limited to:
1. Database Tuning Options
2. Optimizer/Query execution options
3. Query processing tool/language configuration parameters
4. Recovery/commit options
5. Consistency/locking options
6. Operating system and configuration parameters
7. Configuration parameters and options for any other software component incorporated
into the pricing structure
8. Compiler optimization options
The Supporting File Archive contains the Operating System and DBMS parameters used in
this benchmark.
Refer to:
http://www.tpc.org/tpch/results/tpch_result_detail.asp?id=112051301
http://www.tpc.org/results/individual_results/Dell/DELL-R720-TPCH-100GB-051312-ES.pdf
http://www.tpc.org/results/fdr/tpch/DELL-R720-TPCH-100GB-051312-FDR.pdf
for detailed settings.
www.redhat.com 28
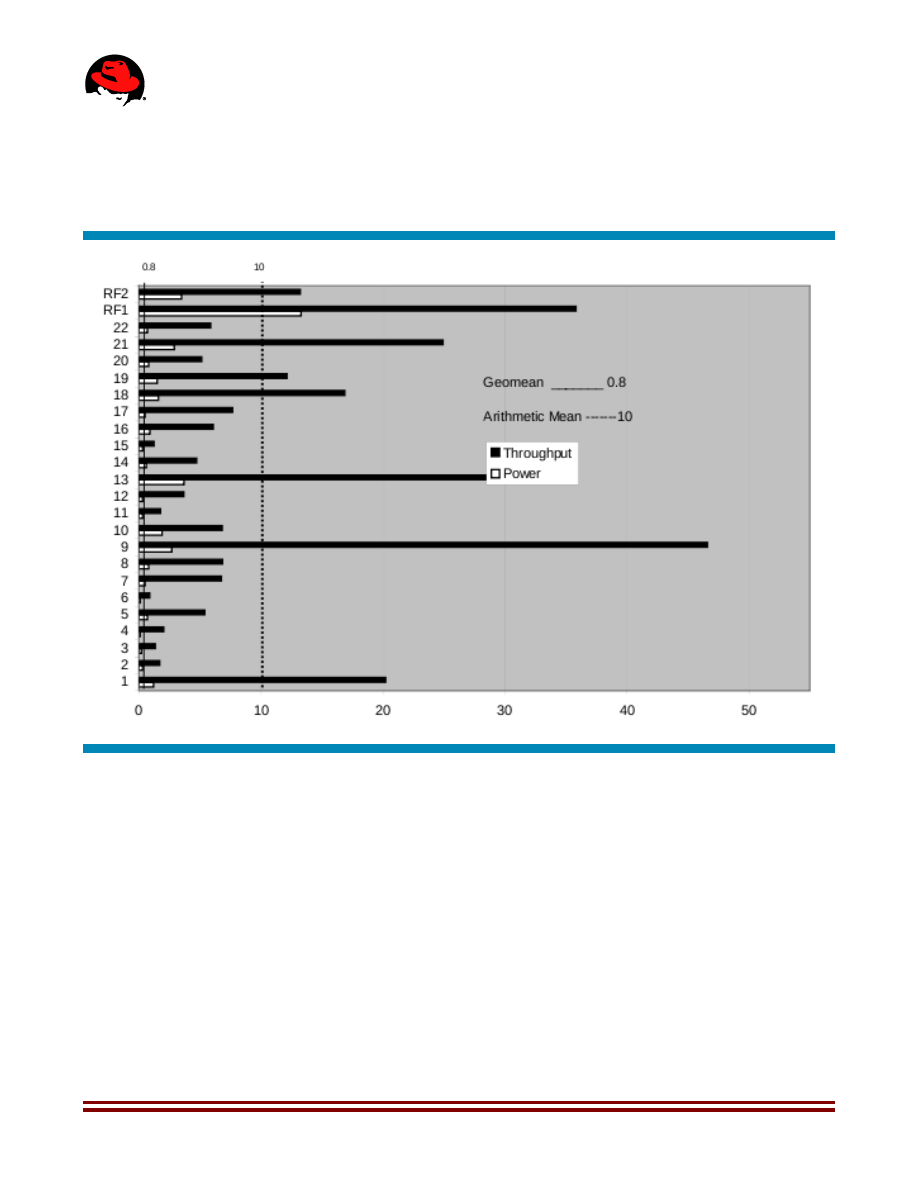
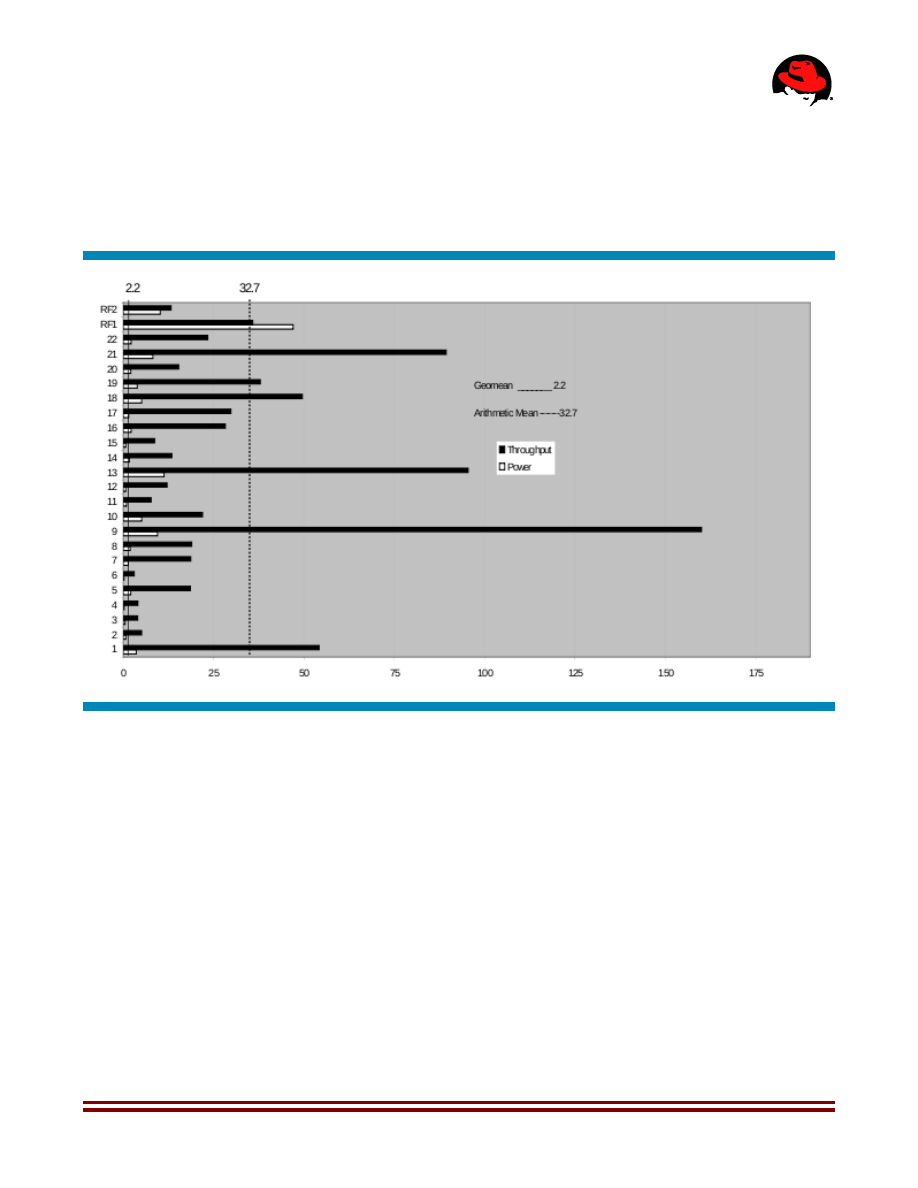
6.3 Benchmark Results
Figure 9: Query Time (Seconds) - Power & Throughput Tests (100 GB Run)
29 www.redhat.com
Measurement Results
Database Scaling (SF/size)
Total Data Storage/Database Size
Memory/Database Size Percentage
Start of Database Load Time
End of Database Load Time
Database Load Time
Query Streams for Throughput Test (S)
TPC-H Power
TPC-H Throughput
TPC-H Composite Query-per-Hour Metric (QphH@100GB)
Total System Price Over 3 Years ($)
TPC-H Price/Performance Metric ($/QphH@100GB)
100 GB
23.36
192.00%
4/5/12 0:10:23
4/5/12 2:21:56
2:11:33
11
448,702.6
362,365.9
403,230.1
$48,381 USD
$0.12 USD
Measurement Intervals
Measurement Interval in Throughput Test (Ts)
240.42
www.redhat.com 30
7. 300 GB TPC-H Performance-Leadership Run
7.1 System Configuration
Number of Nodes
1 x Dell PowerEdge R720
Processors/Cores/Threads/Type 2/16/16/Intel Xeon Processor E5-2690 2.90GHz
Memory
384 GB
Disk Controller
PERC H710P integrated RAID controller with 1GB
NVRAM
Disk Drives
16 x 146GB 15K RPM SAS 6G
Total Disk Storage
2336 GB
LAN Controllers
Intel Ethernet I350 QP 1Gb Network Daughter Card
Database
VectorWise 2.0.1
Operating System
RedHat Enterprise Linux 6.1
7.2 Parameter Settings
Settings must be provided for all customer-tunable parameters and options which have been
changed
from the defaults found in actual products, including but not limited to:
1. Database Tuning Options
2. Optimizer/Query execution options
3. Query processing tool/language configuration parameters
4. Recovery/commit options
5. Consistency/locking options
6. Operating system and configuration parameters
7. Configuration parameters and options for any other software component incorporated
into the pricing structure
8. Compiler optimization options
The Supporting File Archive contains the Operating System and DBMS parameters used in
this benchmark.
Refer to:
http://www.tpc.org/tpch/results/tpch_result_detail.asp?id=112051302
http://www.tpc.org/results/individual_results/Dell/DELL-R720-TPCH-300GB-051312-ES.pdf
http://www.tpc.org/results/fdr/tpch/DELL-R720-TPCH-300GB-051312-FDR.pdf
for detailed settings.
31 www.redhat.com
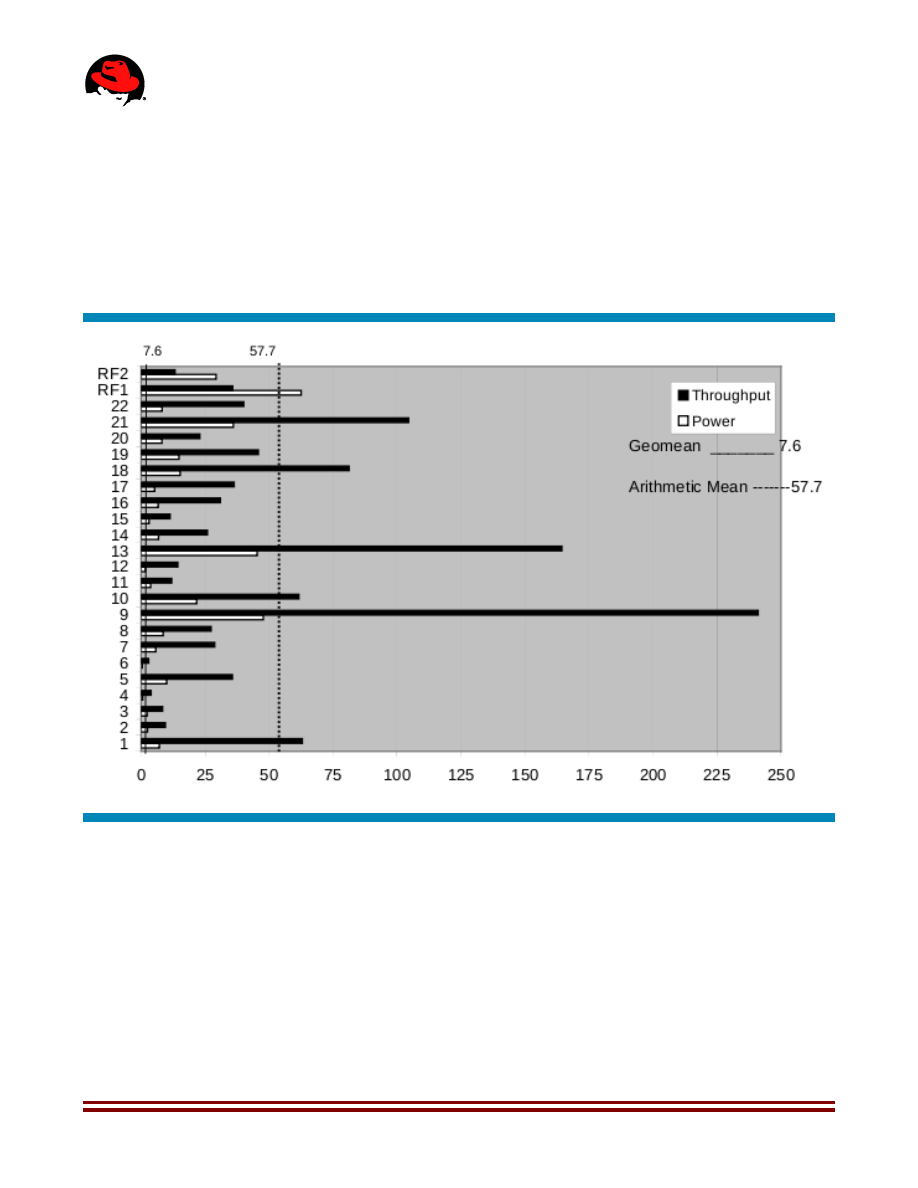
7.3 Benchmark Results
Figure 10: Query Time (Seconds) - Power & Throughput Tests (300 GB Run)
www.redhat.com 32
Measurement Results
Database Scaling (SF/size)
Total Data Storage/Database Size
Memory/Database Size Percentage
Start of Database Load Time
End of Database Load Time
Database Load Time
Query Streams for Throughput Test (S)
TPC-H Power
TPC-H Throughput
TPC-H Composite Query-per-Hour Metric (QphH@100GB)
Total System Price Over 3 Years ($)
TPC-H Price/Performance Metric ($/QphH@100GB)
300 GB
7.78
128%
4/14/12 20:09:25
4/15/12 2:26:45
6:17:20
11
486,359.8
346,631.3
410,594.1
$111,904
$0.28
Measurement Intervals
Measurement Interval in Throughput Test (Ts)
754
33 www.redhat.com
8. 1 TB TPC-H Performance-Leadership Run
8.1 System Configuration
Number of Nodes
1 x Dell PowerEdge R820
Processors/Cores/Threads/Type 4/32/32/Intel Xeon E5-4650 2.70 GHz, 24 MB L3 Cache
Memory
768 GB
Disk Controller
PERC H710 Adapter RAID controller with 512MB NVRAM
Disk Drives
8 x 300GB 15K RPM SAS 6G
Total Disk Storage
2400 GB
LAN Controllers
Intel Ethernet I350 QP 1Gb Network Daughter Card
Database
VectorWise 2.0.1
Operating System
RedHat Enterprise Linux 6.1
8.2 Parameter Settings
Settings must be provided for all customer-tunable parameters and options which have been
changed from the defaults found in actual products, including but not limited to:
1. Database Tuning Options
2. Optimizer/Query execution options
3. Query processing tool/language configuration parameters
4. Recovery/commit options
5. Consistency/locking options
6. Operating system and configuration parameters
7. Configuration parameters and options for any other software component
8. incorporated into the pricing structure
9. Compiler optimization options.
Refer to:
http://www.tpc.org/tpch/results/tpch_result_detail.asp?id=112060401
http://www.tpc.org/results/individual_results/Dell/DELL-R820-TPCH-1000GB-060112-ES.pdf
http://www.tpc.org/results/fdr/tpch/DELL-R820-TPCH-1000GB-060112-FDR.pdf
for detailed settings.
www.redhat.com 34
8.3 Benchmark Results
Figure 11: Query Time (Seconds) - Power & Throughput Tests (1 TB Run)
35 www.redhat.com
Measurement Results
Database Scaling (SF/size)
Total Data Storage/Database Size
Memory/Database Size Percentage
Start of Database Load Time
End of Database Load Time
Database Load Time
Query Streams for Throughput Test (S)
TPC-H Power
TPC-H Throughput
TPC-H Composite Query-per-Hour Metric (QphH@100GB)
Total System Price Over 3 Years ($)
TPC-H Price/Performance Metric ($/QphH@100GB)
1000 GB
2.40
77 %
05/24/12 13:23:11
05/25/12 03:50:01
14:26:50
7
475,833.4
417,155.8
445,529.6
333,237
0.75
Measurement Intervals
Measurement Interval in Throughput Test (Ts)
1,329

www.redhat.com 36
9. References
1. TPC BENCHMARK
TM
H (Decision Support) - Standard Specification Revision 2.9.0
http://www.tpc.org/tpch/spec/tpch2.9.0.doc
2. TPC-H 100GB Benchmark Executive Summary by Dell
http://www.tpc.org/results/individual_results/Dell/DELL-R720-TPCH-100GB-051312-
ES.pdf
3. TPC-H 100GB Benchmark Full Disclosure by Dell
http://www.tpc.org/results/fdr/tpch/DELL-R720-TPCH-100GB-051312-FDR.pdf
4. TPC-H 300GB Benchmark Executive Summary by Dell
http://www.tpc.org/results/individual_results/Dell/DELL-R720-TPCH-300GB-051312-
ES.pdf
5. TPC-H 300GB Benchmark Full Disclosure by Dell
http://www.tpc.org/results/fdr/tpch/DELL-R720-TPCH-300GB-051312-FDR.pdf
6. TPC-H 1TB Benchmark Executive Summary by Dell
http://www.tpc.org/results/individual_results/Dell/DELL-R820-TPCH-1000GB-060112-
ES.pdf
7. TPC-H 1TB Benchmark Full Disclosure by Dell
http://www.tpc.org/results/fdr/tpch/DELL-R820-TPCH-1000GB-060112-FDR.pdf
Wyszukiwarka
Podobne podstrony:
Red Hat Enterprise Linux 6 Performance Tuning Guide en US
Resource Management using Control Groups Cgroups in Red Hat Enterprise Linux 6
Red Hat Enterprise Linux 6 Virtualization Tuning and Optimization Guide en US
A study of assessors performance using graphical methods
Simulation of Oxford University Gun Tunnel performance using a quasi one dimensional model
Analysis of soil fertility and its anomalies using an objective model
81 Group tactics using sweepers and screen player using zon
Cisco Press Configuring the PIX Firewall and VPN Clients Using PPTP, MPPE and IPSec
85 ?sic Strategies and Group tactics using screens
Analysis of soil fertility and its anomalies using an objective model
Breman And Subrahmanyam Investment Analysis And Price Formation In Securities Markets
Analyzing Worms and Network Traffic using Compression
advantages and disadvantages of using internet
Admati And Pfleiderer A Theory Of Intraday Patterns Volume And Price Variability
Love and the Odor of Red Leatherette
Red Hat Storage 2 0 2 0 Update 4 and Update 5 Release Notes en US
Leadership style and performance
Mental Toughness for Peak Performance Leadership Development and Success
więcej podobnych podstron