
A Comparison of a Modified
Oswestry Low Back Pain Disability
Questionnaire and the Quebec Back
Pain Disability Scale
Background and Purpose. The quality of a disability scale should dictate
when it is used. The purposes of this study were to examine the validity
of a global rating of change as a reflection of meaningful change in
patient status and to compare the measurement properties of a
modified Oswestry Low Back Pain Disability Questionnaire (OSW) and
the Quebec Back Pain Disability Scale (QUE). Subjects. Sixty-seven
patients with acute, work-related low back pain referred for physical
therapy participated in the study. Methods. The 2 scales were admin-
istered initially and after 4 weeks of physical therapy. The Physical
Impairment Index, a measure of physical impairment due to low back
pain, was measured initially and after 2 and 4 weeks. A global rating of
change survey instrument was completed by each subject after 4 weeks.
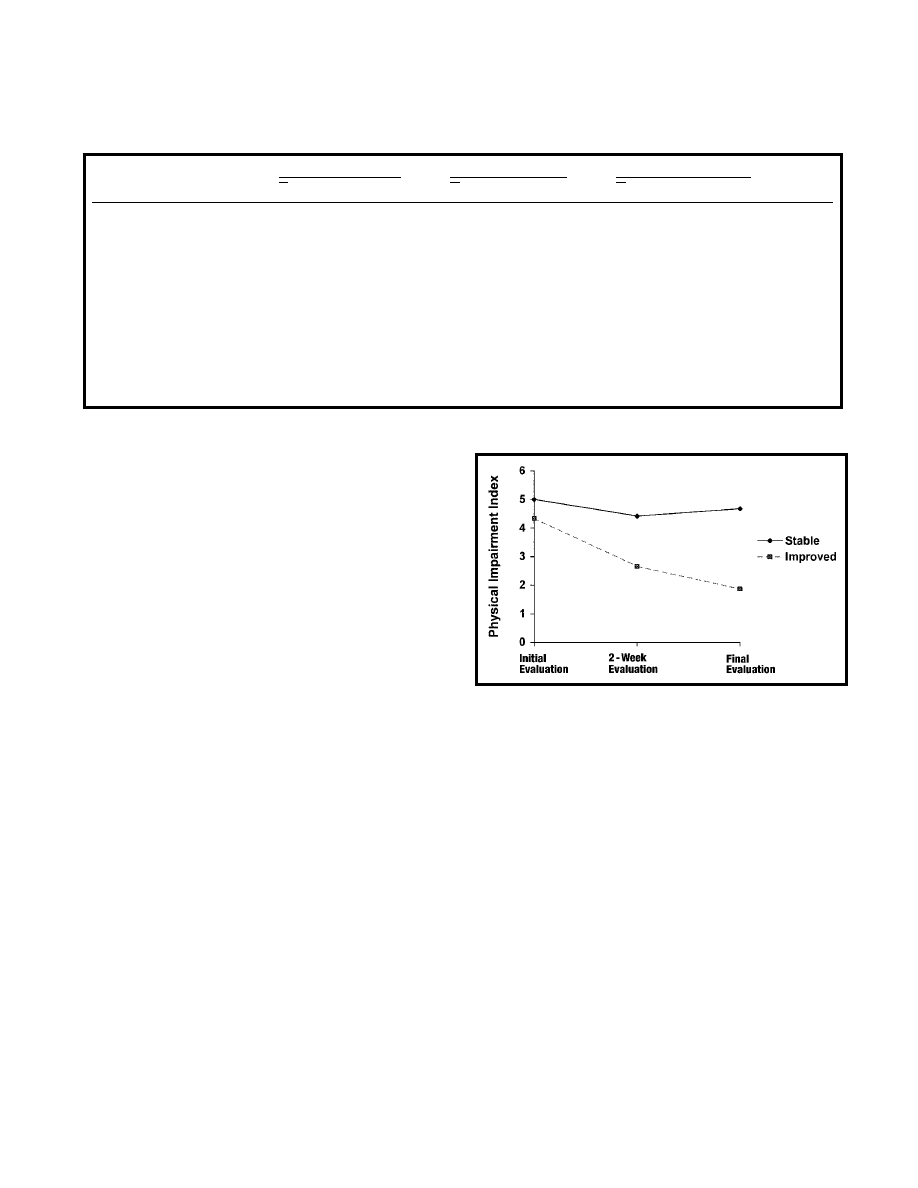
Results. An interaction existed between patients defined as improved
or stable based on the global rating using a 2-way analysis of variance
for repeated measures on the impairment index. The modified OSW
showed higher levels of test-retest reliability and responsiveness com-
pared with the QUE. The minimum clinically important difference,
defined as the amount of change that best distinguishes between
patients who have improved and those remaining stable, was approx-
imately 6 points for the modified OSW and approximately 15 points for
the QUE. Conclusion and Discussion. The construct validity of the
global rating of change was supported by the stability of the Physical
Impairment Index across the study period in patients defined as stable
by the global rating and by the decrease in physical impairment across
the study period in patients defined as improved by the global rating.
The modified OSW demonstrated superior measurement properties
compared with the QUE. [Fritz JM, Irrgang JJ. A comparison of a
modified Oswestry Low Back Pain Disability Questionnaire and the
Quebec Back Pain Disability Scale. Phys Ther. 2001;81:776 –788.]
Key Words: Disability, Low back pain, Measurement, Responsiveness, Standard error of measurement.
776
Physical Therapy . Volume 81 . Number 2 . February 2001
Research
Report
Julie M Fritz
James J Irrgang
䢇
ўўўўўўўўўўўўўўўўўўўўўўўўўўўўўўўўўўўўўўўўўўўўўўўўўўўўўўўўўўўўўўўўўўўўўўўўўўўўўўўўўўўўўўўўўўўўўўўўўўўўўўўўўўўўўўўўўўўўўўўўўўўўўўў
ўўўўўўўўўўўўўўўўўўўўўўўўўўўўўўўўўўўўўўўўўўўўўўўўўўўўўўўўўўўўўўўўўўўўўўўўўўўўўўўўўўўўўўўўўўўўўўўўўўўўўўўўўўўўўў
ўўўўўўўўўўўўўўўўўўўўўўўўўўўўўўўўўўўўўўўўўўўўўўўўўўўўў

S
elf-reported measurements of disability have
been used as an outcome measure for people
with low back pain (LBP).
1
Several disability
scales have been developed for people with
LBP, and their importance as measures of treatment
outcome in clinical trials has been emphasized.
2
Two of the most commonly used disability scales for
people with LBP are the Roland-Morris Disability Scale
and the Oswestry Low Back Pain Disability Question-
naire (OSW).
3
The measurement properties of both of
these scales have been studied extensively, and a recent
report of the International Forum for Primary Care
Research in Low Back Pain contended that both scales
are acceptable for measuring disability related to LBP.
2
Kopec et al
4,5
described the development of the Quebec
Back Pain Disability Scale (QUE). The developers of the
QUE proposed that instruments such as the OSW or the
Roland-Morris Disability Scale lack a strong conceptual
basis and are of uncertain content validity.
4
In their
original description of the QUE, the developers pre-
sented data indicating that this instrument may have
advantages over older scales such as the OSW,
5
but
further direct comparisons of the competing scales have
not been reported.
Scales designed to assess the magnitude of change in
patients over time are expected to possess high levels of
reliability and responsiveness.
6 – 8
Reliability requires that
scales show little variability in repeated measurements of
patients whose clinical status has not changed. Respon-
siveness may be considered an aspect of validity
9
and
describes a scale’s ability to detect change over time that
is clinically meaningful.
10
Deyo and Centor
11
made the
analogy to a diagnostic test, in which the disability scale
is used to detect the presence of clinically meaningful
change in the patient’s status. From this perspective,
responsiveness consists of 2 properties: sensitivity (the
ability to detect clinically meaningful change when it has
occurred) and specificity (the ability to remain stable
when no clinically meaningful change has occurred).
11
Although disability scales were developed to make com-
parisons among groups, many experts believe that they
may also be used to make decisions about individual
patients.
12
In order to be used for individual patient
decision making, we believe that the clinician should
know how much change must occur before the change
may be considered meaningful. Meaningful change may
be considered from 1 of 2 perspectives: statistical or
clinical.
13–15
From a statistical perspective, meaningful
JM Fritz, PT, PhD, ATC, is Assistant Professor, Department of Physical Therapy, School of Health and Rehabilitation Sciences, University of
Pittsburgh, 6035 Forbes Tower, Pittsburgh, PA 15260 (USA) (jfritz@pitt.edu). Address all correspondence to Dr Fritz.
JJ Irrgang, PT, PhD, ATC, is Assistant Professor, Department of Physical Therapy, School of Health and Rehabilitation Sciences, University of
Pittsburgh, and Vice President of Quality Improvement and Outcomes, Center for Rehabilitation Services, Pittsburgh, Pa.
Both authors provided concept/research design, writing, and data analysis. Dr Fritz provided data collection and project management.
This study was approved by the Institutional Review Board at the University of Pittsburgh.
This study was partially funded by a grant from the Foundation for Physical Therapy.
This article was submitted June 17, 1999, and was accepted June 29, 2000.
Physical Therapy . Volume 81 . Number 2 . February 2001
Fritz and Irrgang . 777
ўўўўўўўўўўўўўўўўўўўўўўўўўўўўўўўўўўўўўўўўўўўўўўўўўўўўўўўўўўўўўўўўўўўўўўўўўўўўўўўўўўўўўўўўўўўўўўўўўўўўўўўўўўўўўўўўўўўўўўўўўўўў
ў

change is based on the measurement error associated
with a scale and can be defined as the amount of change
needed to be certain, within a defined level of statistical
confidence, that “true change” has occurred. Numerous
terms have been used to describe statistically meaningful
change, including “minimum detectable change,”
13
“smallest detectable difference,”
16
“minimum reliable
change,”
17
and
“minimal
metrically
important
change.”
18
The presence of a statistically meaningful
change does not attest to the clinical importance of the
change. The minimum clinically important change (MCID)
has been defined as the smallest change in a scale that is
important to patients.
13,19
Knowledge of the MCID
allows clinicians to examine pre- and post-treatment
scores and to determine whether the patient has actually
improved an amount that is likely to be perceived as
important to the patient. Therefore, some authors
19,20
contend that the MCID is the most important measure-
ment property to consider when evaluating a scale’s
ability to be used in making individual patient decisions.
Furthermore, the MCID is useful for determining sam-
ple size requirements for clinical trials and for distin-
guishing between statistical significance and clinical
significance in published research.
21–23
Several methods have been described for evaluating
responsiveness and determining an MCID. Many com-
monly used methods make a comparison between a
scale’s change score and an external standard of clini-
cally meaningful change.
9,24
A true measure of clinically
meaningful change is not available for people with
LBP.
25–27
Therefore, we believe that researchers should
use a construct to represent change. Many authors
13,24,28 –33
have used a global rating of change as the external
standard of meaningful change.
The use of a global rating of change as an external
standard of meaningful change has been questioned.
Norman et al
26
raised 3 concerns regarding the use of
global ratings: (1) the reliability and validity of global
ratings are unknown, (2) global ratings typically are
highly correlated with the patient’s present status and
are not an unbiased measure of change, and (3) bias in
the patient’s judgment of change also will be reflected in
the final disability scale score, making the errors of
measurement on the global rating and the disability
scale correlated. Other authors,
13
however, have argued
that comparisons of scales designed for the same purpose
with a global rating are a valid way to assess responsiveness.
The purpose of our study was two-fold. First, we tested
the construct validity of the use of a global rating of
change as an external standard of meaningful change to
compare competing disability scales in a cohort of
patients with acute LBP. Second, we compared the
measurement properties of 2 disability scales for patients
with LBP: the OSW and the QUE. Reliability, responsive-
ness, and statistically and clinically meaningful levels of
change for each scale were determined.
Method
Subjects
The data reported in this article were collected from 2
sources. Sixty-one consecutive individuals (34 men, 27
women; mean age
⫽37.2 years, SD⫽9.6) who were
referred for participation in a clinical trial of physical
therapy for patients with acute LBP were included. In
addition, 10 individuals with work-related acute LBP
(6 men, 4 women; mean age
⫽44.8 years, SD⫽10.6) who
were receiving physical therapy during a 1-month period
at a single outpatient clinic were also included in order
to increase the sample size. The duration of LBP for all
subjects was less than 3 weeks (mean number of
days
⫽6.2, SD⫽5.3, median⫽4, range⫽0–19). Subjects
who were participating in the clinical trial did not differ
from other subjects with regard to initial OSW or QUE
scores (P
⬎.05), but they were younger (37.2 years versus
44.8 years, t
⫽2.52, P⬍.05). All subjects sustained a
work-related injury of the lumbosacral spine of sufficient
magnitude to necessitate a modification in work duties
and referral for physical therapy. Physical therapy re-
evaluation was performed approximately 4 weeks after
the initial evaluation. All subjects received physical ther-
apy intervention for their injury during the period
between evaluations. Because the assessment of treat-
ment effectiveness was not the purpose of our study, the
specifics of the intervention are not relevant in this
report. Re-evaluation scores were not obtained on 4
subjects, and these subjects were not included in the
analysis. The sample reported in this article, therefore,
consisted of 67 patients (94%), with a mean age of 39.2
years (SD
⫽9.7, minimum⫽21, maximum⫽58). Fifty-
seven percent of the subjects were male, 51% had LBP
only, and 49% had LBP and lower-extremity pain. Twenty-
nine subjects (43%) had no prior history of activity-
limiting LBP. Re-evaluation was performed an average of
29.1 days from the initial evaluation (SD
⫽4.7, mini-
mum
⫽22, maximum⫽42, median⫽28).
Measurements
The subjects completed a series of self-reports and
underwent a physical examination lasting approximately
20 minutes at the time of the initial and final evaluations.
Data for the following measures were collected:
Modified Oswestry Low Back Disability Questionnaire.
The OSW was originally described in 1980.
34
Individual
items included in the OSW were selected based on the
experience of the scale’s developers and were pilot
tested in a sample of 25 patients.
34
The questionnaire
consists of 10 items addressing different aspects of
778 . Fritz and Irrgang
Physical Therapy . Volume 81 . Number 2 . February 2001

function. Each item is scored from 0 to 5, with higher
values representing greater disability. The total score is
multiplied by 2 and expressed as a percentage. The
version of the OSW used in this study was modified by
the authors (Appendix 1). The modified OSW used in
this study was similar to the modified OSW used by
Hudson-Cook et al,
35
who replaced the sex life section
with a question related to fluctuations in pain intensity.
Hudson-Cook et al reported levels of test-retest reliability
and internal consistency for the modified version similar
to those of the original OSW. The measurement charac-
teristics of the version used in our study have not been
previously reported. A section regarding employment
and home-making ability was substituted for the section
related to sex life because the sex life item is frequently
found to be left blank.
Quebec Back Pain Disability Scale. The QUE is a
condition-specific measure of disability that was described
by Kopec et al in 1995.
5
The final set of items of the QUE
were selected from a larger pool of items by examining
the test-retest reliability, item-total correlations, and
responsiveness of individual items and by using tech-
niques of factor analysis and item response theory.
4
The
developers believed this method was likely to produce a
scale with measurement properties superior to those of
scales developed with a more intuitive approach to item
selection.
4,5
For example, items on the OSW were
selected based on the developers’ opinion that each item
was relevant to patients with LBP.
34
The final scale
contains 20 daily activities and asks the patient to rate his
or her degree of difficulty in performing each activity
from 0 (“not difficult at all”) to 5 (“unable to do”)
(Appendix 2). The item scores were summed for a total
score between 0 and 100, with higher numbers repre-
senting greater levels of disability.
Physical Impairment Index. Waddell et al
36
described a
method of evaluating physical impairment in patients
with LBP. The index consists of 7 individual tests— 4
range of motion tests (total lumbar flexion, lumbar
extension, average lumbar side bending, and average
straight leg raise) and 3 other tests (bilateral active
straight leg raise, active sit-up, and spinal tenderness).
Each test is scored as positive (1) or negative (0) based
on published cutoff values, resulting in a total score
ranging from 0 to 7. Higher values represent increased
levels of physical impairment. Waddell et al found the
impairment index yielded reliable results (intraclass
correlation coefficient [ICC] values between .86 and .95
and kappa values between .48 and .60 for individual
tests), distinguished between patients with LBP and indi-
viduals without symptoms (specificity
⫽86%, sensitivi-
ty
⫽76%), and was correlated with disability (r ⫽.51).
36
The
impairment index was measured at the initial evaluation,
after 2 weeks, and at the time of the final evaluation.
At the time of the final evaluation, the physical therapists
and the subjects completed a global rating of change
survey instrument. The therapists and the subjects were
asked to rate the overall change in the subject’s low back
condition since the beginning of physical therapy inter-
vention using a 15-point rating scale described by
Jaeschke et al.
29
The scale ranges from
⫺7 (“a very great
deal worse”) to 0 (“about the same”) to
⫹7 (“a very great
deal better”). Intermittent descriptors of worsening or
improving are assigned values from
⫺1 to ⫺6 and from
⫹1 to ⫹6, respectively. The therapists and the subjects
were blinded to each others’ ratings. The ratings of the
therapists and the subjects were averaged in order to
balance the input of both the therapist and the patient.
Jaeschke et al
29
recommended that changes of
⫺3 to ⫺1
or
⫹1 to ⫹3 would represent small alterations in func-
tion, changes of
⫺4 to ⫺5 or ⫹4 to ⫹5 would represent
moderate changes, and changes of
⫺6 to ⫺7 or ⫹6 to
⫹7 would represent large changes. Subjects with an
average rating greater than
⫹3 were considered to have
experienced a clinically meaningful improvement, sub-
jects with average ratings between
⫹3 and ⫺3 were
considered as stable, and subjects with average ratings
less than
⫺3 were categorized as experiencing a deteri-
oration in their clinical status.
Data Analysis
Construct validation of global rating of change. The use
of global ratings of change has been criticized.
21
The
ability of these scales to reflect a patient’s status and
whether they can be used to accurately depict changes
occurring between initial and final assessments have
been questioned.
21
We compared changes in Physical
Impairment Index scores between patient groups
defined as stable or improved based on a global rating of
change using a 2-way analysis of variance (ANOVA) for
repeated measures on the impairment index scores
measured initially and at 2- and 4-week follow-up exam-
inations. We hypothesized that the improved group
would show a progressive decrease in physical impair-
ment at each measurement interval, whereas the impair-
ment level of the stable group would not change. This
finding would be indicated by a group
⫻ time interac-
tion, with the group of patients defined as improved
showing a greater improvement in Physical Impairment
Index scores than the group defined as stable.
Reliability. Test-retest reliability was assessed in subjects
defined as stable over the treatment period based on the
average global rating of change. An ICC (2,1) and a 95%
confidence interval (CI) were calculated for the QUE
and the modified OSW using the methods recom-
mended by Shrout and Fleiss.
37
Variance components
were calculated for the sources of variation involving a
Physical Therapy . Volume 81 . Number 2 . February 2001
Fritz and Irrgang . 779
ўўўўўўўўўўўўўўўўўўўўўўўўўўў
ў

random factor using the methods described by Eliasziw
et al.
38
Responsiveness. Responsiveness was first evaluated
using a receiver operating characteristic (ROC) curve.
An ROC curve was constructed by calculating the sensi-
tivity (true positive rate) and specificity (true negative
rate) as the cutoff change score defining clinically
meaningful change varied.
11
For example, sensitivity and
specificity values were calculated using a change score of
1 or more points of change defining a clinically mean-
ingful change, then 2 or more points, and so on.
Sensitivity was calculated by dividing the number of
subjects identified by the scale as having improved based
on the selected cutoff score by the total number of
subjects identified as having undergone meaningful
change based on the average global rating. Specificity
was calculated by dividing the total number of subjects
identified by the scale as remaining stable by the total
number of subjects identified as having a stable condi-
tion based on the average global rating. Confidence
intervals for the sensitivity and specificity values were
calculated using the method of Simel et al.
39
The ROC
curve was constructed by plotting the sensitivity values
on the y-axis and 1 minus the specificity values on the
x-axis for different values of the change scores. The area
under the curve (AUC) can be used as a quantitative
method for assessing a scale’s ability to distinguish
patients who have undergone true change from those
who remain stable. The AUC can be interpreted as the
probability of correctly identifying the improved patient
from randomly selected pairs of improved and unim-
proved patients
40
and ranges between 0.5 (no diagnostic
accuracy beyond chance) to 1.0 (perfect diagnostic
accuracy). The AUC for the modified OSW and the QUE
were compared using the method described by Hanley
and McNeil.
41
The nonparametric method was used for
estimating the AUC and the standard error of the area,
which does not require normal distributions of change
scores for improved and stable patients.
40
The second method for assessing responsiveness was the
calculation of Guyatt’s Responsiveness Index (GRI)
10
for
the OSW and QUE. The GRI is defined as the ratio of the
average change in patients identified as improved divided
by the standard deviation of the change in patients identi-
fied as remaining stable. A large GRI indicates greater
responsiveness. The GRIs and 95% CIs were calculated,
42
and the difference between the GRIs obtained for the
modified OSW and the QUE was computed. The signifi-
cance of the difference was determined using the method
described by Tuley et al.
42
A 95% CI of the difference score
between the GRIs obtained for the modified OSW and the
QUE that did not contain zero indicated that the differ-
ence between GRIs was significant.
The third method used to assess responsiveness was a
comparison of the correlations between the change
scores of the disability scales and the average global
ratings. The correlations were compared using a Fisher r
to Z-transformation for comparing correlated correla-
tion coefficients.
43
Statistically meaningful change. Statistically meaningful
change was determined by calculating the standard error
of measurement (SEM) between the initial and final
scores for subjects identified as stable based on the
global rating of change. The SEM was calculated as
(sd
⫻ [1⫺r]
1/2
), where r is the test-retest reliability
coefficient and sd is the square root of the total variance.
Numerous authorities
16,38,44,45
have argued that the SEM
is the most appropriate statistic for determining statisti-
cally meaningful change in health status questionnaires.
The SEM has several properties that make it an attractive
statistic for determining clinically meaningful change.
First, the SEM accounts for the possibility that some of
the change observed with a particular measure may be
attributable to random error.
12
Second, the SEM is
considered to be a fixed characteristic of a measure,
independent of the sample under investigation.
46,47
That
is, the SEM is expected to remain relatively constant for
all samples taken from a given population.
48
In addition,
the SEM in expressed in the original metric of the
measure, aiding its interpretations.
48,49
There is cur-
rently no consensus regarding the number of SEMs
required to define statistically meaningful change. Pre-
vious researchers
46,48
have reported one SEM as the best
measure of meaningful change on health-related quality-
of-life measures. Other researchers
18,50
have recom-
mended 1.96
⫻ SEM to correspond with the 95% CI. We
calculated statistically meaningful change by multiplying
the SEM by 1.65 to correspond to the 90% CI. This value
was then multiplied by 公2 to adjust for the error
associated with taking 2 measurements.
47
Minimum clinically important difference. The ROC curve
was used to provide an estimate of the MCID. The point
on the curve nearest the upper left-hand corner of the
graph represents the cutoff score that best discriminates
between patients who have improved and those who are
stable. If the consequences of a false-positive or false-
negative result are judged to be equally important, this
cutoff score can be used as an estimate of the MCID for
the scale.
25
Results
Of the 67 subjects participating in our study, 23 subjects
were identified as having a stable condition (average global
rating of change between
⫺3 and ⫹3) and 44 subjects were
identified as improved (average global rating of change
greater than 3). The mean global rating of change for all
subjects was 3.63 (SD
⫽2.64). No subject had an average
780 . Fritz and Irrgang
Physical Therapy . Volume 81 . Number 2 . February 2001
global rating of change of less than
⫺3. The Pearson
correlation between the subjects’ and therapists’ global
rating was .82. Three subjects did not have a therapist
global rating. The subject’s rating was used for classification
for these subjects. Table 1 displays the means and standard
deviations for the measurements that were collected.
Construct Validation of the Global Rating of Change
Of the 67 subjects in our study, 57 (85%) had Physical
Impairment Index scores measured at all 3 evaluations
(initial, 2-week, and final). Four subjects in the stable
group and 6 subjects in the improved group had incom-
plete impairment measurements, and their data were
not included in the repeated-measures data analysis.
These subjects did not differ from those whose data were
included in the analysis for the variables of age, initial
modified OSW scores, and initial QUE scores. Figure 1
shows the mean impairment index for the subjects in the
stable and improved groups. There was an interaction
between group and time (P
⬍.0001). The form of the
interaction is shown in Figure 1. The source of the
interaction was further explored by comparing treat-
ment differences between the initial and 2-week evalua-
tions and between the 2-week and final evaluations. The
type I error rate was set at P
⬍.025 for each comparison.
An interaction was found between the initial and 2-week
evaluations (P
⫽.024) and between the 2-week and final
evaluations (P
⫽.009).
Reliability
The means and standard deviations of the change scores
for the modified OSW and the QUE for the total sample
and by group are displayed in Table 1. The ANOVA
summaries are presented in Tables 2 and 3. The ICC for
the modified OSW in the stable group was .90 (95%
CI
⫽.78–.96). For the QUE, the ICC was .55 (95%
CI
⫽.20–.78).
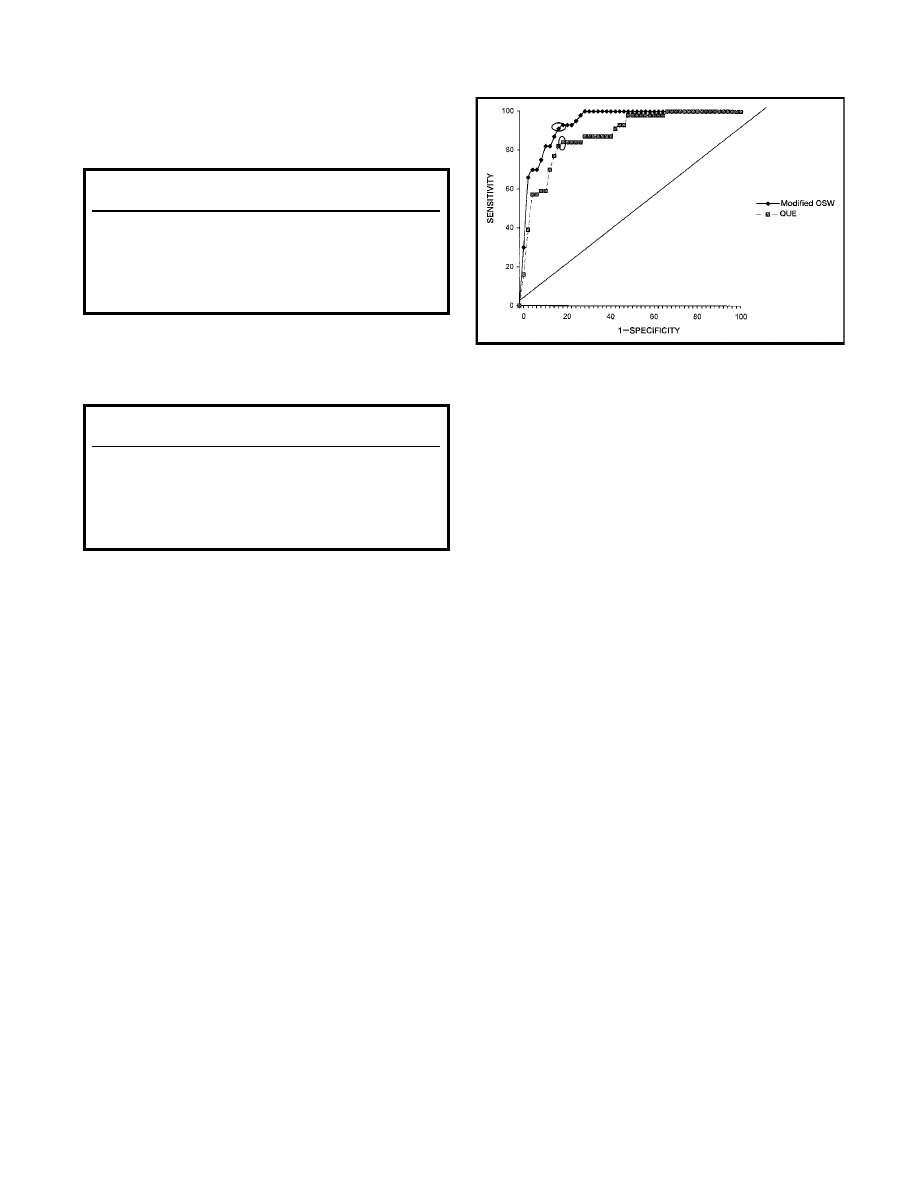
Responsiveness
Figure 2 shows the ROC curve constructed from the
change scores for the modified OSW and the QUE. The
AUC was 0.94 (standard error
⫽0.027) for the modified
OSW and 0.87 (standard error
⫽0.048) for the QUE.
There was no difference in the AUC between the scales.
The GRI for the OSW was 3.49 (95% CI
⫽2.14–4.84). For
the QUE, the GRI was 1.82 (95% CI
⫽1.10–2.55). The
difference in the GRI between the OSW and the QUE was
1.67 (95% CI
⫽0.50–2.83), indicating that the OSW was the
more responsive measure based on the GRI.
The Pearson correlation between the change score of
the modified OSW and the mean global rating was .78,
and the Pearson correlation between the change score
of the QUE and the mean global rating was .67. The
correlation between the change scores of the modified
OSW and the QUE was .82. There was a difference
Figure 1.
Graph of the impairment index scores for the groups of subjects defined
as stable and improved based on the average global rating. The
interaction between time and group was significant (
P
⬍.001).
Table 1.
Means and Standard Deviations for the Modified Oswestry Low Back Pain Disability Questionnaire (OSW), the Quebec Back Pain Disability
Scale (QUE), and the Physical Impairment Index
Initial Score
Final Score
Change Score
Effect
Size
X
SD
X
SD
X
SD
Modified OSW
Total sample (n
⫽67)
45.46
15.54
28.03
20.73
17.45
18.24
1.12
Stable group (n
⫽23)
47.87
16.93
47.70
16.96
0.22
7.57
0.01
Improved group (n
⫽44)
44.20
14.81
17.75
14.06
26.45
15.48
1.79
QUE
Total sample (n
⫽67)
49.34
20.88
25.85
22.98
23.49
24.55
1.13
Stable group (n
⫽23)
51.35
18.40
47.52
20.69
3.83
18.51
0.21
Improved group (n
⫽44)
48.30
22.19
14.52
14.46
33.77
20.85
1.52
Physical Impairment Index
Total sample (n
⫽57)
4.56
1.73
2.81
2.31
1.75
2.22
1.01
Stable group (n
⫽19)
5.00
1.60
4.68
2.14
0.32
1.97
0.20
Improved group (n
⫽38)
4.34
1.77
1.87
1.77
2.47
2.00
1.40
Physical Therapy . Volume 81 . Number 2 . February 2001
Fritz and Irrgang . 781
ўўўўўўўўўўўўўўўўўўўўўўўўўўў
ў
between the correlations of the change scores and the
mean global rating (P
⫽.03).
Statistically Meaningful Change
The SEM values were 5.40 (95% CI
⫽4.35–7.22) for the
modified OSW and 13.08 (95% CI
⫽10.54–17.47) for the
QUE. Based on these SEM values, the threshold for
statistically meaningful change was 12.68 for the modi-
fied OSW and 30.52 for the QUE.
Minimum Clinically Important Difference
The MCID calculated from the ROC curve using the
cutoff point nearest the upper left-hand corner of the
graph was 6 points for the modified OSW (sensitivi-
ty
⫽91% [95% CI⫽82%–99%], specificity⫽83% [95%
CI
⫽67%–98%]) and 15 points for the QUE (sensitivi-
ty
⫽82% [95% CI⫽70%–93%], specificity⫽83% [95%
CI
⫽67%–98%]).
Discussion
Responsiveness has been identified as an important
measurement characteristic when examining the useful-
ness of a self-report disability scale.
7,8
The most appro-
priate method for investigating responsiveness has been
the subject of much debate.
9,26
The debate has largely
centered on the selection of an external standard against
which to judge a scale’s ability to detect clinically mean-
ingful change. The traditional approach to the problem
has been the use of a global rating of change from the
patient or the clinician.
8
This retrospective approach has
been criticized on several grounds. The validity and
reliability of retrospective global ratings of change are
largely unknown, a patient’s recall of his or her former
health status may be inaccurate or biased by his or her
current state of health, and the errors of measurement
on the global rating of change and disability scales due
to this bias are likely to be correlated.
21,26
Alternatives to
a retrospective global rating of change have been sug-
gested, including asking patients to compare themselves
with other individuals with the same condition,
29,51
hav-
ing clinicians estimate a patient’s prognosis prior to
treatment,
27
and having clinicians decide whether a
patient has met his or her therapy goals.
52
We assessed the construct validity of the global rating of
change by comparing the Physical Impairment Index
scores over the study period in the groups defined as
stable and improved based on a global rating of change.
Proponents of physical disablement models propose a
relationship between impairments and disability,
53,54
and the Physical Impairment Index has been shown to
be correlated with disability in patients with LBP (r
⫽.51
with the Roland-Morris Disability Scale).
36
The group
defined as stable based on the global rating of change
showed little variation in impairment scores over time,
whereas the group defined as improved demonstrated a
steady reduction in impairment (Fig. 1). Although a
one-to-one correlation between impairment and disabil-
ity does not exist, this finding indicates that the clinical
status of the group defined as stable remained fairly
constant, not only at the time of the final evaluation, but
throughout the study period.
The differences in impairment index scores indicate to
us that the global rating of change could be used to
separate those subjects whose clinical status improved
Figure 2.
Receiver operating characteristic curve for the modified Oswestry Low
Back Pain Disability Questionnaire (modified OSW) and the Quebec
Back Pain Disability Scale (QUE). The circled value is the point nearest
the upper left-hand corner of the graph. This point represents the
minimum clinically important difference for each scale.
Table 2.
Analysis of Variance Summary Table for Modified Oswestry Low Back
Pain Disability Questionnaire Scores in the Group of Subjects With
Stable Low Back Pain (n
⫽23)
Source
df SS
MS
Variance
Component F
P
Between
22 11988.83 544.95 257.87
sugjects
Between
1
0.35
0.35
0.012 .91
measures
Error
22
642.62
29.21
29.21
Total
45 12631.80
287.08
Table 3.
Analysis of Variance Summary Table for Quebec Scores in the Group
of Subjects With Stable Low Back Pain (n
⫽23)
Source
df SS
MS
Variance
Component F
P
Between
22 13091.30 595.06 211.90
subjects
Between
1
168.35 168.35
0.98 .33
measures
Error
22
3767.65 171.26 171.26
Total
45 17027.30
383.16
782 . Fritz and Irrgang
Physical Therapy . Volume 81 . Number 2 . February 2001
from those remaining stable in one dimension of dis-
ablement: physical impairment. The improved group
appeared to experience a steady decline in physical
impairment during the study period, whereas the stable
group did not experience a change in impairment. We
believe this finding supports the construct validity of the
use of a global rating of change as an external standard
of meaningful change. One criticism offered against the
use of a global rating of change is that the global rating
offered by the patient at one point in time reflects only
the patient’s present status and not the clinical course of
the condition.
26
Our results indicate that the group
defined as stable based on the global rating of change
did not experience any change in physical impairment at
the time the global rating was assessed, and also at a
measurement taken 2 weeks prior to assessment of the
global rating of change.
Reliability estimates of clinical measures attest to a
measure’s stability in patients whose clinical status is
unchanged. These estimates are typically accomplished
by repeated administrations of an instrument in a time
frame short enough to ensure that clinical change is
unlikely to have occurred. If time frames are too short,
however, patient recall may inflate reliability.
3,8
A mea-
sure with a high degree of test-retest reliability should
also remain stable in patients whose clinical status is
unchanged over a more extended period of time. In our
study, reliability was determined in patients judged to be
stable across a 4-week period.
The ICC value calculated in this study for the modified
OSW (ICC
⫽.90) was consistent with reliability coeffi-
cients found in some other studies using shorter follow-
up times. Fairbank et al
34
found a correlation coefficient
of .99 for repeated administrations of the OSW on
consecutive days in 22 patients. A correlation coefficient
of .94 was reported by Triano et al
55
when administra-
tions of the OSW were separated by 2 hours. Kopec et al
5
reported an ICC value of .91 for the OSW given 1 to 14
days (median
⫽3.8 days) apart. In the same study, an ICC
of .92 was found for the QUE.
5
Schoppink et al
56
found
an ICC of .90 for a Dutch adaptation of the QUE given
1 week apart. We did not replicate the high degree of
reliability reported in these studies. Our findings suggest
that the QUE may not remain stable in patients who do
not undergo change over an extended period of time.
Because clinical trials typically look for treatment effects
occurring over a period of weeks, months, or years
instead of days, this finding may mean the use of the
QUE as a measure of treatment outcome has some
drawbacks. In addition, we evaluated only patients with
acute LBP. Previous studies have focused on patients
with chronic conditions.
5,55,56
The diminished reliability
of the QUE may reflect instability in the scale when
applied in patients with acute LBP. The QUE may lack
specificity in patients with acute LBP (ie, it detects
change where no clinically meaningful change has
occurred based on the external standard). The sample
size of stable patients on whom the ICC was based was
small (n
⫽23), however, which may have had an impact
on our reliability estimates. The CIs, particularly for the
QUE, were wide, indicating a lack of precision for the
ICC statistic.
The ANOVA tables for the modified OSW and the QUE
(Tabs. 2 and 3) can be used to provide further insight
into potential sources of error. The F test for a differ-
ence between initial and follow-up measurements was
not significant for either measure. This finding indicates
the lack of a systematic difference between measures due
to time, as would be expected in a group of patients
whose status remains stable. For the modified OSW, the
variance component between subjects (257.87) was
much larger than the variance component for the error
term (29.21). However, for the QUE, the variance com-
ponent due to error was much larger (171.26),
approaching the magnitude of the variance component
between subjects (211.90), indicating a large degree of
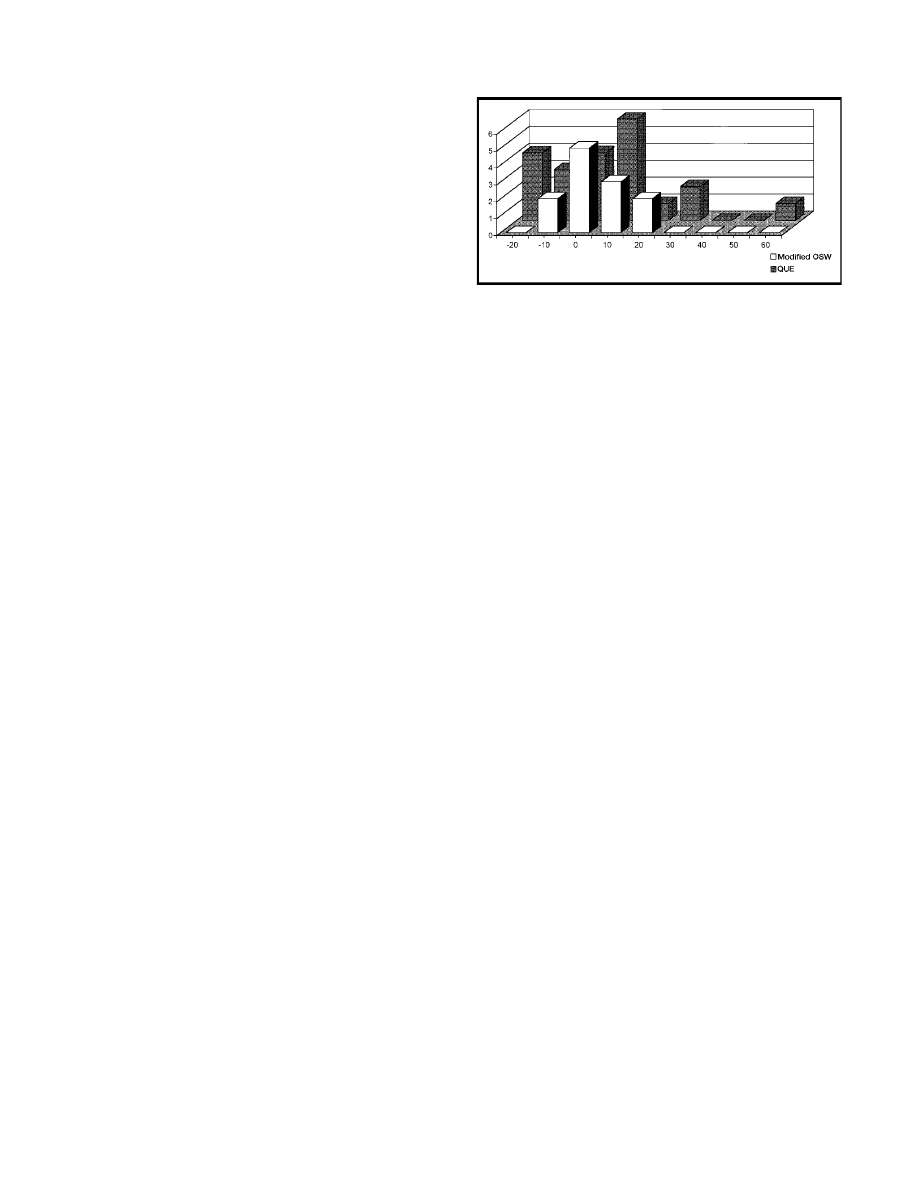
nonsystematic, or random, error. We plotted a histo-
gram of the change scores for each scale to further
examine the pattern of errors in the measurements
(Fig. 3). The change scores for the modified OSW
tended to cluster around 0 to a greater extent than the
QUE change scores, as indicated by the smaller standard
deviation for the modified OSW change scores (Tab. 1).
One subject in the stable group showed a 58-point
improvement on the QUE. The modified OSW change
score for this subject was 19 points. Because this score
may represent an outlier, we recalculated the ICC values
with the subject’s scores removed. This recalculation
resulted in ICCs of .92 (95% CI
⫽.82–.97) for the mod-
ified OSW and .70 (95% CI
⫽.40–.86) for the QUE. The
corresponding SEM values would be changed to 4.99
and 10.27 for the modified OSW and the QUE, respec-
tively. Even with the potential outlier removed, the
results favor the superior reliability of the modified
Figure 3.
Histogram of change scores in the group of subjects defined as stable.
Modified OSW
⫽modified Oswestry Low Back Pain Disability Question-
naire, QUE
⫽Quebec Back Pain Disability Scale.
Physical Therapy . Volume 81 . Number 2 . February 2001
Fritz and Irrgang . 783
ўўўўўўўўўўўўўўўўўўўўўўўўўўў
ў

OSW; however, the 95% CIs for the ICC values would
overlap somewhat.
Several different methods for evaluating responsiveness
have been reported. We used 3 different methods for
comparing the relative responsiveness of the modified
OSW and the QUE. Construction of ROC curves dem-
onstrated no difference in AUC value between the
modified OSW and the QUE. Other authors have
reported AUC values for the OSW, but not for the QUE.
Stratford et al
31
studied 76 patients, including patients
with both acute and chronic LBP, and found an AUC of
0.78 over a 4- to 6-week follow-up time. Beurskens et al
25
reported on 81 patients with a duration of symptoms of
at least 6 weeks and calculated an AUC of 0.76 over a
6-week treatment period. We included only patients with
LBP of less than 3 weeks’ duration in our study. Our
higher AUC values may reflect a greater ease in detect-
ing clinically meaningful change in patients with acute
LBP than in patients with chronic LBP.
The second method for studying responsiveness was the
difference between the GRI statistics. This difference was
statistically significant, with the modified OSW demon-
strating the greater responsiveness. The third method
was computing correlation coefficients between the
change scores of the disability scales and the mean
global rating. The correlations calculated in this study
(.78 for the modified OSW, .67 for the QUE) are larger
than correlations reported by other authors. Kopec et al
5
found correlations of .35 for the OSW and .42 for the
QUE over a 4-month period. Stratford et al
31
reported a
correlation of .57 for the OSW and a global rating of
change over a 4- to 6-week period. We believe the larger
coefficients we found are a reflection of the shorter
follow-up time (4 weeks) and the use of patients with
acute LBP. Weaker relationships between patient-
reported disability and improvement in patients with
chronic LBP may be related to the increased influence
of psychosocial factors in these individuals. In our study,
the correlation was larger for the modified OSW, indi-
cating a greater relationship between the change scores
of the modified OSW and an external criterion of
change. Scales with greater responsiveness will require
smaller sample sizes to achieve a given level of statistical
power in experimental studies,
10
making the modified
OSW more attractive for use as an outcome measure.
We examined the meaningfulness of change from both
statistical and clinical perspectives. There is general
agreement that statistically meaningful change is best
assessed by calculating the SEM, because it is expressed
in the same metric as the measurement being used and
because it represents the standard error in an observed
score that obscures the true score.
16,49
However, the
threshold defining statistically meaningful change based
on the SEM has varied. Some authors
12,18
have recom-
mended multiplying the SEM by 1.96 to construct a 95%
CI to define statistically meaningful change. Other
authors have corrected the SEM for errors in the 2
measurements taken by multiplying by 公2, then multi-
plying by either 1.65 for a 90% CI
57
or 1.96 for a 95%
CI.
16,45
We used the correction method and a 90% CI as
advocated by Stratford et al
57
to compute statistically
meaningful change thresholds of 13 and 31 points for
the modified OSW and the QUE, respectively.
We believe it is reasonable to expect that the minimum
level of statistical change would be less than or equal to
the MCID. Other researchers
46,57,58
have speculated that
this may not necessarily be the case. Using the ROC
curves, we calculated MCID values of 6 and 15 points for
the modified OSW and the QUE, respectively. Both
values are less than the corresponding values for statis-
tically meaningful change as defined in our study. This
may be a result of the small sample size (n
⫽23) on which
the SEM confidence interval was based. Alternatively,
this result may reflect the stringency of the definition of
statistically meaningful change used in this and other
studies. Two recent reports
46,48
have indicated that a
1
⫺SEM criterion best approximated the MCID using the
Chronic Respiratory Disease Questionnaire in samples
of subjects with chronic obstructive pulmonary disease.
Although tested only with one questionnaire, the
authors speculated that the 1
⫺SEM criterion may most
closely approximate the MCID in other valid and reliable
quality-of-life questionnaires.
46,48
If this hypothesis were
to hold true, the MCID would always be smaller than
statistically meaningful change when the latter is calcu-
lated in the manner done in our study. We found
general concordance between the SEM and MCID values
for the modified OSW (5.4 versus 6 points) and the QUE
(13.1 versus 15 points). Our finding supports the
hypothesis that a 1
⫺SEM criterion may be most closely
related to the MCID. We contend that further research is
needed to identify the optimal methods for calculation
of statistical and clinical meaningfulness and to explore
the relationship between the 2 concepts.
Beurskens et al
25
used the ROC curve method and found
the MCID for the OSW to be 4 to 6 points, consistent
with the value calculated in our study. The MCID of the
QUE has not been reported previously. Our results
suggest that the MCID is within approximately 15 points.
The QUE demonstrated greater variability in subjects
whose status remained stable, deflating the ICC value
and reflecting a lack of specificity. Low specificity occurs
when false-positive results are relatively common (ie, as-
suming important change has occurred when it has not).
Knowledge of the high MCID of the QUE is important
for researchers when determining sample sizes for clin-
ical trials and for interpretation of clinical significance of
784 . Fritz and Irrgang
Physical Therapy . Volume 81 . Number 2 . February 2001

results of clinical trials using the QUE as an outcome
measure.
The increased variability of the QUE in the subjects with
stable LBP may be related to the response format of this
instrument. The modified OSW asks the patient to rate
his or her perceived level of disability for several funda-
mental tasks of daily living (eg, walking, sitting, standing,
lifting). The QUE asks the patient to rate his or her
perceived disability for more specific functional tasks
(eg, walking several miles, throwing a ball, moving a
chair). Patients may have more difficulty in accurately
judging their level of disability for tasks when these tasks
are not performed on a regular basis. Another differ-
ence between the scales is the time frame that the
patient is asked to use as a reference. The QUE asks the
patient to rate his or her ability to perform tasks today,
whereas the modified OSW does not specify a time frame
reference. It is possible that restricting patients to the
consideration of their condition on the day of complet-
ing the questionnaire may increase the variability of the
measurements. However, we believe that this is unlikely
because, in our experience, most patients tend to refer-
ence their current status whether or not they are specif-
ically directed to do so.
Conclusion
Our results indicate that the measurement properties of
the modified OSW are preferable to those of the QUE in
several areas. The test-retest reliability over a 4-week
period was higher for the modified OSW than for the
QUE. The modified OSW was more responsive than the
QUE as assessed by GRI and in correlations between
change scores and the global rating of change. The
MCID for the modified OSW was approximately 6
points, which is consistent with other reports in the
literature. The MCID for the QUE was about 15 points.
Clinicians and researchers need to be aware of the
measurement properties of disability scales when judg-
ing patient outcomes or designing clinical trials.
References
1
Deyo RA. Measuring the functional status of patients with low back
pain. Arch Phys Med Rehabil. 1988;69:1044 –1053.
2
Deyo RA, Battie M, Beurskens AJ, et al. Outcome measures for low
back pain research: a proposal for standardized use. Spine.
1998;23:2003–2013.
3
Beurskens AJ, de Vet HC, Koke AJ, et al. Measuring the functional
status of patients with low back pain: assessment of the quality of four
disease-specific questionnaires. Spine. 1995;20:1017–1028.
4
Kopec JA, Esdaile JM, Abrahamowicz M, et al. The Quebec Back Pain
Disability Scale: conceptualization and development. J Clin Epidemiol.
1996;49:151–161.
5
Kopec JA, Esdaile JM, Abrahamowicz M, et al. The Quebec Back Pain
Disability Scale: measurement properties. Spine. 1995;20:341–352.
6
Kopec JA, Esdaile JM. Spine update: functional disability scales for
back pain. Spine. 1995;20:1943–1949.
7
Kirshner B, Guyatt GH. A methodological framework for assessing
health indices. J Chronic Dis. 1985;38:27–36.
8
Deyo RA, Diehr P, Patrick DL. Reproducibility and responsiveness of
health status measures: statistics and strategies for evaluation. Control
Clin Trials. 1991;12(suppl 4):142S–158S.
9
Stratford PW, Binkley JM, Riddle DL. Health status measures:
strategies and analytic methods for assessing change scores. Phys Ther.
1996;76:1109 –1123.
10
Guyatt GH, Walter S, Norman G. Measuring change over time:
assessing the usefulness of evaluative instruments. J Chronic Dis.
1987;40:171–178.
11
Deyo RA, Centor RM. Assessing the responsiveness of functional
scales to clinical change: an analogy to diagnostic test performance.
J Chronic Dis. 1986;39:897–906.
12
Jacobson NS, Follette WC, Revenstorf D. Psychotherapy outcome
research: methods for reporting variability and evaluating clinical
significance. Behav Ther. 1984;15:336 –352.
13
Stratford PW, Binkley JM, Riddle DL, Guyatt GH. Sensitivity to
change of the Roland Morris Back Pain Questionnaire: part 1. Phys
Ther. 1998;78:1186 –1196.
14
Fortin PR, Stucki G, Katz JN. Measuring relevant change: an
emerging challenge in rheumatologic clinical trials. Arthritis Rheum.
1995;38:1027–1030.
15
Lydick E, Epstein RS. Interpretation of quality of life changes. Qual
Life Res. 1993;2:221–226.
16
Roebroeck ME, Harlaar J, Lankhorst GJ. The application of gener-
alizability theory to reliability assessment: an illustration using isomet-
ric force measurements. Phys Ther. 1993;73:386 – 401.
17
Wilson RW, Gieck JH, Gansneder BM, et al. Reliability and respon-
siveness of disablement measures following acute ankle sprains among
athletes. J Orthop Sports Phys Ther. 1998;27:348 –355.
18
He´bert R, Spiegelhalter DJ, Brayne C. Setting the minimal metri-
cally detectable change on disability rating scales. Arch Phys Med Rehabil.
1997;78:1305–1308.
19
Stratford PW, Binkley JM, Solomon P, et al. Defining the minimum
level of detectable change for the Roland-Morris questionnaire. Phys
Ther. 1996;76:359 –365.
20
Sawrie SM, Marson DC, Boothe AL, Harrell LE. A method for
assessing clinically relevant individual cognitive change in older adult
populations. J Gerontol B Psychol Sci Soc Sci. 1999;54:P116 –P124.
21
Redelmeier DA, Guyatt GH, Goldstein RS. Assessing the minimal
important difference in symptoms: a comparison of two techniques.
J Clin Epidemiol. 1996;49:1215–1219.
22
Detsky AS, Sackett DL. When was a “negative” clinical trial big
enough? How many patients you needed depends on what you found.
Arch Intern Med. 1985;145:709 –712.
23
Guyatt GH, Juniper EF, Walter SD, et al. Interpreting treatment
effects in randomised trials. BMJ. 1998;316:690 – 693.
24
Juniper EF, Guyatt GH, Willan A, Griffith LE. Determining a
minimal important change in a disease-specific Quality of Life Ques-
tionnaire. J Clin Epidemiol. 1994;47:81– 87.
25
Beurskens AJ, de Vet HC, Koke AJ. Responsiveness of functional
status in low back pain: a comparison of different instruments. Pain.
1996;65:71–76.
26
Norman GR, Stratford PW, Regehr G. Methodological problems in
the retrospective computation of responsiveness to change: the lesson
of Cronbach. J Clin Epidemiol. 1997;50:869 – 879.
Physical Therapy . Volume 81 . Number 2 . February 2001
Fritz and Irrgang . 785
ўўўўўўўўўўўўўўўўўўўўўўўўўўў
ў

27
Westaway MD, Stratford PW, Binkley JW. The Patient-Specific
Functional Scale: validation of its use in persons with neck dysfunction.
J Orthop Sports Phys Ther. 1998;27:331–338.
28
Chatman AB, Hyams SP, Neel JM, et al. The Patient-Specific Func-
tional Scale: measurement properties in patients with knee dysfunc-
tion. Phys Ther. 1997;77:820 – 829.
29
Jaeschke R, Singer J, Guyatt GH. Measurement of health status:
ascertaining the minimal clinically important difference. Control Clin
Trials. 1989;10:407– 415.
30
Beaton DE, Hogg-Johnson S, Bombardier C. Evaluating changes in
health status: reliability and responsiveness of five generic health status
measures in workers with musculoskeletal disorders. J Clin Epidemiol.
1997;50:79 –93.
31
Stratford PW, Binkley JM, Solomon P, et al. Assessing change over
time in patients with low back pain. Phys Ther. 1994;74:528 –533.
32
van der Windt DA, van der Heijden JM, de Winter AF, et al. The
responsiveness of the Shoulder Disability Questionnaire. Ann Rheum
Dis. 1998;57:82– 87.
33
Stratford PW, Levy DR. Assessing valid change over time in patients
with lateral epicondylitis at the elbow. Clin J Sports Med. 1994;4:88 –91.
34
Fairbank JC, Couper J, Davies JB, O’Brien JP. The Oswestry Low
Back Pain Disability Questionnaire. Physiotherapy. 1980;66:271–273.
35
Hudson-Cook N, Tomes-Nicholson K, Breen A. A revised Oswestry
disability questionnaire. In: Roland MO, Jenner JR, eds. Back Pain: New
Approaches to Rehabilitation and Education. New York, NY: Manchester
University Press; 1989:187–204.
36
Waddell G, Somerville D, Henderson I, Newton M. Objective
clinical evaluation of physical impairment in chronic low back pain.
Spine. 1992;17:617– 628.
37
Shrout PE, Fleiss JL. Intraclass correlations: uses in assessing rater
reliability. Psychol Bull. 1979;86:420 – 426.
38
Eliasziw M, Young SL, Woodbury MG, Fryday-Field K. Statistical
methodology for the concurrent assessment of interrater and
intrarater reliability: using goniometric measurements as an example.
Phys Ther. 1994;74:777–788.
39
Simel DL, Samsa GP, Matchar DB. Likelihood ratios with confi-
dence: sample size estimation for diagnostic test studies. J Clin Epide-
miol. 1991;44:763–770.
40
Hanley JA, McNeil BJ. The meaning and use of the area under a
receiver operating characteristic (ROC) curve. Radiology. 1982;143:
29 –36.
41
Hanley JA, McNeil BJ. A method of comparing the areas under
receiver operating characteristic curves derived from the same cases.
Radiology. 1983;148:839 – 843.
42
Tuley MR, Mulrow CD, McMahan CA. Estimating and testing an
index of responsiveness and the relationship of the index to power.
J Clin Epidemiol. 1991;44:417– 421.
43
Meng X, Rosenthal R, Rubin DB. Comparing correlated correlation
coefficients. Psychol Bull. 1992;111:172–175.
44
Stratford PW, Goldsmith CH. Use of the standard error as a
reliability index of interest: an applied example using elbow flexor
strength data. Phys Ther. 1997;77:745–750.
45
McHorney CA, Tarlov AR. Individual-patient monitoring in clinical
practice: Are available health status surveys adequate? Qual Life Res.
1995;4:293–307.
46
Wyrwich KW, Nienaber NA, Tierney WM, Wolinsky FD. Linking
clinical relevance and statistical significance in evaluating intra-
individual changes in health-related quality of life. Med Care. 1999;37:
469 – 478.
47
Nunnally JC, Bernstein IH. Psychometric Theory. New York, NY:
McGraw-Hill; 1994.
48
Wyrwich KW, Tierney WM, Wolinsky FD. Further evidence support-
ing an SEM-based criterion for identifying meaningful intra-individual
changes in health-related quality of life. J Clin Epidemiol. 1999;52:
861– 873.
49
Anastasi A, Urbina S. Psychological Testing. 7th ed. Upper Saddle
River, NJ: Prentice-Hall; 1997:133–135.
50
Ravaud P, Giraudeau B, Auleley GR, et al. Assessing smallest detect-
able change over time in continuous structural outcome measures:
application to rediological change in knee osteoarthritis. J Clin Epide-
miol. 1999;52:1225–1230.
51
Redelmeier DA, Bayoumi AM, Goldstein RS, Guyatt GH. Interpret-
ing small differences in functional status: the Six Minute Walk Test in
chronic lung disease patients. Am J Respir Crit Care Med. 1997;155:
1278 –1282.
52
Riddle DL, Stratford PW, Binkley JM. Sensitivity to change of the
Roland-Morris Back Pain Questionnaire: part 2. Phys Ther. 1998;78:
1197–1207.
53
Delitto A. Are measures of function and disability important in low
back care? Phys Ther. 1994;74:452– 462.
54
Jette AM. Physical disablement concepts for physical therapy
research and practice. Phys Ther. 1994;74:380 –386.
55
Triano JJ, McGregor M, Hondras MA, Brennan PC. Manipulative
therapy versus education programs in chronic low back pain. Spine.
1995;20:948 –955.
56
Schoppink LE, van Tulder MW, Koes BW, et al. Reliability and
validity of the Dutch adaptation of the Quebec Back Pain Disability
Scale. Phys Ther. 1996;76:268 –275.
57
Stratford PW, Finch E, Solomon P, et al. Using the Roland-Morris
Questionnaire to make decisions about individual patients. Physiother-
apy Canada. 1996;48:107–110.
58
Riddle DL. Invited commentary on “Defining the minimum level of
detectable change for the Roland-Morris questionnaire.” Phys Ther.
1996;76:366 –367.
786 . Fritz and Irrgang
Physical Therapy . Volume 81 . Number 2 . February 2001

Appendix 1.
Modified Oswestry Low Back Pain Disability Questionnaire
a
This questionnaire has been designed to give your therapist information as to how your back pain has affected your ability to manage in
everyday life. Please answer every question by placing a mark in the one box that best describes your condition today. We realize you may
feel that 2 of the statements may describe your condition, but please mark only the box that most closely describes your current
condition.
Pain Intensity
I can tolerate the pain I have without having to use pain
medication.
The pain is bad, but I can manage without having to take pain
medication.
Pain medication provides me with complete relief from pain.
Pain medication provides me with moderate relief from pain.
Pain medication provides me with little relief from pain.
Pain medication has no effect on my pain.
Personal Care (eg, Washing, Dressing)
I can take care of myself normally without causing increased pain.
I can take care of myself normally, but it increases my pain.
It is painful to take care of myself, and I am slow and careful.
I need help, but I am able to manage most of my personal care.
I need help every day in most aspects of my care.
I do not get dressed, wash with difficulty, and stay in bed.
Lifting
I can lift heavy weights without increased pain.
I can lift heavy weights, but it causes increased pain.
Pain prevents me from lifting heavy weights off the floor, but I can
manage if the weights are conveniently positioned (eg, on a
table).
Pain prevents me from lifting heavy weights, but I can manage
light to medium weights if they are conveniently positioned.
I can lift only very light weights.
I cannot lift or carry anything at all.
Walking
Pain does not prevent me from walking any distance.
Pain prevents me from walking more than 1 mile.
b
Pain prevents me from walking more than
1
⁄
2
mile.
Pain prevents me from walking more than
1
⁄
4
mile.
I can only walk with crutches or a cane.
I am in bed most of the time and have to crawl to the toilet.
Sitting
I can sit in any chair as long as I like.
I can only sit in my favorite chair as long as I like.
Pain prevents me from sitting for more than 1 hour.
Pain prevents me from sitting for more than
1
⁄
2
hour.
Pain prevents me from sitting for more than 10 minutes.
Pain prevents me from sitting at all.
Standing
I can stand as long as I want without increased pain.
I can stand as long as I want, but it increases my pain.
Pain prevents me from standing more than 1 hour.
Pain prevents me from standing more than
1
⁄
2
hour.
Pain prevents me from standing more than 10 minutes.
Pain prevents me from standing at all.
Sleeping
Pain does not prevent me from sleeping well.
I can sleep well only by using pain medication.
Even when I take pain medication, I sleep less than 6 hours.
Even when I take pain medication, I sleep less than 4 hours.
Even when I take pain medication, I sleep less than 2 hours.
Pain prevents me from sleeping at all.
Social Life
My social life is normal and does not increase my pain.
My social life is normal, but it increases my level of pain.
Pain prevents me from participating in more energetic activities
(eg, sports, dancing)
Pain prevents me from going out very often.
Pain has restricted my social life to my home.
I have hardly any social life because of my pain.
Traveling
I can travel anywhere without increased pain.
I can travel anywhere, but it increases my pain.
My pain restricts my travel over 2 hours.
My pain restricts my travel over 1 hour.
My pain restricts my travel to short necessary journeys under
1
⁄
2
hour.
My pain prevents all travel except for visits to the
physician/therapist or hospital.
Employment/Homemaking
My normal homemaking/job activities do not cause pain.
My normal homemaking/job activities increase my pain, but I can
still perform all that is required of me.
I can perform most of my homemaking/job duties, but pain
prevents me from performing more physically stressful activities
(eg, lifting, vacuuming).
Pain prevents me from doing anything but light duties.
Pain prevents me from doing even light duties.
Pain prevents me from performing any job or homemaking chores.
a
Modified by permission of The Chartered Society of Physiotherapy from Fairbanks JCT, Couper J, Davies JB, et al. The Oswestry Low Back Pain Disability
Quesionnaire. Physiotherapy. 1980;66:271–273.
b
1 mile
⫽1.6 km.
Physical Therapy . Volume 81 . Number 2 . February 2001
Fritz and Irrgang . 787
ўўўўўўўўўўўўўўўўўўўўўўўўўўў
ў

Appendix 2.
Quebec Back Pain Disability Scale
a
This questionnaire is about the way your back pain affects your daily life. People with back problems may find it difficult to perform some of their
daily activities. We would like to know if you find it difficult, because of your back, to perform any of the activities listed below. For each activity
there is a scale that ranges from 0 (not difficult at all) to 5 (unable to do). Please choose the one response for each activity that best describes
your current condition and place a check mark in the appropriate box. Please answer all of the questions.
Because of your back problems,
how difficult do you find it today to . . .
Not Difficult
at All
Minimally
Difficult
Somewhat
Difficult
Fairly
Difficult
Very
Difficult
Unable
to Do
Get out of bed?
Sleep through the night?
Turn over in bed?
Ride in a car?
Stand up for 20 to 30 minutes?
Sit in a chair for several hours?
Climb one flight of stairs?
Walk a few blocks?
Walk several miles?
Reach up to high shelves?
Throw a ball?
Run one block?
Take food out of the refrigerator?
Make your bed?
Put on socks or pantyhose?
Bend over to clean the bathtub?
Move a chair?
Pull or push heavy doors?
Carry two bags of groceries?
Lift and carry a heavy suitcase?
a
Reprinted by permission of Lippincott Williams & Wilkins from Kopec JA, Esdaile JM, Abrahamowicz M, et al. The Quebec Back Pain Disability Scale:
measurement properties. Spine. 1995;20:1943–1949.
788 . Fritz and Irrgang
Physical Therapy . Volume 81 . Number 2 . February 2001
Wyszukiwarka
Podobne podstrony:
A Comparison of the Fight Scene in?t 3 of Shakespeare's Pl (2)
Comparison of the Russians and Bosnians
A Comparison of the Status of Women in Classical Athens and E
Comparison of the U S Japan and German British Trade Rivalr
12 Angry Men Comparison of the Movie and Play
Begault Direct comparison of the impact of head tracking, reverberation, and individualized head re
Wind Turbine Design Codes A Preliminary Comparison of the Aerodynamics
In the Flesh The Cultural Politics of Body Modification
[60]Selective degradation of oxidatively modified protein substrates by the proteasome
The comparison of two different forms of?vertisement
Alta J LaDage Occult Psychology, A Comparison of Jungian Psychology and the Modern Qabalah
Assessment of Borderline Pathology Using the Inventory of Interpersonal Problems Circumplex Scales (
Sandra Marco Colino Vertical Agreements and Competition Law, A Comparative Study of the EU and US R
the comparison of superiority practice key
A randomized, controlled comparative study of the wrinkle reduction benefits of a cosmet
Gade, Lisa, Lynge, Rindel Roman Theatre Acoustics; Comparison of acoustic measurement and simulatio
Comparative Analyses of the Bacterial Microbiota of the Human Nostril and Oropharynx
więcej podobnych podstron