
Course name: Corporate Finance
Textbook: Ross, Westerfield, Corporate Finance; Brealey, Myers: Principles of Corporate Finance
Objective: To provide students with knowledge of the fundamentals of modern corporate finance
theory and practice with an emphasis on value creation.
The course structure: The course consists of 30hrs of lectures plus 15hrs of workshops; workshops
will be case-driven with materials available for home study before the workshops; each course
participant will have opportunity to prepare a presentation based on any financial press article
(Financial Times, Wall Street Journal etc.) with the task to identify any relevant link to the course
material.
The course topics:
1. Introduction to corporate finance; firm’s objectives; owners vs. other stakeholders; operating
vs. financial activities.
2. Financial statements: balance sheet, profit and loss account, cash flow statements;
3. Managerial financial statements; invested capital; net operating profit after tax; interest tax
saving.
4. Annual financial performance evaluation; return on invested capital (ROIC, ROCE); Dupont
analysis, ratio analysis.
5. Working capital management; liquidity vs. capital requirement; working capital financing
strategies.
6. Time value of money; nominal vs. real interest rates; simple and compound interest; present
and future values; annuity.
7. Bond valuation; types of debt financing; yield to maturity; credit rating; bond price
determinants.
8. Equity valuation; EPS; DPS; retention and payout ratios; dividend discount models; PER
valuation.
9. Enterprise valuation; free cash flows; cost of capital; real options.
10. Investment appraisal; incremental cash flows; NPV rule; project’s rate of return rule; ARR;
profitability index.
11. Internal rate of return; IRR vs. NPV; other investment appraisal methods; taxation and
inflation; capital rationing.
12. Risk-return trade off; decision trees; sensitivity and simulation; portfolio theory; CAPM.
13. Weighted average cost of capital (WACC); operating vs. financial leverage; ROE and ROIC vs.
financial leverage.
14. Cost of capital vs. enterprise value; Miller-Modigliani models.
About instructor
Tomasz Berent, PhD in Finance and MA in Banking and Finance from University of Wales, UK; MA in
Economics from Warsaw School of Economics (WSE), Poland.
Lectures in finance and investment at WSE – Top 10 WSE Lecturer; faculty member in prestigious
international postgraduate programmes: e.g. CEMS MIM in cooperation with some 30 leading

institutions worldwide; Warsaw Executive MBA (in co-operation with University of Minnesota, US) –
Outstanding WEMBA Faculty Awards every year since the Award was launched; Executive Studies in
Finance (in co-operation with Ernst and Young). Also lectured in the UK at University of Wales (1992-
1995), University of Bangor (2009), and University of Sussex (2010).
An advisor/expert to Polish Financial Supervision Authority; professional experience includes
executive positions in investment banking sector (incl. Chief Strategist for Emerging Markets at BNP
Paribas in London, Head of Research at Investment Bank Austria in Warsaw); over 100 equity reports
(in English) on valuation and sector analysis on Polish and other Emerging Markets companies.

Dr Tomasz Berent
GAAP BALANCE SHEET
ASSETS
EQUITY AND LIABILITIES
Current assets
Liabilities
Cash
Short-term liabilities
Marketable securities
Short-term debt
Receivables
Payables
Inventories
Other short term liabilities
Other current assets
Long-term liabilities
Fixed assets
Long-term debt
Intangible
Other long-term liabilities
Tangible
Owners’ equity
Investments
Common equity
Other fixed assets
Preferred stock

Dr Tomasz Berent
CURRENT ASSETS
Cash
Cash equivalents (marketable securities, e.g. T-bills, CPs)
Accounts receivable
(receivables, trade receivables, debtors, trade debtors)
Inventories
o Raw materials
o Work in process
o Finished goods
Other current assets (e.g. prepaid expenses)

Dr Tomasz Berent
FIXED ASSETS
Intangible assets (e.g. patents, trademarks, goodwill)
Tangible assets
o Property
o Plant
o Equipment
Investments (e.g. real estate, financial assets)

Dr Tomasz Berent
LIABILITIES
Short-term (current) liabilities
o Short-term debt
(e.g. overdrafts, line of credit, promissory notes)
o Accounts payable
(payables, trade payables, creditors, trade creditors)
o Other short-term liabilities
(e.g. accrued expenses such as wage, taxes, Social Security)
Long-term (noncurrent) liabilities
o Long-term debt
o Other long-term liabilities
(e.g. deferred taxes, pension liabilities)

Dr Tomasz Berent
STOCKHOLDERS’ (OWNERS’) EQUITY
Common equity
o Paid-in capital
Common stock at par value
Capital surplus
o Accumulated retained earnings
Preferred stock
Dr Tomasz Berent
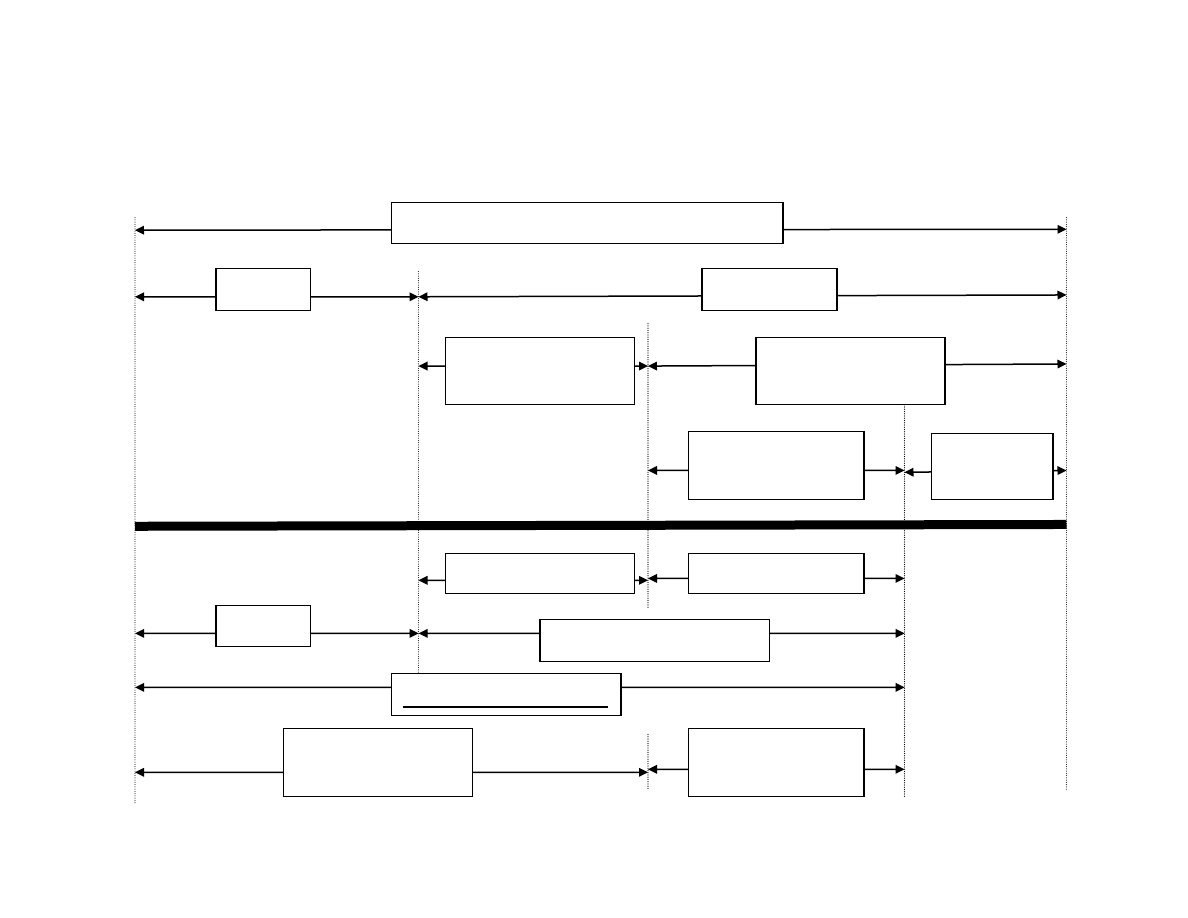
LIABILITIES AND STOCKHOLDERS’ EQUITY
Equity
Liabilities
Liabilities and stockholders’ equity
Long-term
liabilities*
Long-term
financing
Short-term
liabilities
Short-term debt
Debt
Capital employed**
*We assume l
ong-term liabilities=long-term debt
**This will later be adjusted for surplus cash
Long-term debt
Short-term
financing
Equity
Interest bearing
liabilities
Other s-t
liabilities
Dr Tomasz Berent
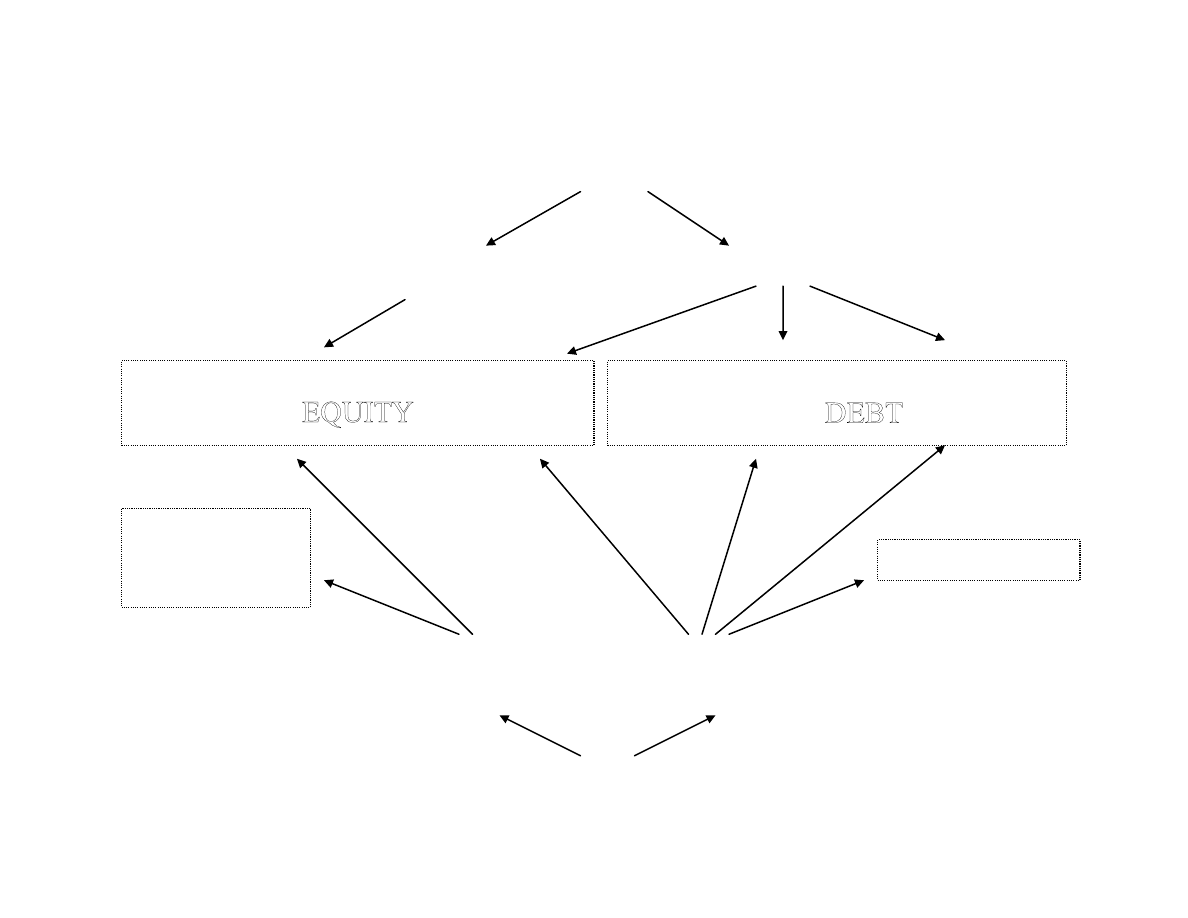
SOURCES OF CAPITAL
Internal
External
Bond issue
Bank loan
D
D
E
E
B
B
T
T
Retained earnings
New equity issue
E
E
Q
Q
U
U
I
I
T
T
Y
Y
SOURCES OF CASH
Internal
External
Depreciation
Cash surplus
Asset sale
Payables

Dr Tomasz Berent
INCOME STATEMENT
Sales (revenue, turnover)
– Cost of goods sold (COGS, e.g. materials, wages, depreciation)
Gross profit
– Selling, general and administrative expenses (SG&A)
+/–
Other operating income/ cost
Net operating profit (NOP,
Earnings before interest and taxes,
EBIT)
– Net interest expense
Pre-tax profit
– Income tax expense
Net income (net profit, bottom line)
–
Dividends
Retained earnings

Dr Tomasz Berent
THE STATEMENT OF CASH FLOWS
Cash flows from operating activities
o Cash operating earnings
o Change in working capital
Cash flows from investing activities
o CAPEX & acquisitions
o Sale of fixed assets
Cash flows from financing activities
o New equity & new debt
o Repurchase of stock & debt repayment
o Dividends paid & interest payment

Dr Tomasz Berent
CASH FLOWS FROM OPERATING ACTIVITIES
Cash operating earnings
+ Earnings before interest and taxes (EBIT, NOP)
+ Depreciation
– Taxes
+/– Change in working capital
– Increase in inventories
– Increase in receivables
+ Increase in payables

Dr Tomasz Berent
MANAGERIAL BALANCE SHEET (1)
ASSETS
EQUITY AND LIABILITIES
Current assets
Liabilities
Cash
Short-term liabilities
Marketable securities
Short-term debt
Receivables
Payables
Inventories
Other short term liabilities
Other current assets
Long-term liabilities
Fixed assets
Long-term debt
Intangible
Other long-term liabilities
Tangible
Owners’ equity
Investments
Common equity
Other fixed assets
Preferred stock

Dr Tomasz Berent
MANAGERIAL BALANCE SHEET (2)
NET ASSETS
CAPITAL EMPLOYED
Cash
Net debt
Working capital requirement
Net short-term debt
+Receivables
+Short-term debt
+Inventories
–Marketable securities
–Payables
Long-term debt
+/– Net other current assets
Net fixed assets
Owners’ equity
+Intangible
+Tangible
+Investments
+/–Net other fixed assets

Dr Tomasz Berent
MANAGERIAL BALANCE SHEET (3)
NET ASSETS
CAPITAL EMPLOYED
Working capital requirement (WCR) Net debt
+Operating current assets
Net short-term debt
–Non-interest bearing liabilities
Long-term debt
Net fixed assets
Owners’ equity
Net assets ≡ Invested capital = Capital employed

Dr Tomasz Berent
NET OPERATING PROFIT AFTER TAX (NOPAT)
NOPAT = NOP – Taxes on NOP
Taxes on NOP = Income taxes + Interest tax saving
Interest tax saving = Net interest expense
Marginal tax rate

Dr Tomasz Berent
DUPONT SYSTEM
Owners’ equity
Capital employed Net assets Sales Operating profit
Net income
ROIC
capital
Invested
NOP
Sales
NOP
capital
Invested
Sales
ROIC
AT
Sales
NOPAT
capital
Invested
Sales

Dr Tomasz Berent
MANAGING INVESTED CAPITAL
How much sales is generated by asset X, or
how much of asset X is required to generate sales X
X
Asset
Sales
X
ratio
Turnover
The higher the ratio, the better!
Turnover ratios, or activity, efficiency, rotation ratios

Dr Tomasz Berent
TURNOVER RATIOS
assets
Net
Sales
turnover
asset
Net
WCR
Sales
turnover
t
requiremen
capital
Working

Dr Tomasz Berent
WCR-RECEIVABLES
ceivables
Sales
turnover
ceivables
Re
Re
turnover
ceivables
Sales
ceivables
sales
Daily
ceivables
period
collection
Average
Re
365
365
Re
Re

Dr Tomasz Berent
WCR-INVENTORIES
s
Inventorie
sold
goods
of
Cost
turnover
Inventory
turnover
Inventory
COGS
s
Inventorie
COGS
Daily
s
Inventorie
inventory
in
Days
365
365

Dr Tomasz Berent
WCR-PAYABLES
Payables
COGS
turnover
Payables
turnover
Paybales
COGS
Payables
COGS
Payables
period
payment
Average
365
365

Dr Tomasz Berent
MANAGING OPERATING EXPENSES
Sales
item
Cost
in
m
ofit
1
arg
Pr
Examples:
1.Gross margin
2.Operating margin

Dr Tomasz Berent
RATIOS - SUMMARY
Turnover ratios (e.g. Net asset, WCR, Inventory turnovers)
Profitability ratios (e.g. ROIC, margins, ROA, ROE)
Liquidity (solvency) ratios (e.g. Current ratio, Quick ratio)
Financial leverage ratios (e.g. Debt, Debt-to-equity ratios)
Market value ratios (e.g. EPS, P/E, P/BV, Dividend yield)

COMPOUNDING PERIODS
Future value of $1,000 at the end of T periods,
r
A
– stated annual interest rate, compounding m times
Compounding
Monthly
m=12
Years
r
A
\ T
1
2
5
10
20
10%
1,105
1,220
1,645
2,707
7,328
20%
1,219
1,487
2,696
7,268
52,828
40%
1,482
2,197
7,152 51,151 2,616,408
Annually
m=1
Years
r
A
\ T
1
2
5
10
20
10%
1,100
1,210
1,611
2,594
6,727
20%
1,200
1,440
2,488
6,192
38,338
40%
1,400
1,960
5,378 28,925
836,683
Difference
Years
r
A
\ T
1
2
5
10
20
10%
5
10
35
113
601
20%
19
47
208
1,077
14,490
40%
82
237
1,774 22,225 1,779,725

CONTINUOUS COMPOUNDING
r
efec
vs. r
A
and m
r
A
10.0% 20.0% 50.0% 100.0%
m=1
10.0% 20.0%
50%
100%
m=2
10.3% 21.0%
56%
125%
m=4
10.4% 21.6%
60%
144%
m=12
10.5% 21.9%
63%
161%
m=+
10.5% 22.1%
65%
172%
r
A
vs. r
efec
and m
r
efec
10.0% 20.0% 50.0% 100.0%
m=1
10.0% 20.0%
50%
100%
m=2
9.8% 19.1%
45%
83%
m=4
9.6% 18.7%
43%
76%
m=12
9.6% 18.4%
41%
71%
m=+
9.5% 18.2%
41%
69%

Dr Tomasz Berent
BOND VALUATION
T -
Maturity date (maturity)
F -
Face (redemption, par, principal) value
c -
Coupon rate
y -
Yield to maturity (YTM)
PV -
Bond price
y’ - Current yield
EXAMPLE
A 5-year coupon bond with a face value of $1,000, the
coupon rate of 10%, paid annually, YTM=12.0%
PV<$1,000 ($928, or 92.8%) and y’=10.8%
Dr Tomasz Berent
BOND VALUATION
Pure discount bonds (zero-coupon, zeros, bullets)
T
y
F
PV
)
1
(
c=0%
F=$1,000
T=2
T=5
T=10
y=7%
873.4
713.0
508.3
y=10%
826.4
620.9
385.5
y=13%
783.1
542.8
294.6
Coupon bonds (level-coupon), C = c
F
T
for
y
C
PV
y
F
y
y
C
PV
T
T
)
1
(
)
1
(
1
1
c=10%
F=$1,000
T=2
T=5
T=10
T=
y=7%
1054.2 1123.0 1210.7 1428.1
y=10%
1000.0 1000.0 1000.0 1000.0
y=13%
950.0
894.5
837.2
769.2

Dr Tomasz Berent
BOND PRICE VS. INTEREST RATES
Bond prices move in an opposite direction to
interest rates
o Fall with a rise in interest rate
o Rise with a fall in interest rate
The longer maturity, the higher impact of
interest rate change on bond price
The larger the coupon, the lower impact of
interest rate change on bond price
Bond price (PV) vs. Face value (F)
c < y PV < F Bond sells at a discount
c = y PV = F Bond sells at the face value
c > y PV > F Bond sells at a premium

DIVIDEND PAYMENT VS. GROWTH
r
ROE
d
d
r
EPS
g
r
div
P
G
)
1
(
0
WARNING:
1. DO NOT USE UNCRITICALLY THE FORMULA FOR
FIRMS PAYING NO DIVIDEND. They are NOT worthless!
2. DO NOT USE THE FORMULA FOR COMPANIES, WHERE
GROWTH g IS ASSUMED TO BE HIGHER THAN r.
Such companies simply do not exist! If they did they would be
priceless not worthless (i.e. their share prices, rather than being
negative as suggested by the formula, would approach infinity)
3. DO NOT SUBSTITUTE div WITH EPS IN THE FORMULA
Unless all earnings are paid as dividends, i.e. d=1 and therefore
EPS=div. However, in such case no growth should be assumed,
g=0.* (Using both EPS instead of div and g>0, you simply
double count!)
4. DO NOT FORGET g WHEN USING div
Otherwise, you assume all retained earnings are wasted!
5. NOTE:
Retention of earnings creates value (increases the share
price) only if the return on new projects exceeds required
rate of return (i.e. P
0
G
>P
0
NG
only if ROE>r)!
Dividends may continue to grow for a growth company
and yet P
0
G
<P
0
NG
! It is because dividends grow when
(1-d)>0 and ROE>0, while P
0
G
>P
0
NG
when (1-d)>0 and
ROE>r.

Dr Tomasz Berent
INTERNAL RATE OF RETURN, IRR
CFs
No of sign
change
No of IRR
Decision
NPV
EXAMPLE
r=20%
Decision
-+++
1
1
IRR>rACCEPT
IRR<rREJECT
NPV>0
NPV<0
-100,20,40,60
IRR=8.2% < r=20%
NPV= -20.8 <0
REJECT
REJECT
++----
1
1
IRR<rACCEPT
IRR>rREJECT
NPV>0
NPV<0
50,-10,-20,-30
IRR=8.2% < r=20%
NPV=10.4 > 0
ACCEPT
ACCEPT
+--+-
>1
?
NO RULE
?
-100,130,150,-191
IRR
1
=12.7%, IRR
2
=39.3%
NPV=2.0 > 0
???
ACCEPT
PROS:
A simple, intuitively appealing number
Relevant in sensitivity analysis
CONS:
No definite decision rule
Ignores scale (just as all percentage measures )
Cannot be used to compare two projects, even of the same scale

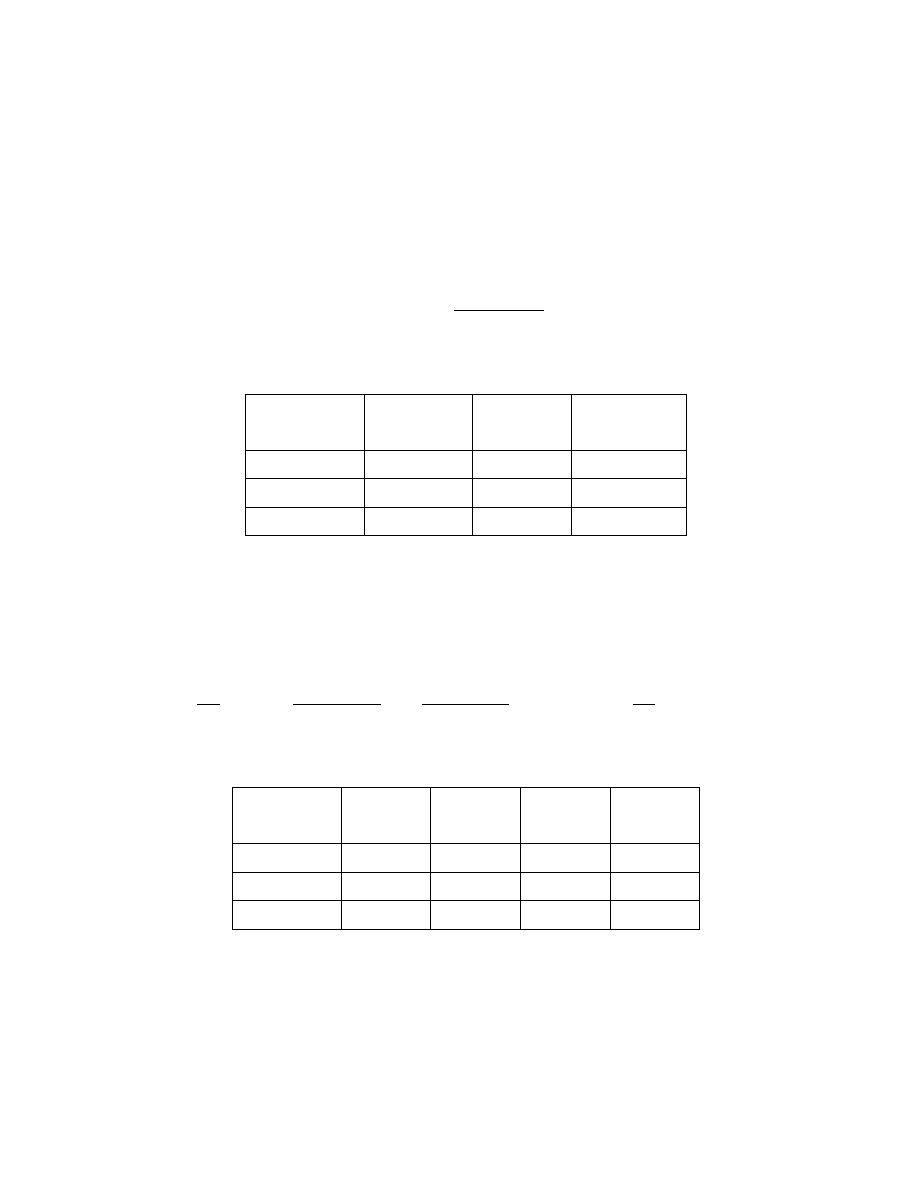
PROJECT APPRAISAL
NCFs for A, B, C, t=0,1,2,3,4 ($)
t
Project A
Project B Project C
Project B
–
Project A
Project B
–
Project C
Nominal
values
0
-1,000
-1,000
-500
0
-500
1
800
100
100
-700
0
2
400
300
200
-100
100
3
300
500
300
200
200
4
100
1,000
340
900
660
Discounted
values
0
-1,000
-1,000
-500
1
727
91
91
2
331
248
165
3
225
376
225
4
68
683
232
Project A Project B Project C
Project B
–
Project A
Project B
–
Project C
r
10%
10%
10%
NPV
351.5
397.5
213.8
46.0
183.7
PI
1.35
1.40
1.43
MIRR
18.6%
19.6%
20.2%
IRR
31.9%
22.4%
25.1%
12.6%
20.2%
ARR
15.0%
22.5%
22.0%
PP
1 6/12
3 1/12
2 8/12
DPP
1 10/12
3 5/12
3 1/12
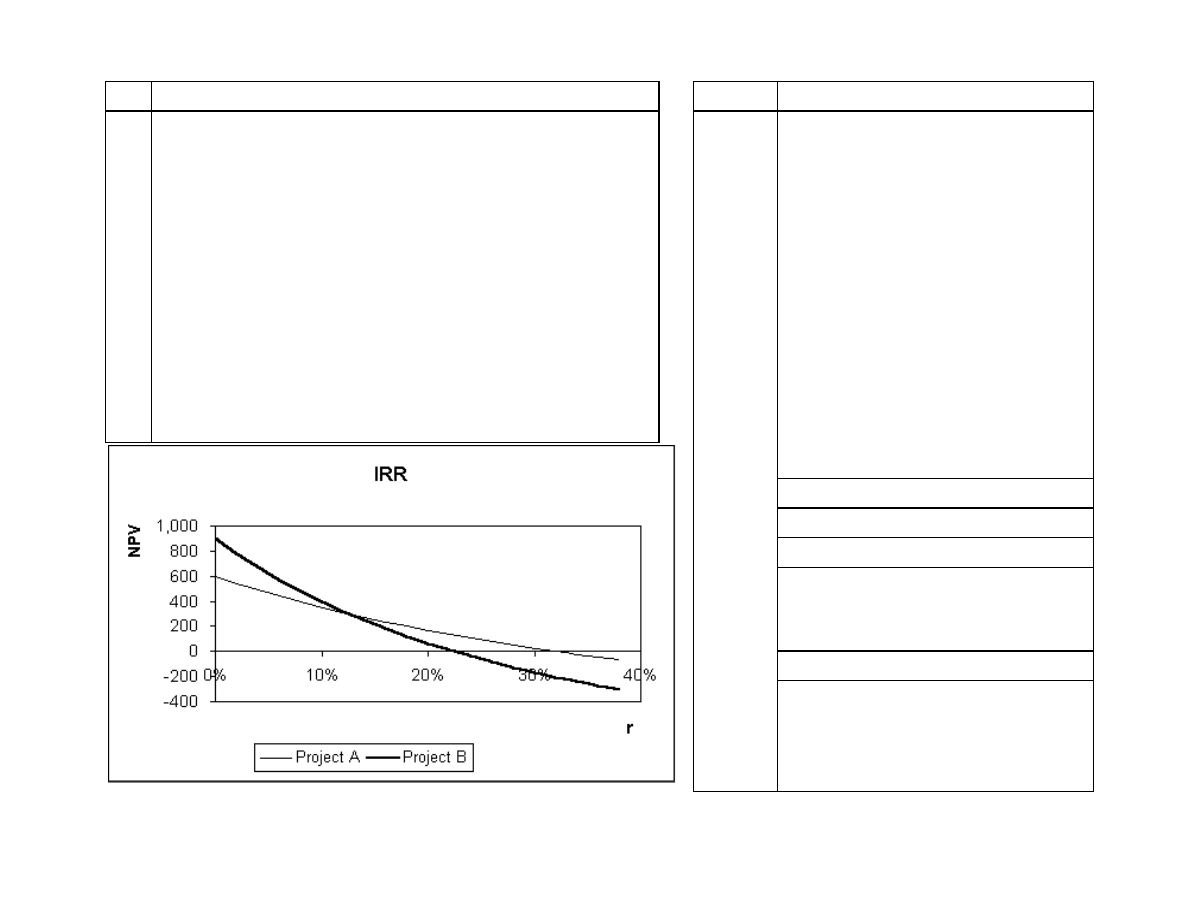
t
Project A Project B Project C
(B-A) (B-C)
r
NPV(A) NPV(B)
NPVC
Nominal values
0.0%
600
900
440
0
-1,000
-1,000
-500
0
-500
2.0%
544
781
387
1
800
100
100
-700
0
4.0%
491
673
338
2
400
300
200
-100
100
6.0%
442
573
294
3
300
500
300
200
200
8.0%
395
482
252
4
100
1000
340
900
660
10.0%
352
398
214
Discounted values
12.0%
310
320
178
0
-1,000
-1,000
-500
12.6%
299
299
169
1
727
91
91
14.0%
271
248
145
2
331
248
165
16.0%
234
182
115
3
225
376
225
18.0%
199
120
86
4
68
683
232
20.0%
166
63
60
22.0%
135
10
35
22.4%
0
24.0%
105
-39
12
25.1%
0
26.0%
77
-85
-10
28.0%
49
-128
-30
30.0%
24
-168
-49
31.9%
0
32.0%
-1
-205
-67
34.0%
-25
-240
-84
36.0%
-47
-273
-100
38.0%
-69
-304
-115
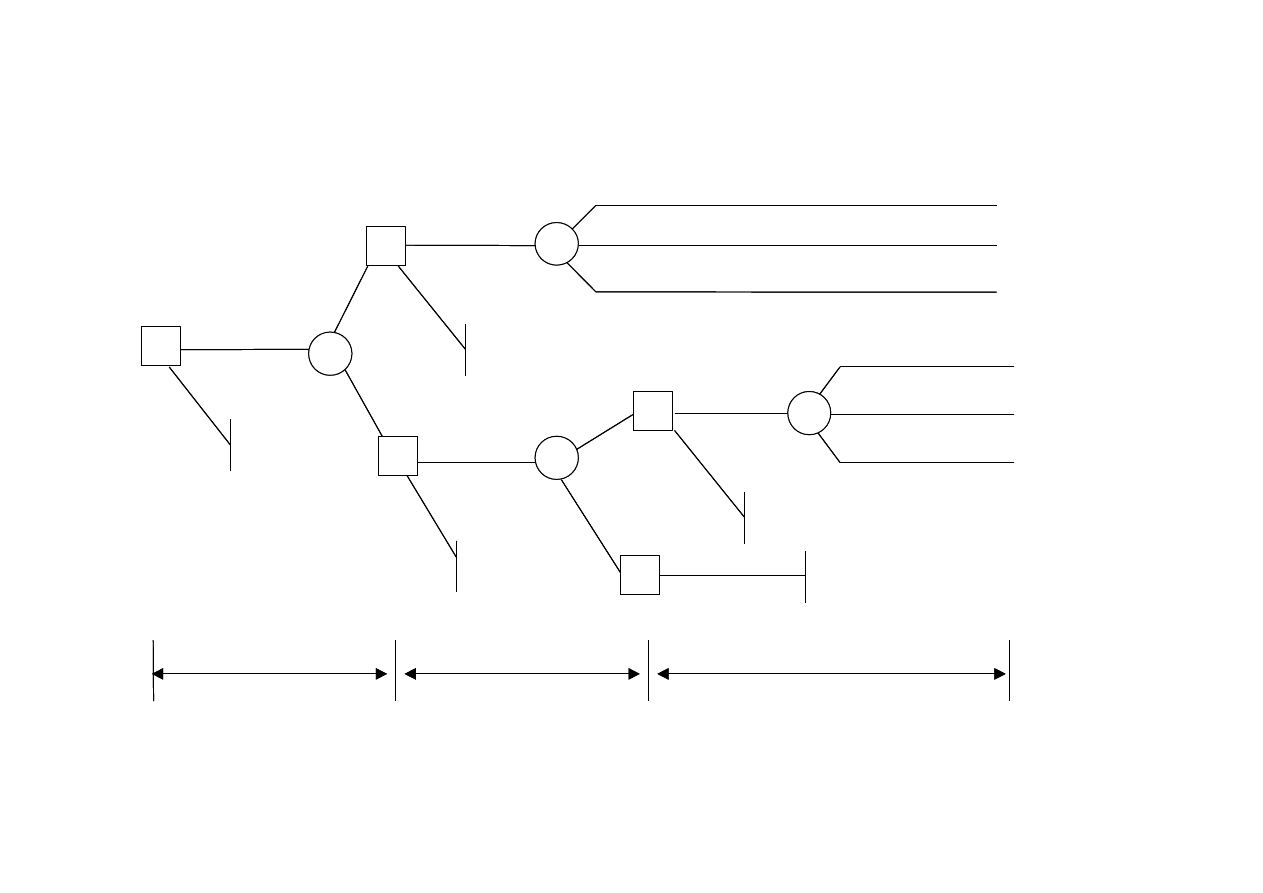
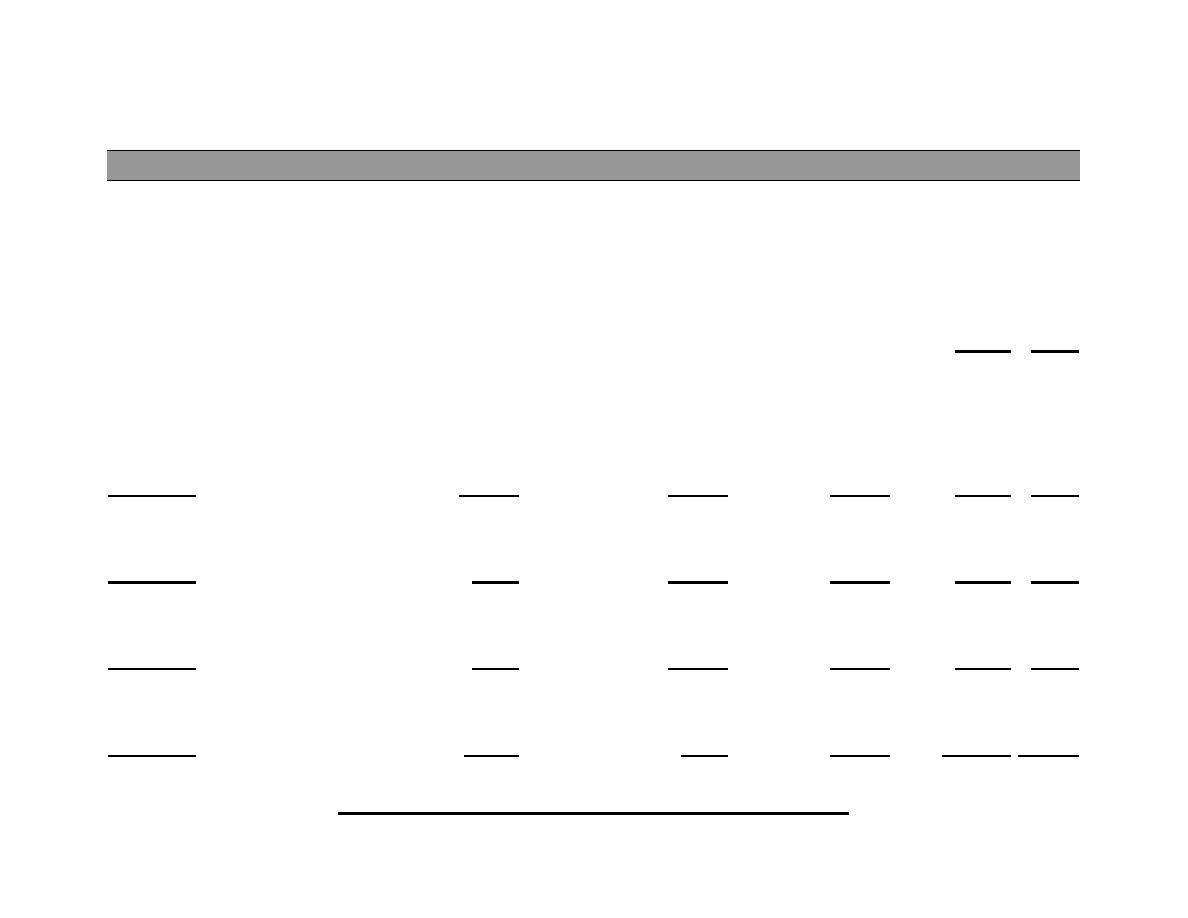
PV of
contribution
0.2 Sales high
0.3 Sales low
0.5 Sales medium
2 years
2 years
4 years
Abandon
Abandon
Abandon
Abandon
Abandon
0.1 high
0.4 low
0.5 medium
$1,600k
$800k
$400k
$1,200k
$600k
$300k
Market
product
Further
R & D
(cost $200k)
R & D
success
Market
product
late
(cost $400k)
R & D
success
R & D
failure
R & D
failure
0
0
0
0
0
0.5
0.5
0.3
0.7
1
3
2
2
B
A
C
D
R & D
3
PV of
contribution
0.2 Sales high
0.3 Sales low
0.5 Sales medium
2 years
2 years
4 years
Abandon
Abandon
Abandon
Abandon
Abandon
0.1 high
0.4 low
0.5 medium
Market
product
Further
R & D
R & D
success
Market
product
late
R & D
success
R & D
failure
R & D
failure
0
0
0
0
0
0.5
0.5
0.3
0.7
1
3
2
2
B
A
C
D
R & D
3

Dr Tomasz Berent
ROE and EPS vs. FINANCIAL LEVERAGE
D/E
IC
($)
Equity
($)
Debt
($)
Share
price ($)
No of
shares
NOP
($)
K
D
%
Fin. Cost
($)
Net
income* ($)
EPS
($)
ROE
(%)
0.00
500
500
0
10
50
100
10%
0
100
2.00 20.0%
0.25
500
400
100
10
40
100
10%
10
90
2.25 22.5%
1.00
500
250
250
10
25
100
10%
25
75
3.00 30.0%
1.50
500
200
300
10
20
100
10%
30
70
3.50 35.0%
* No taxes
ROE and EPS rise with financial leverage!!!
Dr Tomasz Berent
BUSINESS RISK
Recession
Expected
Boom
-chg +chg
Economic risk
Sales
300.0
500.0
700.0
-40% 40%
Variable costs
-180.0
-300.0
-420.0
Sales after variable costs
120.0
200.0
280.0
-40% 40%
Operational risk
Fixed costs (1)
0.0
0.0
0.0
NOP (1)
120.0
200.0
280.0
-40% 40%
Fixed costs (2)
-40.0
-40.0
-40.0
NOP (2)
80.0
160.0
240.0
-50% 50%
Fixed costs (3)
-100.0
-100.0
-100.0
NOP (3)
20.0
100.0
180.0
-80% 80%
Fixed costs (4)
-150.0
-150.0
-150.0
NOP (4)
-30.0
50.0
130.0
-160% 160%
Business risk (economic + operational risks)
Dr Tomasz Berent
FINANCIAL RISK
D/E Recession
Expected
Boom
-chg +chg
NOP (3)
20.0
100.0
180.0
-80% 80%
Interest expense (3.1)
0.00
0.0
0.0
0.0
Net income (3.1)
20.0
100.0
180.0
-80% 80%
Interest expense (3.2)
0.25
-10.0
-10.0
-10.0
Net income (3.2)
10.0
90.0
170.0
-89% 89%
Interest expense (3.3)
1.00
-25.0
-25.0
-25.0
Net income (3.3)
-5.0
75.0
155.0
-107% 107%
Interest expense (3.4)
1.50
-30.0
-30.0
-30.0
Net income (3.4)
-10.0
70.0
150.0
-114% 114%

Dr Tomasz Berent
RETURN ON EQUITY (ROE)
D/E
Recession
Expected
Boom
ROIC (3)
4.0%
20.0%
36.0%
ROE (3.1)
0.00
4.0%
20.0%
36.0%
ROE (3.2)
0.25
2.5%
22.5%
42.5%
ROE (3.3)
1.00
-2.0%
30.0%
62.0%
ROE (3.4)
1.50
-5.0%
35.0%
75.0%
ROE does not always increase with financial leverage!!!

Dr Tomasz Berent
EARNINGS PER SHARE
D/E
Recession
Expected
Boom
EPS (3.1)
0.00
0.40
2.00
3.60
EPS (3.2)
0.25
0.25
2.25
4.25
EPS (3.3)
1.00
-0.20
3.00
6.20
EPS (3.4)
1.50
-0.50
3.50
7.50
EPS do not always increase with financial leverage!!!
Dr Tomasz Berent
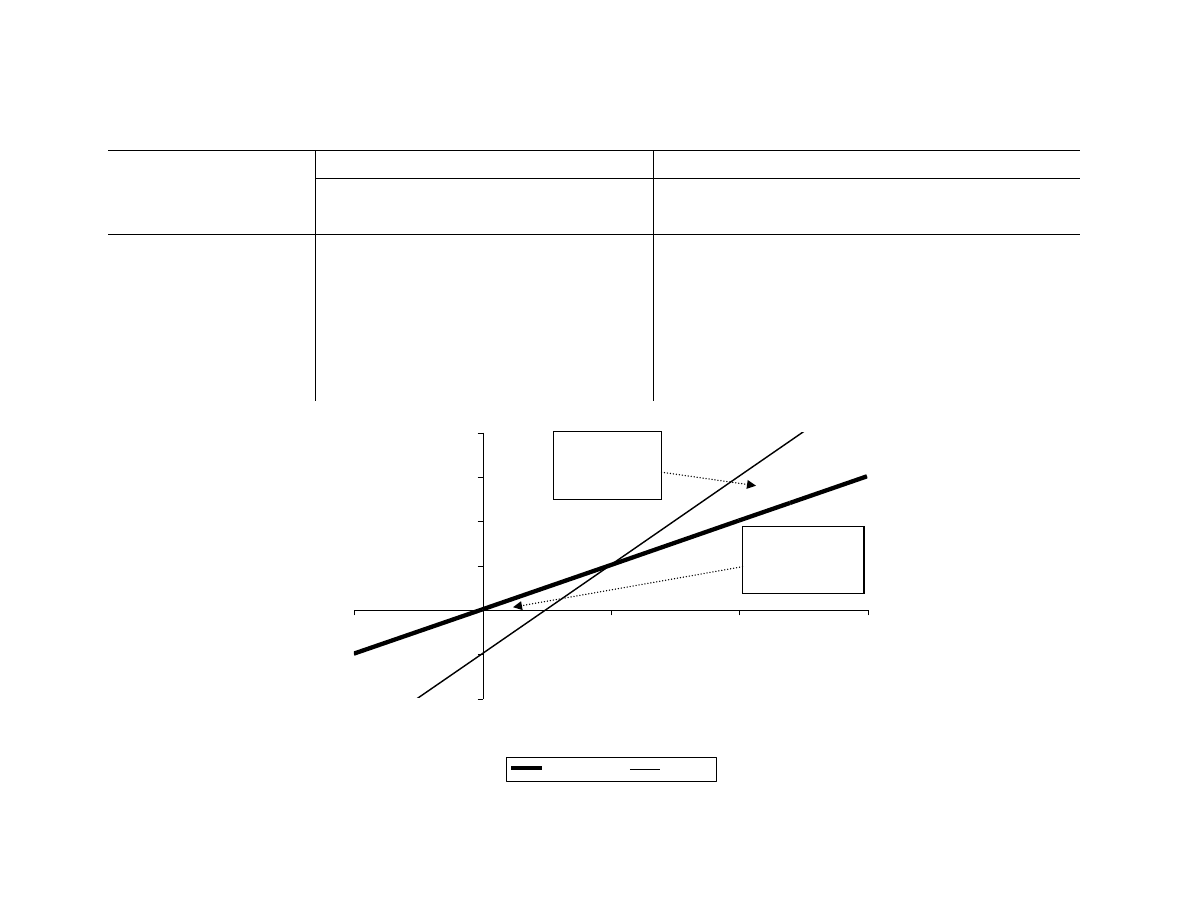
NOP vs. EPS
Unlevered
Levered, D/E=1
NOP
($)
k
d
%
IC
($)
Net inc.
($)
No of
shares
EPS
($)
D/E
D
($)
Net inc.
($)
No of
shares
EPS
($)
-50
10%
500
-50
50
-1.0
1
250
-75
25
-3.0
0
10%
500
0
50
0.0
1
250
-25
25
-1.0
50
10%
500
50
50
1.0
1
250
25
25
1.0
100
10%
500
100
50
2.0
1
250
75
25
3.0
120
10%
500
120
50
2.4
1
250
95
25
3.8
150
10%
500
150
50
3.0
1
250
125
25
5.0
-2.0
-1.0
0.0
1.0
2.0
3.0
4.0
-50
0
50
100
150
NOP
EPS
Unlevered
D/E=1
Advantage
to debt
Disadvantage
to debt
Wyszukiwarka
Podobne podstrony:
Principles Of Corporate Finance
Corporate finance 03
corporate finance
Principles Of Corporate Finance
Corporate finance investment valuation
corporate finance
Corporate Finance 7 01 2014
financial statements (Corporate Finance)
CORPORATE BANKING glossary, 03 banking & finance
Mr Corporate (Mister #3) JA Huss
mr all the fixin
GEORGE M MORTON Valuation Maximizing Corporate Value WILEY FINANCE
MR prezentacja
Positron emission tomography slides
IO ALL
więcej podobnych podstron