
Impact assessment of climate change on the hydrological
response of a snow and glacier melt runoff dominated
Himalayan river
Pratap Singh, Naresh Kumar
National Institute of Hydrology, Roorkee (U.P.), 247 667, India
Received 25 August 1995; revised 17 April 1996; accepted 23 April 1996
Abstract
The effect of climate change on snow water equivalent, snowmelt runoff, glacier melt runoff and
total streamflow and their distribution is examined for the Spiti river. This is a high altitude Hima-
layan river located in the western Himalayan region. The total streamflow of this river has a sig-
nificant contribution from snow and glacier melt runoff. Plausible hypothetical scenarios of
temperature and precipitation changes based on the simulation of climate change over the Indian
subcontinent by the Hamburg climate model are adopted in the present study. The UBC watershed
model was used to simulate the hydrological response of the basin under changed climatic scenarios.
The adopted changes in temperature and precipitation covered a range from 1 to 3
8C and from
−
10 to
+
10%, respectively.
Snow water equivalent reduces with an increase in air temperature. However, no significant
change is found in the snow water equivalent of the Spiti basin by the projected increase in air
temperature (T
+
1 to T
+
3
8C). An increase of 28C in air temperature reduced annual snow water
equivalent in the range of 1 to 7%. Changes in precipitation caused proportional changes in snow
water equivalent. It is found that annual snowmelt runoff, glacier melt runoff and total streamflow
increase linearly with changes in temperature (1–3
8C), but the most prominent effect of increase in
temperature has been noticed on glacier melt runoff for this high altitude basin. For example, an
increase of 2
8C in air temperature has enhanced annual snowmelt runoff, glacier melt runoff and total
streamflow in the range of 4–18%, 33–38% and 6–12% respectively. The effect of change in
precipitation (P
−
10 to P
+
10%) suggests a linear increase in snowmelt runoff and total streamflow,
while, in general, glacier melt runoff is inversely related to changes in precipitation. Snowmelt
runoff is found more sensitive than glacier melt runoff to changes in precipitation (P
−
10 to
P
+
10%). Under a warmer climate scenario, snowmelt runoff and glacier melt runoff cause an earlier
response of total streamflow and a change in flow distribution. The seasonal analysis of total stream-
flow indicates that an increase in air temperature produces an increase in the pre-monsoon season
followed by an increase in the monsoon season. Implications of such seasonal changes are also
briefly discussed.
q 1997 Elsevier Science B.V.
0022-1694/97/$17.00
q 1997– Elsevier Science B.V. All rights reserved
PII S 0 0 2 2 - 1 6 9 4 ( 9 6 ) 0 3 1 4 2 - 3
Journal of Hydrology 193 (1997) 316–350

1. Introduction
The atmospheric concentration of CO
2
and other trace gases has increased substantially
over the last century and double concentration of CO
2
is expected by the middle or latter
part of next century if no control measures are adopted (NAS, 1979; Pearman, 1980). This
steady increase in the concentration of greenhouse gases has resulted in global warming.
The global mean surface air temperature has increased by 0.3 to 0.6
8C over the past 100
years (Jones et al., 1990). Further, the average global surface temperature will rise by 0.2
to 0.5
8C per decade during the next few decades if human activities which cause green-
house gas emissions continue unabated (IPCC, 1990). The striking feature, however, is
that inter-annual variability of global temperature is much larger than the trend. Under the
double CO
2
concentration scenario, precipitation may increase or decrease by as much as
15% (IPCC, 1990).
Several studies of climate variability on both short and long time scales have been
carried out to establish climate changes over India (Jagannathan and Parthasarathy,
1972; Hingane et al., 1985; Sarker and Thapliyal, 1988; Thapliyal and Kulshreshtha,
1991). It is observed that a warming of the Indian subcontinent by 0.4
8C has taken
place over the period 1901–1982 (Hingane et al., 1985). This warming is broadly con-
sistent with the observed global warming over the last century. Thapliyal and Kulshreshtha
(1991) examined the trend of annual rainfall over India and reported that the five-year
running mean has fluctuated from normal rainfall within
6 one standard deviation. Based
upon the results from high resolution general circulation models (GCMs), the IPCC (1990)
reports for the Indian subcontinent state that by 2030, on ‘business-as-usual’ scenarios (if
few or no steps are taken to limit greenhouse gas emissions), the warming will vary from 1
to 2
8C throughout the year. Precipitation will change little in winter and will generally
increase throughout the region by 5 to 15% in summer. Lal et al. (1992) studied the impact
of increasing greenhouse gas concentrations on the climate of the Indian subcontinent and
its variability by analysing the GCM output data of the Hamburg global coupled atmo-
sphere–ocean circulation model. The model results obtained from the greenhouse warm-
ing experiment suggested an increase of more than 2
8C over the monsoon region in the
next 100 years. The mean annual increase in surface runoff over the Indian subcontinent
simulated by the model for the year 2080 is estimated to be about 25% (Lal and Chander,
1993).
The warming of the Earth–atmosphere system is likely to change temperature and
precipitation, which may affect the quantity and quality of the freshwater resources.
One of the most important impacts to society of future climatic changes is expected on
regional water availability, specifically the timing of its magnitude and surface runoff and
soil moisture fluctuations (Gleick, 1986; WMO, 1987). Existing global models suggest
that climatic changes will have dramatic impacts on water resources, leading to major
alterations of regional water systems. For example, a study based on GCM indicated that
streamflow from the rivers in the western USA will be reduced by 40 to 75% (NRC, 1983).
Rind and Lebedeff (1984) used a GCM to assess the effect of doubling CO
2
on hydro-
logical variables, and concluded that precipitation would increase by about 11% and
evaporation would increase proportionally, while snowpack would decrease by 20%
due to higher temperatures. Because quantitative estimates of the effects of climate change
317
P. Singh, N. Kumar/Journal of Hydrology 193 (1997) 316–350

on the hydrology of different regions are essential for the understanding, planning and
management of future water resources systems, the problems of global warming and its
impact on water resources have received considerable attention in recent years. There have
been several co-ordinated efforts by the World Meteorological Organisation (WMO),
Inter-governmental Panel on Climate Change (IPCC), United Nations Environmental
Programme (UNEP) and International Council of Scientific Union (ICSU) to bring
together experts involved in projects concerned with climate variability and change,
their impact on hydrology and water resources, and to identify the problems in this
area. Further, WMO et al. (1991) suggested that the possible effects of climate change
in the design and management of water resources systems should also be examined.
The vulnerability of the Indian subcontinent to the impact of changing climate is of vital
importance because the major impact of climate change in this continent would be on the
hydrology, affecting water resources and agricultural economy. However, very little work
has been carried out in India on the impact of climate change on hydrology (Divya and
Mehrotra, 1995). The major river systems of the Indian subcontinent, namely Brahama-
putra, Ganga and Indus which originate in the Himalayas, are expected to be more vulner-
able to climate change because of the substantial contribution from snow and glaciers into
these river systems. A review of the possible impact of climatic changes on various aspects
of the hydrological cycle has shown that little emphasis has been placed on studying the
hydrological response of a Himalayan river. In the present study attempts are made to
investigate the effect of climatic change on the snow water equivalent, snowmelt runoff,
glacier melt runoff, total streamflow and their distribution for a high altitude Himalayan
river (Spiti) which forms a part of the Indus river system.
2. Basin characteristics and hydrological response
The hydrological response of a catchment depends on the sources of runoff, climatic
conditions and physical characteristics of the catchment. For example, streamflow dis-
tribution of a basin experiencing only rainfall will be different from a basin having
contribution from rainfall, snowfall and glaciers. Further, for basins in which temperature
and precipitation characteristics are such that snowfall occurring during the preceding
winter is completely melted away during the following spring and summer months, there
will be a different response to runoff distribution. On the other hand, basins where total
accumulated snow is not melted and high snow fields and glaciers are formed (as in the
present study basin) produce a different type of streamflow pattern. In such a complex
basin, melting of snow starts first and glacier melt takes over when snowmelt contribution
diminishes. Cayan and Riddle (1993) have also emphasized that the effect of climate
change on the hydrological response of the lower-elevation watershed will be different
than for the high-elevation watershed because of the difference in their runoff distribution
and original climatic regime. Recently, Chiew et al. (1995) reported that the responses of
basins located in different regions are not similar under changed climatic scenarios.
Several authors have evaluated the influence of climatic changes on the basins which
have input from different sources and in which, consequently, the impact of climatic
changes is also different. Some studies have been carried out for snowbound basins
318
P. Singh, N. Kumar/Journal of Hydrology 193 (1997) 316–350

also, but again the present study basin has glaciers located in the high-altitude Himalayan
region. This characteristic of the basin has allowed various aspects of the hydrological
response to be studied, but at the same time this may limit comparison of our results with
those of other basins. However, wherever possible, we have compared our results with the
reported studies.
3. Climate change scenarios
Recent advances in the ability of the global coupled atmosphere–ocean GCMs to
replicate the observed atmospheric behaviour on a wide range of space and time scales
are quite encouraging. The models treating the coupled ocean–atmosphere system in an
interactive mode are able to provide projections of the possible perturbations in the key
climatic elements in time scales of up to 100 years for future greenhouse gas emission
scenarios (Cubasch et al., 1992). IPCC (1990, 1992) and several investigators (McCabe
and Ayers, 1989; Nemec, 1989) recommend the construction of hypothetical scenarios to
study characteristics of runoff responses to climate change for particular areas. Most of the
regional scale climate impact investigations related to global warming have relied on the
output of GCMs in order to adopt scenarios for future climatic change.
The coupled ocean–atmosphere climate model — European Community HAMburg
model (ECHAM)
+
Large Scale Geostrophic ocean model (LSG) — has demonstrated
good simulation of the characteristic features of the Asian summer monsoon as well as its
broad circulation features over the Indian subcontinent (Lal et al., 1992). Recently, for
estimating changes in annual surface runoff over the Indian subcontinent, the output of the
ECHAM3 (horizontal resolution
,300 km
×
300 km) was used by Lal and Chander
(1993). Moreover, possible changes in the key climatological variables for a 100-year
period over the north-west margins of the Indian subcontinent have been examined, using
this model, with the objective of assessing the potential climate change over the Thar
desert, of which a large part lies in north-west India (Lal and Bhaskaran, 1993). Simulated
changes in temperature and precipitation by the Hamburg climate model over the Indian
subcontinent under a ‘business-as-usual’ scenario over a long time period (
,100 years in
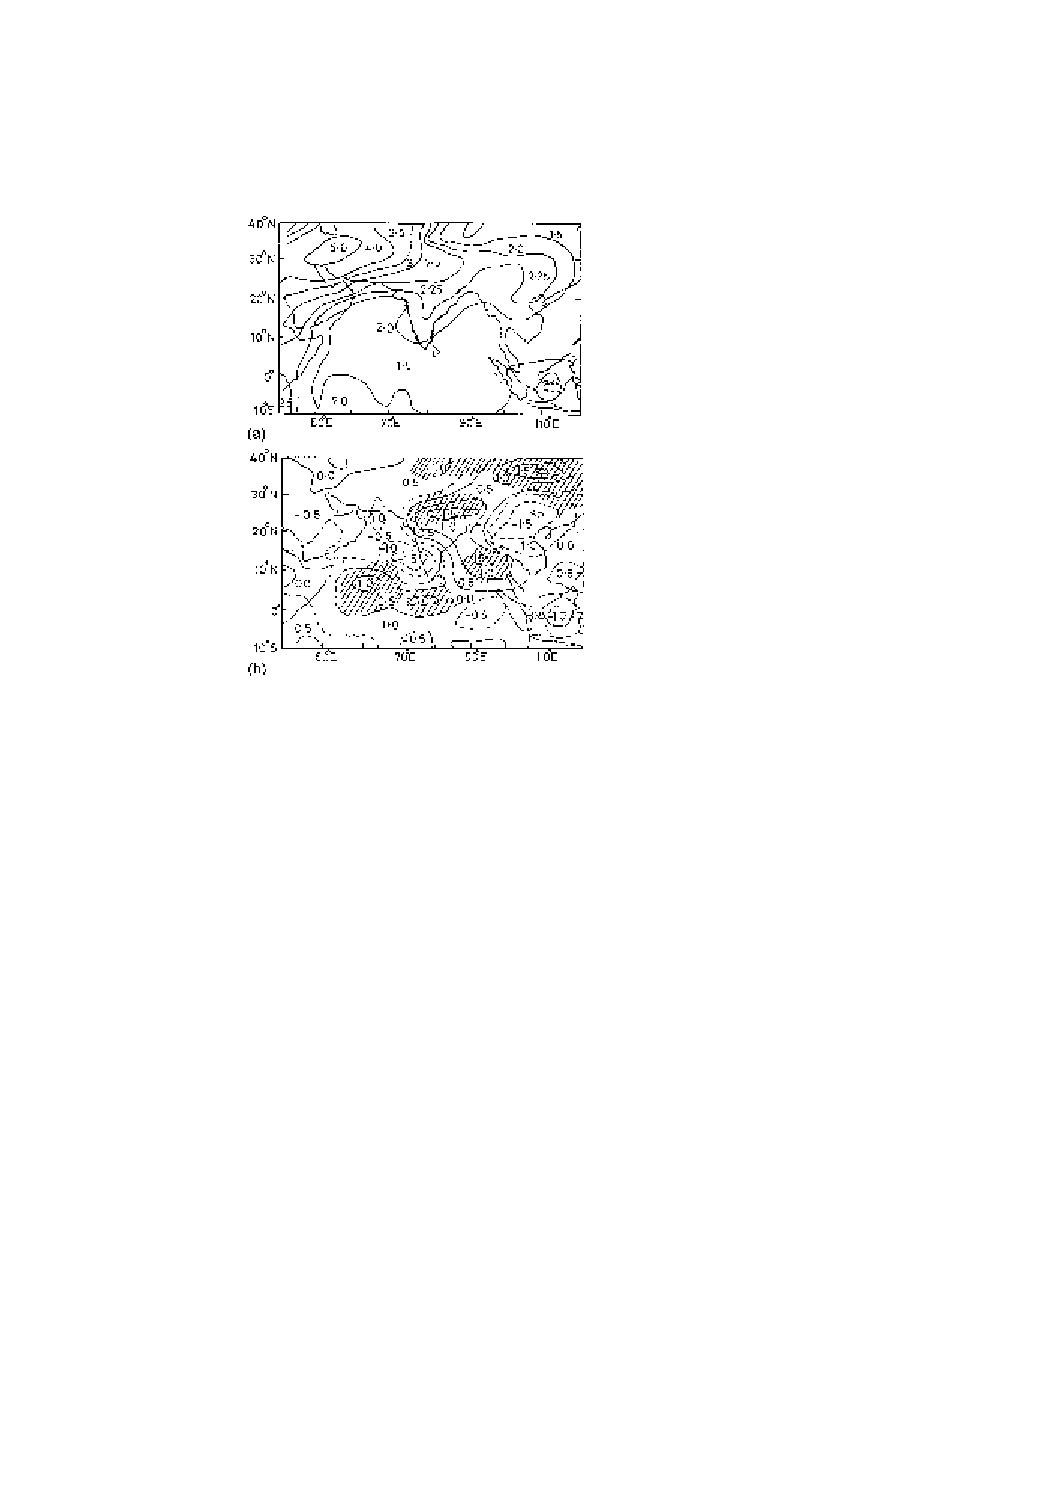
the future) are shown in Fig. 1(a) and 1(b). We have adopted this scenario with a limit to
changes in the approximate range provided in these figures. However, the lesser variations
are likely to occur when a period less than 100 years is considered. Analysis was made
using a range of variation in temperature and precipitation, thus providing results for a
lower order of changes also.
The effect of temperature on the hydrological response of the basin has been studied
independently and in combination with precipitation. The changes in temperature were
applied as absolute amounts, whereas changes in precipitation were considered as percen-
tage differences. Since much greater uncertainty surrounds the estimates of changes in
regional precipitation, both increases and decreases in average annual precipitation are
modelled in this study. The adopted changes in temperature and precipitation covered a
range from 1 to 3
8C and
−
10 to
+
10%, respectively. The values chosen for hypothetical
scenarios typically reflect good estimates of changes in important climatic variables (Lal
et al., 1992). Both temperature and precipitation data were uniformly varied by the
319
P. Singh, N. Kumar/Journal of Hydrology 193 (1997) 316–350
projected amount of changes over the simulation period. In reality, changes in temperature
and precipitation are likely to vary throughout the year, and such changes may also alter
seasonal temperature patterns and consequently the distribution and frequency of preci-
pitation events. These aspects are not considered in this study simply because of non-
availability of reliable information of distribution of these changes.
4. Applications of hydrological models to study the hydrological response of a basin
under changed climatic scenarios
The studies carried out to demonstrate the impacts of climate changes on various
components of the hydrologic cycle may be classified broadly into two categories: (i)
studies using GCMs to predict the impact of climate change scenarios (US Department of
Fig. 1. (a) Spatial distribution of changes in annual temperature (
8C) for the Indian subcontinent as simulated by
the Hamburg coupled climate model under a ‘business-as-usual’ scenario (Lal et al., 1992). (b) Spatial distribu-
tion of changes in annual rainfall (mm/day) for the Indian subcontinent as simulated by the Hamburg coupled
climate model under a ‘business-as-usual’ scenario. Hatched area represents the significant changes at 90% level
(Lal et al., 1992).
320
P. Singh, N. Kumar/Journal of Hydrology 193 (1997) 316–350

Energy, 1980; Gleick, 1987a; Cohen, 1986; IPCC, 1990; Sausen et al., 1994; McCabe,
1994; Loaiciga et al., 1996); and (ii) studies using hydrological models with assumed
hypothetical climatic inputs (Nemec and Schaake, 1982; Nemec, 1989; McCabe and
Ayers, 1989; Sanderson and Smith, 1990; Thomsen, 1990; Rango, 1992; Cayan and
Riddle, 1993; Burn, 1994; Rango and Martinec, 1994; Chiew et al., 1995). While the
GCM models are invaluable tools for identifying climatic sensitivities and changes in
global climate characteristics, the grid system is too large to assess the impact on major
hydrological parameters on regional scales. A single grid may encompass hundreds of
square kilometres, including mountainous and desert terrain, oceans and land areas.
Despite recent improvements in modelling the climate dynamics with complex and
large scale models, we are still seriously limited in evaluating regional details of climatic
changes or details of the effects of such changes on hydrologic processes and water
availability. Loaiciga et al. (1996) have presented a detailed review on the interaction
of GCMs and the hydrological cycle. Until current GCMs improve both their spatial
resolution and their hydrologic parametrization, information on hydrologic effects of
global climatic changes can best be obtained using regional hydrological models.
The advantages of using hydrological models for assessing the impacts of climatic
change have been discussed by several investigators. Such models are considered suitable
for assessing the regional hydrologic consequences of changes in temperature and pre-
cipitation and other climatic variables. The ability of hydrologic models to incorporate
projected variations in climatic variables, snowfall and snowmelt algorithms, ground
water fluctuations and soil moisture characteristics makes them especially attractive for
water resources studies of climatic changes. Moreover, such models can be combined with
plausible hypothetical climate change scenarios to generate information on water
resources implications of future climatic changes (Gleick, 1986). Various hydrologic
models have been used to study the impacts of climate change scenarios, depending on
the purpose of study and model availability. Gleick (1987a) used a water balance model to
estimate the impact of climate on monthly water availability. Detailed studies using a
deterministic model in mountain basins (National Weather Service River Forecasting
System (NWSRFS) model) have been carried out (Lettenmaier and Gan, 1990; Cooley,
1990; Nash and Gleick, 1991; Panagoulia, 1991). Rango (1992) used the Snow Melt
Runoff (SRM) model for the Rio Grande and Kings river basins to study the changes in
snowmelt runoff under warmer climate scenarios. Recently, Rango and Martinec (1994)
examined the influence of changes in temperature and precipitation on snow cover, using
SRM, and their results are discussed below.
It is worth mentioning that, for water resources systems dominated by snow and glacier
melt runoff, vulnerability to changes in global climatic conditions can be better understood
using the conceptual hydrological models which have algorithms to develop and deplete
snowpack using meteorological data. This is especially true with respect to changes in
snowfall and snowmelt, because climate changes will also affect the magnitude and dis-
tribution of the snowfall occurring during the preceding winters. The models with only a
snowmelt runoff simulation approach, but without the ability to accumulate the snowpack,
may not be suitable for assessing the effect on both snow water equivalent and snowmelt
runoff. For example, Yeh et al. (1983) found that sudden removal of the snow cover on 15
March would bring about a significant reduction of zonal mean soil moisture for the
321
P. Singh, N. Kumar/Journal of Hydrology 193 (1997) 316–350

following spring and summer seasons. They did not, however, model the effects of
changes in climate on the development of the snowpack. Similarly, Rango (1989,
Rango, 1992) modelled the changes in snowmelt runoff caused by temperature increase
during the snowmelt period without considering the effect of climate change on snow
water equivalent over the basin. Their results indicated that the warmer temperature
produced an earlier hydrograph peak, but with essentially the same seasonal volume
since they started with the same snowpack. Rango and Martinec (1994) reported that
changed temperatures of
+
2
8C and
+
4
8C both had a much more important effect on
snow cover than doubling the precipitation occurring during the snowmelt period.
Cayan and Riddle (1993) examined the influence of climate parameters on seasonal
streamflow in watersheds over a range of elevations, and found that the temperature
sensitivity of seasonal streamflow is greater in spring and early summer. It was reported
that the effect of temperature on runoff in early summer is partially counteracted by the
opposite effect in early spring, but perhaps not totally.
In this study, the University of British Columbia (UBC) watershed model has been used
to assess the impact of global warming by modelling hydrological processes including soil
moisture, snowmelt, glacier melt, rainfall runoff, ground water, evaporation etc. This
model is designed primarily for mountainous watersheds and uses daily maximum and
minimum temperatures and precipitation as inputs. The model has the ability to continu-
ously monitor the hydrologic state of the catchment over extended periods of time. One of
the important features of the model is that it develops and depletes the snowpack in the
basin using meteorological data. The availability of algorithms in the model for computing
contributions from snowmelt runoff and glacier melt runoff has enabled us to study the
influence of climatic changes on various components of the streamflow and snow water
equivalent. This model is used operationally for long-term and short-term forecasting in
the Columbia, Peace and Fraser river systems in Canada and for streamflow simulations of
several Himalayan rivers (Quick and Singh, 1992; Singh and Quick, 1993). It is not
possible to discuss the model in detail here. Detailed information on this model is given
by Quick and Pipes (1977).
5. Physical and hydrological characteristics of the Spiti basin and simulation of
streamflow
The Spiti river is a major tributary of the Satluj river which forms an important part of
the Indus river system. This basin has an area of 10 071 km
2
with an elevation range from
2900 to over 7000 m. However, little of the basin lies above 6000 m. This basin lies in the
greater Himalayan range. Permanent snow fields and glaciers exist at higher altitudes in
the basin. About 2.5% of the basin is covered by glaciers (Quick and Singh, 1992). The
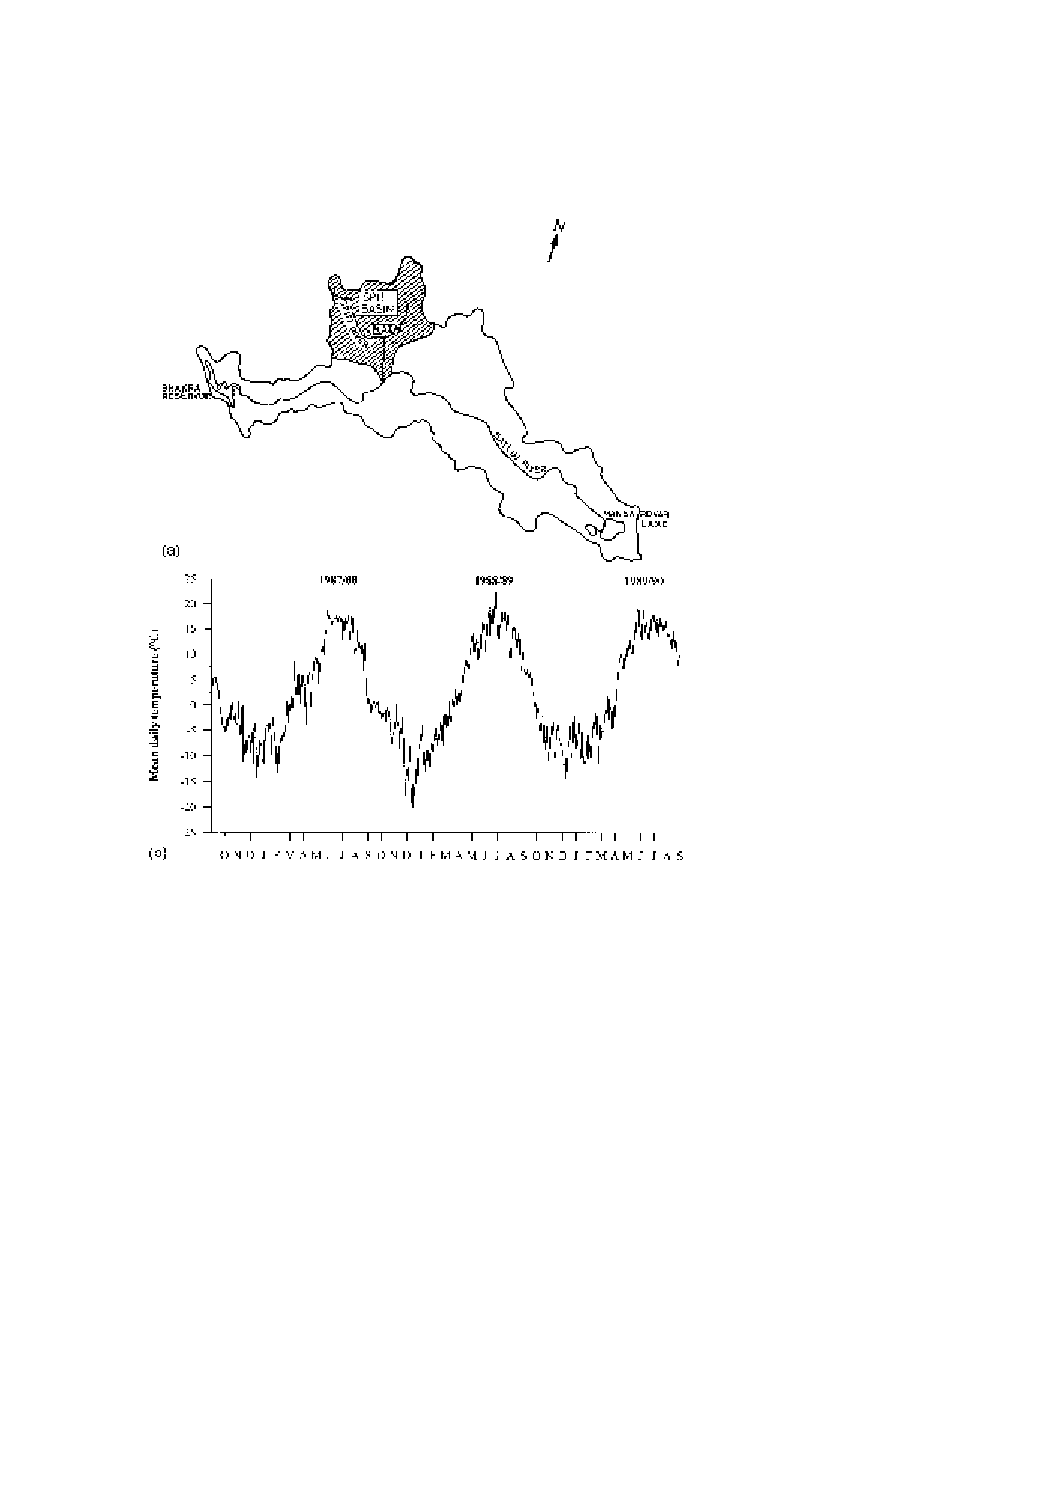
water from this river is used mainly for irrigation and hydropower generation. The location
of the study basin is shown in Fig. 2(a).
The westerly weather disturbances deposit nearly all the precipitation during the winter
months (October–March) and most of the precipitation falls in the form of snow in this
season. The monsoon rains have little influence in the greater Himalayan range in which
this basin is located, as compared with the outer and middle Himalayan ranges (Singh et al.,
322
P. Singh, N. Kumar/Journal of Hydrology 193 (1997) 316–350
1995a). The time and magnitude of snow and glacier melt runoff depends on the snowpack
water equivalent accumulated in the preceding winter season and on the prevailing
climatic conditions over the basin. In general, the maximum snow cover area exists in
March when most of the snowfall has occurred and melting has not started. As the summer
season advances, depletion of the snow cover area takes place and temperatures follow an
Fig. 2. (a) Location map of the Spiti basin. (b) Observed mean daily air temperature at Kaza (3639 m) in the Spiti
basin.
323
P. Singh, N. Kumar/Journal of Hydrology 193 (1997) 316–350
increasing trend. Maximum snow melt runoff is observed in the month of June/July.
Glaciers are exposed after the melting of seasonal snow cover and, generally, melting
of glaciers starts in late June/July, depending on the amount of seasonal snow, and extends
until September. The importance of snow and glacier melt runoff in Himalayan rivers has
been discussed by Singh et al. (1995b) and Singh and Kumar (1996).
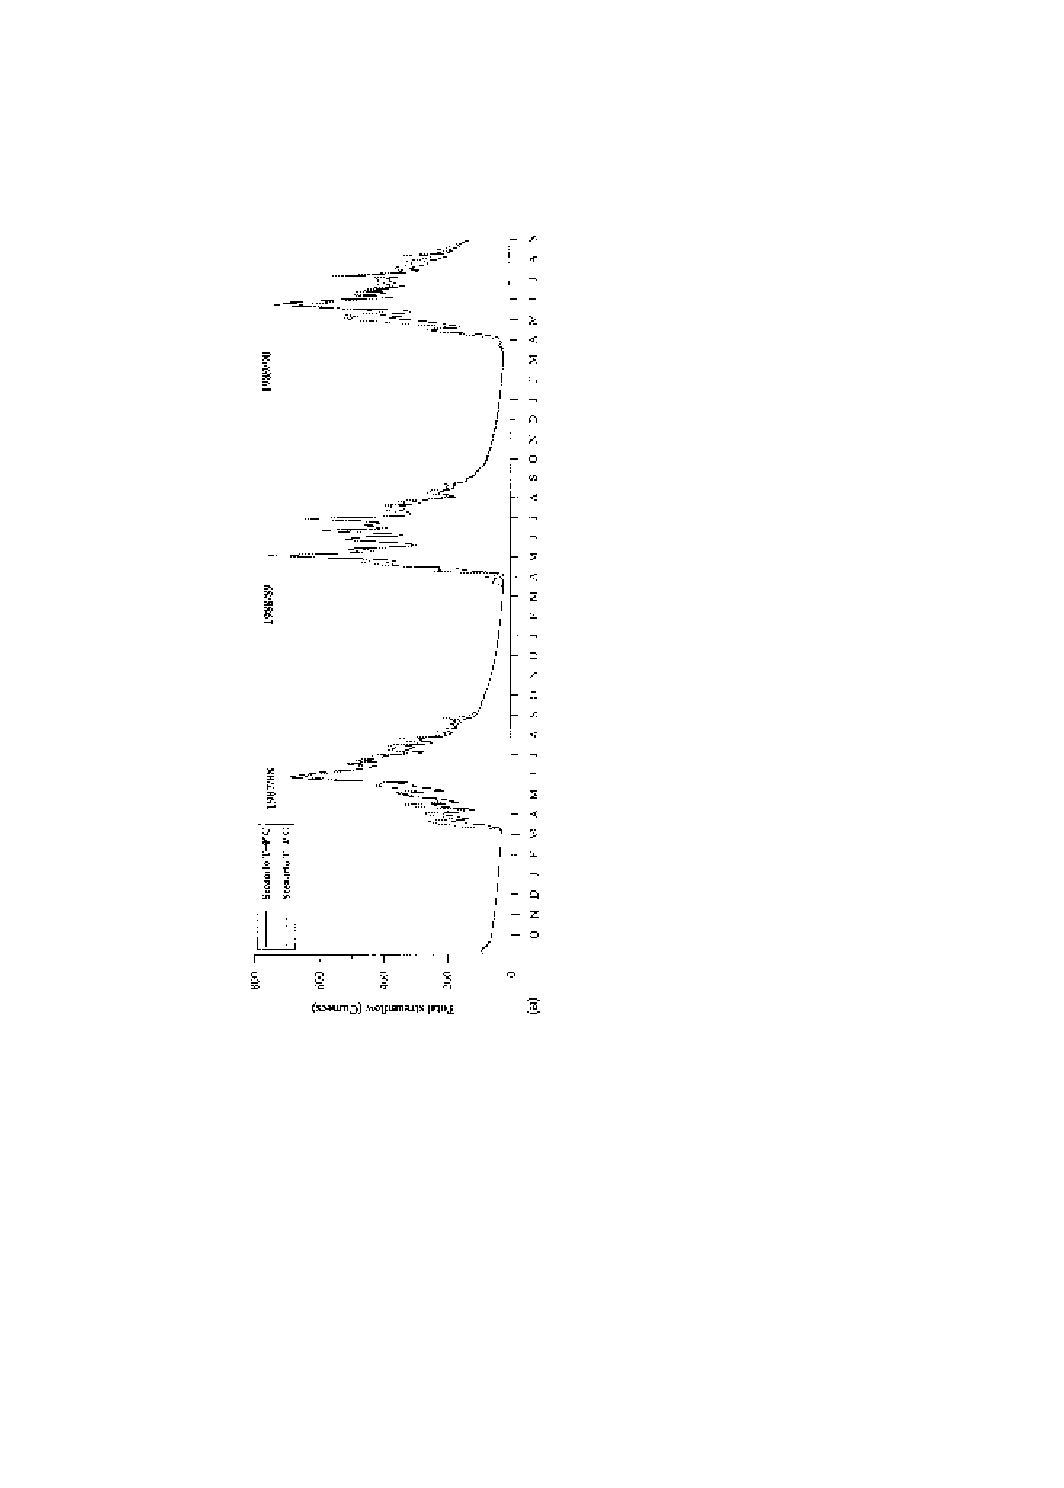
Daily temperature and precipitation data of Kaza (3639 m) were used to simulate
the streamflow observed at the outlet of the basin. The observed mean daily tempera-
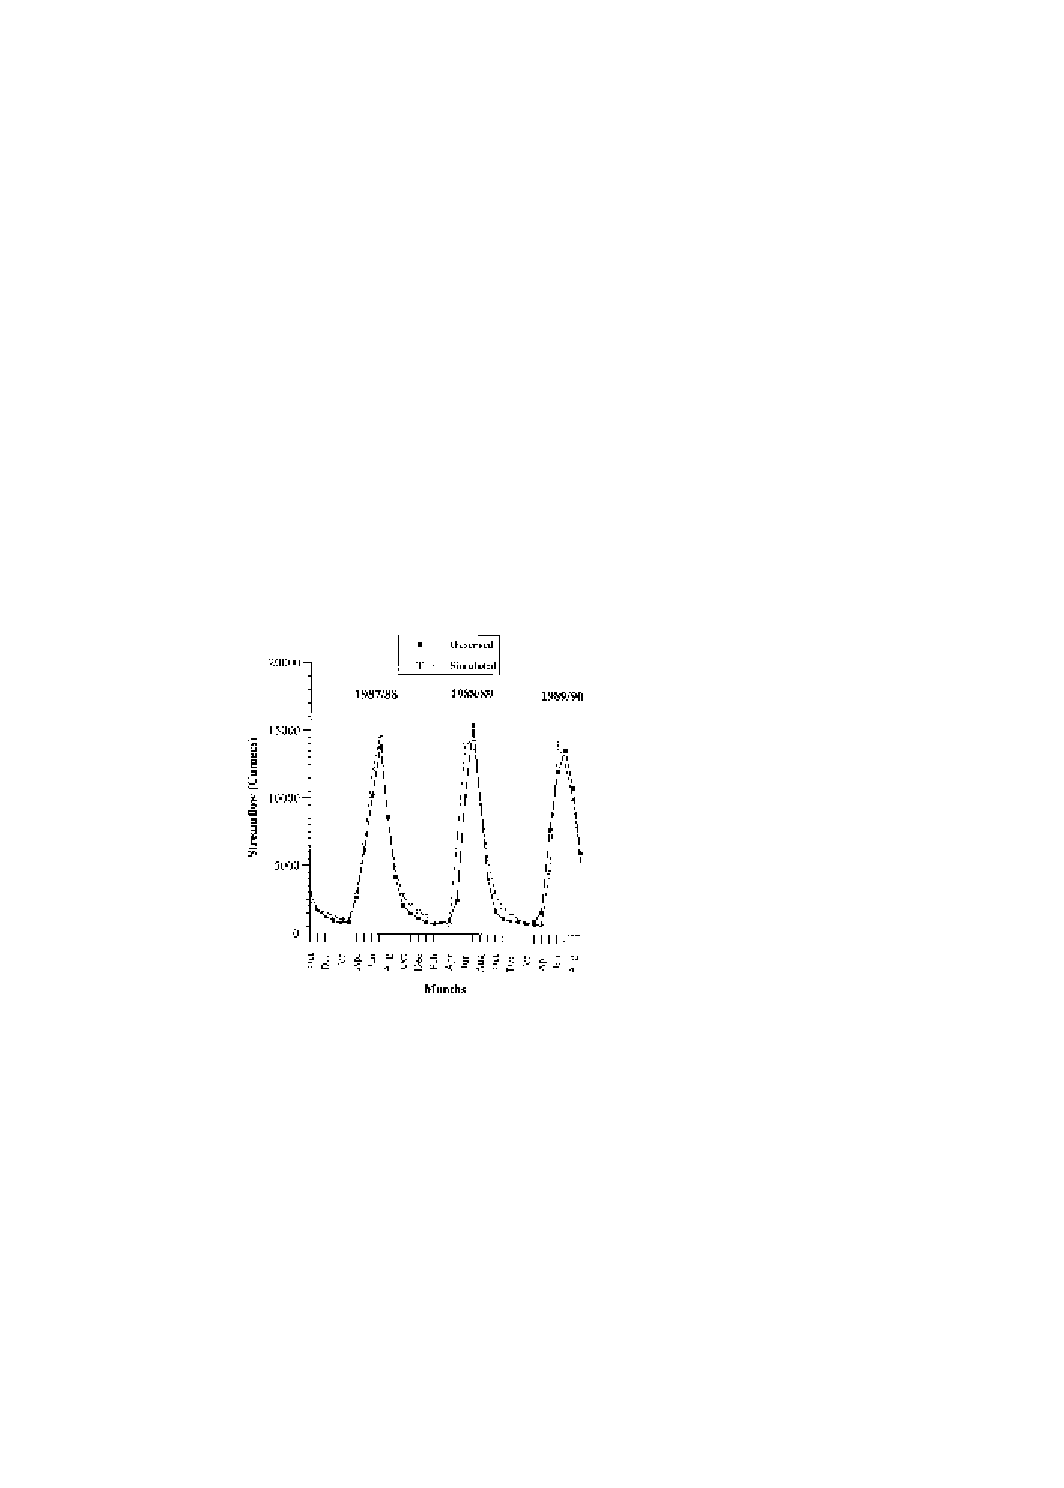
tures at Kaza are shown in Fig. 2(b). The streamflow simulation was made for three
years (1987–1990) on a daily basis, and the coefficient of efficiency r
2
(Nash and
Sutcliffe, 1970) between observed and calculated runoff was computed to be 0.90,
0.76 and 0.91 for 1987/88, 1988/89 and 1989/90 respectively. A monthly simulation is
shown in Fig. 3. To assess the impact of projected climate change, temperature and
precipitation data were modified accordingly and the model was run continuously for a
three-year simulation period without changing the model parameters. In fact, the
model parameters will also be influenced under changed climatic scenarios and such
effects should be considered in the study (Becker and Serban, 1990). However,
actual changes in parameters under warmer climatic scenarios are not yet well understood
(IPCC, 1990; Chiew et al., 1995). This insufficient knowledge has led us to use the same
parameters under normal and changed climatic scenarios in this study. The effect of
changes in the model parameters may have a significant effect on the results. More
research is to be done to understand the model parameter changes under changed climatic
Fig. 3. Observed and simulated monthly streamflow of the Spiti river using the UBC watershed model.
324
P. Singh, N. Kumar/Journal of Hydrology 193 (1997) 316–350

scenarios and to study the influences of such changes on the hydrological response of the
basins.
6. Effect of climate change on the hydrological response of the Spiti river
6.1. Snow water equivalent
6.1.1. Temperature scenarios
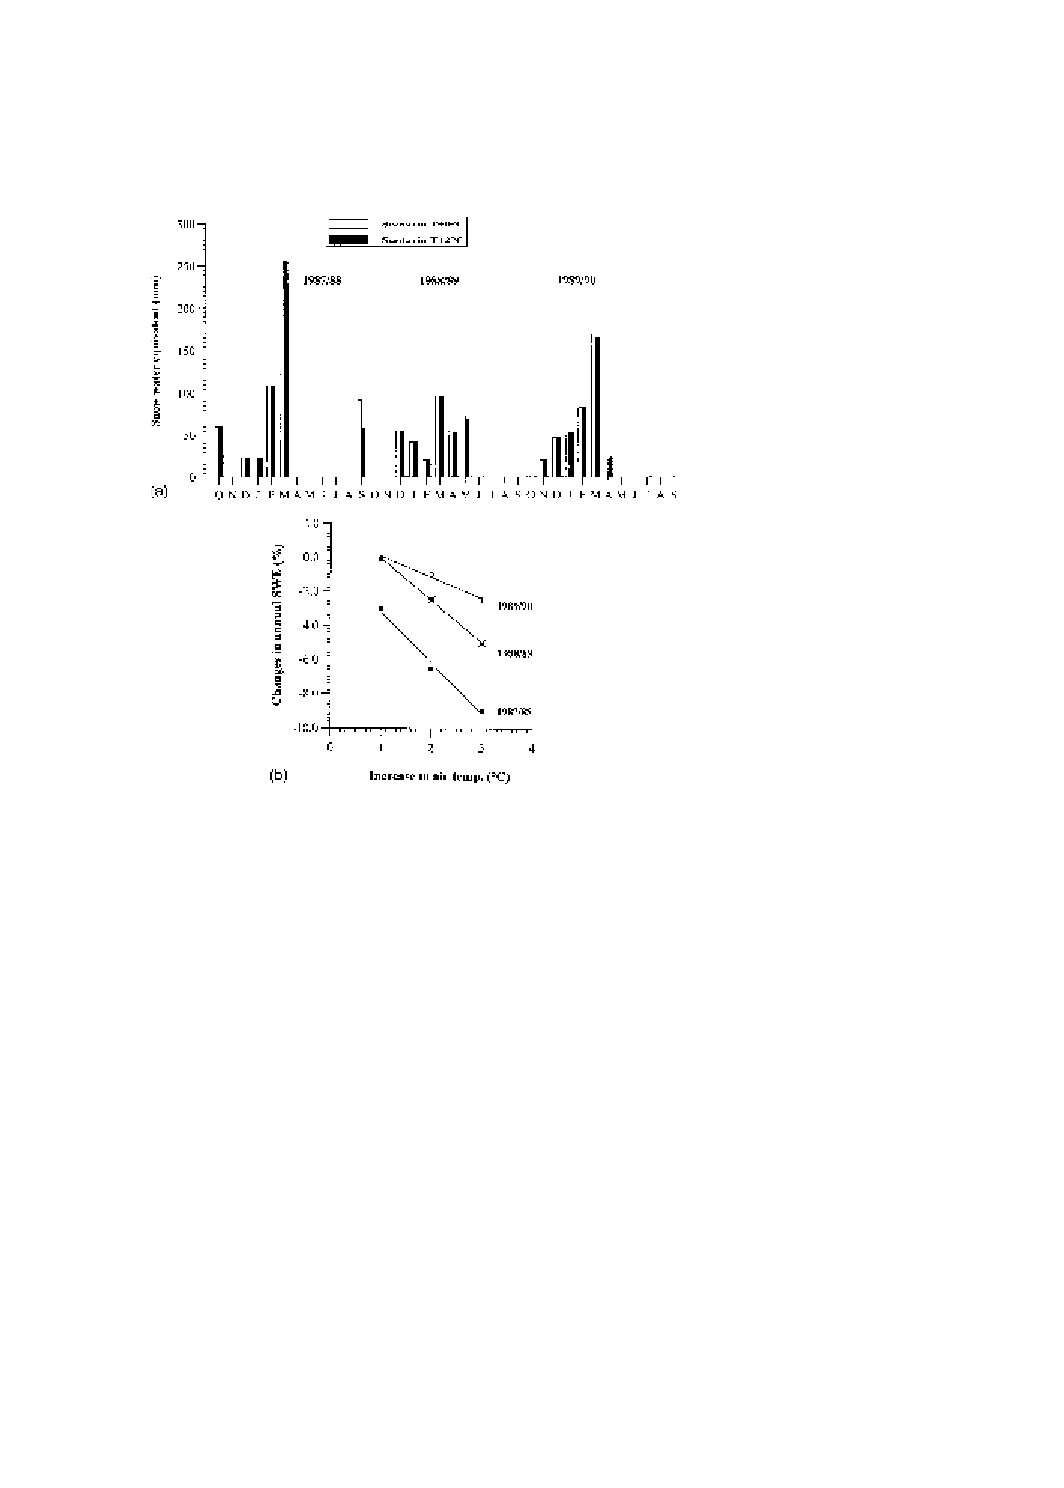
The changes in monthly and annual snow water equivalent (SWE) of the Spiti basin,
with projected increase in air temperature (1–3
8C) for 1987/88, 1988/89 and 1989/90, are
shown in Fig. 4(a) and (b), respectively. The increase in temperature has slightly reduced
the amount of annual snow water equivalent falling in the winter period, because in a
particular period, if air temperature is nearer to the critical or threshold temperature
(usually 2
8C), SWE is significantly reduced because the form of precipitation changes
to rain. Therefore, in such cases, a minor increase in temperature can reduce the SWE
significantly because precipitation falls as rain. On the other hand, when air temperatures
are already very warm or cold, moderate changes in temperature will not change the
amounts of rain or snow. In the present study basin air temperatures are far below the
critical threshold temperature in the winter period (Fig. 2(b)) and projected global warm-
ing changes in temperature cannot affect snow accumulation very much. Air temperatures
in the starting and ending months of the winter season are closer to the critical temperature
and therefore an increase in the air temperature in these months reduces snowfall. Fig. 4(a)
also shows that the build-up time of the snowpack is not influenced significantly by the
projected increase in air temperature, because it is a very high altitude basin. Vehvilainen
and Lohvansuu (1991) found that the snow accumulation period is greatly reduced in
Finland due to an increase in temperature by about 5–6
8C, but in our case the projected
increase in temperature is lower than the one they adopted.
Fig. 4(c) shows the distribution of SWE in the basin with an increase in temperature. It
can be seen that an increase in temperature up to 3
8C did not melt the whole accumulated
snow in the basin; i.e., snow remains in the basin after the melt period under both normal
and warmer climatic scenarios. However, the magnitude of the snow remaining in the
basin decreases as the temperature increases. There is therefore an effect on the snow
storage characteristics of the basin, which influences the snowmelt runoff.
Details of simulated annual SWE under different temperature scenarios are summarized
in Tables 1–2. Annual SWE is reduced by 1–7% for an increase in air temperature of 2
8C
for the years studied. The reduction in annual SWE for 1987/88 is slightly higher because
of the occurrence of sizeable snowfall in the months of September and October. There is
no snowfall in these months for the other years. As discussed above, in these months the air
temperature is closer to the critical temperature so that rainfall is an increased proportion
of the total precipitation, which results in a reduction of SWE. Similarly, Lettenmaier and
Gan (1990) reported a marked reduction in SWE under a 2
×
CO
2
scenario.
6.1.2. Temperature and precipitation scenarios
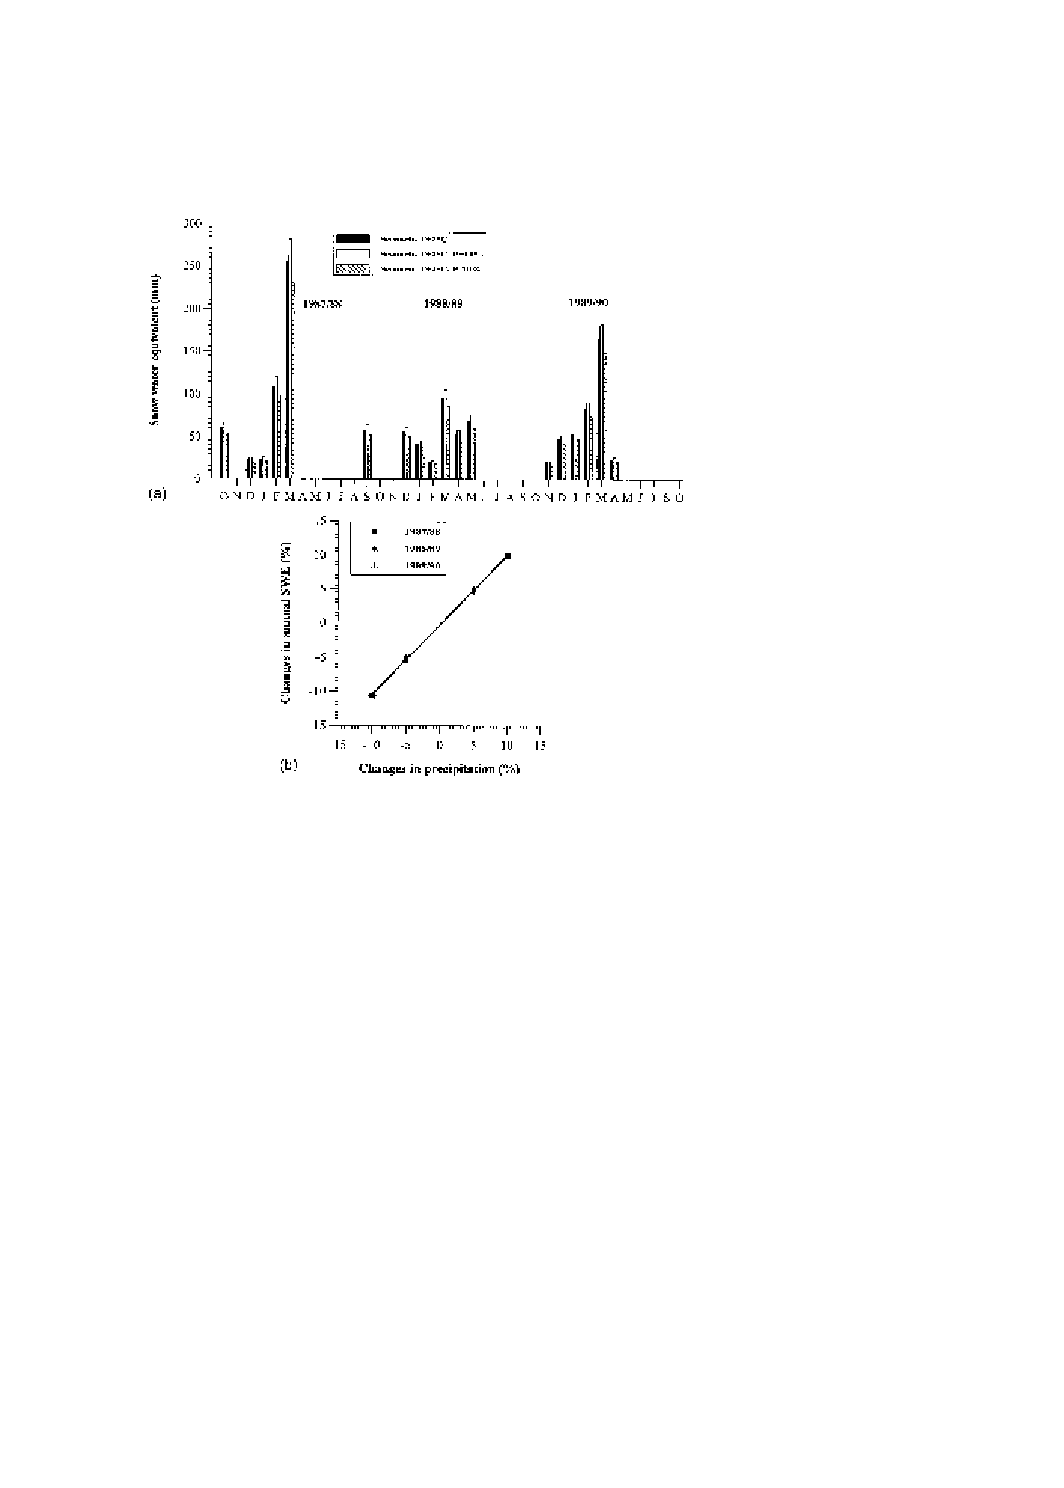
The possible impact of precipitation scenarios on monthly and annual SWE is presented
325
P. Singh, N. Kumar/Journal of Hydrology 193 (1997) 316–350
in Fig. 5(a) and (b) respectively. These results suggest that changes in SWE are
proportional to changes in precipitation. It can also be seen from Table 3 that, for
all the projected temperature scenarios, the variation in annual SWE due to a specific
change in precipitation is found to be of the same order. Table 4 shows the variation
in annual SWE under various temperature and precipitation scenarios with respect
to the original simulations. It can be observed from Table 4 that, out of the scenarios
studied, the maximum reduction (13–18%) in annual SWE is produced under a T
+
3
8C,
P
−
10% scenario.
Fig. 4. (a) Effect of increase in temperature on monthly snow water equivalent. (b) Effect of increase in
temperature on annual snow water equivalent. (c) Effect of increase in temperature on distribution of snow
water equivalent in the basin.
326
P. Singh, N. Kumar/Journal of Hydrology 193 (1997) 316–350
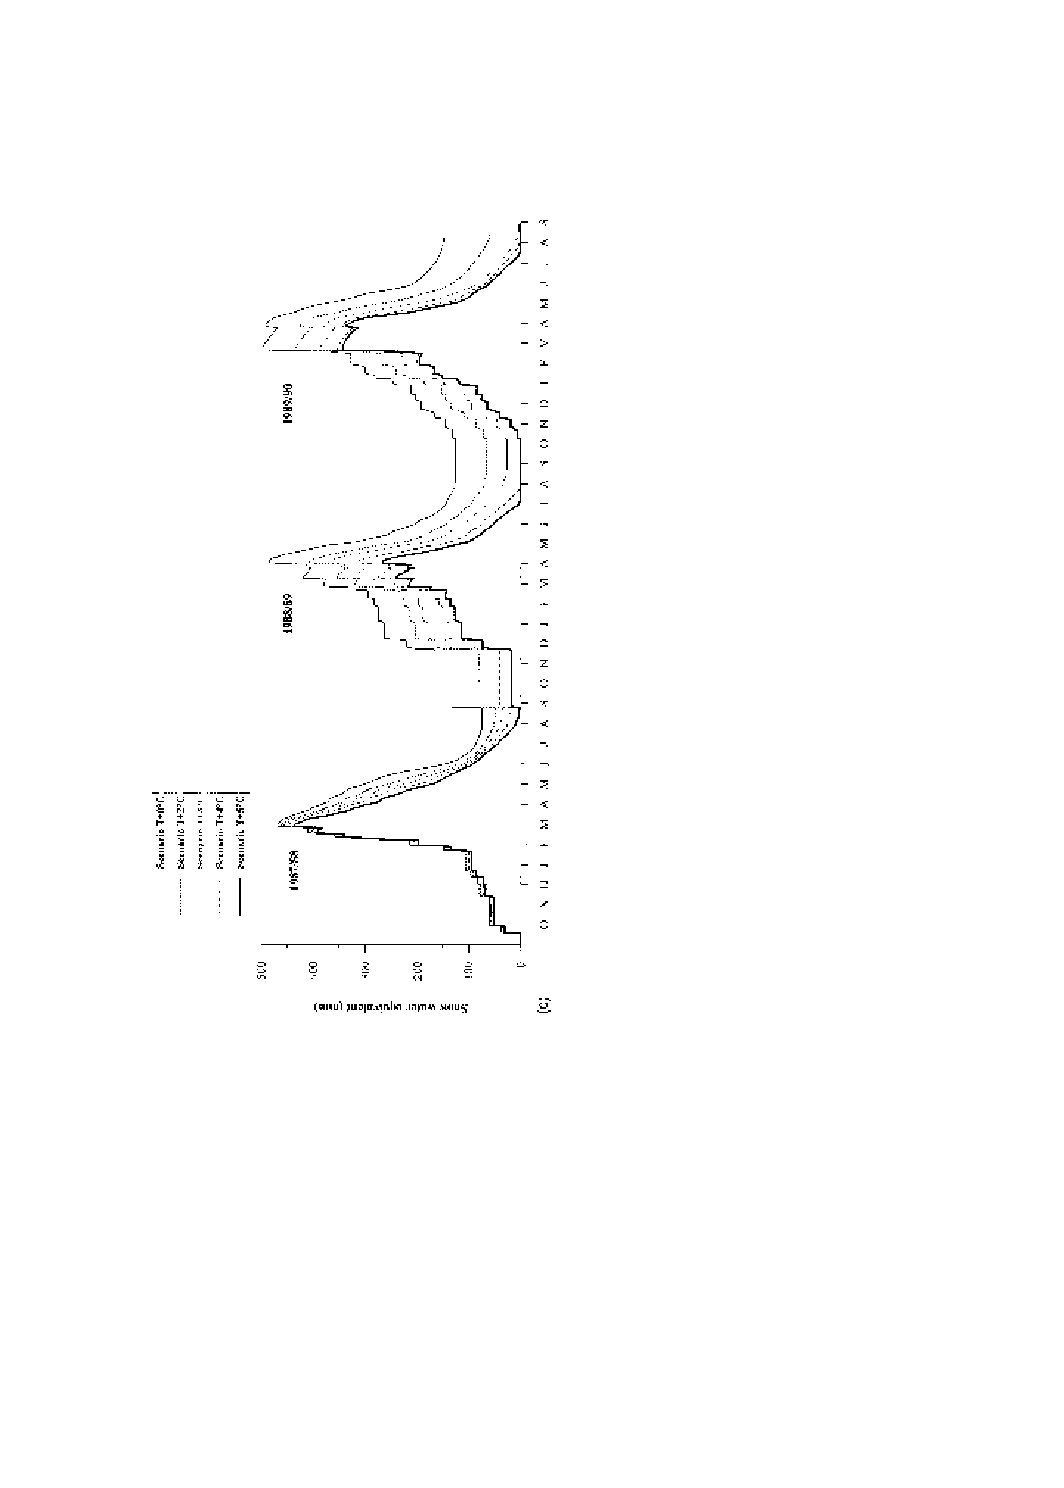
Fig.
4.
Continued.
327
P. Singh, N. Kumar/Journal of Hydrology 193 (1997) 316–350

Table
1
Effect
of
increase
in
temperature
on
annual
snow
wa
ter
equivalent,
snowm
elt
runoff
,
glacier
melt
runoff
and
total
streamflow.
All
changes
in
temperature
are
in
8C.
RS
indicat
es
reference
scenario
Ye
ar
Scenario
Snow
w
ater
equiv.(mm)
Change(%)
Sno
w
melt
ru
noff(cum.d)
Ch
ange(%)
Glacier
melt
runoff
(cum.d)
Chan
ge(%)
Total
stream
flow
(cum.d)
Change(%)
1987
/88
T
+
0
R
S
564
–
1
7
504
–
9
072
–
5
8
808
–
T
+
1
545
−
3.4
18
513
5.8
10
681
17.7
62
212
5.8
T
+
2
528
−
6.4
19
914
13.8
12
490
37.7
65
681
11.7
T
+
3
512
−
9.2
21
414
22.3
14
338
58.0
69
518
18.2
1988
/89
T
+
0
R
S
343
–
2
1
014
–
1
0
451
–
6
1
171
–
T
+
1
342
−
0.3
21
426
2.0
12
102
15.8
63
141
3.2
T
+
2
335
−
2.3
21
822
3.8
13
873
32.7
64
645
5.7
T
+
3
326
−
5.0
23
051
9.7
15
640
49.6
67
516
10.4
1989
/90
T
+
0
R
S
398
–
1
7
784
–
9
598
–
5
6
649
–
T
+
1
397
−
0.3
19
389
9.0
11
283
17.6
59
451
4.9
T
+
2
394
−
1.0
21
022
18.2
13
029
35.7
62
257
9.9
T
+
3
388
−
2.5
22
733
27.8
14
903
55.3
65
791
16.1
328
P. Singh, N. Kumar/Journal of Hydrology 193 (1997) 316–350

6.2. Snowmelt runoff
6.2.1. Temperature scenarios
The simulated daily snowmelt runoff under a T
+
2
8C temperature scenario is shown in
Fig. 6(a). As expected, an early response for snowmelt runoff is noticed under the warmer
climate, along with a change in distribution. In the water year 1987/88 the original
temperatures were warmer in the spring months and produced a significant increase in
melt runoff under the warmer climate scenario, and this has reduced peak runoff signifi-
cantly in June 1988 because significant melting from the basin occurred during the spring
months. Examination of the simulation results for the year 1988/89 shows that the peak
runoff is not reduced but slightly increased, because significant melting could not occur in
the spring months because of lower temperatures during this time. Again, in 1989/90,
substantial melting occurred in May under the warmer climate and resulted in a shift of
peak runoff. Therefore, the melting pattern in the spring months also controls the snow-
melt runoff distribution. Such effects have also been noticed by Cayan and Riddle (1993),
who have also reported that the temperature effect on runoff in early summer is partially
counteracted by the opposite effect in early spring.
Fig. 6(b) illustrates that, for all the years, snowmelt runoff increased linearly with
increase in temperature. However, the magnitude of the changes in snow melt runoff
for a particular year depends on the snow water equivalent storage and the climatic
conditions over the basin in that year. Based on three years’ projected climatic simula-
tions, a temperature increase from 1 to 3
8C increased snowmelt runoff from 2 to 28%. For
a 2
8C increase in temperature this range was found to be from 4 to 18% (Table 1). These
Table 2
Effect of increase in temperature on annual snow water equivalent and snowmelt runoff. All changes in tem-
perature are in
8C. RS indicates reference scenario
Year
Scenario
Snow water
equiv.(mm)
Change(%)
Snow melt
runoff(cum.d)
Change(%)
1987/88
T
+
0 RS
564
–
17 504
–
T
+
1
545
−
3.4
18 513
5.8
T
+
2
528
−
6.4
19 914
13.8
T
+
3
512
−
9.2
21 414
22.3
T
+
4
480
−
14.9
23 259
32.8
T
+
5
463
−
17.9
24 667
40.9
1988/89
T
+
0 RS
343
–
21 014
–
T
+
1
342
−
0.3
21 426
2.0
T
+
2
335
−
2.3
21 822
3.8
T
+
3
326
−
5.0
23 051
9.7
T
+
4
314
−
8.5
21 797
3.7
T
+
5
295
−
14.0
19 021
−
9.4
1989/90
T
+
0 RS
398
–
17 784
–
T
+
1
397
−
0.3
19 389
9.0
T
+
2
394
−
1.0
21 022
18.2
T
+
3
388
−
2.5
22 733
27.8
T
+
4
381
−
4.3
21 007
18.1
T
+
5
370
−
7.0
20 973
17.9
329
P. Singh, N. Kumar/Journal of Hydrology 193 (1997) 316–350
results indicate that the reduced build-up of snow under the warmer climate will not
always decrease the annual snow melt runoff for all snowbound basins. If snow available
in the basin does not melt completely under normal and warmer climate scenarios
(Fig. 4(c)), then the reduced snow water equivalent (SWE) will not decrease but increase
the annual snowmelt runoff. However, in another situation, when the snow accumulated in
the basin is melted in total, then the reduced SWE will decrease the annual snowmelt
runoff. Such results have not been reported before; therefore, in order to test this concept,
snowmelt runoff and SWE were computed for higher temperature scenarios (T
+
4
8C,
T
+
5
8C). It can be seen that annual snowmelt runoff starts decreasing for both T
+
4
8C and
T
+
5
8C temperature scenarios (Table 2).
Fig. 5. (a) Effect of changes in precipitation on monthly SWE over a T
+
2
8C scenario. (b) Effect of changes in
precipitation on annual SWE over a T
+
2
8C scenario.
330
P. Singh, N. Kumar/Journal of Hydrology 193 (1997) 316–350

Table 3
Effect of precipitation variation on annual snow water equivalent, snowmelt runoff, glacier melt runoff and total
streamflow over various temperature scenarios for 1987/88, 1988/89 and 1989/90. The changes in temperature
and precipitation are in
8C and percent, respectively. RS indicates reference scenario for this table
Year
Scenario
Snow
water
equiv.
(mm)
Change
(%)
Snow
melt
runoff
(cum.d)
Change
(%)
Glacier
melt
runoff
(cum.d)
Change
(%)
Total
stream
flow
(cum.d)
Change
(%)
1987/88 T
+
1, P
+
0 RS
545
–
18 513
–
10 681
–
62 212
–
T
+
1, P
−
10
490
−
10.1
16 235
−
12.3
11 198
4.8
58 829
−
5.4
T
+
1, P
−
5
518
−
4.9
17 339
−
6.3
10 938
2.4
60 498
−
2.8
T
+
1, P
+
5
572
5.0
19 757
6.7
10 467
−
2.0
63 941
2.8
T
+
1, P
+
10
600
10.1
21 040
13.6
10 283
−
3.7
65 768
5.7
T
+
2, P
+
0 RS
528
–
19 914
–
12 490
–
65 681
–
T
+
2, P
−
10
475
−
10.0
17 629
−
11.5
12 989
4.0
62 249
−
5.2
T
+
2, P
−
5
501
−
5.1
18 766
−
5.8
12 742
2.0
63 948
−
2.6
T
+
2, P
+
5
554
4.9
21 089
5.9
12 256
−
1.9
67 325
2.6
T
+
2, P
+
10
580
9.8
22 297
11.9
12 053
−
3.5
69 192
5.4
T
+
3, P
+
0 RS
512
–
21 414
–
14 338
–
69 518
–
T
+
3, P
−
10
460
−
10.2
19 168
−
10.5
14 836
3.5
66 109
−
4.9
T
+
3, P
−
5
486
−
5.1
20 249
−
5.4
14 599
1.8
67 805
−
2.5
T
+
3, P
+
5
537
4.9
22 547
5.3
14 117
−
1.5
71 245
2.5
T
+
3, P
+
10
563
10.0
23 740
10.9
13 928
−
2.9
73 087
5.1
1988/89 T
+
1, P
+
0 RS
342
–
21 426
–
12 102
–
63 141
–
T
+
1, P
−
10
307
−
10.2
18 973
−
11.5
12 333
1.9
58 925
−
6.7
T
+
1, P
−
5
324
−
5.3
20 324
−
5.1
12 267
1.4
61 177
−
3.1
T
+
1, P
+
5
358
4.7
22 537
5.2
11 953
−
1.2
64 935
2.8
T
+
1, P
+
10
375
9.6
23 690
10.6
11 810
−
2.4
66 815
5.8
T
+
2, P
+
0 RS
335
–
21 822
–
13 873
–
64 645
–
T
+
2, P
−
10
301
−
10.1
19 767
−
9.4
14 185
2.3
61 069
−
5.5
T
+
2, P
−
5
318
−
5.1
20 751
−
4.9
14 032
1.2
62 854
−
2.8
T
+
2, P
+
5
351
4.8
22 818
4.6
13 732
−
1.0
66 379
2.7
T
+
2, P
+
10
369
10.0
23 854
9.3
13 599
−
2.0
68 221
5.5
T
+
3, P
+
0 RS
326
–
23 051
–
15 640
–
67 516
–
T
+
3, P
−
10
294
−
9.8
21 079
−
8.6
15 950
2.0
64 126
−
5.0
T
+
3, P
−
5
309
−
5.2
22 025
−
4.5
15 796
1.0
65 812
−
2.5
T
+
3, P
+
5
342
4.9
24 031
4.3
15 490
−
0.9
69 150
2.4
T
+
3, P
+
10
359
10.1
25 081
8.8
15 346
−
1.9
70 836
4.9
1989/90 T
+
1, P
+
0 RS
397
–
19 389
–
11 283
–
59 451
–
T
+
1, P
−
10
356
−
10.3
17 312
−
10.7
11 644
3.2
55 661
−
6.4
T
+
1, P
−
5
376
−
5.3
18 214
−
5.7
11 470
1.7
57 307
−
3.6
T
+
1, P
+
5
416
4.8
20 601
6.3
11 977
6.2
62 589
5.3
T
+
1, P
+
10
436
9.8
21 612
11.5
11 809
4.7
64 527
8.5
T
+
2, P
+
0 RS
394
–
21 022
–
13 029
–
62 257
–
T
+
2, P
−
10
353
−
10.4
18 862
−
10.3
13 411
2.9
58 585
−
5.9
T
+
2, P
−
5
372
−
5.6
19 878
−
5.4
13 225
1.5
60 166
−
3.4
T
+
2, P
+
5
412
4.6
22 259
5.9
13 731
5.4
65 325
4.9
T
+
2, P
+
10
432
9.6
23 341
11.0
13 554
4.0
67 214
7.9
T
+
3, P
+
0 RS
388
–
22 733
–
14 903
–
65 791
–
T
+
3, P
−
10
348
−
10.3
18 197
−
19.9
15 276
2.5
59 578
−
9.4
T
+
3, P
−
5
367
−
5.4
20 466
−
9.9
15 094
1.3
62 627
−
4.8
T
+
3, P
+
5
406
4.6
24 007
5.6
15 583
4.6
68 785
4.6
T
+
3, P
+
10
425
9.8
25 130
10.5
15 415
3.4
70 439
7.1
331
P. Singh, N. Kumar/Journal of Hydrology 193 (1997) 316–350

Fig. 4(c) shows that SWE in the basin decreases under all the warmer climatic scenarios
because a higher increase in temperature builds up less snow in the basin. The important
point to be noted is that an increase in temperature up to 3
8C does not melt the entire
accumulated snow cover in the basin; i.e., snow remains in the basin after the melt period
under both normal and warmer climate scenarios. However, the quality of this remaining
snow in the basin decreases as the temperature increases, but an increase up to 3
8C has not
depleted it completely for any year (1987/88, 1988/89 or 1989/90) and snow is always
available for melting under warmer scenarios (T
+
1 to T
+
3
8C) throughout the melt period.
Therefore, a higher melt rate under the warmer climate (T
+
1 to T
+
3
8C) and a broadened
melt period would increase the annual snow melt runoff. But, for higher temperature
scenarios (T
+
4, T
+
5
8C) snow storage in the basin approaches nil, and therefore the annual
snow melt runoff decreases for this temperature range.
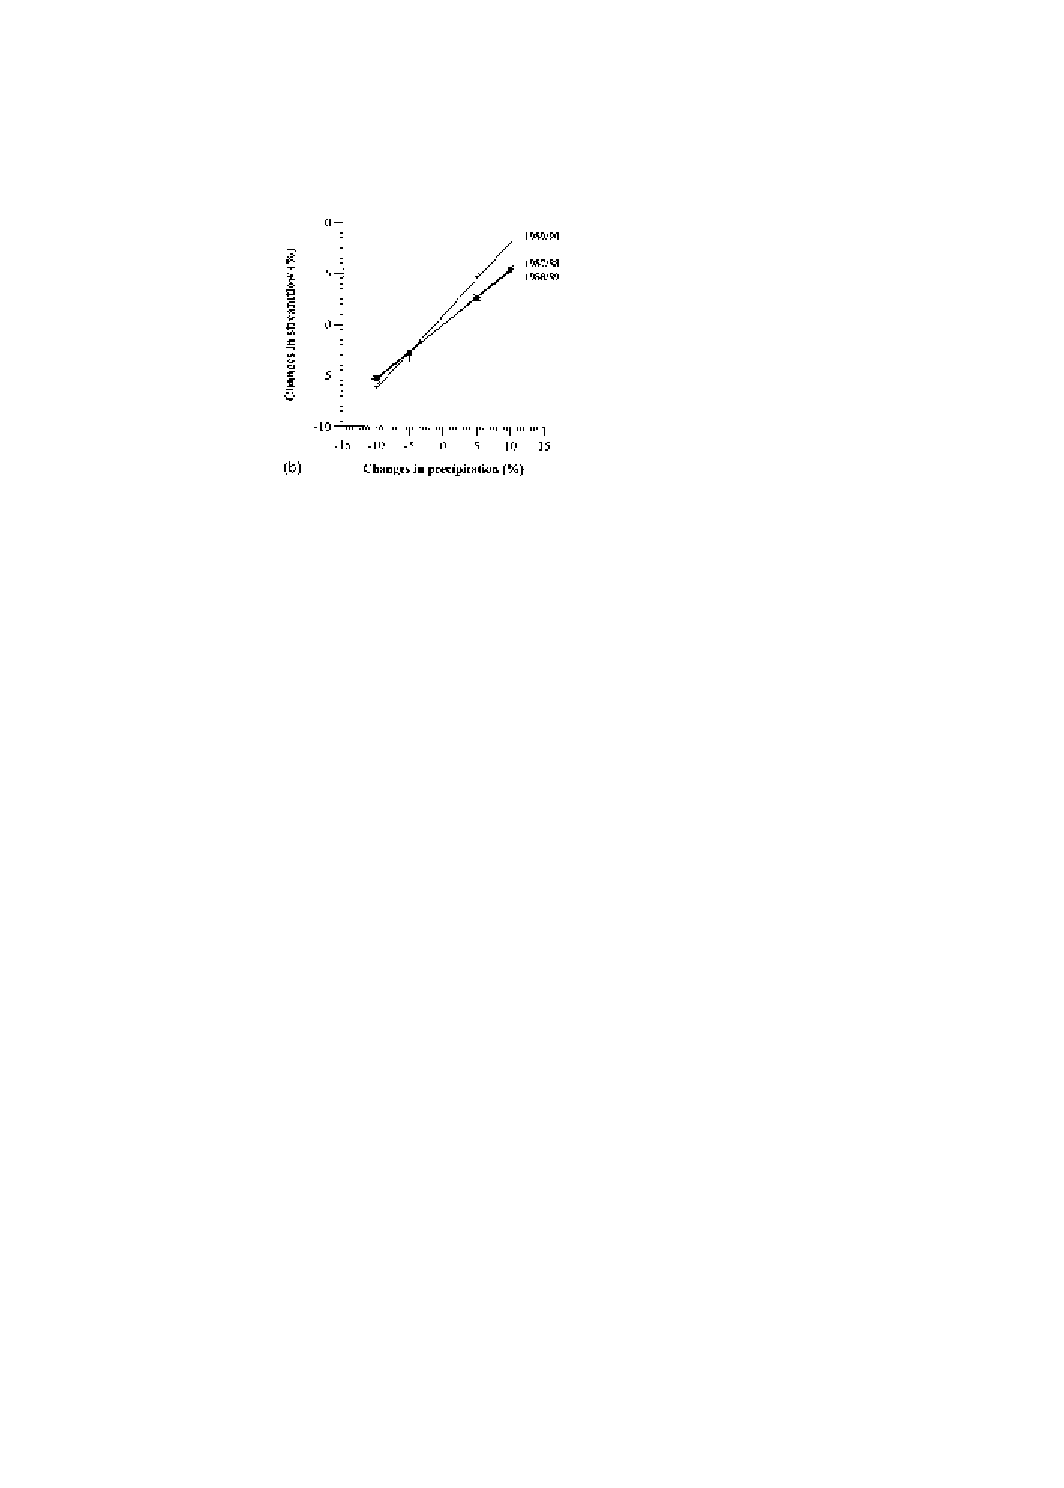
6.2.2. Temperature and precipitation scenarios
The impact of precipitation changes over T
+
2
8C on daily snow melt runoff is shown in
Fig. 7(a). No changes are observed in the snowmelt period or the timing of peak snow melt
runoff, but the magnitude of peak runoff is higher under the higher precipitation scenario
and vice versa. It is evident from Fig. 7(b) that, for all the years, annual snowmelt runoff
increases linearly with changes in precipitation. Changes in precipitation by
−
10 and
+
10% vary the annual snowmelt runoff over the T
+
2
8C scenario by
−
11.5 and 11.9,
−
9.4 and 9.3%,
−
10.3 and 11.0% respectively for 1987/88, 1988/89, 1989/90. Combined
temperature and precipitation scenarios influence both snow water equivalent and melting
conditions over the basin. In the warmer conditions snow cover will deplete faster if
precipitation is not changed. In the case where both temperature and precipitation increase,
the temperature will cause a faster melt but precipitation will enhance the snowpack. Fig.
7(b) illustrates that higher snowmelt runoff is observed with a higher amount of precipita-
tion, because the increase in precipitation provides a higher snow water equivalent and, in
addition, snow is stored in the catchment at high altitudes and melts in the following
snowmelt season or later as snowmelt runoff. Consequently, it causes an increase in annual
snowmelt runoff (Table 1). Results for changes in annual snowmelt runoff corresponding
to various temperature and precipitation scenarios are given in Tables 3 and 4.
The maximum increase (19 to 41%) in annual snowmelt runoff has occurred under a
T
+
3
8C, P
+
10% scenario.
6.3. Glacier melt runoff
6.3.1. Temperature scenarios
The study basin includes glaciers. However, the magnitude of glacier contribution to the
total flow is much less than that of snowmelt runoff. Normally their major contribution to
the streamflow occurs in the months of July and August after the snow cover on the glacier
has melted. The effect of a T
+
2
8C temperature scenario on daily glacier melt runoff is
shown in Fig. 8(a). As expected, the contribution from the glacier starts earlier under the
warmer climate. There is systematic increase in the glacier melt runoff with increase in
temperature, which is expected because the total glaciated area does not change signifi-
cantly with time and therefore it produces higher runoff under a warmer climate. In
332
P. Singh, N. Kumar/Journal of Hydrology 193 (1997) 316–350
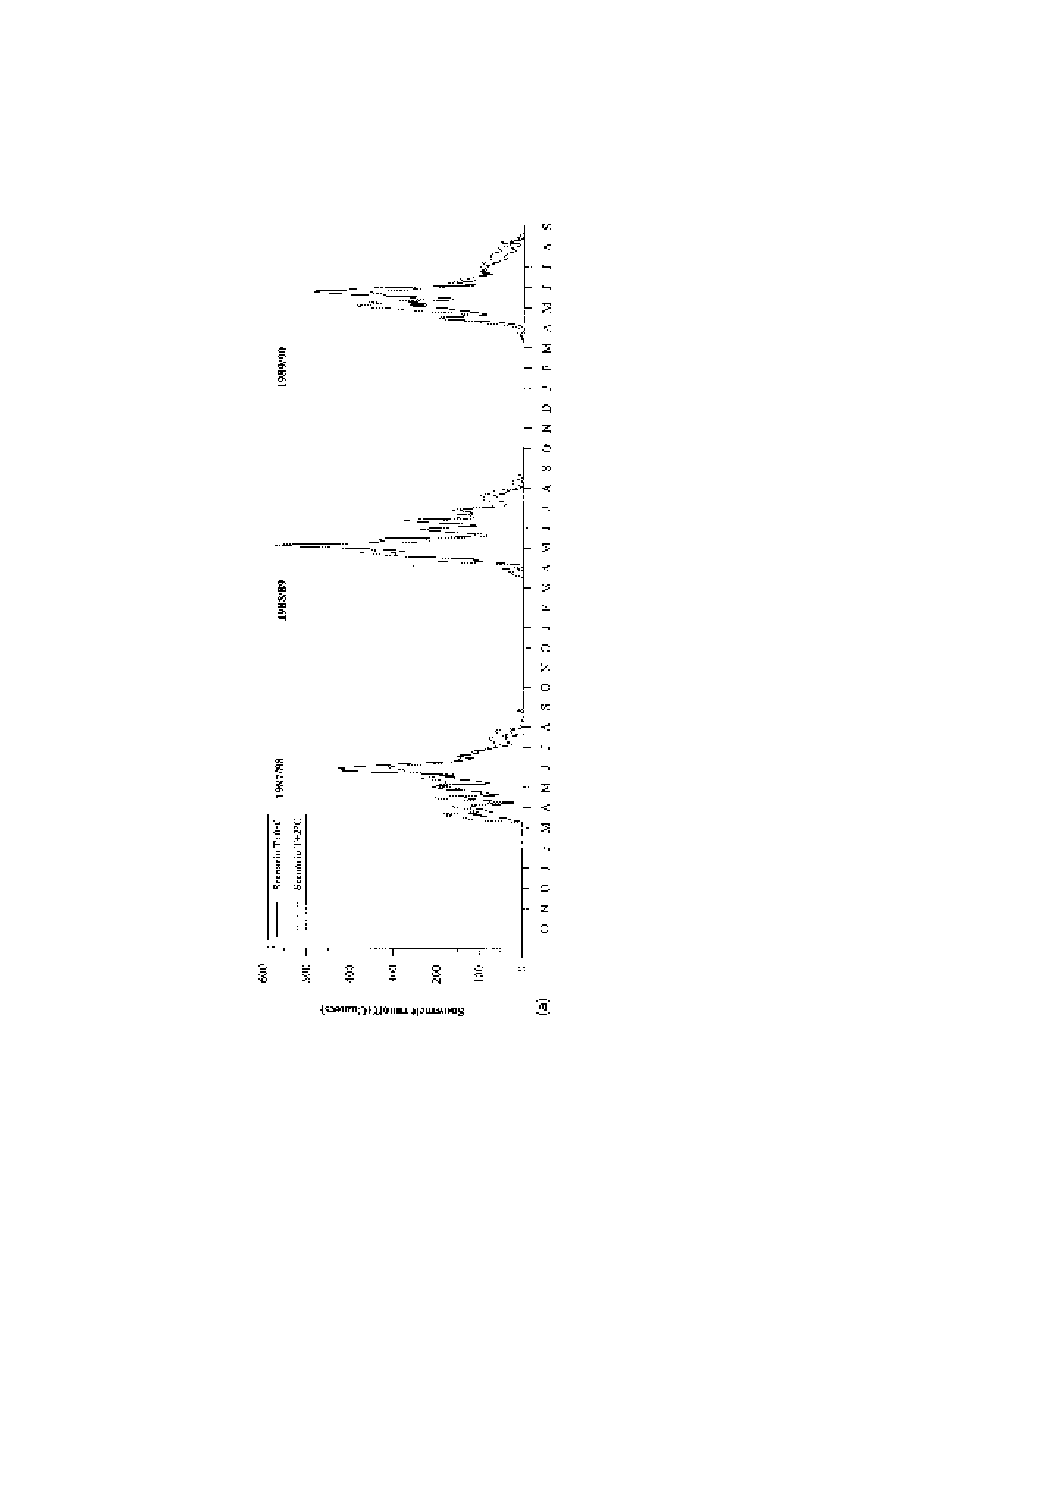
Fig.
6.
(a)
Effect
of
increase
in
temperature
on
daily
snow
melt
runoff
.
(b)
Effect
o
f
increase
in
tempera
ture
on
annual
snow
melt
runoff
.
333
P. Singh, N. Kumar/Journal of Hydrology 193 (1997) 316–350
contrast, for snowmelt runoff, as the snowline moves up, the lower part of the basin
becomes snowfree and no contribution is obtained from the bare area in terms of snow
melt runoff.
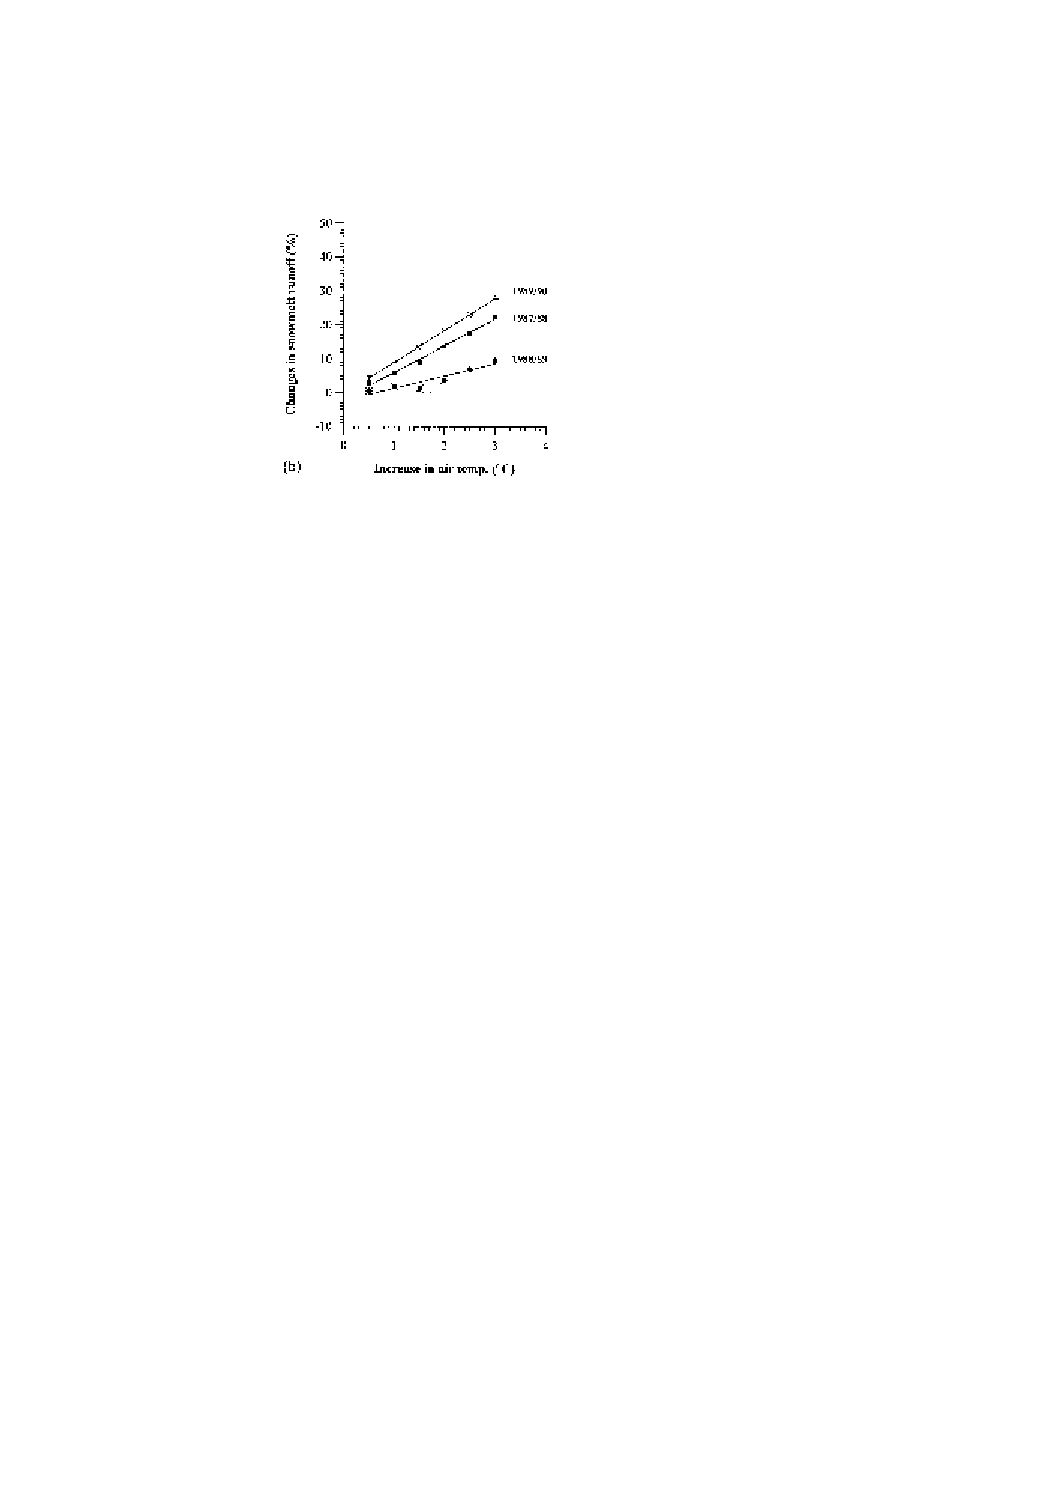
Variations in total annual glacier melt runoff for different temperature increase
scenarios are shown in Fig. 8(b). It is seen to increase linearly with projected range of
temperature. A significant increase is found in the glacier melt runoff under a warmer
climate as compared with other components of runoff. For an increase of 2
8C in air
temperature, the glacier melt runoff has increased by 38, 33 and 36%, respectively, for
1987/88, 1988/89, 1989/90 (Table 1). Like other components of streamflow, the magni-
tude of glacier melt runoff also depends on the original temperature regime during a
particular year.
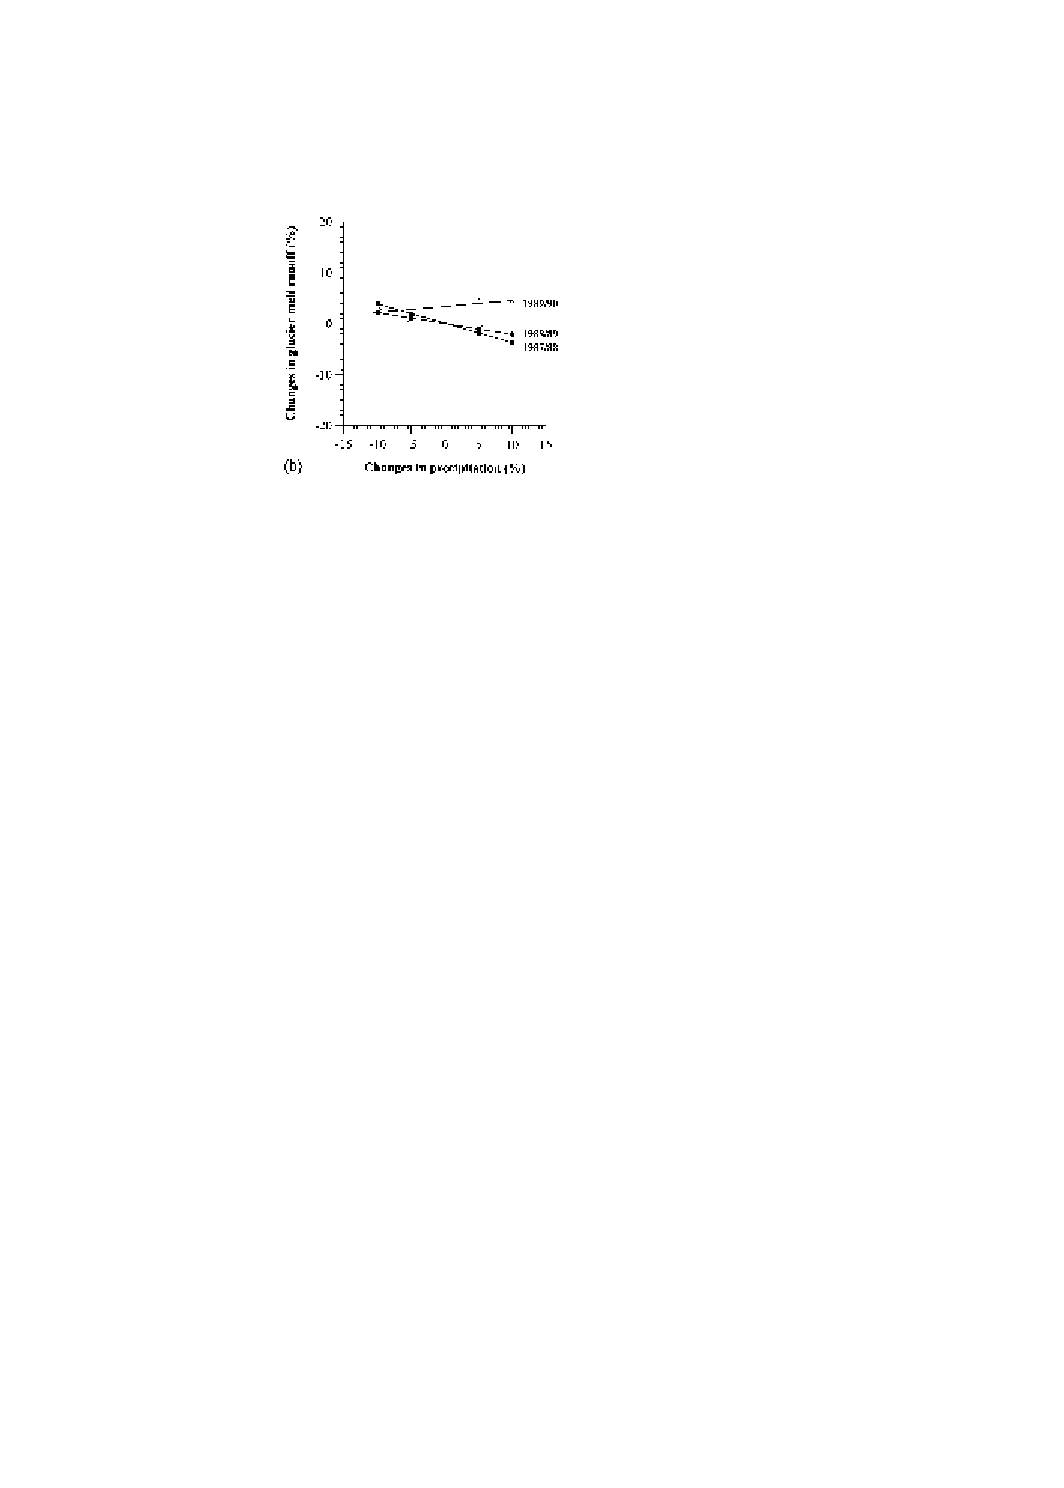
6.3.2. Temperature and precipitation scenarios
Fig. 9(a) presents the results of precipitation variation from
−
10% to
+
10% on daily
glacier melt runoff over a T
+
2
8C scenario. The effect of changes in temperature and
precipitation on annual glacier melt runoff is illustrated in Fig. 9(b). It is seen that pro-
jected changes in precipitation do not change glacier melt runoff very significantly. In
general, there is an inverse effect to the changes in precipitation; i.e., an increase in
precipitation reduces glacier melt runoff and vice versa. The increase in precipitation
results in a higher snowpack over the glaciers, which are exposed relatively later because
snowmelt runoff lasts longer, resulting in a smaller contribution of glacier melt runoff
when precipitation is increased. For the lower precipitation scenario, the glaciers are
exposed for a longer time, producing more glacier melt runoff. The details of results
obtained for combined temperature and precipitation are shown in Tables 3 and 4. The
present investigations indicate that the maximum increase in annual glacier melt runoff
(53–64%) is obtained under a T
+
3
8C, P
−
10% scenario, which in the long term would lead
to glacier depletion and retreat.
Fig. 6. Continued.
334
P. Singh, N. Kumar/Journal of Hydrology 193 (1997) 316–350
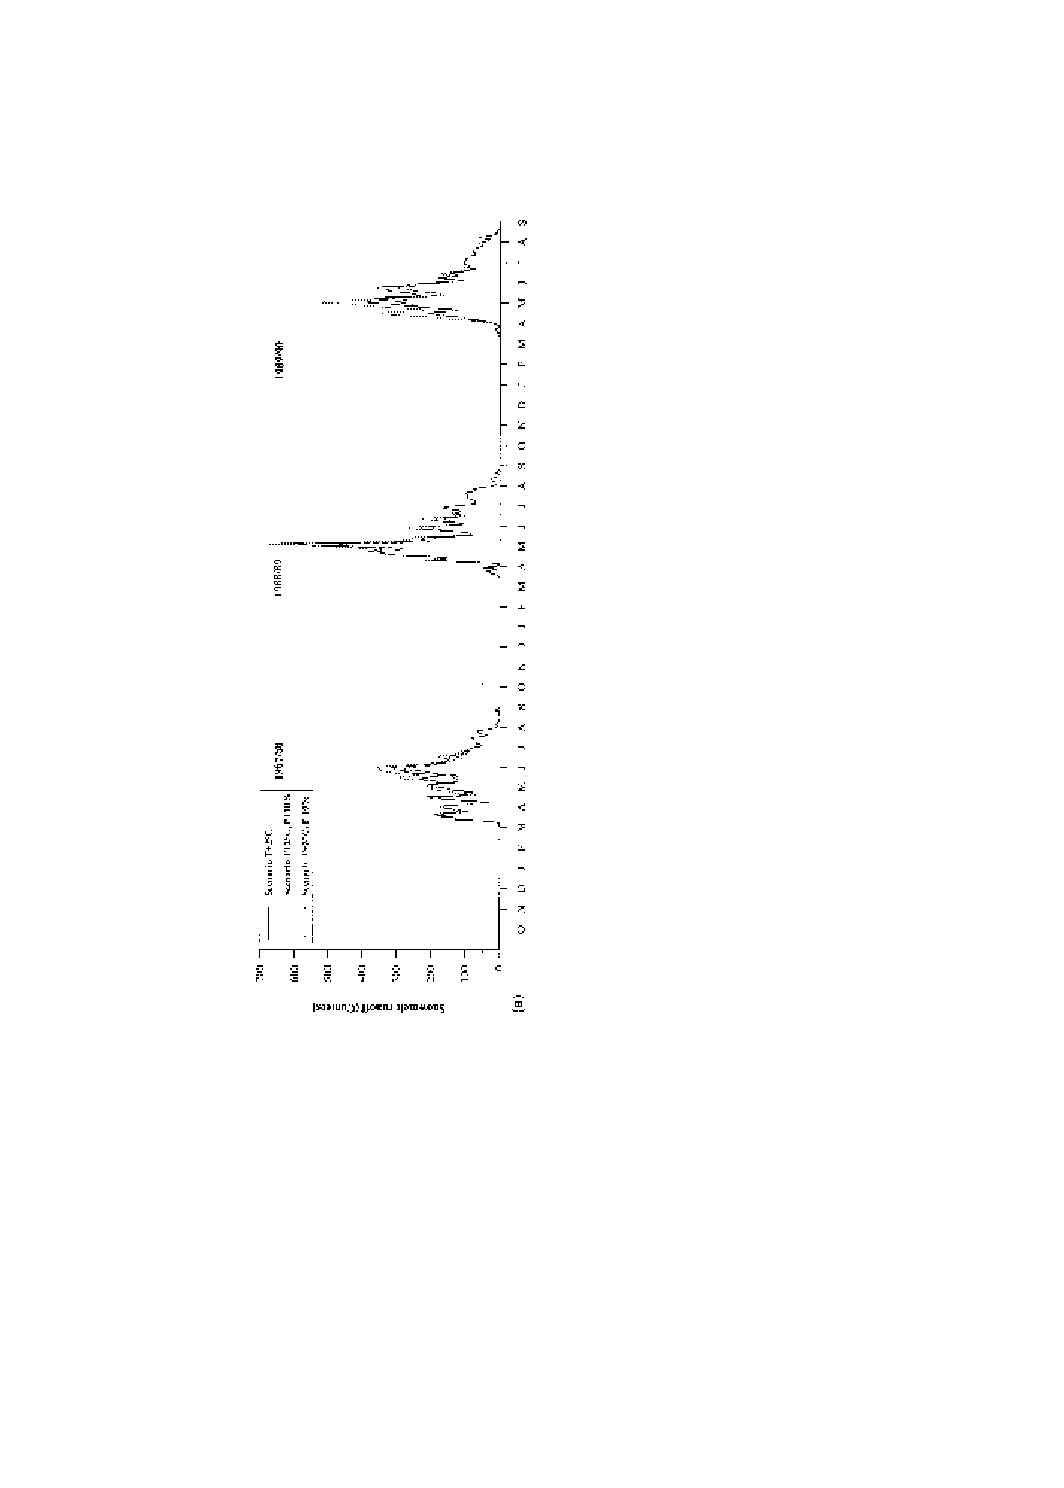
Fig.
7.
(a)
Effect
of
changes
in
precipitatio
n
o
n
d
aily
snowm
elt
ru
noff
over
a
T
+
28
C
scenario.
(b
)
Effect
of
changes
in
precipit
ation
on
annual
snowme
lt
runof
f
over
a
T
+
28
C
scenario.
335
P. Singh, N. Kumar/Journal of Hydrology 193 (1997) 316–350
In addition to the climatic conditions in a current year over a glacier, melting of the
glacier is also governed by the accumulation and ablation patterns of the snowpack of
previous years. If some snow is left in a preceding year covering the glacier, it is added to
the snowpack built up in the current year and even years before, so that the period of
exposure of the glaciers, and their contributions, are influenced by the status of the
snowpack left in preceding years. Changes in glacier melt runoff for 1989/90 for projected
temperature and precipitation scenarios are well supported by this concept. For example,
both 1988/89 and 1989/90 experienced less precipitation in comparison to 1987/88. In
addition, changes in precipitation are considered as an absolute percentage of precipita-
tion. For a low precipitation year, the change in precipitation by a specific projected
percentage will be less than the change in a high precipitation year due to the same
projected percentage. For example, in the low precipitation year of 1989/90 not even an
increase in precipitation could decrease the glacier melt runoff because the glaciers were
exposed earlier.
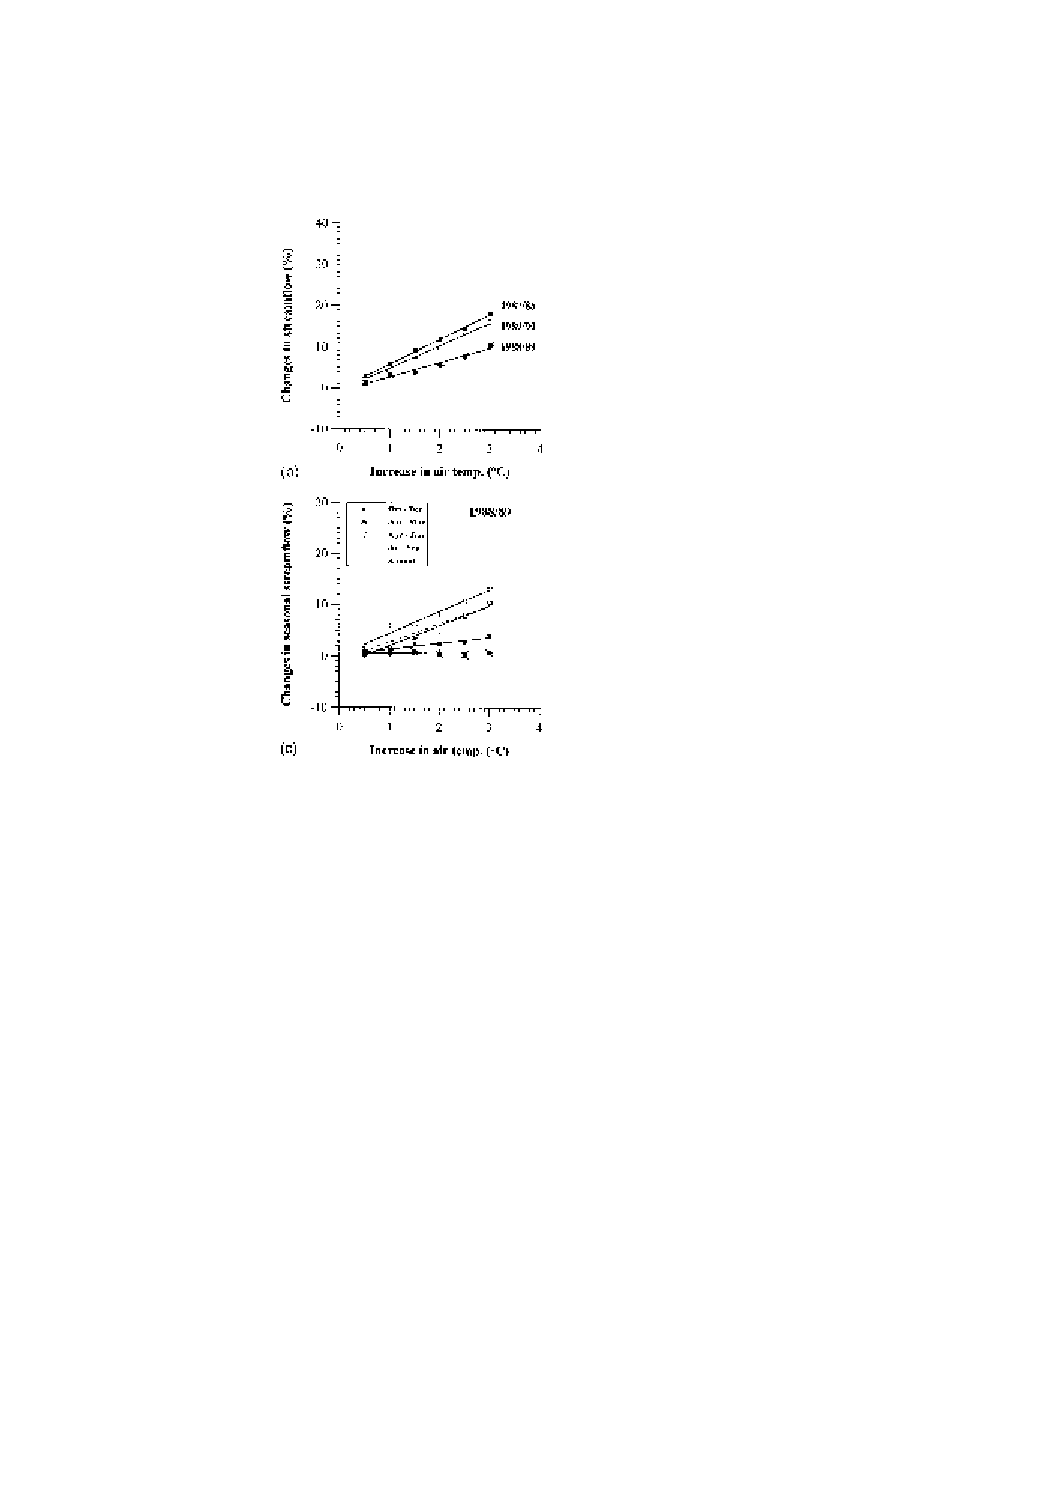
6.4. Total streamflow
6.4.1. Temperature scenarios
As discussed above, snow and glacier contribution forms a major part of the total runoff
in this basin, and therefore changes in the snow and glacier melt runoff due to various
climatic scenarios are reflected in the changes of total streamflow. For a basin having
precipitation storage characteristics, an increase in total streamflow is expected under a
warmer climate because runoff from both snow and glaciers is accelerated. Changes in
daily streamflow distribution for a temperature increase of 2
8C are illustrated in Fig. 10(a).
In general, the timing of peak streamflow is not affected; however, there is a change in the
magnitude of peak streamflow, depending upon the spring melting condition. Fig. 10(a)
also indicates that no significant change in the winter streamflow could be produced for
Fig. 7. Continued.
336
P. Singh, N. Kumar/Journal of Hydrology 193 (1997) 316–350
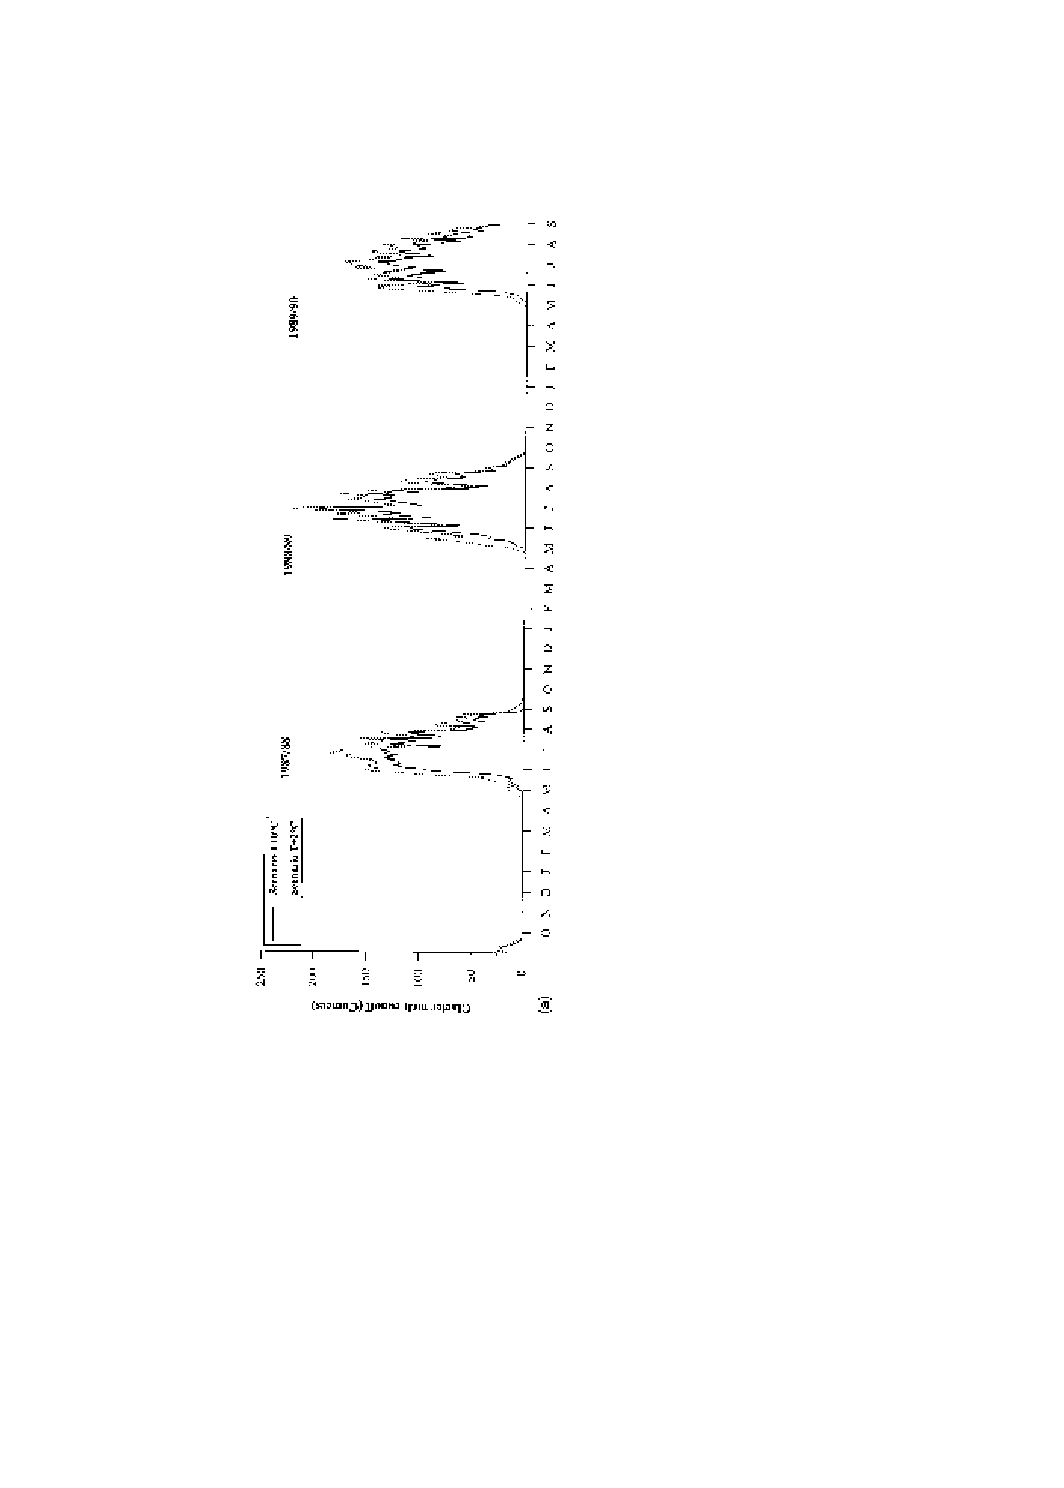
Fig.
8.
(a)
Effect
of
increase
in
temperature
on
daily
glacier
melt
runoff
.
(b
)
Effect
of
increase
in
temperatu
re
on
annual
glacier
melt
runoff.
337
P. Singh, N. Kumar/Journal of Hydrology 193 (1997) 316–350

this watershed by the T
+
2
8C temperature scenario, whereas several authors have sug-
gested that winter discharge would increase when temperature is increased. This is dis-
cussed in the next section. Like annual snow and glacier melt runoff, annual total
streamflow runoff also varies linearly with increase in temperature (Fig. 10(b)). For a
temperature increase of 2
8C, the variation in annual streamflow is computed to be 12, 6
and 10% respectively for 1987/88, 1988/89, 1989/90. Changes in total annual streamflow
for other temperature scenarios are given in Table 1.
To understand the seasonal variation in total streamflow, a seasonal analysis was carried
out. For this purpose a year was divided into four seasons, namely snowmelt season or pre-
monsoon season (April–June), monsoon season (July–September), post-monsoon season
(October–December) and winter season (January–March). Relative changes in each sea-
son with increase in temperature for the year 1988/89 are depicted in Fig. 10(c), and details
for other years are given in Table 5. Changes in the streamflow for all the seasons are
linearly related to the increase in temperature. The maximum increase in streamflow
runoff is computed to be in the pre-monsoon season followed by the monsoon season.
Cayan and Riddle (1993) also reported that temperature sensitivity seems to be confined to
spring and early summer. A larger increase in the pre-monsoon season is possible because
of the higher amount of snowmelt runoff due to the warmer climate. It should be men-
tioned that higher flows in the pre-monsoon season may benefit the country because
demand for water, both for hydropower and for agriculture, is very high during this season.
Further, higher variation in the streamflow during the monsoon season may occur because
of snowmelt runoff from the high snowfields, with glacier melt runoff contributing along
with rain. Post-monsoon and winter flows are not affected significantly. However, some
studies indicate an increase in winter discharge due to a warmer environment caused by
increased temperatures (Gleick, 1987b; Bultot et al., 1988; McCabe and Ayers, 1989;
Cooley, 1990). It is understood that an increase in winter discharge is possible either
because part of the precipitation may fall as rain or because some snowpack may melt
Fig. 8. Continued.
338
P. Singh, N. Kumar/Journal of Hydrology 193 (1997) 316–350
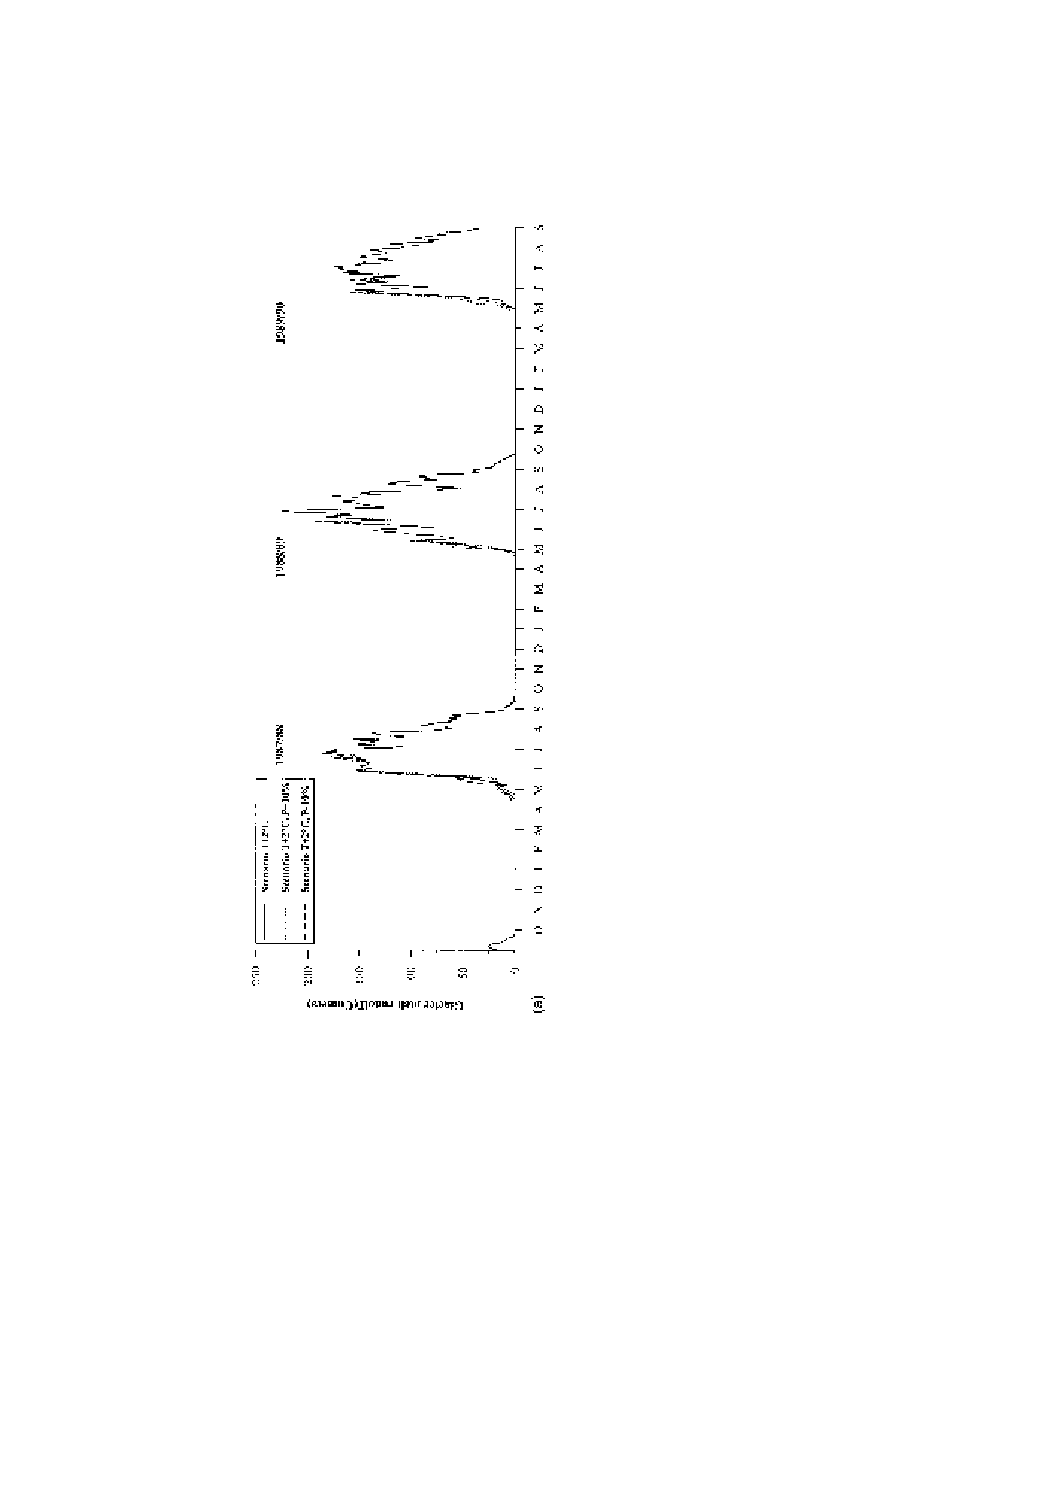
Fig.
9.
(a)
Effect
of
changes
in
precipit
ation
on
daily
glacie
r
melt
runoff
over
a
T
+
28
C
scenario.
(b)
Effect
of
changes
in
pr
ecipitatio
n
o
n
annual
glacier
melt
over
a
T
+
28
C
scenario.
339
P. Singh, N. Kumar/Journal of Hydrology 193 (1997) 316–350
under warmer climatic conditions. The combination of these two processes can increase
streamflow during the winter period. For the study basin, both conditions are found not to
be applicable because of the very low temperature regime and, therefore, no significant
changes are observed in the winter discharge due to increased air temperatures. On the
basis of the three years, it is seen that the magnitude of the changes in annual streamflow is
very close to the variation in magnitude of the monsoon season. During the monsoon
season streamflow consists of rain, snow and glacier melt from higher altitudes.
6.4.2. Temperature and precipitation scenarios
The effect of changes in precipitation on the daily streamflow for a T
+
2
8C scenario is
shown in Fig. 11(a). A higher amount of precipitation produces a higher streamflow,
maintaining the same timing of peak streamflow. Results indicate that streamflow changes
linearly with changes in precipitation (Fig. 11(b)). The impact of combined scenarios is
given in Table 3. Similar results were obtained by Ng and Marsalek (1992). For the
scenarios studied, the maximum increase (16–24%) in annual total streamflow runoff is
produced under a T
+
3
8C, P
+
10% scenario (Table 4).
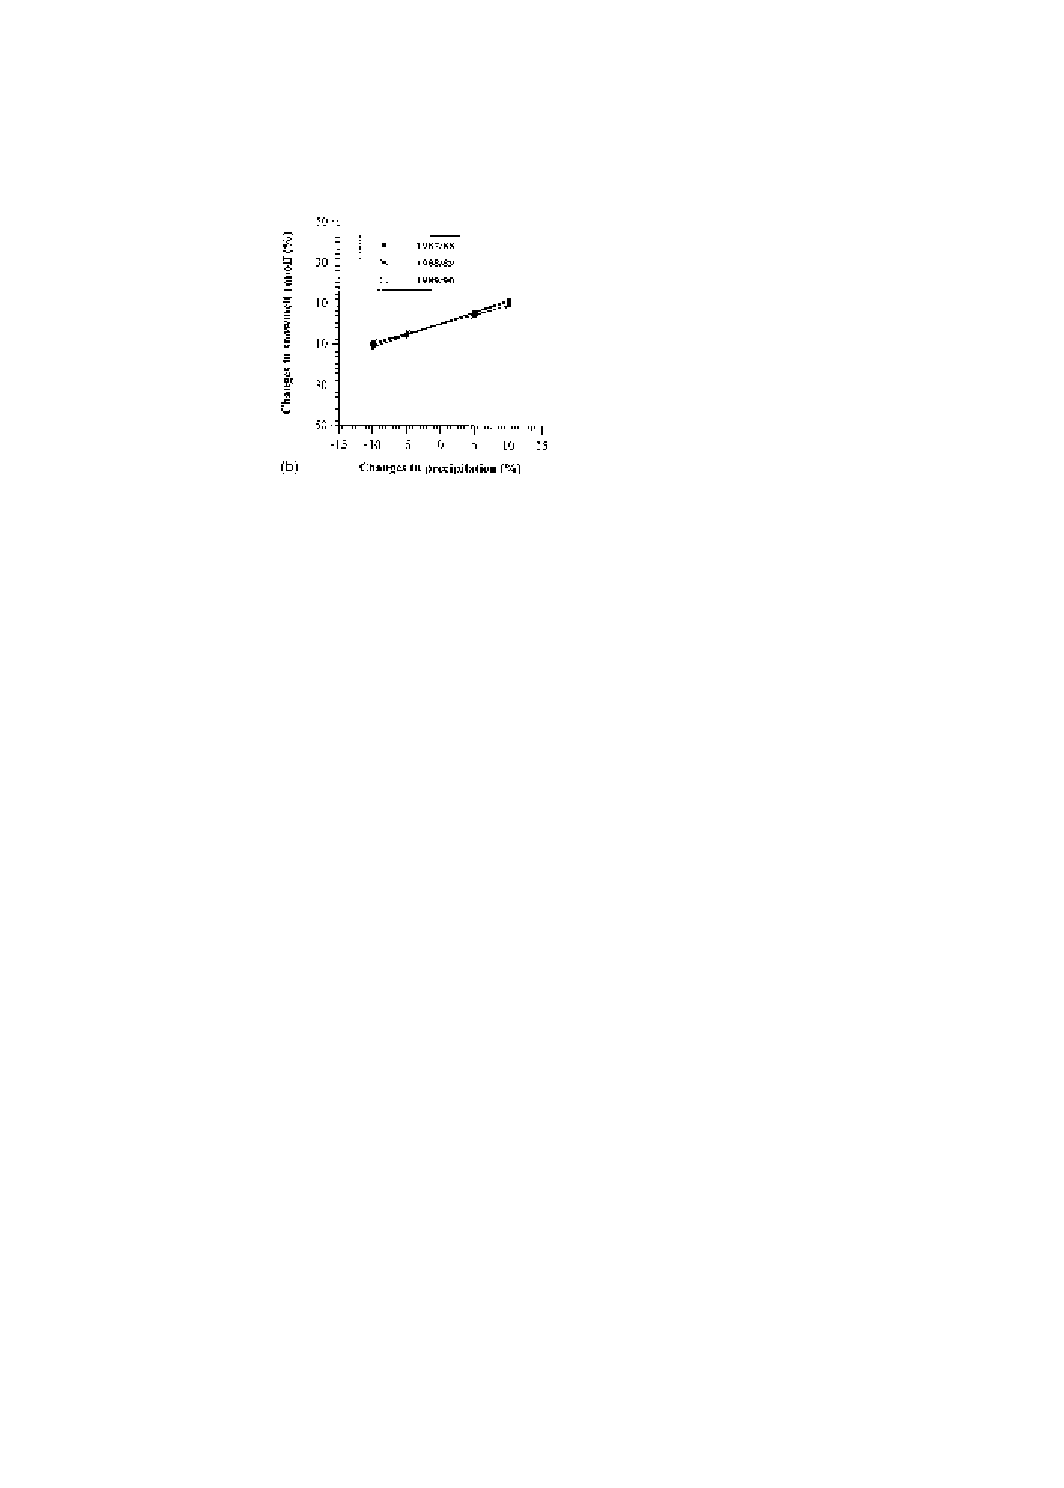
7. Comparison of climate change impact on snowmelt runoff, glacier melt runoff and
total streamflow
To compare the changes in annual snowmelt, glacier melt and total runoff due to
projected climatic scenarios, these are shown together for 1988/89 in Fig. 12(a) and (b).
For other years, the results are in the tables. It is clear that the maximum effect of increased
temperature is found on glacier melt runoff as compared with snow melt runoff and total
runoff. For this basin, an increase in 2
8C in air temperature increased snowmelt runoff,
glacier melt runoff and total streamflow in amounts ranging from 4 to 18%, 33 to 38% and
6 to 12%, respectively. Maximum variation in snowmelt runoff (19–41%) and total
Fig. 9. Continued.
340
P. Singh, N. Kumar/Journal of Hydrology 193 (1997) 316–350
Fi
g.
10.
(a)
Effect
o
f
increase
in
temperature
on
daily
total
streamflow.
(b)
Effect
of
increase
in
temperatu
re
on
annual
total
streamflow.
(c)
Effect
of
increase
in
temperature
on
seasonal
streamflow.
341
P. Singh, N. Kumar/Journal of Hydrology 193 (1997) 316–350
streamflow (16–24%) is found when both temperature and precipitation are high (T
+
3
8C
and P
+
10%), whereas maximum variation in glacier melt runoff (53–64%) is obtained
when temperature is high but precipitation is low (T
+
3
8C and P
−
10%). Changes in snow
and glacier melt runoff are also reflected in changes in total streamflow. For example, in
1988/89, the variation in snowmelt runoff is relatively lower, which results in less varia-
tion in total streamflow in that year. Further, it is seen that snowmelt runoff is more
sensitive than glacier melt runoff to the projected changes in precipitation, and that the
sensitivity of total streamflow lies between these two (Fig. 12(b)).
A long-term effect of temperature and precipitation changes on the physical character-
istics of the glacier can be addressed on the basis of these results. An increase in air
temperature for a longer time will reduce the size of glaciers due to their higher melting
rate. Similar effects are expected under the scenarios of less precipitation. The glaciers
Fig. 10. Continued.
342
P. Singh, N. Kumar/Journal of Hydrology 193 (1997) 316–350

Table 4
Variation in annual SWE, snowmelt runoff, glacier melt runoff and total streamflow under various temperature
and precipitation scenarios with respect to simulation obtained using original temperature and precipitation data
for 1987/88-1989/90. Changes in temperature and precipitation are in
8C and percent, respectvely. RS indicates
reference scenario
Year
Scenario
Snow
water
equiv.
(mm)
Change
(%)
Snow
melt
runoff
(cum.d)
Change
(%)
Glacier melt
runoff
(cum.d)
Change
(%)
Total stream
flow
(cum.d)
Change
(%)
1987/88
T
+
0, P
+
0 RS
564
–
17 504
–
9 072
–
58 808
–
T
+
1, P
−
10
490
−
13.1
16 235
−
7.2
11 198
23.4
58 829
0.04
T
+
1, P
−
5
518
−
8.2
17 339
−
0.9
10 938
20.6
60 498
2.8
T
+
1, P
+
0
545
−
3.4
18 513
5.8
10 681
17.7
62 212
5.8
T
+
1, P
+
5
572
1.4
19 757
12.8
10 467
15.4
63 941
8.7
T
+
1, P
+
10
600
6.4
21 040
20.2
10 283
13.4
65 768
11.8
T
+
2, P
−
10
475
−
15.8
17 629
0.7
12 989
43.2
62 249
5.9
T
+
2, P
−
5
501
−
11.2
18 766
7.2
12 742
40.5
63 948
8.7
T
+
2, P
+
0
528
−
6.4
19 914
13.8
12 490
37.7
65 681
11.7
T
+
2, P
+
5
554
−
1.8
21 089
20.5
12 256
35.1
67 375
14.6
T
+
2, P
+
10
580
2.8
22 297
27.4
12 053
32.9
69 192
17.7
T
+
3, P
−
10
460
−
18.4
19 168
9.5
14 836
63.5
66 109
12.4
T
+
3, P
−
5
486
−
13.8
20 249
15.7
14 599
60.9
67 805
15.3
T
+
3, P
+
0
512
−
9.2
21 414
22.3
14 338
58.0
69 518
18.2
T
+
3, P
+
5
537
−
4.8
22 547
28.8
14 117
55.6
71 245
21.2
T
+
3, P
+
10
563
−
0.17
23 740
35.6
13 928
53.5
73 087
24.3
1988/89
T
+
0, P
+
0 RS
343
–
21 014
–
10 451
–
61 171
–
T
+
1, P
−
10
307
−
10.5
18 973
−
9.7
12 333
18.0
58 925
−
3.7
T
+
1, P
−
5
324
−
5.5
20 324
−
3.3
12 267
17.4
61 177
0.01
T
+
1, P
+
0
342
−
0.3
21 426
2.0
12 102
15.8
63 141
3.2
T
+
1, P
+
5
358
4.4
22 537
7.3
11 953
14.4
64 935
6.2
T
+
1, P
+
10
376
9.6
23 690
12.7
11 810
13.0
66 815
9.2
T
+
2, P
−
10
301
−
12.2
19 767
−
5.9
14 185
35.7
61 069
−
0.2
T
+
2, P
−
5
318
−
7.3
20 751
−
1.3
14 032
34.3
62 854
2.86
T
+
2, P
+
0
335
−
2.3
21 822
3.8
13 873
32.7
64 645
5.7
T
+
2, P
+
5
351
2.3
22 818
8.6
13 732
31.4
66 379
8.5
T
+
2, P
+
10
369
7.6
23 854
13.5
13 599
30.1
68 221
11.5
T
+
3, P
−
10
294
−
14.3
21 079
0.3
15 950
52.6
64 126
4.8
T
+
3, P
−
5
309
−
9.9
22 025
4.8
15 796
51.1
65 812
7.6
T
+
3, P
+
0
326
−
5.0
23 051
9.7
15 640
49.6
67 516
10.4
T
+
3, P
+
5
342
−
0.3
24 031
14.4
15 490
48.2
69 150
13.0
T
+
3, P
+
10
359
4.6
25 081
19.4
15 346
46.8
70 836
15.8
1989/90
T
+
0, P
+
0 RS
398
–
17 784
–
9 598
–
56 649
–
T
+
1, P
−
10
356
−
10.6
17 312
−
2.7
11 644
21.3
55 661
−
1.7
T
+
1, P
−
5
376
−
5.5
18 284
2.8
11 470
19.5
57 307
1.2
T
+
1, P
+
0
397
−
0.3
19 389
9.0
11 283
17.6
59 451
4.9
T
+
1, P
+
5
416
4.5
20 601
15.8
11 977
24.8
62 589
10.5
T
+
1, P
+
10
436
9.5
21 612
21.5
11 809
23.0
64 527
13.9
T
+
2, P
−
10
353
−
11.3
18 862
6.1
13 411
39.7
58 585
3.4
T
+
2, P
−
5
372
−
6.5
19 878
11.8
13 225
37.8
60 166
6.2
T
+
2, P
+
0
394
−
1.0
21 022
18.2
13 029
35.7
62 257
9.9
T
+
2, P
+
5
412
3.5
22 259
25.2
13 731
43.1
65 325
15.3
T
+
2, P
+
10
432
8.5
23 341
31.2
13 554
41.2
67 214
18.7
T
+
3, P
−
10
348
−
12.6
18 197
2.3
15 276
59.2
59 578
5.2
T
+
3, P
−
5
367
−
7.7
20 466
15.1
15 094
57.3
62 627
10.6
T
+
3, P
+
0
388
−
2.5
22 733
27.8
14 903
55.3
65 791
16.1
T
+
3, P
+
5
406
2.2
24 007
35.0
15 583
62.4
68 785
21.4
T
+
3, P
+
10
426
7.0
25 130
41.3
15 415
60.6
70 439
24.3
343
P. Singh, N. Kumar/Journal of Hydrology 193 (1997) 316–350

will retreat because of their faster depletion under these conditions. Moreover, a combina-
tion of these two scenarios, increase in temperature and decrease in precipitation, for a
longer time will have the compound effect of reducing them in size. On the other hand, the
glaciers may grow in size and chances of their advancement will be higher if precipitation
increases and temperature does not change.
8. Conclusions
The basic objective of this study is to provide the estimates of the impacts of various
climate scenarios on the hydrological response of the high altitude Spiti river in the
Himalayas. The climatic scenarios were constructed on the basis of simulations of the
Hamburg coupled atmosphere–ocean climate model for the study region. The influence of
these scenarios on the snow water equivalent, snowmelt runoff, glacier melt runoff, total
streamflow and their distribution have been studied. The adopted changes in temperature
and precipitation ranged from 1 to 3
8C and from
−
10 to
+
10%, respectively. The following
conclusions are drawn from this study:
1. Snow water equivalent over the study basin reduces with an increase in air tempera-
ture (T
+
1, T
+
2, T
+
3
8C; P
+
0%). However, no significant reduction in annual SWE is
observed for these projected increases in air temperature for this basin. It seems that the
high altitude and low temperature regime of the basin limits reduction in SWE. An
increase of 2
8C in air temperature reduces annual SWE in the range of 1 to 7% (T
+
2
8C, P
+
0%). The changes in SWE are found to be proportional to the changes in
precipitation. Maximum reduction in annual SWE (13–18%) is found under a T
+
3
8C,
P
−
10% scenario.
2. Under warmer climate scenarios (T
+
1, T
+
2, T
+
3
8C; P
+
0%), snowmelt runoff,
glacier melt runoff and total streamflow produce an early response along with a change in
Table 5
Effect of increase in temperature on seasonal and annual total streamflow. All changes in temperature are in
8C.
RS indicates reference scenario
Year
Scenario
Oct.–Dec.
Jan.–Mar.
Apr.–Jun.
Jul.–Sep.
Annual
Flow
(cum.d)
Change
(%)
Flow
(cum.d)
Change
(%)
Flow
(cum.d)
Change
(%)
Flow
(cum.d)
Change
(%)
Flow
(cum.d)
Change
(%)
1987/88 T
+
0 RS
5501
–
3353
–
21 907
–
28 047
–
58 808
–
T
+
1
5536
0.6
3354
0.03
23 832
8.8
29 491
5.1
62 212
5.8
T
+
2
5572
1.3
3355
0.06
25 912
18.3
30 842
9.9
65 681
11.7
T
+
3
5608
2.0
3356
0.09
27 699
26.4
32 856
17.1
69 518
18.2
1988/89 T
+
0 RS
6559
–
3030
–
22 095
–
29 486
–
61 171
–
T
+
1
6639
1.2
3047
0.6
23 377
5.8
30 079
2.0
63 141
3.2
T
+
2
6717
2.4
3044
0.5
23 913
8.2
30 972
5.0
64 645
5.7
T
+
3
6821
3.9
3051
0.7
25 041
13.3
32 604
10.6
67 516
10.4
1989/90 T
+
0 RS
6340
–
2624
–
19 416
–
28 239
–
56 649
–
T
+
1
6283
−
0.9
2600
−
2.1
21 062
8.5
29 506
4.5
59 451
5.1
T
+
2
6109
−
3.6
2489
−
6.2
22 444
15.6
31 215
10.5
62 257
9.9
T
+
3
6165
−
2.8
2473
−
6.8
24 047
23.9
33 106
17.2
65 791
16.1
344
P. Singh, N. Kumar/Journal of Hydrology 193 (1997) 316–350
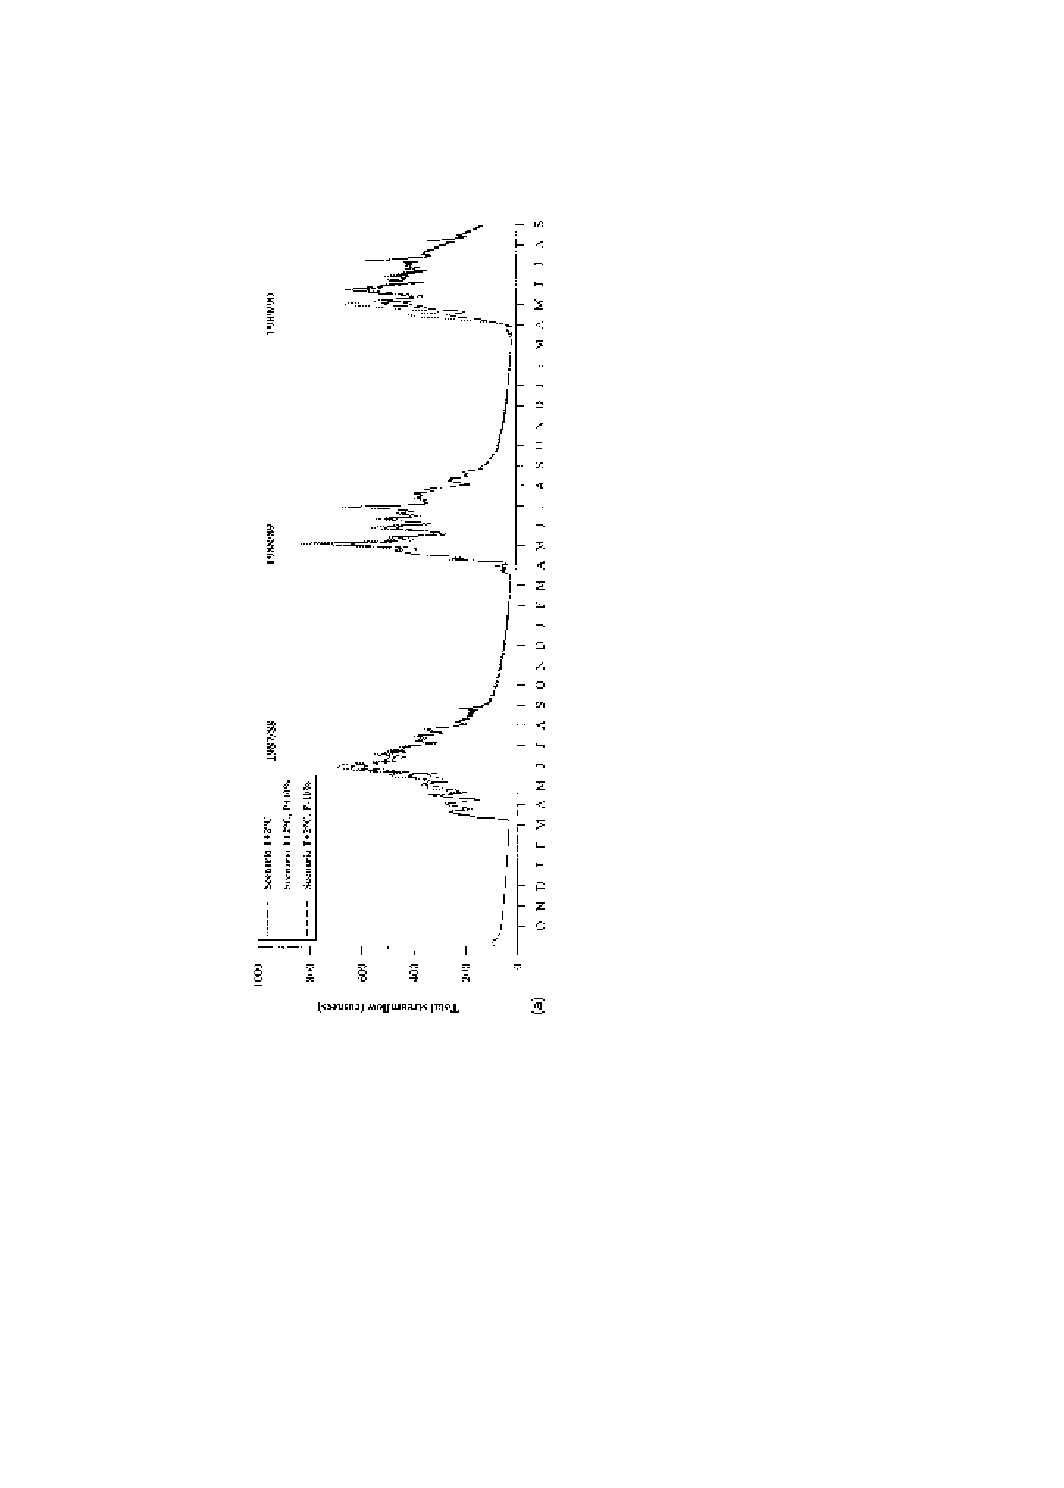
Fig.
11.
(a)
Effect
of
changes
in
precipit
ation
on
daily
total
streamflow
over
a
T
+
28
C
sc
enario.
(b)
Effect
o
f
changes
in
precipitatio
n
o
n
annual
streamflow
over
a
T
+
28
C
scenario.
345
P. Singh, N. Kumar/Journal of Hydrology 193 (1997) 316–350
their runoff distribution. All these hydrological components linearly increase with an
increase in temperature from 1 to 3
8C. The most prominent effect of temperature increase
is seen on glacier melt runoff as compared to snowmelt runoff and total streamflow. An
increase of 2
8C in air temperature increases annual snowmelt runoff, glacier melt runoff
and total streamflow in amounts ranging from 4 to 18%, 33 to 38% and 6 to 12%,
respectively. The maximum increases in snowmelt runoff (19–41%), glacier melt runoff
(53–64%) and total streamflow (16–24%) are observed under (T
+
3
8C, P
+
10%), (T
+
3
8C,
P
−
10%), (T
+
3
8C, P
+
10%) scenarios, respectively.
3. Snowmelt runoff and total streamflow increase linearly with changes in precipitation,
but glacier melt runoff is inversely related to changes in precipitation (T
+
1, T
+
2, T
+
3
8C;
P
−
10 to P
+
10%). It is found that snowmelt runoff is more sensitive than glacier melt
runoff to changes in precipitation. A general long-term effect of temperature and preci-
pitation changes on the glaciers can be addressed on the basis of the present results. An
increase in air temperature or decrease in precipitation for a long time will reduce the size
of glaciers due to higher melt runoff from them. They may retreat because of their faster
depletion under a warmer climate. The study suggests that a combination of increased
temperature and decreased precipitation will have a compound effect in reducing their
size. However, under higher precipitation scenarios the glaciers will grow in size, resulting
in higher probability of their advancement.
4. The seasonal analysis of total streamflow indicates that increases in temperature (T
+
1,
T
+
2, T
+
3
8C; P
+
0%) produce a large increase in the pre-monsoon season streamflow
followed by an increase in the monsoon season. Post-monsoon and winter streamflow are
not affected significantly by increased temperature. No significant changes in the winter
streamflow are found for this river.
5. Similar studies should be carried out on basins located in different geographic and
climatic regions to investigate potential impacts of projected climate warming on
hydrology and water resources in India. Moreover, further investigations are needed to
Fig. 11. Continued.
346
P. Singh, N. Kumar/Journal of Hydrology 193 (1997) 316–350
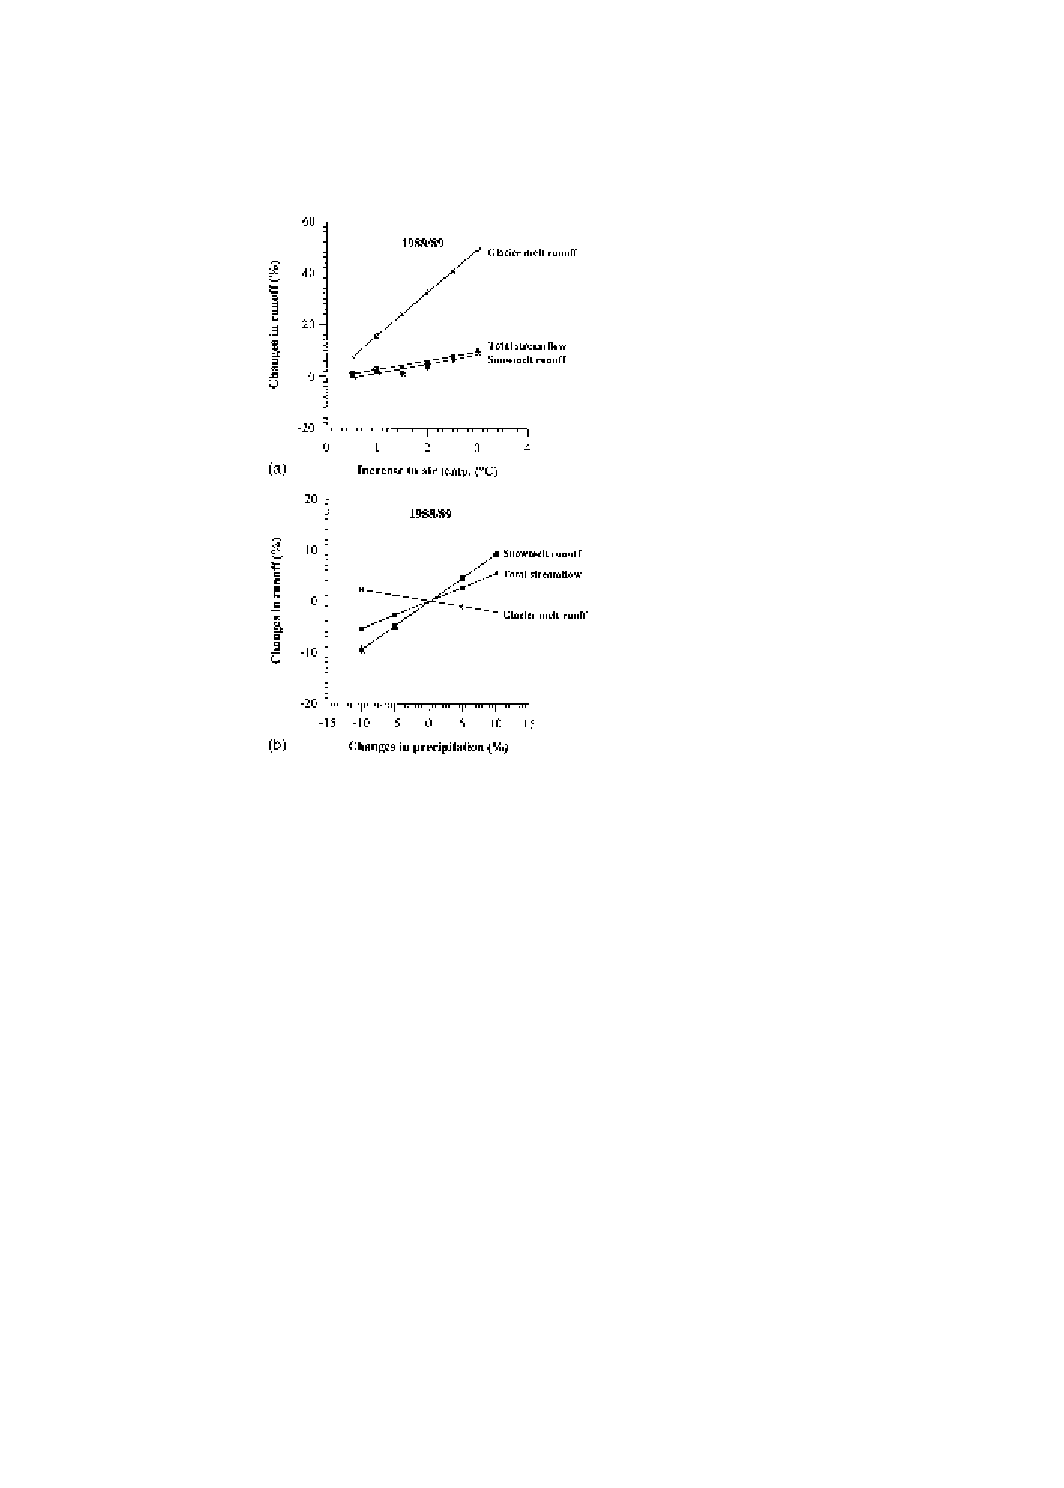
understand the changes in model parameters under different climatic scenarios and to
study influences of such changes on the hydrological response of the basins.
Acknowledgements
The authors are thankful to Dr S.M. Seth, Director of NIH, Dr K.S. Ramasastri, Scientist
F, and Shri R.D. Singh, Scientist E, NIH, Roorkee, for their valuable suggestions. The
authors also appreciate the comments offered by the anonymous reviewers which helped
in a better presentation of the results.
Fig. 12. (a) Comparison of effect of increase in temperature on annual snowmelt runoff, glacier melt runoff and
total streamflow. (b) Comparison of effect of changes in precipitation on snowmelt runoff, glacier melt runoff and
total streamflow over a T
+
2
8C scenario.
347
P. Singh, N. Kumar/Journal of Hydrology 193 (1997) 316–350

References
Becker, A. and Serban, P., 1990. Hydrological models for water resources system design and operation. In:
Operational Hydrology, WMO Report No. 34, 80 pp.
Bultot, F., Coppens, A., Dupriez, G.L., Gellens, D. and Meulenberghs, F., 1988. Repercussions of a CO
2
doubling on the water cycle and on the water balance — a case study for Belgium. Journal of Hydrology,
99: 319–347.
Burn, D.H., 1994. Hydrologic effects of climate change in west-central Canada. Journal of Hydrology, 160: 53–
70.
Cayan, D.R. and Riddle, L.G., 1993. The influence of temperature and precipitation on seasonal streamflow in
California. Water Resources Research, 29: 1127–1140.
Chiew, F.H.S., Whetton, P.H., McMahon, T.A. and Pittock, A.B., 1995. Simulation of the impacts of climate
change on runoff and soil moisture in Australian catchemts. Journal of Hydrology, 167: 121–147.
Cohen, S.J., 1986. Impact of CO
2
induced climatic change on water resources in the Great Lakes basin. Climatic
Change, 8: 135–153.
Cooley, K.R., 1990. Effects of CO
2
-induced climatic changes on snowpack and streamflow. Hydrological
Sciences Journal, 35: 511–522.
Cubasch, U., Hasselmann, K., Hock, H., Maier-Reimer, E., Mikolajewicz, U., Santer, B.D. and Sausen, R., 1992.
Time dependent greenhouse warming computations with a coupled ocean–atmosphere model. Climate
Dynamics, 8: 55–89.
Divya and Mehrotra, R., 1995. Climate change and hydrology with emphasis on the Indian subcontinent.
Hydrological Sciences Journal, 40: 231–242.
Gleick, P.H., 1986. Methods for evaluating the regional hydrological impacts of global climatic change. Journal
of Hydrology, 88: 97–116.
Gleick, P.H., 1987a. Regional hydrological consequences of increases in atmospheric CO
2
and other trace gases.
Climate Change, 10: 137–161.
Gleick, P.H., 1987b. The development and testing of a water balance model for climatic impact assessment:
Modelling the Sacramento basin. Water Resources Research, 23: 1049–1061.
Hingane, L.S., Rup Kumar, K. and Ramanamurthy, B.V., 1985. Long term needs of surface air temperature in
India. Journal of Climatology, 5: 521–528.
IPCC, 1990. Climate change — The IPCC Scientific Assessment, ed. J.T. Houghten, G.J. Jenkins and J.J.
Ephraums. Cambridge University Press, Cambridge, UK.
IPCC, 1992. Climate Change 1992 — the supplementary report to the IPCC Scientific Assessment, ed. J.T.
Houghten, B.A. Callander and S.K. Varney. Cambridge University Press, Cambridge, UK, 200 pp.
Jagannathan, P. and Parthasarathy, B., 1972. Fluctuations in the seasonal oscillation of the temperature in India.
Indian Journal of Meteorology and Geophysics, 23: 15.
Jones, P.D., Groisman, P. Ya., Coughlan, M., Plummer, N., Wang, W.C. and Karl, T.R., 1990. Assessment of
urbanisation effect in time series of surface air temperature over land. Nature, 347: 169–172.
Lal, M. and Bhaskaran, B., 1993. Impact of greenhouse warming on the climate of north-west India as inferred
from a coupled atmosphere–ocean climate model. Journal of Arid Environment, 25: 27–37.
Lal, M. and Chander, S., 1993. Potential impacts of greenhouse warming on the water resources of the Indian
subcontinent. JEH, 1: 3–13.
Lal, M., Cubasch, U. and Santer, B.D., 1992. Potential changes in monsoon climate associated with global
warming as inferred from coupled ocean–atmosphere general circulation model. CAS/JSC Working Group
Report No.17, WMO/TD 467: 66–99.
Lettenmaier, D.P. and Gan, 1990. Hydrologic sensitivities of the Sacramento–San Joaquin river basin, California,
to global warming. Water Resources Research, 26: 69–86.
Loaiciga, H.A., Valdes, J.B., Vogel, R., Garvery, J. and Schwarz, H., 1996. Global warming and the hydrological
cycle. Journal of Hydrology, 174: 83–127.
McCabe, G.J., Jr, 1994. Relationship between atmospheric circulation and snowpack in the Gunnison river basin,
Colorado. Journal of Hydrology, 157: 157–176.
McCabe, G.J., Jr, and Ayers, M., 1989. Hydrologic effect of climate change in the Delaware river basin. Water
Resources Bulletin, 25: 1231–1242.
348
P. Singh, N. Kumar/Journal of Hydrology 193 (1997) 316–350

NAS, 1979. Carbon Dioxide and Climate: A Scientific Assessment. National Academy of Sciences, National
Academic Press, Washington, DC, USA.
Nash, L.L. and Gleick, P.H., 1991. Sensitivity of streamflow in the Colorodo basin to climatic changes. Journal of
Hydrology, 125: 221–241.
Nash, J.E., and Sutcliffe, J.V., 1970. River forecasting through conceptual models, 1. A discussion of principles.
Journal of Hydrology, 10: 282–290.
Nemec, J., 1989. Implications of changing atmosphere on water resources. Proceedings of the WMO Conference,
June 27–30, Toronto, Canada, WMO-710, pp. 211–223.
Nemec, J. and Schaake, J., 1982. Sensitivity of water resource systems to climate variation. Hydrological
Sciences Journal, 27: 327–343.
Ng, H.Y.F. and Marsalek, J. 1992. Sensitivity of streamflow simulation to changes in climatic inputs. Nordic
Hydrology, 23: 257–272.
NRC, 1983. Changing Climate. Carbon Dioxide Assessment Committee, National Research Council (US),
National Academy Press, Washington, DC, USA.
Panagoulia, D., 1991. Hydrological response of a medium sized mountainous catchment to climate changes.
Hydrological Sciences Journal, 26: 525–547.
Pearman, G.I., 1980. The global carbon cycle and increased levels of atmospheric carbon dioxide. In: G.I.
Pearman (Editor), Carbon Dioxide and Climate: Australian Research. Australian Academy of Science,
Canberra, A.C.T., pp. 11–20.
Quick, M.C. and Pipes, A., 1977. UBC watershed model. Hydrological Sciences Bulletin, 22: 153–161.
Quick, M.C. and Singh, P., 1992. Watershed modelling in the Himalayan region. International Symposium on
Hydrology of Mountainous Areas, 28–20 May, 1992, Shimla, India, pp. 201–230.
Rango, A., 1989. Evolution of a research oriented snowmelt-runoff model into an operational forecasting tool.
Western Snow Conference 1989, Fort Collins, Colorado.
Rango, A., 1992. Worldwide testing of the snowmelt runoff model with applications for predicting the effects of
climate change. Nordic Hydrology, 23: 155–172.
Rango, A. and Martinec, J., 1994. Areal extent of seasonal snow cover in a changed climate. Nordic Hydrology,
25: 233–246.
Rind, D. and Lebedeff, S., 1984. Potential climatic impacts of increasing atmospheric CO
2
with emphasis on
water availability and hydrology in the United States. Report EPA 230-04-006, 96. Environmental Protection
Agency, Washington, DC, USA.
Sanderson, M. and Smith, J., 1990. Climate change and water in the Grand river, Ontario. Proceedings of the 43rd
Annual Conference of the Canadian Water Resources Association, May 16–18, Pentiction, British Columbia,
pp. 243–261.
Sarker, R.P. and Thapliyal, V., 1988. Climate change and variability. Mausam, 39: 127–138.
Sausen, R., Schubert, S. and Du¨menil, L., 1994. A model of river runoff for use in coupled atmosphere–ocean
model. Journal of Hydrology, 155: 337–352.
Singh, P. and Kumar, N., 1996. Determination of snowmelt factor in the Himalayan region. Hydrological
Sciences Journal, 41: 301–310.
Singh, P. and Quick, M.C., 1993. Streamflow simulation of Satluj river in the western Himalayas. Snow and
Glacier Hydrology, IAHS Publication No. 218: 261–271.
Singh, P., Ramasastri, K.S. and Kumar, N., 1995a. Topographical influence on precipitation distribution in the
different ranges of western Himalayas. Nordic Hydrology, 26: 259–284.
Singh, P., Ramasastri, K.S., Singh, U.K., Gergen, J.T.G. and Dobhal, D.P., 1995b. Hydrological characteristics of
the Dokriani glacier in the Garhwal Himalayas. Hydrological Sciences Journal, 40: 243–257.
Thapliyal, V. and Kulshreshtha, S.M., 1991. Climate changes and trends over India. Mausam, 42:
333–338.
Thomsen, R., 1990. Effect of climate variability and change in ground water in Europe. Nordic Hydrology, 21:
185–194.
US Department of Energy, 1980. Carbon dioxide effects research and assessment program, Part 1: Global carbon
cycle and climate effects of increasing carbon dioxide. DOE/EV-0094, UC-11, 99 pp.
Vehvilainen, B. and Lohvansuu, J., 1991. The effect of climate change on discharges and snow cover in Finland.
Hydrological Sciences Journal, 36: 109–121.
349
P. Singh, N. Kumar/Journal of Hydrology 193 (1997) 316–350

WMO, 1987. Water resources and climate change. Sensitivity of water resources systems to climate change.
WMO/TP No. 247, p. 26.
WMO, UNEP, UNESCO, IOC, FAO and ICSW, 1991. Climate Change: Science, Impacts and Policy. Proceed-
ings of the Second World Climate Conference (October 1990), ed. J. Ja¨ger and H.L. Ferguson, Cambridge
University Press, Cambridge, UK, 578 pp.
Yeh, T.C., Wetherald, R.T. and Manabe, S., 1983. A model study of the short-term climatic and hydrologic
effects of sudden snow cover removal. Monthly Weather Review, 111: 1013–1024.
350
P. Singh, N. Kumar/Journal of Hydrology 193 (1997) 316–350
Wyszukiwarka
Podobne podstrony:
1 s2 0 S0020025512001946 main
1 s2 0 S0378382002000085 main
1 s2 0 S0304397599001000 main
1 s2 0 S0006291X05021595 main
1 s2 0 S0040603111000104 main 2
1 s2 0 S0944501312001358 main
1 s2 0 S0166218X96000583 main
1 s2 0 S0005273614000303 main
1 s2 0 S0304397502001342 main
1 s2 0 S0377221798003622 main (1)
1 s2 0 S1046592814002101 main
1 s2 0 0166218X93E0153P main
1 s2 0 S0022000006001474 main
1 s2 0 S000925099800520X main
1 s2 0 S0022283610008843 main
1 s2 0 S0006291X07005785 main
1 s2 0 S0960852409006385 main
więcej podobnych podstron