|
Research Focus
Eye colour: portals into pigmentation genes and
ancestry
Richard A. Sturm
1
and Tony N. Frudakis
2
1
Institute for Molecular Bioscience, University of Queensland, Brisbane, Qld 4072, Australia
2
DNAPrint genomics, Incorporated, 900 Cocoanut Ave, Sarasota, FL 34236, USA
Several recent papers have tried to address the genetic
determination of eye colour via microsatellite linkage,
testing of pigmentation candidate gene polymorphisms
and the genome wide analysis of SNP markers that are
informative for ancestry. These studies show that the
OCA2 gene on chromosome 15 is the major determin-
ant of brown and/or blue eye colour but also indicate
that other loci will be involved in the broad range of
hues seen in this trait in Europeans.
One of the first investigations into the concept of
mendelian inheritance in humans was the consideration
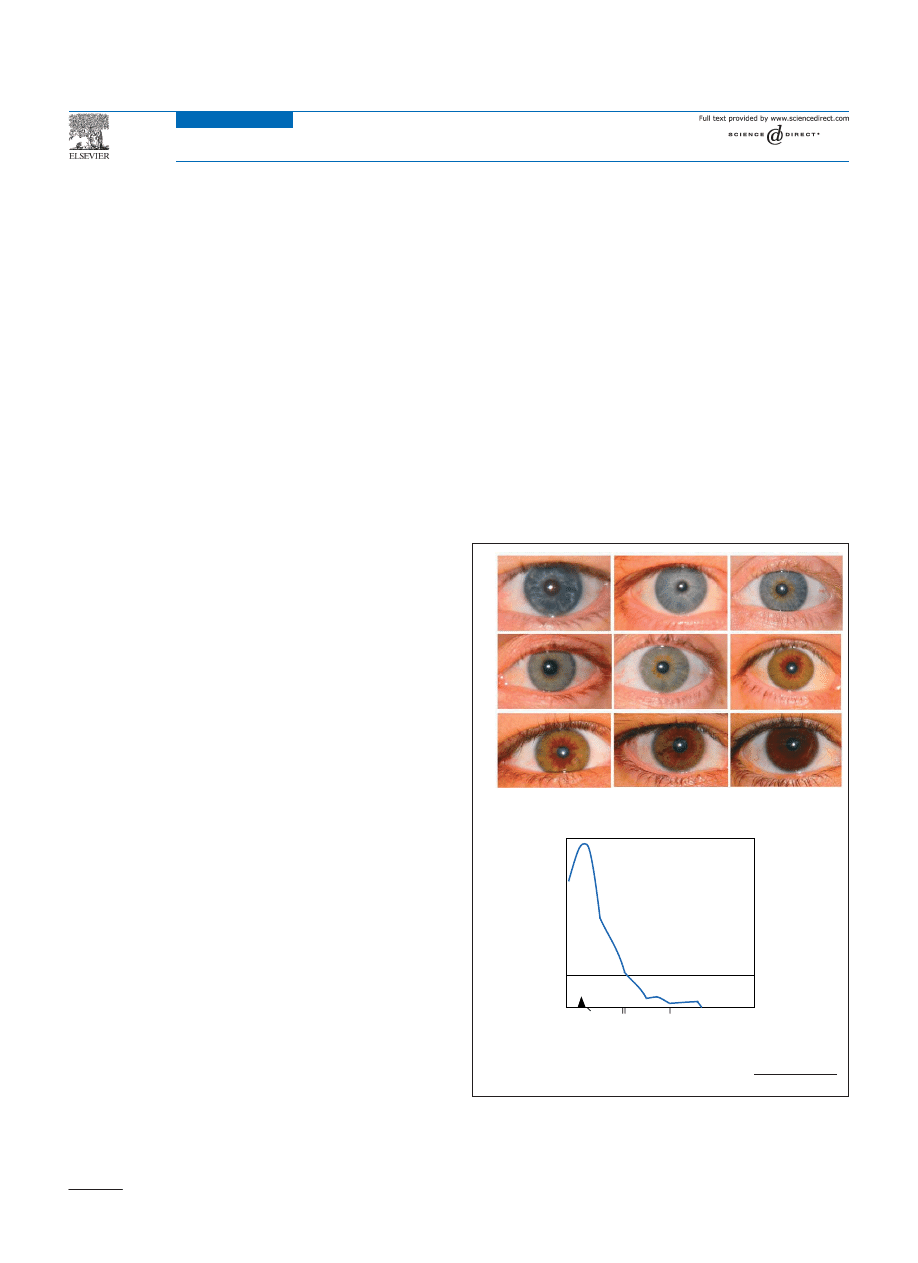
of eye colour. Iris colour exists on a continuum from the
lightest shades of blue to the darkest of brown or black,
although genetic studies have usually categorised: blue,
grey, green, yellow, hazel, light brown and dark brown
(
a) in addition to the colour deficiencies apparent
in those with oculocutaneous albinism. In 1907, the
Davenports
outlined what is still commonly taught in
schools today as a beginners guide to genetics that brown
eye colour is always dominant to blue, with two blue-eyed
parents always producing a blue-eyed child, never one
with brown eyes. Unfortunately, as with many physical
traits, this simplistic model does not convey the complexi-
ties of real life and the fact is that eye colour is inherited
as a polygenic not as a monogenic trait. Although not
common, two blue-eyed parents can produce children with
brown eyes. The apparently non-mendelian examples of
iris colour transmission from parents to offspring, com-
bined with the quantitative nature of iris pigmentation
indicate that the inheritance of this apparently simple
trait as a dichotomous value must be reconsidered. The use
of eye colour as a paradigm for ‘complete’ recessive and
dominant gene action should be avoided in the teaching of
genetics to the layperson, which is often their first
encounter with the science of human heredity. The
phenotypes of eye, hair and skin colour
in addition to
stature and facial features will always be observed to run
in families but families need to know that these are
complex traits (i.e. conditioned by several genes)
Physical basis of eye colour: melanocytes,
melanogenesis and ancestry
The physical basis of eye colour is determined by the
distribution and content of the melanocyte cells in the
uveal tract of the eye (
). The iris consists of several
layers: the anterior layer and its underlying stroma are the
most important for the appearance of eye colour
. In the
brown iris there is an abundance of melanocytes and
melanosomes in the anterior layer and stroma, whereas
in the blue iris these layers contain little melanin. As
light traverses these relatively melanin-free layers, the
minute protein particles of the iris scatter the short blue
Figure 1. (a) Representative eye colours ranging from blue, grey, green, hazel, light
brown to dark brown. Note additional textual qualities such as crypts in the
stroma, nevi, a white dot ring and contractional furrows are apparent in some of
the irises
, including a eumelanic border radiating from the pupils in hazel
eyes. (b) A plot of a quantitative trait loci (QTL) linkage scan on chromosome 15
for eye colour measured on a three point scale
. The location of several pig-
mentation loci is shown on the x-axis with the centromere indicated by the
arrowhead.
TRENDS in Genetics
LOD score
OCA2
MY
O5A
RAB27A
CYCP1A1
0
3
QTL for eye colour
Chromosome 15
(a)
(b)
Corresponding author: Richard A. Sturm (R.Sturm@imb.uq.edu.au).
Update
TRENDS in Genetics
Vol.20 No.8 August 2004
wavelengths to the surface, thus blue is a consequence of
structure not of major differences in chemical composition.
The number of melanocytes does not appear to differ
between eye colours
, but the melanin pigment quantity,
packaging and quality does vary, giving a range of eye
shades
. The common occurrence of lighter iris colours is
found almost exclusively in Europeans (i.e. recent mono-
phyletic, non-East Asian, non-Native American and non-
African lineages) and individuals of European admixture.
The study of biogeographical ancestry admixture is
becoming more popular and soon it might be possible to
date the genesis of lighter irides; that is to distinguish
whether lighter iris colours are exclusive to the con-
tinental European populations, as opposed to unadmixed
Middle Eastern or Central and/or Southern Asian popu-
lations with whom they share some common ancestry.
There are two forms of melanin pigment particles
produced during melanogenesis and both occur in the iris
of the eye, the cutaneous and follicular (skin and hair)
melanocyte cells (
). However, unlike the skin and
hair in which melanin is produced continuously and
secreted, in the eye the melanosomes containing the
pigment are retained and accumulate in the cytoplasm of
the melanocytes within the iris stroma. Eumelanin is a
brown – black form of pigment that is responsible for dark
colouration and is packaged in ovoid eumelanosomes,
which are striated particles, whereas pheomelanin is a
red – yellow pigment produced in granular immature
pheomelanosomes
.
The study of mouse-coat colours and the comparative
genomic analysis with other mammals, including humans,
has provided enormous insight into the genetic basis of
pigmentation
. Several loci are known to have major
effects on pigmentation (
) including the enzymes
that are involved in the catalytic formation of melanin
[including tyrosinase (TYR), tyrosinase related proteins
TYRP1 and dopachrome tautomerase (DCT)], the melano-
somal proteins [P and membrane-associated transporter
protein (MATP) encoded by the OCA2 and MATP genes,
respectively] and the melanocortin-1 receptor (MC1R),
which is involved in pheomelanin – eumelanin pigment
switching of the melanocyte
.
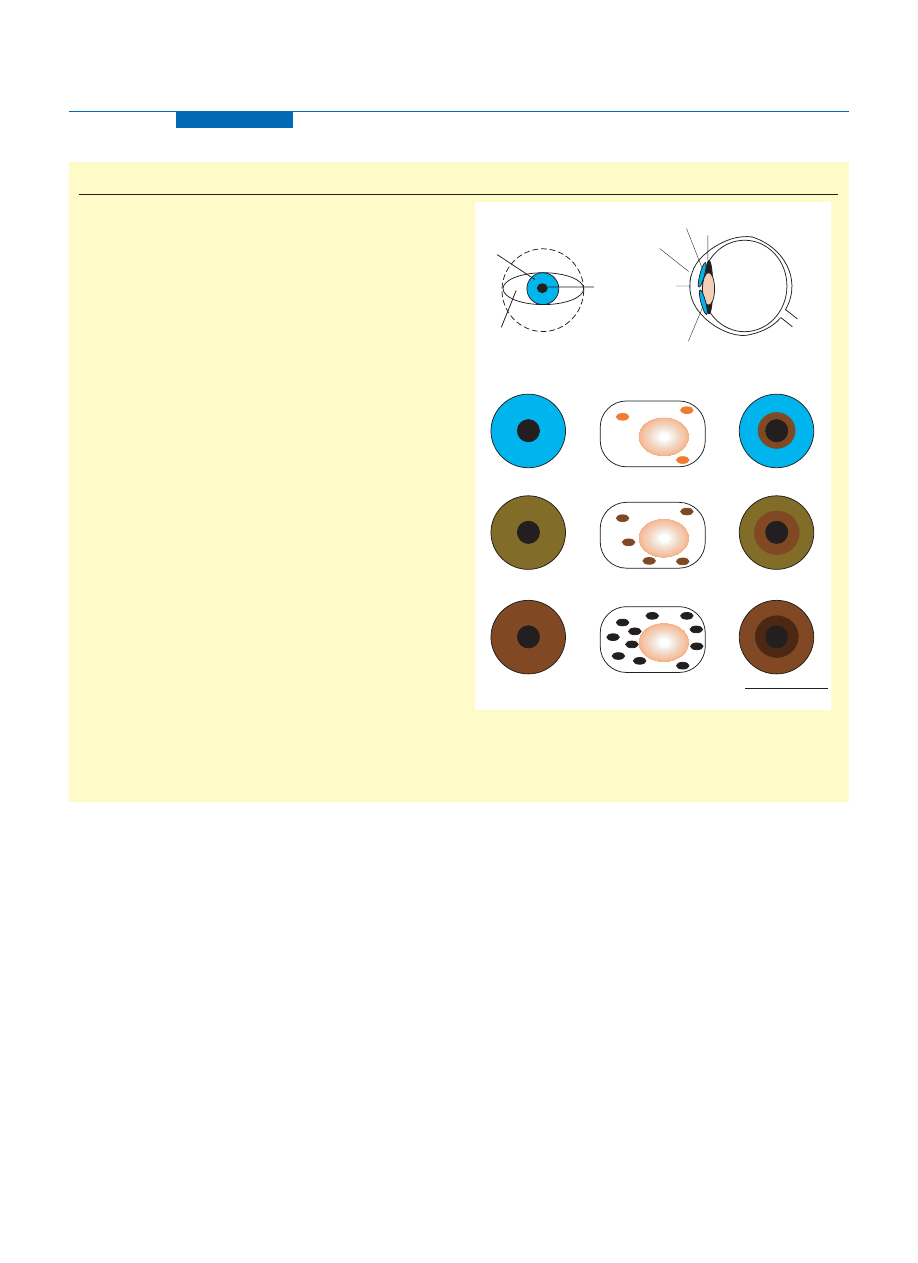
Box 1. The physical basis of human eye colour
A schematic representation of the eye ball from the front view shows the
anatomical division of the sclera, the white connective tissue, the iris
and the coloured disk surrounding the central black pupil (Figure I). In
cross section view the cornea is seen as a transparent tissue above the
iris enabling light to enter through the pupil, which is then focused by
the lens onto the retina. The iris comprises two tissue layers, the
innermost consists of cuboidal, pigmented cells that are tightly fused
and is known as the iris pigment epithelium (IPE), which is formed from
the optic cup during development. The outermost layer is referred to as
the anterior iridial stroma and is composed mainly of loosely arranged
connective tissue, fibroblasts and melanocytes and are of the same
embryological origin as dermal melanocytes, which arise and migrate
from the neural crest. Apart from albino patients, who lack melanin
pigment and have eyes that might appear pink as a result of the
reflection of light from blood vessels, the IPE does not exert a major
influence on the perceived eye colour of normal individuals because the
melanin in this layer is distributed similarly in irides of different colour.
Notably, it is the density and cellular composition of the iris stroma that
must be considered as major factors in the colouration of the eye [5].
The melanocyte cells are aggregated in the anterior border layer of
the iridial stroma, parallel to the surface of the eye, and store melanin
pigment in a specialized organelle within their cytoplasm termed the
melanosome. White light entering the iris can absorb or reflect a
spectrum of wavelengths giving rise to the three common iris colours,
blue, green – hazel and brown, but it should be recognized that these
broad classifications are simplistic and that there is actually a
continuum in the range of eye colours seen in Europeans. The middle
of the panel illustrates the intracellular distribution and content of the
melanosome particles within the iridial melanocytes with the varied
melanin pigment quantity, packaging and qualities giving the range of
eye shades [6]. Although blue eyes have similar numbers of melanocyte
cells they contain minimal pigment and few melanosomes; green –
hazel irides are the product of moderate pigment levels, melanin
intensity and melanosome number and with brown irides are the result
of high melanin levels and melanosomal particle numbers. Each of
these eye colours can occur with or without a darker pigmented iris
peripupillary ring, represented to the right of the figure. Insufficient
studies have been performed into the nature of the peripupillary ring;
however, the possibility that the number of melanocytes, their melanin
granule size, distribution or content can differ between ethnic groups
has been recognized [26], and further ultrastructural investigations are
needed to clarify this issue.
Figure I. The basis of human eye colour. Abbreviation: N, cell nucleus.
TRENDS in Genetics
Iris
Pupil
Lens
Retina
Optic
nerve
Cornea
Iris
Iris
Ciliary body
Iridial melanocytes
and melanosomes
N
N
N
Pupil
Eye lid
Eye lid
Sclera
Update
TRENDS in Genetics
Vol.20 No.8 August 2004
328

Genetic linkage analysis for eye colour
Early linkage studies for eye and hair colours were
performed using blood groups as markers and provided
evidence of association of a green or blue eye colour locus
[eye colour 1 (EYCL1), also known as GEY; OMIM 227240;
http://www.ncbi.nlm.nih.gov/entrez/query.fcgi?db ¼ OMIM
to
the
Lutheran-Secretor
systems
on
chromosome
19p13.1 – 19q13.11
. Another major locus for brown or
blue eye colour [eye color 3 (EYCL3) also known as BEY2;
OMIM 227220] and brown hair [hair color 3 (HCL); OMIM
601800] was found on chromosome 15q11 – 15q21 using
linkage analysis with DNA markers within this region in
Box 2. Melanin pigment formation
Melanin is an inert light-absorbing biopolymer of no fixed size and of
uncertain unit structure that is extraordinarily resistant to chemical
degradation. Melanogenesis is based on the chemical reactions that
take place within the melanosome beginning with tyrosine, dopa and
cysteine that result in the formation of the eumelanin and pheomelanin
pigments, through a bifurcated biosynthetic pathway [27]. When
tyrosine is oxidised by the tyrosinase (TYR) enzyme, dopaquinone
(DQ) is produced as an intermediate (Figure I). In the absence of
cysteine, DQ undergoes intramolecular addition producing cyclodopa,
with a redox exchange between cyclodopa and DQ giving rise to dopa
and dopachrome. Dopa is a substrate that stimulates TYR to further
increase the production of DQ and increase the rate of melanogenesis.
Dopachrome decomposes to give mostly 5,6-dihydroxyindole (DHI)
with the catalytic action of dopachrome tautomerase (DCT) also
producing 5,6-dihydroxyindole-2-carboxylic acid (DHICA). These com-
pounds are further oxidised by the TYR and tyrosinase-related protein-1
(TYRP1) enzymes to produce the brown – black eumelanin.
In a separate pathway, DQ can be conjugated with cysteine to give
5-S-cysteinyldopa and to a lesser extent 2-S-cysteinyldopa. These
cysteinyldopas are then oxidised to give benzothiazine intermediates
that are incorporated into the red – yellow pheomelanin polymer.
Little is known about the chemical regulatory or catalytic processes
that are involved in pheomelanogenesis, but it is thought that the
addition of cysteine to DQ is a rapid process that continues as long as
cysteine is made available within the melanosome. The oxidation of
cysteinyldopas and incorporation into pheomelanin is proposed to
continue as long as the cysteinyldopas are present. Depletion of
melanosomal cysteine and cysteinyldopas enables the eumelano-
genic pathway to commence, with eumelanin then deposited upon
the preformed pheomelanin. Therefore, each melanocyte has the
capacity to produce both types of pigment, which are known as
mixed melanogenesis. However, the ratios of the two forms of
melanin can vary widely between individuals as seen in the different
shades of eye, hair and skin colour [2].
Figure I. The formation of melanin pigment.
TRENDS in Genetics
O
2
COOH
NH
2
HO
HO
O
2
O
COOH
N+
H
O
HO
HO
COOH
N
H
HO
HO
N
H
DHI
O
2
O
2
TYR
DCT
CO
2
HO
COOH
NH
2
HO
S
HOOC
H
2
N
HO
COOH
NH
2
HO
S
COOH
NH
2
O
COOH
NH
2
O
S
HOOC
H
2
N
O
COOH
NH
2
O
S
COOH
NH
2
COOH
NH
2
HO
S
HOOC
N
OH
COOH
NH
2
S
HOOC
N
(O)
OH
COOH
NH
2
HS
COOH
NH
2
O
NH
2
COOH
O
COOH
N
H
O
O
Cyclodopa
Tyrosine
Dopa
+ Cysteine
– Cysteine
Dopachrome
DHICA
+
+
+
Pheomelanin
Eumelanin
TYR
TYRP1
Benzothiazine intermediates
Cysteinyldopa-quinones
Dopaquinone (DQ)
5-S-Cysteinyldopa
2-S-Cysteinyldopa
DQ
Dopa
Update
TRENDS in Genetics
Vol.20 No.8 August 2004
329

families segregating for BEY2
, with the OCA2 gene
recognized as a candidate within this region. In these
studies, a three-point scale of blue – grey, green – hazel and
brown eye colour was used. The same three categories
have now been used in the first complete genome scan in
an attempt to map genes responsible for eye colour using
microsatellites at a 5 – 10 cM level
. These studies were
performed in a sample of 502 twin families and obtained a
peak LOD score of 19.2 in a region on 15q that contains
OCA2 gene (
b), which had already been implicated
in brown or blue eye colour
. This peak has a long tail
towards the telomere, suggesting that other eye colour
quantitative trait loci (QTL) might lie there [interestingly,
both the Myosin Va (MYO5A) and RAB27A proteins that
are involved in melanosome trafficking are located in this
region
). Zhu and colleagues estimate that 74% of
variance of eye colour might be due to this single QTL peak
and conclude that most variation in eye colour is due to the
OCA2 locus (encoding the P melanosomal protein) but that
there will be modifiers at several other loci
.
OCA2 and candidate pigmentation gene polymorphism
for eye colour
The human P-gene transcript encoded by the OCA2 locus
consists of 24 exons and is . 345 kb
. The gene encodes
an 838 amino acid open reading frame producing a 110 kD
protein that contains 12 transmembrane spanning
regions; it has been classified as an integral melanosomal
membrane protein. In mouse, the P-protein is encoded by
the pink-eyed (p) dilute mouse coat-colour locus, and
mutations in the orthologous human OCA2 result in type
II albinism
. At least 35 apparently non-pathogenic
variant alleles of OCA2 have been identified: 24 of which
are exonic and six of these result in amino acid changes
(for more information, see the Albinism database
). Some of these polymorphisms have
markedly different frequencies in different populations
indicating the potential to explain difference in pigmenta-
tion phenotypes between ethnic groups. Using a candidate
gene analysis approach in a sample of 629 individuals the
Rebbeck group recently found two of these OCA2 coding-
region variants, R305W and R419Q were associated with
brown and green – hazel eyes, respectively
. These
same polymorphisms were tested in the twin collection
described by Zhu et al. and each was confirmed as being
associated with green and brown but not with blue eyes
. Another locus that has been tested for association for
human pigmentation phenotypes is the agouti signalling
protein gene (ASIP)
. A g8818A-G single nucleotide
polymorphism (SNP) in the 3
0
untranslanted region of
this gene was genotyped in 746 participants, and the
G nucleotide allele was found to be significantly associated
with brown eyes
.
Genome wide SNP analysis for eye colour
A recent paper by Frudakis et al. has taken a different
approach at dissecting the genetic basis of eye colour
using SNPs
. They used a hypothesis-driven SNP
screen, focusing on pigmentation candidate genes and a
hypothesis-free approach analogous to admixture map-
ping to screen a genome-wide set of Ancestry Informative
SNP Markers (AIMs)
. AIMs are genetic loci showing
alleles with large frequency differences between popu-
lations and can be used to estimate bio-geographical
ancestry and admixture of an individual from founder
populations or subgroups (
The candidate gene portion of their study confirmed
some associations and introduced others. More than 335
SNPs within 13 known pigmentation genes were screened
in 851 individuals of European descent. Individual SNPs
and haplotypes significantly associated with eye colour
were identified within the OCA2, TYR, TYRP1, DCT,
MATP and MYO5A loci. Alleles for several additional
genes – ASIP, MC1R, pro-opiomelanocortin (POMC) and
Silver homologue (SILV) – were associated at the haplo-
type level but not at the individual SNP level. Of the
335 SNPs in known pigmentation genes, only 61 were
associated with iris pigmentation at the SNP level; most of
Table 1. Human pigmentation-related genes
a
Locus
Chromosome
Protein
Mutation (phenotype)
Function
Melanosome proteins
TYR
11q14 – 11q21
Tyrosinase
OCA1
Oxidation of tyrosine, dopa
TYRP1
9p23
gp75, TRYP1
OCA3
DHICA-oxidase, TYR stabilisation
DCT
13q32
DCT, TRYP2
?
Dopachrome tautomerase
SILV
12q13 – 12q14
gp100, pMel17, Silver
?
DHICA-polymerisation and melanosome striations
OCA2
15q11.2 – 15q12
P-protein
OCA2 (eye colour)
pH of melanosome and melanosome maturation
MATP
5p14.3 – 5q12.3
MATP, AIM-1
OCA4 (skin colour)
Melanosome maturation
Signal proteins
ASIP
20q11.2 – 20q12
Agouti signal protein
?
MC1R antagonist
MC1R
16q24.3
MSH receptor
Red hair (skin type)
G-protein coupled receptor
POMC
2p23.3
POMC, MSH, ACTH
Red hair
MC1R agonist
OA1
Xp22.3
OA1 protein
OA1
G-protein coupled receptor
MITF
3p12.3 – 3p14.1
MITF
Waardenburg syndrome type 2
Transcription factor
Proteins involved in melanosome transport or uptake by keratinocytes
MYO5A
15q21
MyosinVa
Griscelli syndrome
Motor protein
RAB27A
15q15 – 15q21.1
Rab27a
Griscelli syndrome
RAS family protein
HPS1
10q23.1 – 10q23.3
HPS1
Hermansky-Pudlak syndrome 1
Organelle biogenesis and size
HPS6
10q24.32
HPS6
Hermansky-Pudlak syndrome 6
Organelle biogenesis
a
Abbreviations: ACTH, adrenocorticotropin hormone; DCT, dopachrome tautomerase; DHICA, 5,6-dihydroxyindole-2-carboxylic acid; MATP, membrane-associated
transporter protein; MC1R, melanocortin-1 receptor; MITF, microphthalmia-associated transcription factor; MSH, melanocyte stimulating hormone; OCA, oculocutaneous
albinism; POMC, pro-opiomelanocortin; TYRP1, tyrosinase-related protein1.
Update
TRENDS in Genetics
Vol.20 No.8 August 2004
330
these were in OCA2 on chromosome 15, and these
associations were by far the most significant of any gene
tested. Notably, the MYO5A SNPs (also on chromosome
15) were only weakly associated but were not found to be in
linkage disequilibrium with OCA2, suggesting these two
genes might act independently to affect eye colour.
After OCA2, the TYRP1 associations were the next
strongest, followed by those for MATP, which were
significant using any colour grouping scheme; this was
the first indication that common variants for these genes
explain extant human iris in addition to skin colour
variation. It is debatable whether the weaker associations
found in the other pigment genes are due to low allelic
penetrance or are due to the sequences being informative
for certain elements of cryptic population substructure
that correlate with iris colours.
The hypothesis-free AIM screening produced interest-
ing results for other regions. Linkage disequilibrium can
extend for megabases in recently admixed populations and
this can be useful for mapping loci that underlie common
human traits
. Frudakis et al. used AIMs in an
unconventional manner – their goal was to draw a con-
nection between trait value (iris colour) and elements of
cryptic population structure that are present within the
European population (
c). AIMs from CYP2C8 and
CYP2C9 located in 10q23 and 10q24, respectively, were
found to be associated with iris colours. Although neither
of these genes is a pigment gene, both are located between
two Hermansky-Pudlak syndrome (HPS) pigment genes
that were not tested in the candidate gene portion of
the study, HPS1 (10q23.1 – 10q23.3) and HPS6 (10q24.32).
Interestingly, the linkage screen by Zhu et al. also showed
modestly elevated LOD scores for this region
. The use
of AIMs in this way suggests that crude and cryptic
population structure might be useful in developing
sequence-based classification tools for complex anthropo-
metric and other human traits, such as iris colour.
Iris patterns and change of eye colour
The human iris has many other characteristic patterns
(
a) that are not measured through an assessment
of eye colour and these will also be under strong genetic
influence
but remain to be fully investigated. For
example, although eye colour is assumed to be fixed for
adult life there can be changes as an individual ages or
changes in disease states. Notably, there is a genetic
component to the drug induced changes that can occur in
iris pigmentation for the treatment of glaucoma
.
References
1 Davenport, G.C. and Davenport, C.B. (1907) Heredity of eye-color in
man. Science 26, 590 – 592
2 Sturm, R.A. et al. (1998) Human pigmentation genetics: the difference
is only skin deep. BioEssays 20, 712 – 721
3 Badano, J.L. and Katsanis, N. (2002) Beyond Mendel: an evolving view
of human genetic disease transmission. Nat. Rev. Genet. 3, 779 – 789
4 Boissy, R.E. (1998) Extracutaneous Melanocytes. In The Pigmentary
System – Physiology and Pathophysiology (Nordlund, J.J. et al. eds),
pp. 59 – 72, Oxford University Press
5 Imesch, P.D. et al. (1997) The color of the human eye: a review of
morphologic correlates and of some conditions that affect iridial
pigmentation. Surv. Ophthalmol 41 (Suppl. 2), S117 – S123
6 Prota, G. et al. (1998) Characterization of melanins in human irides
and cultured uveal melanocytes from eyes of different colors. Exp. Eye
Res. 67, 293 – 299
7 Sturm, R.A. et al. (2001) Human pigmentation genes: identification,
structure and consequences of polymorphic variation. Gene 277, 49 – 62
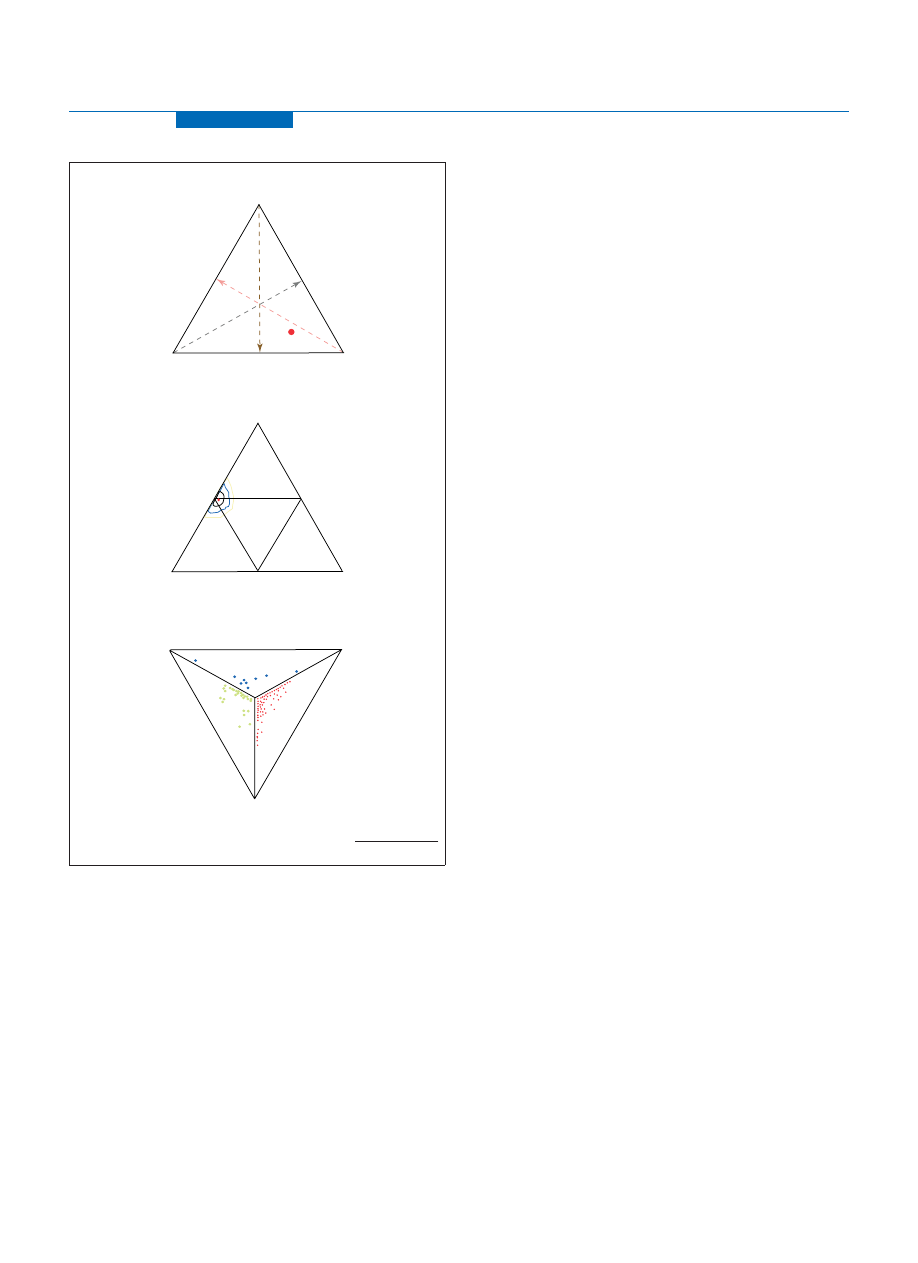
Figure 2. (a) Ancestry admixture percentages plotted in a triangle plot. Each of the
three internal axes range from 0% at the base to 100% at the tip or vertex and the
relative proportions of admixture correspond to where the ancestry admixture
estimate [most likely estimate (MLE)] projects on these three axes (red spot).
(b) Tetrahedron plot for presenting individual ancestry admixture. MLE of ancestry
admixture (red point at the European vertex) was determined using 175 of the best
Ancestry Informative SNP Markers (AIMs) in the genome. The rings around the
MLE are confidence contours; any spot within the black ring could represent the
true proportions but is up to two times less likely to be correct than the MLE, and
similarly the blue and yellow rings represent five-times and ten-times boundaries.
The folding the tetrahedron along its three internal lines and the connection of
confidence contours through three-dimensional space enables the creation of a
three dimensional pyramid and the visualization of the likelihood for all possible
three and four-way mixtures. (c) Each plot represents an individual, who described
themselves as ’Caucasian’. The colour of the plot depends on which triangle
the plot falls in, for example, and red plots are individuals of European, East
Asian and Native American admixture, including 0% for any of these three groups.
There figures are courtesy of DNAPrint genomics, Sarasota, FL, USA (
ancestrybydna.com/triangle.asp
TRENDS in Genetics
East-Asian
1%
African
0%
Native
American
European
99%
Native
American
Native
American
Native
American
African
European
European
African
East-Asian
Native
American
(a)
(b)
(c)
Update
TRENDS in Genetics
Vol.20 No.8 August 2004
331

8 Bennett, D.C. and Lamoreux, M.L. (2003) The color loci of mice – a
genetic century. Pigment Cell Res. 16, 333 – 344
9 Rees, J.L. (2003) Genetics of hair and skin color. Annu. Rev. Genet. 37,
67 – 90
10 Eiberg, H. and Mohr, J. (1987) Major genes of eye color and hair color
linked to LU and SE. Clin. Genet. 31, 186 – 191
11 Eiberg, H. and Mohr, J. (1996) Assignment of genes coding for brown
eye colour (BEY2) and brown hair colour (HCL3) on chromosome 15q.
Eur. J. Hum. Genet. 4, 237 – 241
12 Zhu, G. et al. (2004) A genome scan for eye colour in 502 twin familes:
most variation is due to a QTL on chromosome 15q. Twin Res. 7,
197 – 210
13 Lee, S.T. et al. (1995) Organization and sequence of the human P gene
and identification of a new family of transport proteins. Genomics 26,
354 – 363
14 Brilliant, M.H. (2001) The mouse p (pink-eyed dilution) and human P
genes, oculocutaneous albinism type 2 (OCA2), and melanosomal pH.
Pigment Cell Res. 14, 86 – 93
15 Rebbeck, T.R. et al. (2002) P gene as an inherited biomarker of human
eye color. Cancer Epidemiol. Biomarkers Prev. 11, 782 – 784
16 Duffy, D.L. et al. (2004) Interactive effects of MC1R and OCA2 on
melanoma risk phenotypes. Hum. Mol. Genet. 13, 447 – 461
17 Kanetsky, P.A. et al. (2002) A polymorphism in the agouti signaling
protein gene is associated with human pigmentation. Am. J. Hum.
Genet. 70, 770 – 775
18 Frudakis, T. et al. (2003) Sequences associated with human iris
pigmentation. Genetics 165, 2071 – 2083
19 Shriver, M.D. et al. (2003) Skin pigmentation, biogeographical
ancestry and admixture mapping. Hum. Genet. 112, 387 – 399
20 Chakraborty, R. and Weiss, K.M. (1988) Admixture as a tool for finding
linked genes and detecting that difference from allelic association
between loci. Proc. Natl. Acad. Sci. U. S. A. 85, 9119 – 9123
21 McKeigue, P.M. et al. (2000) Estimation of admixture and detection of
linkage in admixed populations by a Bayesian approach: application to
African-American populations. Ann. Hum. Genet. 64, 171 – 186
22 McKeigue, P.M. (2000) Multipoint admixture mapping. Genet.
Epidemiol. 19, 464 – 467
23 Swank, R.T. et al. (2000) Abnormal vesicular trafficking in mouse
models of Hermansky-Pudlak syndrome. Pigment Cell Res. 13
(Suppl. 8), 59 – 67
24 Larsson, M. et al. (2003) Importance of genetic effects for character-
istics of the human iris. Twin Res. 6, 192 – 200
25 Stjernschantz, J.W. et al. (2002) Mechanism and clinical significance of
prostaglandin-induced iris pigmentation. Surv. Ophthalmol. 47
(Suppl. 1), S162 – S175
26 Albert, D.M. et al. (2003) Iris melanocyte numbers in Asian, African-
American, and Caucasian irides. Trans. Am. Ophthalmol. Soc. 101,
217 – 222
27 Ito, S. (2003) The IFPCS presidential lecture: a chemist’s view of
melanogenesis. Pigment Cell Res. 16, 230 – 236
0168-9525/$ - see front matter q 2004 Elsevier Ltd. All rights reserved.
doi:10.1016/j.tig.2004.06.010
Unexpected conserved non-coding DNA blocks in
mammals
Daniel J. Gaffney and Peter D. Keightley
Ashworth Laboratories, School of Biological Sciences, University of Edinburgh, West Mains Road, Edinburgh EH9 3JT,
United Kingdom
The significance of non-coding DNA is a longstanding
riddle in the study of molecular evolution. Using a
comparative genomics approach, Dermitzakis and col-
leagues have recently shown that at least some non-
coding sequence, frequently ignored as meaningless
noise, might bear the signature of natural selection. If
functional, it could mark a turning point in the way we
think about the evolution of the genome.
Few genomic features are more puzzling than the vast
amounts of apparently functionless non-coding DNA that
make up the greater proportion of human, mouse and
many other eukaryotic genomes. However, although the
view of non-coding sequence as genomic debris has been
widespread, recent results by Dermitzakis and colleagues
offers a fascinating hint that a significant proportion
can retain a function that, for the moment, remains a
mystery.
For much of the past 50 years, the functional genome
has been viewed as one that codes for protein and, until
recently, most evolutionary studies of DNA sequences
have focused almost entirely on this translated fraction,
which we now think accounts for as little as 1 – 2% of both
human and mouse DNA
. Many theories of the origin
of non-coding DNA are founded on the perception that the
bulk of such sequence is meaningless
and invoke
random processes of accumulation of this ‘junk’, for
example, the action of ‘selfish’ self-replicating elements
. Whole genome sequencing has, to some extent, borne
these views out. Approximately 40% of mouse and human
genomes are composed of the repetitive signatures that
characterize past insertion of such retroelements
Indeed, , 20% of the entire mouse genome appears to have
originated via the activity of a single class of element, the
long interspered elements (LINEs)
. However, excluding
repetitive DNA sequence still leaves enormous quantities
of non-coding sequence that we know little about. One of
the most intriguing suggestions arising from the compari-
son of human and mouse genomes is that protein-coding
sequences only account for approximately a fifth of the
total amount of each species’ genome that is subject to
purifying selection
. The implication is that relatively
large amounts of non-coding DNA are functional and it is
clear, therefore, that the elucidation of potential functions
(or otherwise) of non-coding DNA is a primary challenge in
evolutionary genomics.
Corresponding author: Daniel J. Gaffney (Daniel.Gaffney@ed.ac.uk).
Update
TRENDS in Genetics
Vol.20 No.8 August 2004
332
Document Outline
- Eye colour: portals into pigmentation genes and ancestry
- Unexpected conserved non-coding DNA blocks in mammals
Wyszukiwarka
Podobne podstrony:
BCVT Giám Sát Thi Công Kết Cấu Bê Tông Cốt Thép (NXB Giao Thông Vận Tải 2004) Nguyễn Viết Trung, 54
Alfiles de distinto color EDAMI, Mayo de 2004
Shōbōgenzō Zuimonki Sayings of Eihei Dōgen Zenji recorded by Koun Ejo tr by Shohaku Okumura (2004)
tr dzik rˇ¬owaty
syst tr 1 (2)TM 01 03)13
ref 2004 04 26 object pascal
tr obc wykr wekt
antropomotoryka 26 2004 id 6611 Nieznany (2)
2004 07 Szkoła konstruktorów klasa II
brzuch i miednica 2003 2004 23 01
2004 06 21
dz u 2004 202 2072
Mathematics HL May 2004 TZ1 P1
Deklaracja zgodno¶ci CE 07 03 2004
więcej podobnych podstron