
„Signal Theory” Zdzisław Papir
Signal Filtering

Signal Filtering
• Signal filtering – Fourier series
• Signal filtering - examples
• Signal filtering – Fourier transform
• Frequency characteristics of a signal after filtration
• Signal filtering – example
„Signal Theory” Zdzisław Papir

)
(s
H
)
(t
x
st
e
s
H
n
t
jn
n
e
X
t
x
o
)
(
n
t
jn
n
n
t
jn
Y
n
e
Y
e
jn
H
X
t
y
n
o
o
o
)
(
The Fourier series of the output signal y(t)
Signal filtering – Fourier series
st
e
t
y
„Signal Theory” Zdzisław Papir
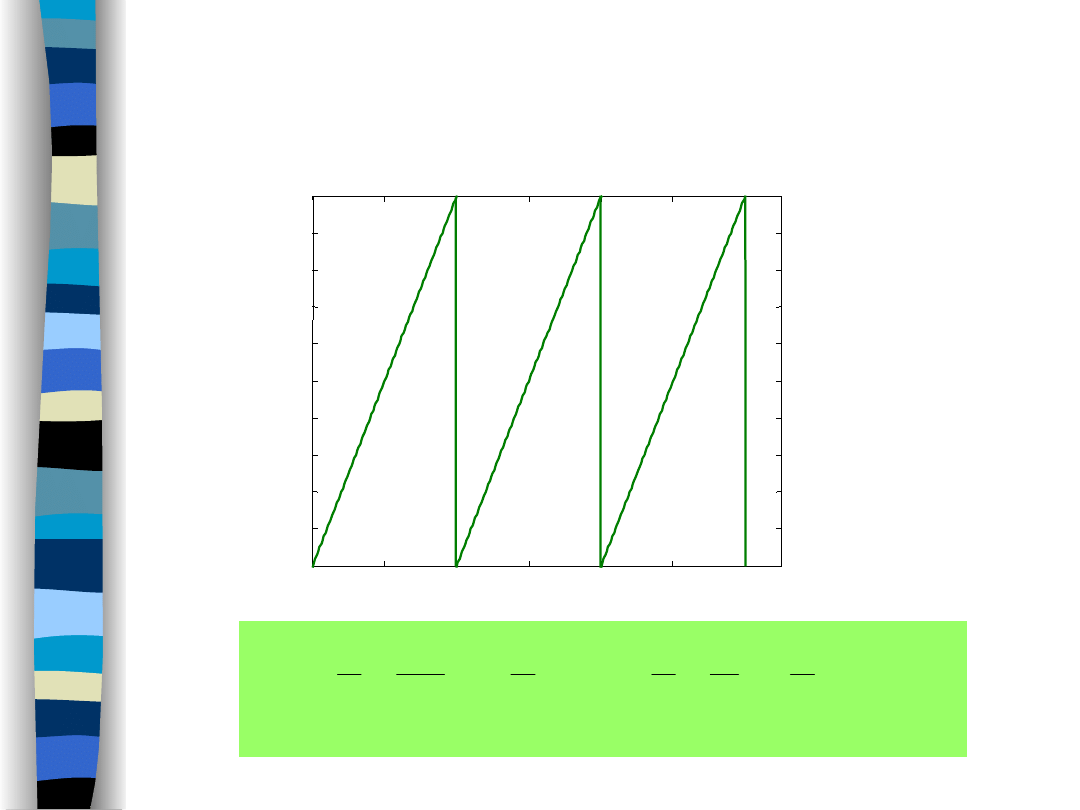
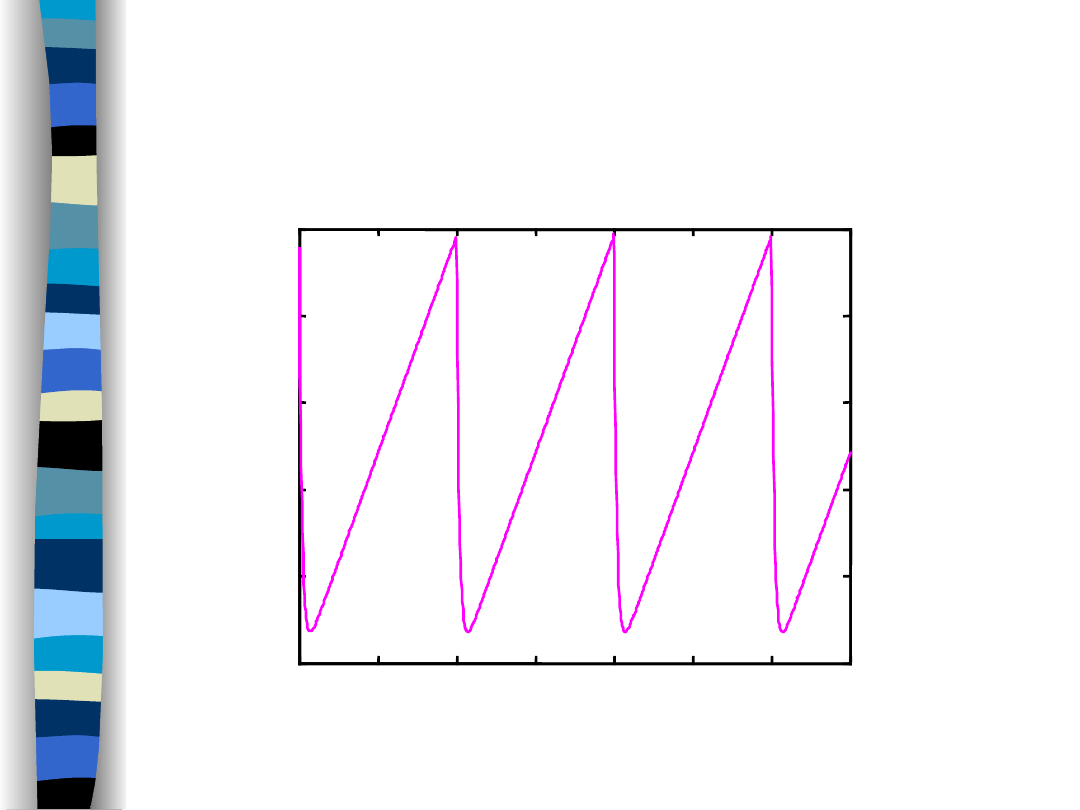
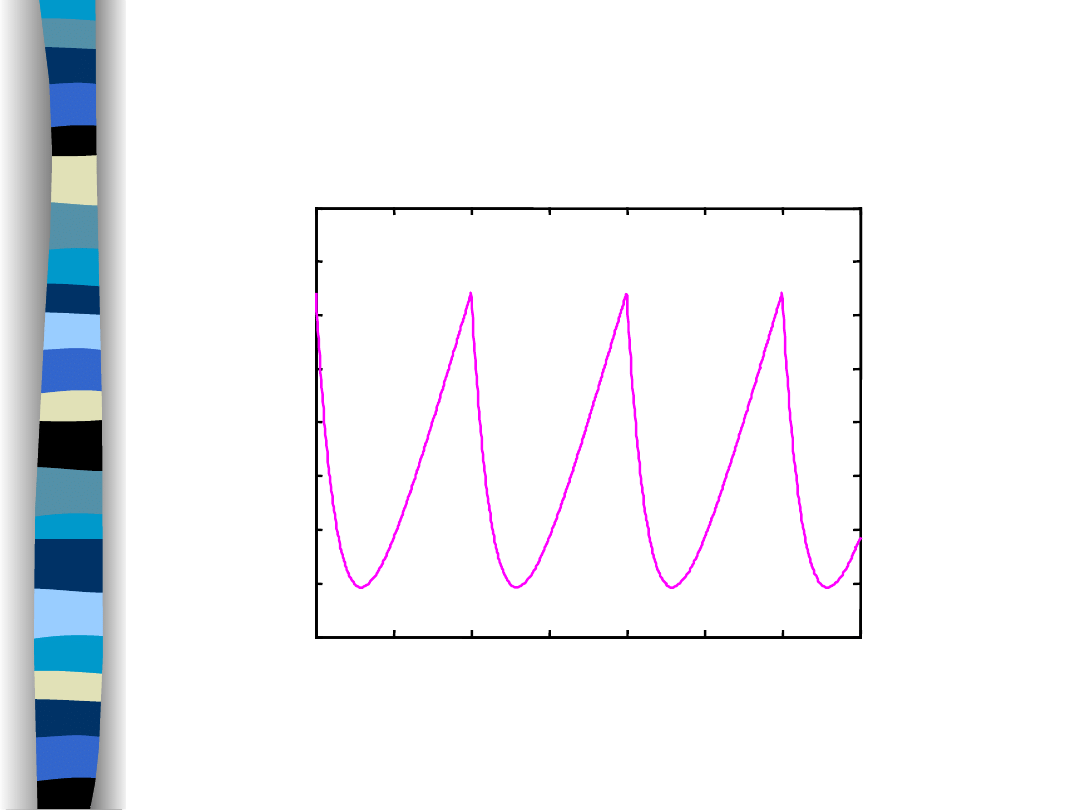
Sawtooth input signal x(t)
0
0.5
1
1.5
2
2.5
3
0
0.1
0.2
0.3
0.4
0.5
0.6
0.7
0.8
0.9
1
Sawtooth signal (period T)
time t/T
x(t)
t
n
n
e
n
j
t
x
n
t
jn
n
n
o
1
2
0
sin
1
1
2
1
1
2
2
1
Signal filtering - examples
„Signal Theory” Zdzisław Papir
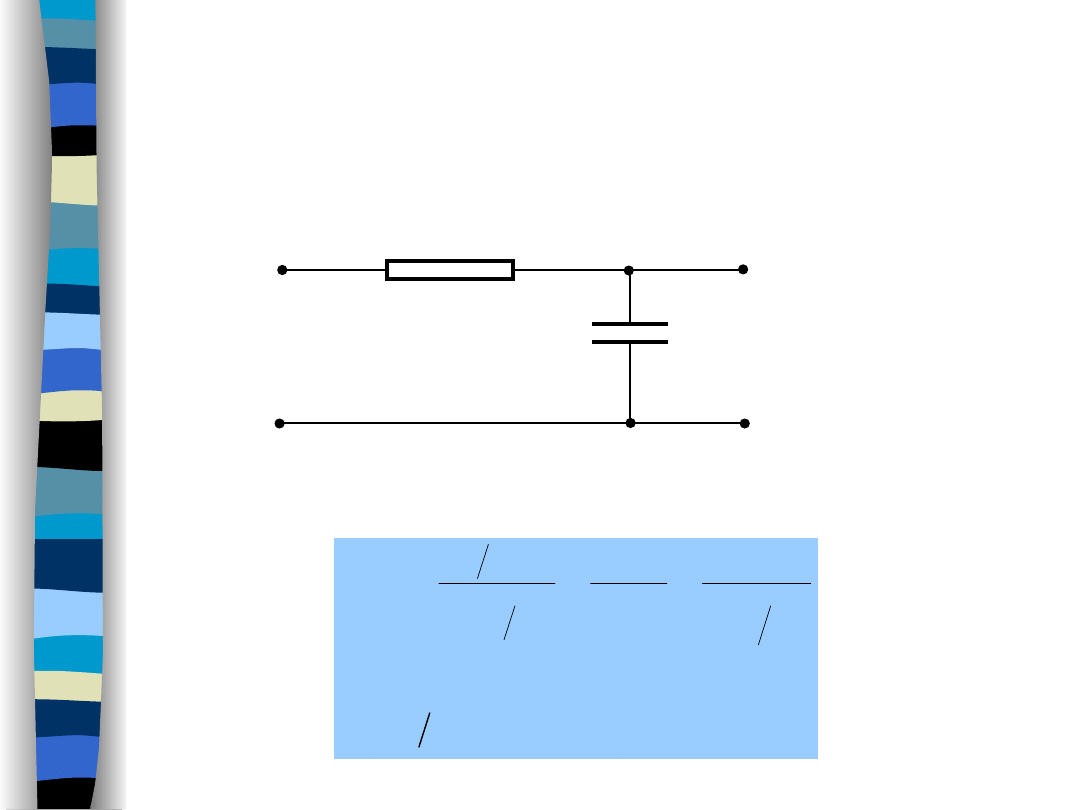
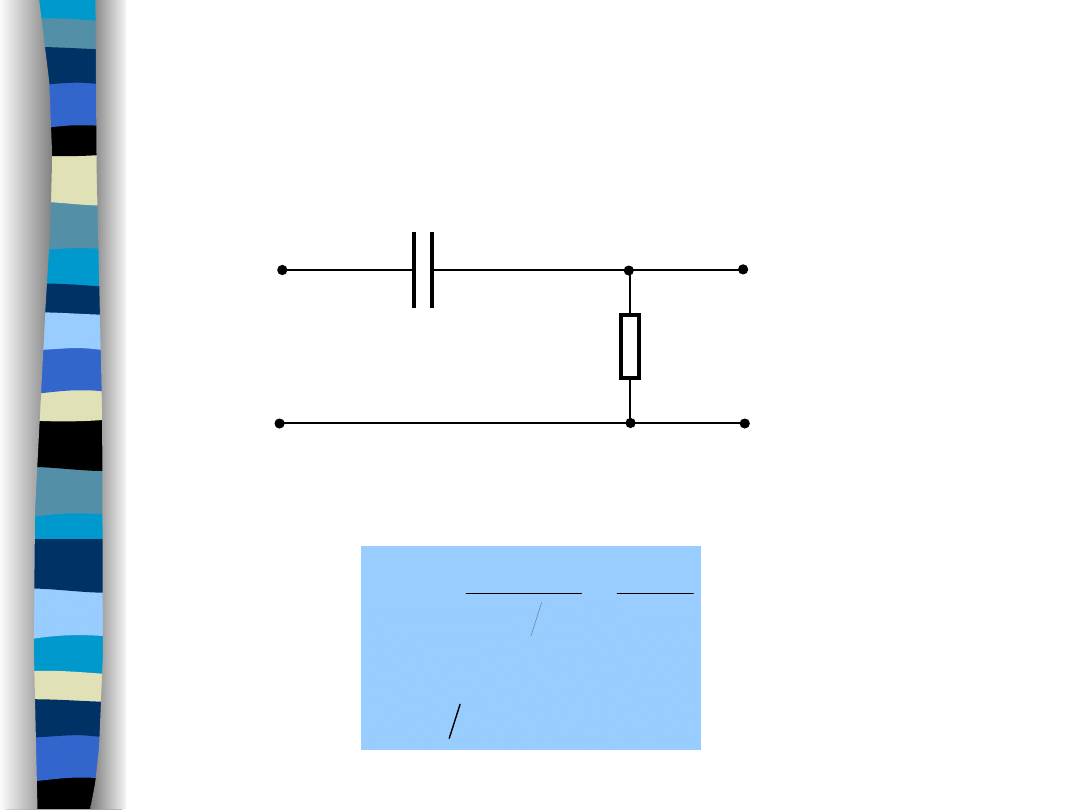
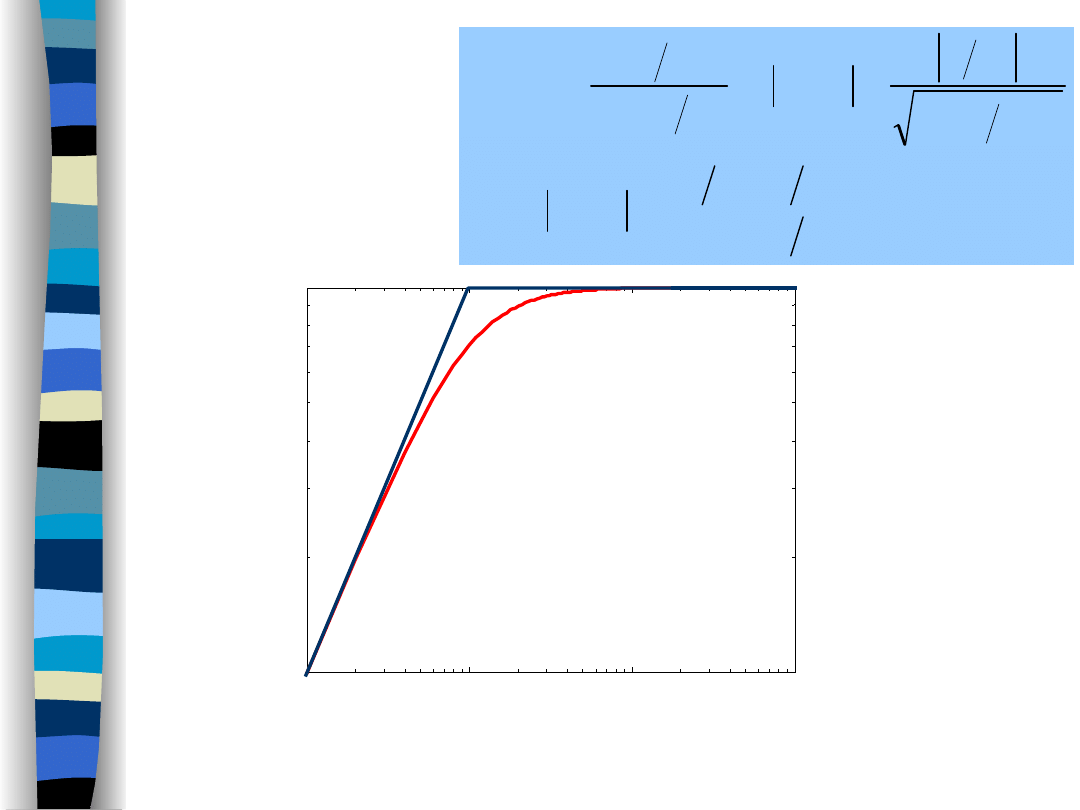
Lowpass filter
RC
T
T
s
Ts
Cs
R
Cs
s
H
,
1
1
1
1
1
1
1
g
g
R
C
„Signal Theory” Zdzisław Papir
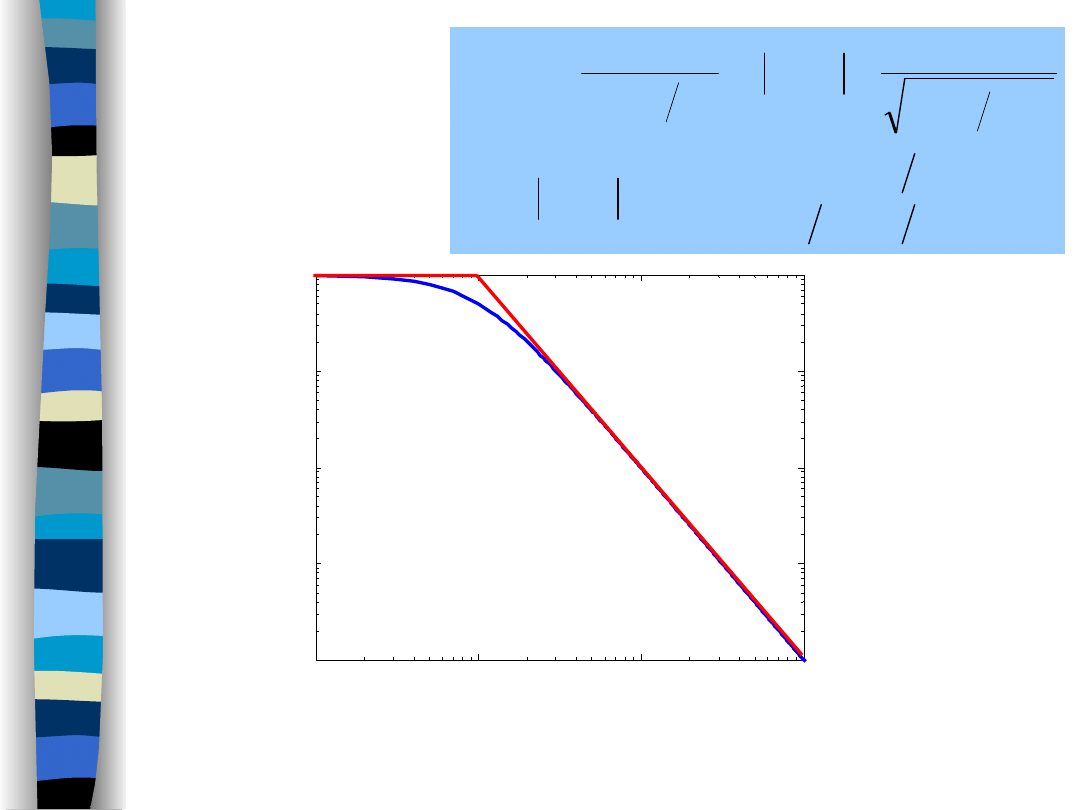
Lowpass
filter
1
,
log
20
1
,
0
log
20
1
1
,
1
1
g
g
g
2
g
g
H
H
j
j
H
„Signal Theory” Zdzisław Papir
10
-1
10
0
10
1
10
2
10
-4
10
-3
10
-2
10
-1
10
0
g
dec
dB
H
log-log amplitude characteristics of the LPF (1st order)

Input/output signals – Fourier
series
t
jn
n
n
e
jn
n
j
t
y
o
g
o
o
1
1
1
2
2
1
t
n
n
e
n
j
t
x
n
t
jn
n
n
o
1
o
sin
1
1
2
1
1
2
2
1
o
g
1
1
j
j
H
„Signal Theory” Zdzisław Papir
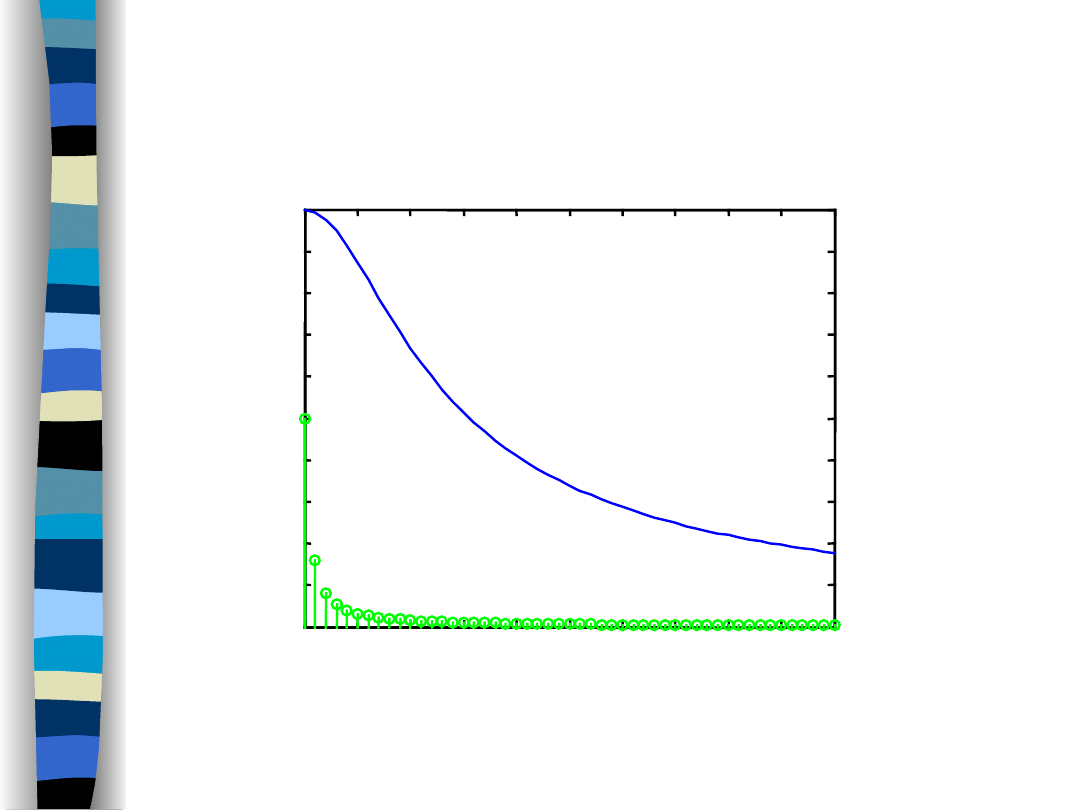
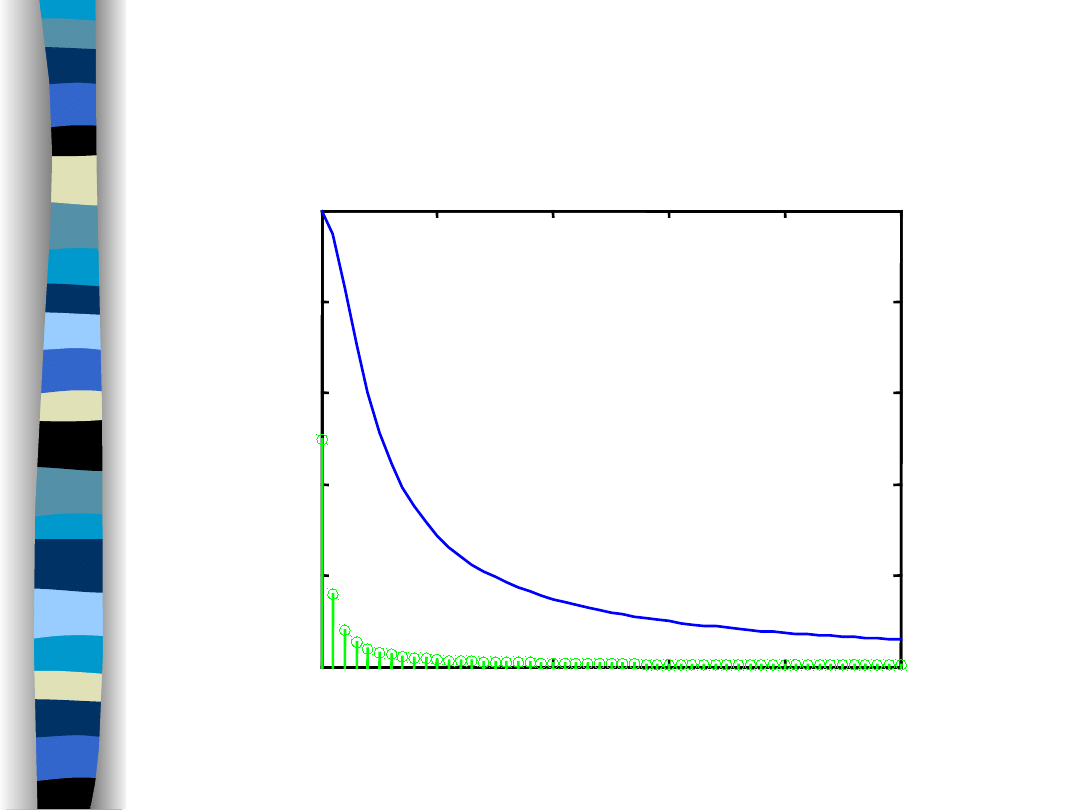
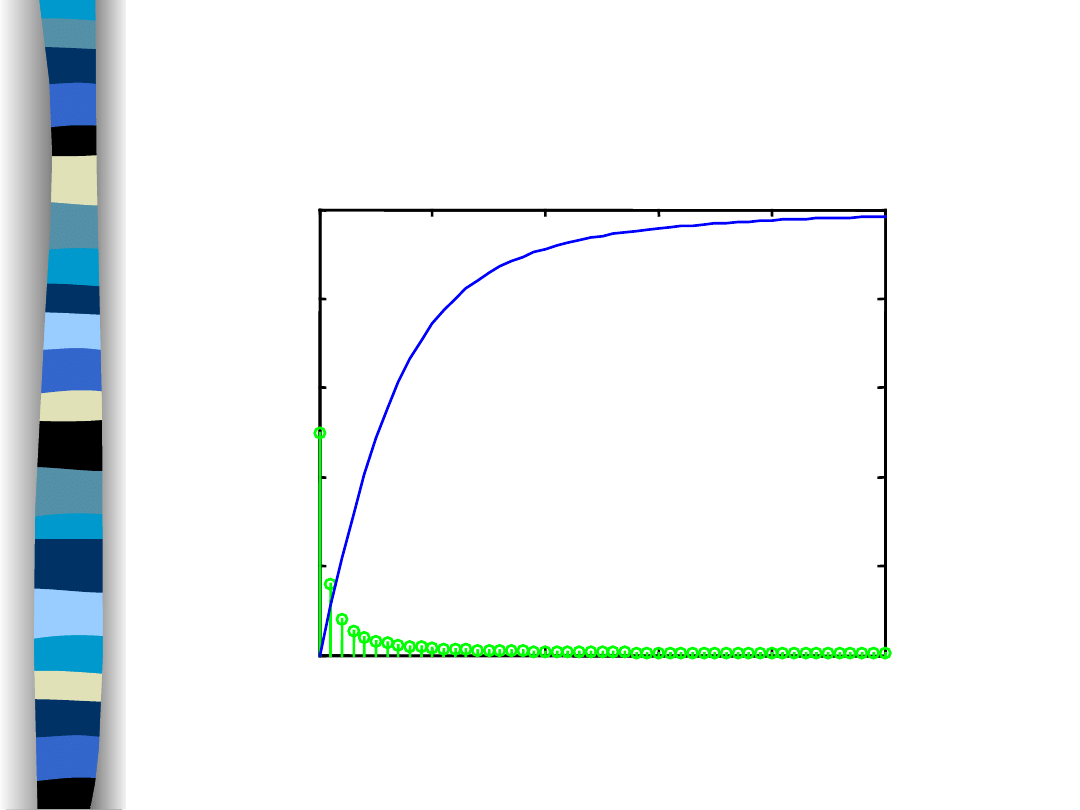
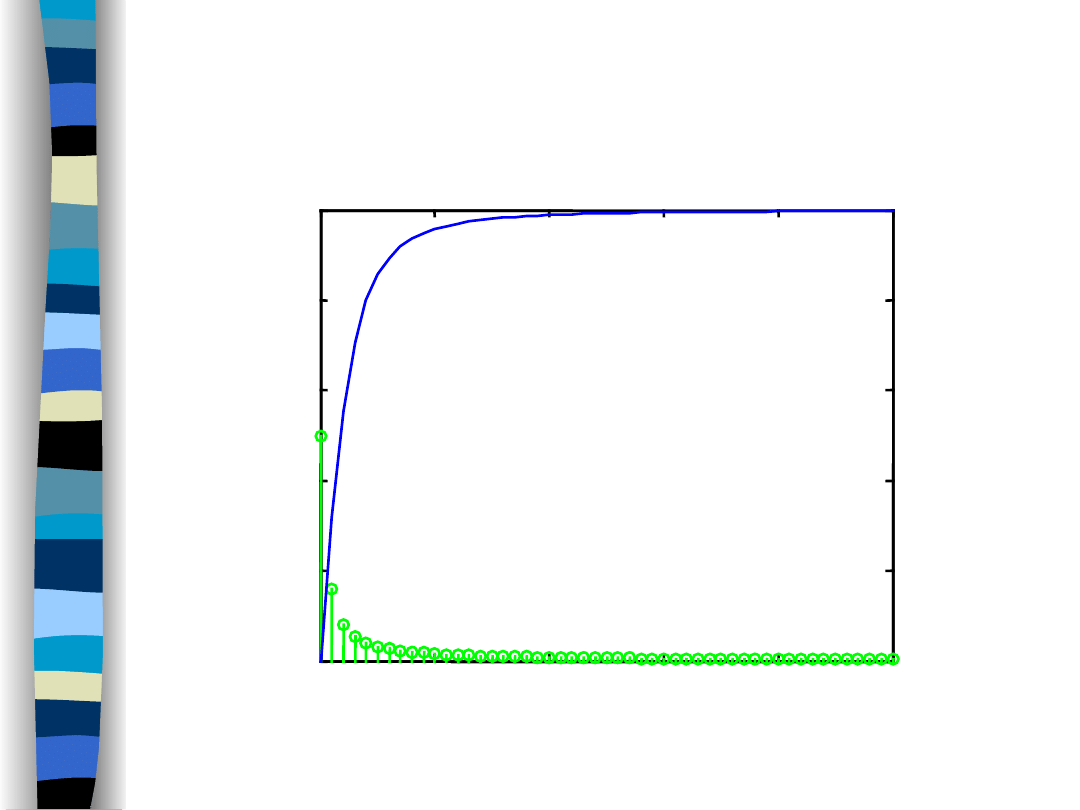
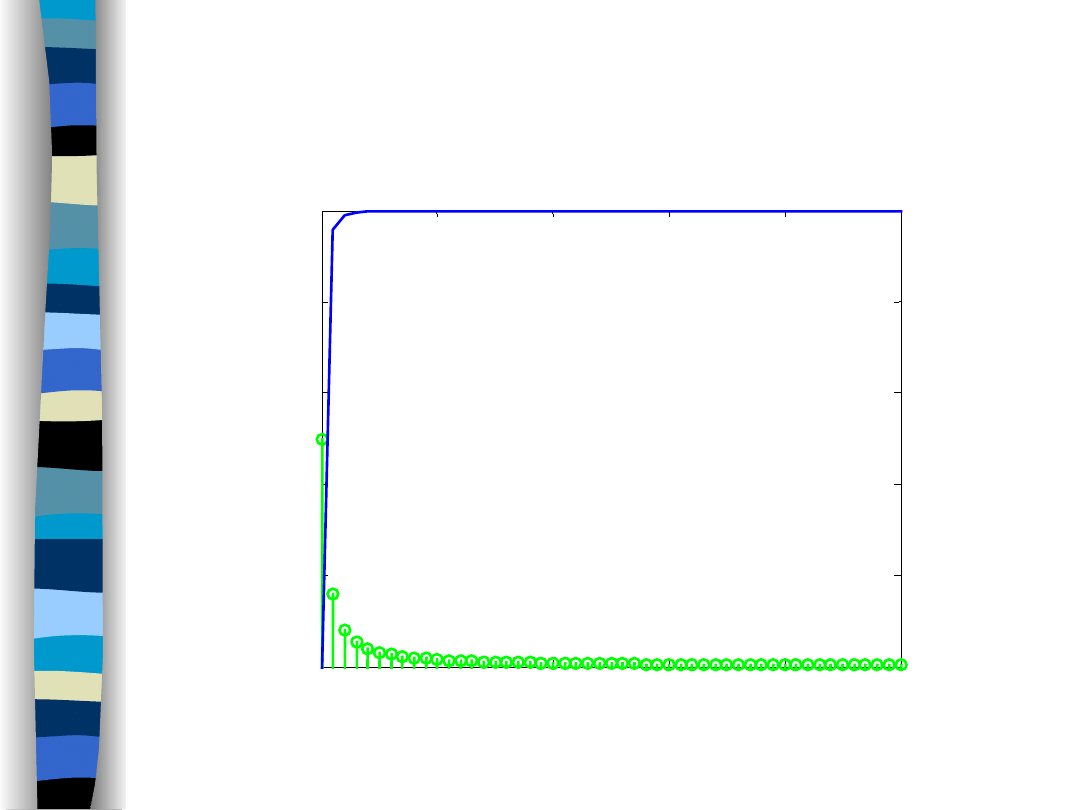
Amplitude spectra (f
g
/f
o
= 9)
0
5
10
15
20
25
30
35
40
45
50
0
0.1
0.2
0.3
0.4
0.5
0.6
0.7
0.8
0.9
1
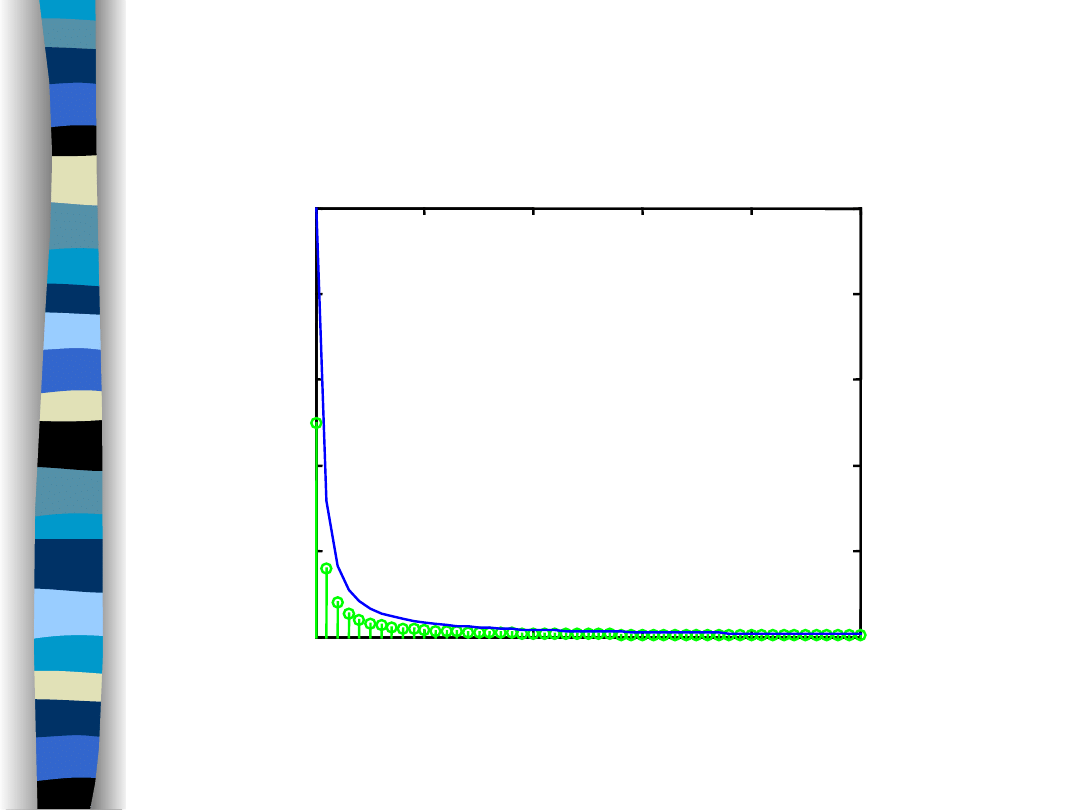
Lowpass filter and sawtooth signal – amplitude spectra
n
f
o
Lowpass filter
Sawtooth signal
f
g
/f
o
= 9
„Signal Theory” Zdzisław Papir
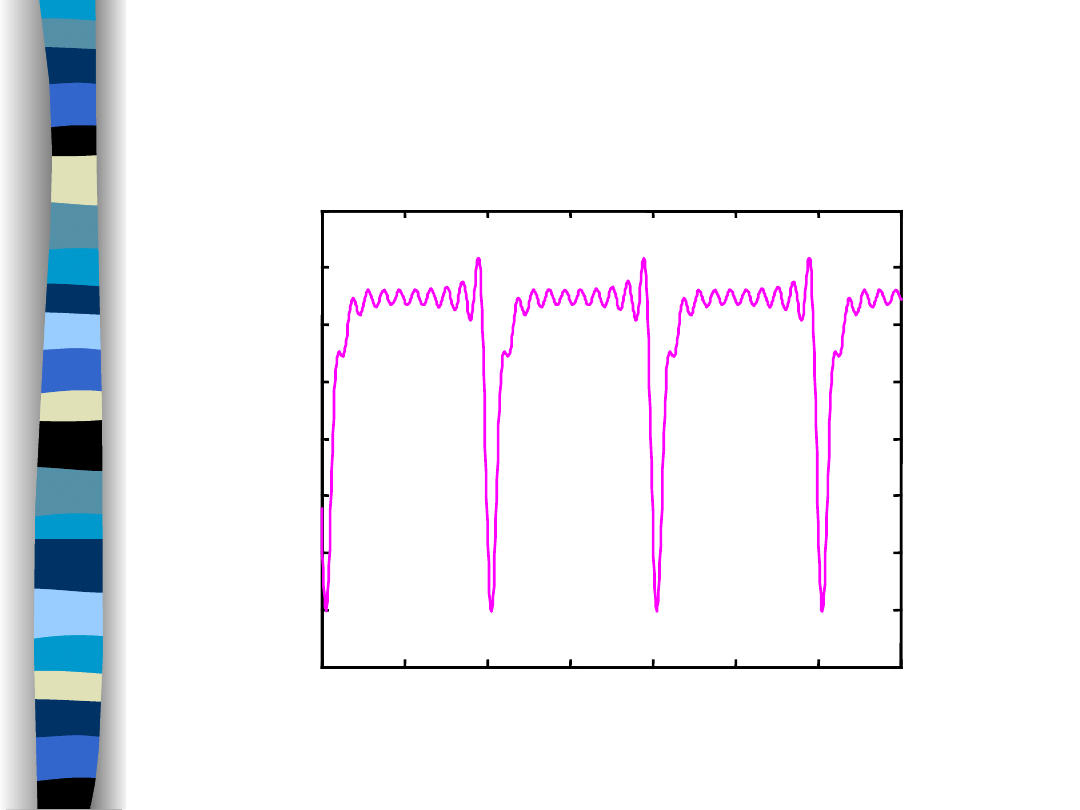
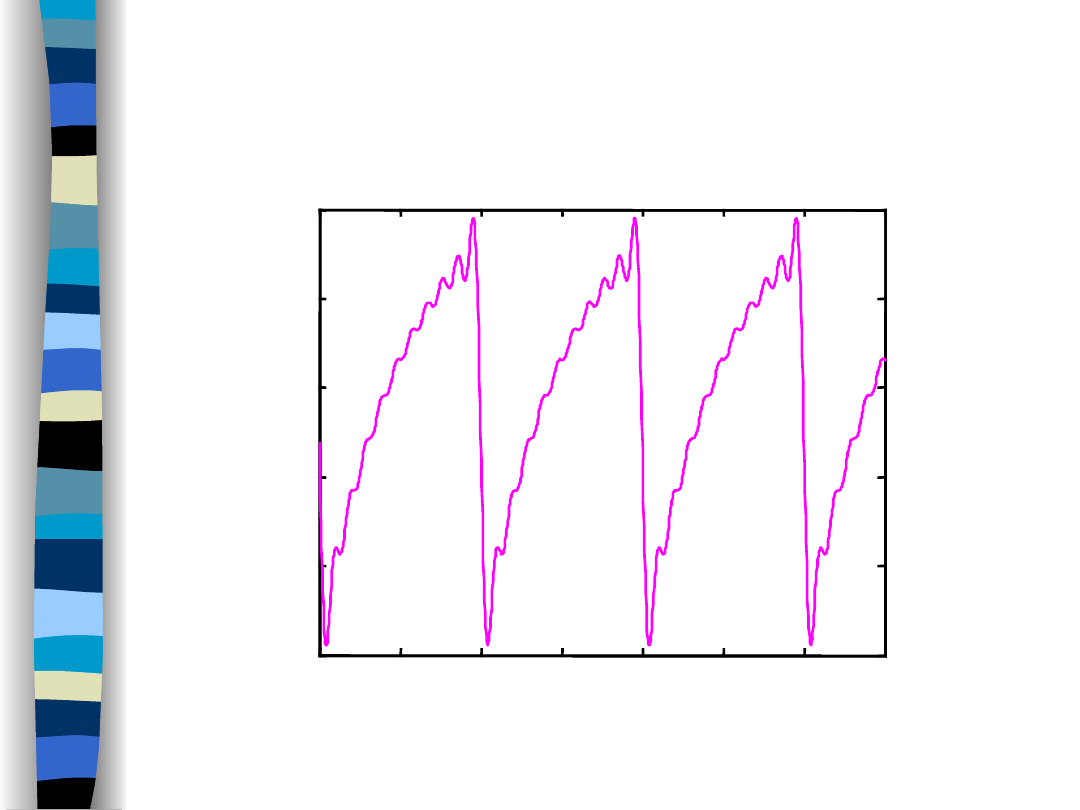
Output signal y(t) (f
g
/f
o
= 9)
0
0.5
1
1.5
2
2.5
3
3.5
0
0.2
0.4
0.6
0.8
1
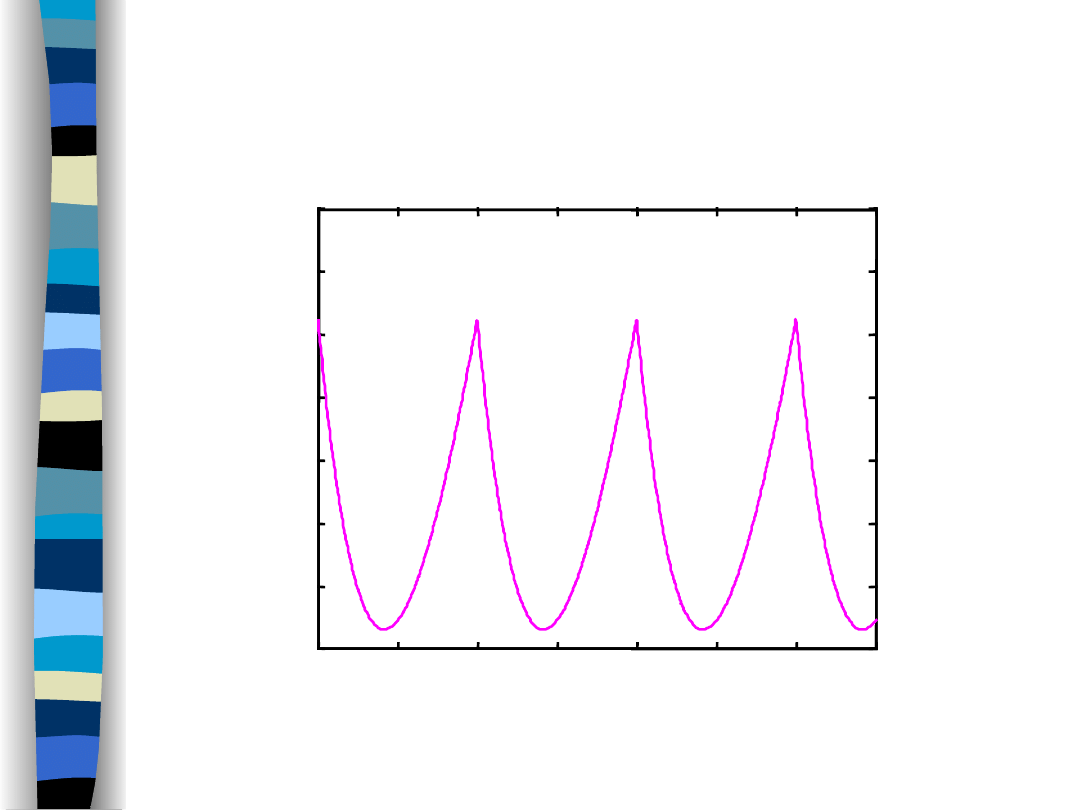
Lowpass filter response
time t/T
f
g
/f
o
= 9
„Signal Theory” Zdzisław Papir
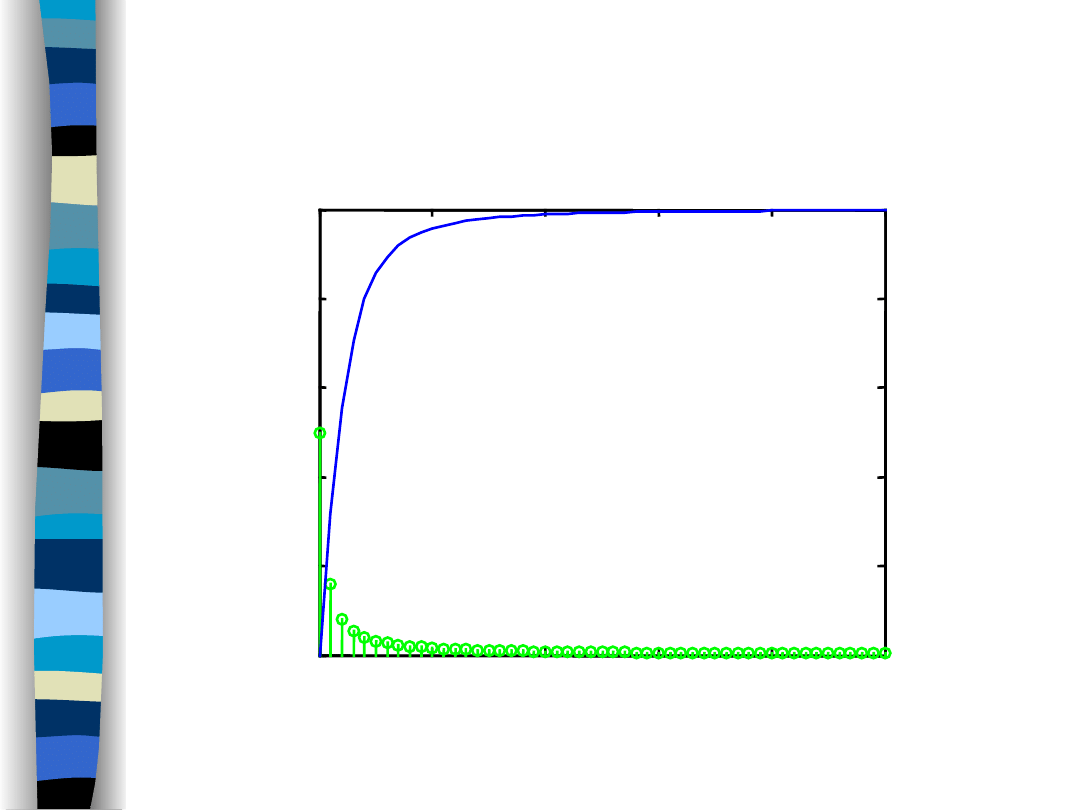
Amplitude spectra (f
g
/f
o
= 3)
0
10
20
30
40
50
0
0.2
0.4
0.6
0.8
1
Lowpass filter and sawtooth signal – amplitude spectra
Lowpass filter
Sawtooth signal
f
g
/f
o
= 3
n
f
o
„Signal Theory” Zdzisław Papir
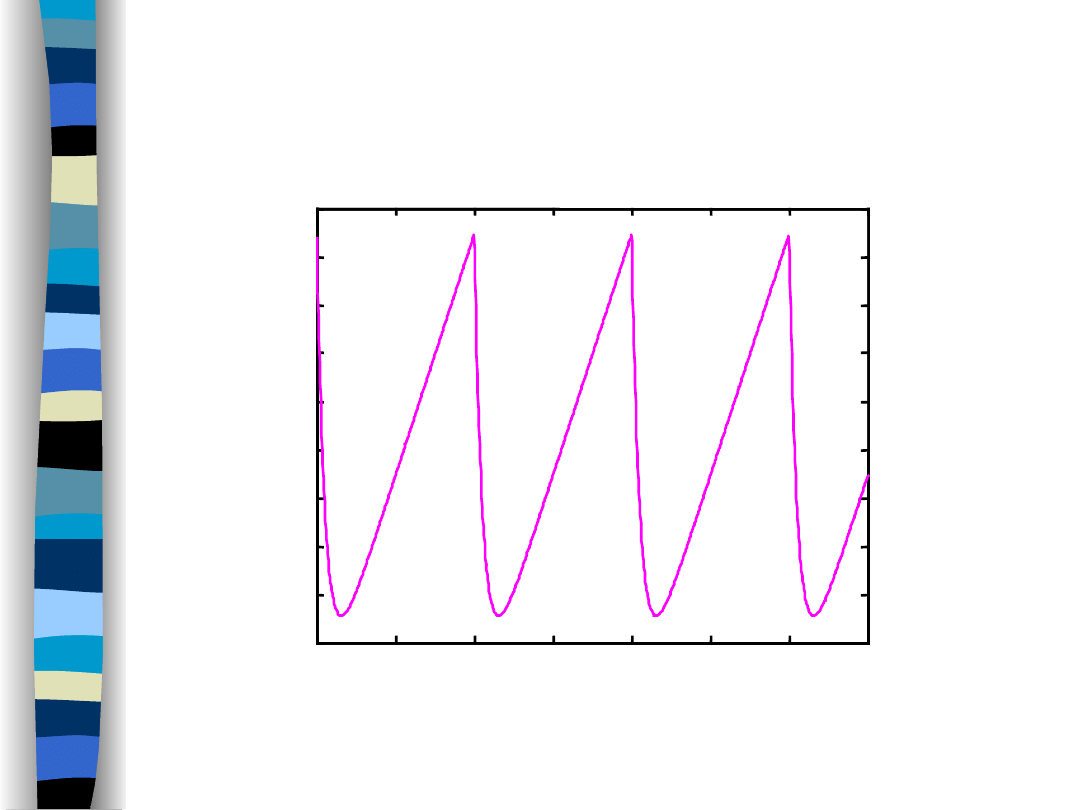
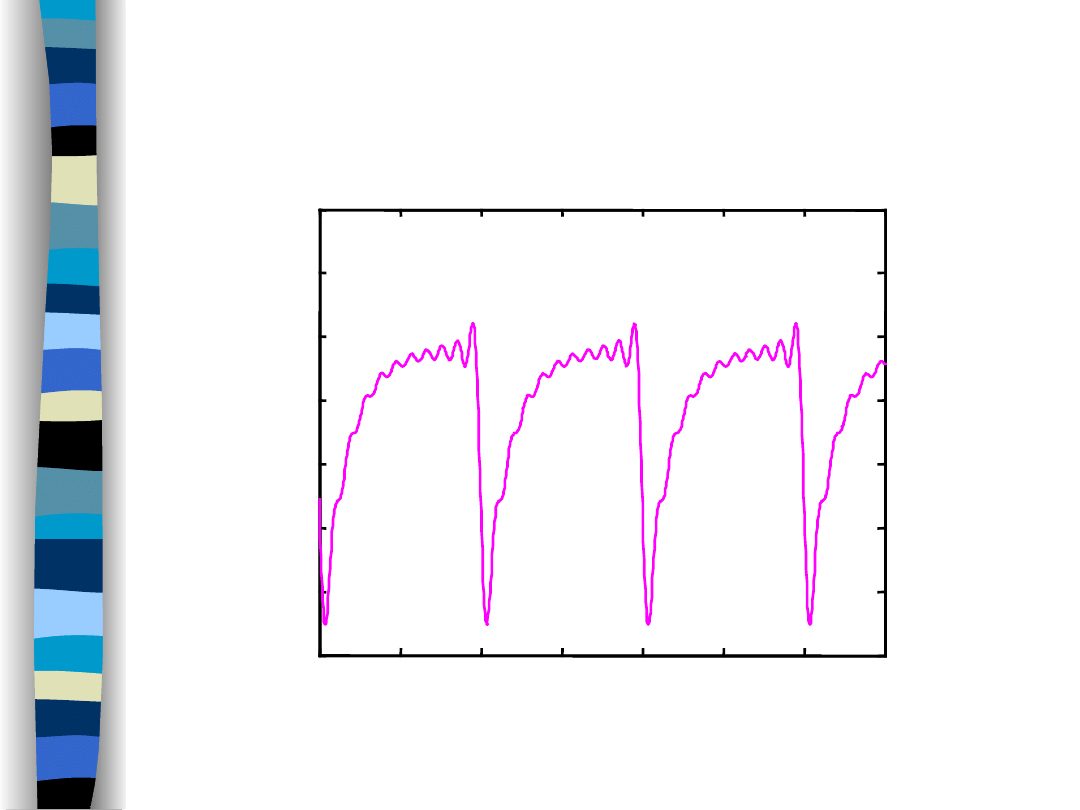
Output signal y(t) (f
g
/f
o
= 3)
0
0.5
1
1.5
2
2.5
3
3.5
0.1
0.2
0.3
0.4
0.5
0.6
0.7
0.8
0.9
1
Lowpass filter response
time t/T
f
g
/f
o
= 3
„Signal Theory” Zdzisław Papir
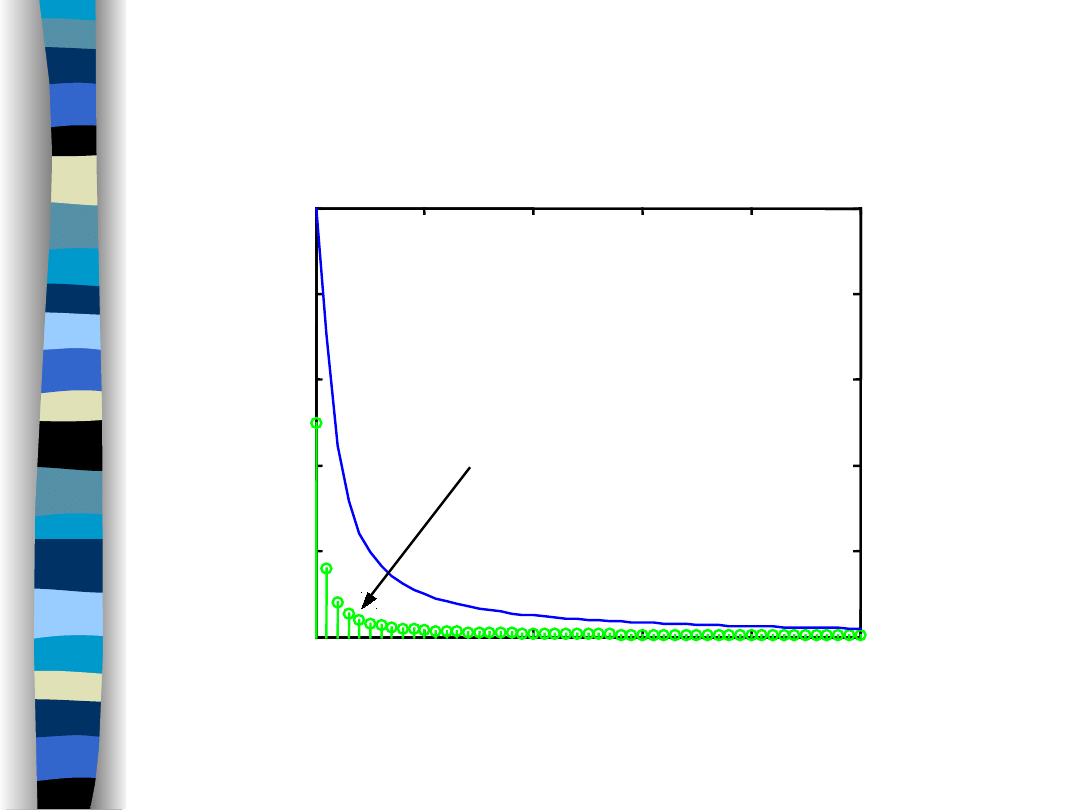
Amplitude spectra (f
g
/f
o
= 1)
0
10
20
30
40
50
0
0.2
0.4
0.6
0.8
1
Lowpass filter and sawtooth signal – amplitude spectra
Lowpass filter
Sawtooth signal
f
g
/f
o
= 1
n
f
o
„Signal Theory” Zdzisław Papir
Output signal y(t) (f
g
/f
o
= 1)
0
0.5
1
1.5
2
2.5
3
3.5
0.2
0.3
0.4
0.5
0.6
0.7
0.8
0.9
1
Lowpass filter response
time t/T
f
g
/f
o
= 1
„Signal Theory” Zdzisław Papir
Amplitude spectra (f
g
/f
o
= 1/3)
0
10
20
30
40
50
0
0.2
0.4
0.6
0.8
1
Lowpass filter and sawtooth signal – amplitude spectra
f
g
/f
o
= 1/3
n
f
o
„Signal Theory” Zdzisław Papir
Output signal y(t) (f
g
/f
o
= 1/3)
0
0.5
1
1.5
2
2.5
3
3.5
0.4
0.45
0.5
0.55
0.6
0.65
0.7
0.75
Lowpass filter response
time t/T
f
g
/f
o
= 1/3
„Signal Theory” Zdzisław Papir
Highpass filter
RC
T
T
Ts
Ts
Cs
R
R
s
H
g
,
1
1
1
R
C
„Signal Theory” Zdzisław Papir
Highpass
filter
„Signal Theory” Zdzisław Papir
10
-1
10
0
10
1
10
2
10
-1
10
0
g
dec
dB
H
log-log amplitude characteristics of the HPF (1st order)
1
,
0
1
,
log
20
1
,
1
g
g
g
2
g
g
g
g
H
H
j
j
j
H
„Signal Theory”
Zdzisław Papir
o
g
o
g
o
g
o
g
o
o
o
o
1
2
1
1
1
2
n
n
t
jn
t
jn
n
n
e
jn
e
jn
jn
n
j
t
y
t
n
n
e
n
j
t
x
n
t
jn
n
n
o
1
o
sin
1
1
2
1
1
2
2
1
o
g
g
1
j
j
j
H
Input/output signals – Fourier
series
Amplitude spectra (f
g
/f
o
= 9)
0
10
20
30
40
50
0
0.2
0.4
0.6
0.8
1
Highpass filter and sawtooth signal – amplitude spectra
Highpass filter
Sawtooth signal
f
g
/f
o
= 9
n
f
o
„Signal Theory”
Zdzisław Papir
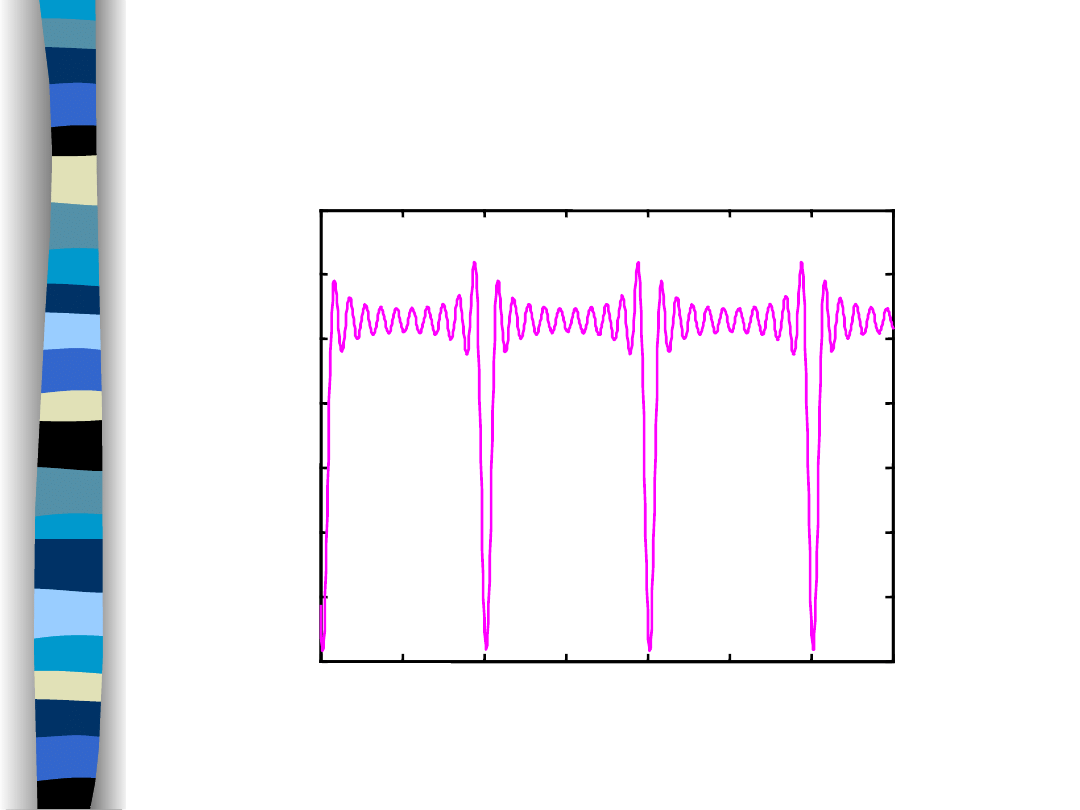
Output signal y(t) (f
g
/f
o
= 9)
0
0.5
1
1.5
2
2.5
3
3.5
-25
-20
-15
-10
-5
0
5
10
Highpass filter response
time t/T
f
g
/f
o
= 9
„Signal Theory” Zdzisław Papir
Amplitude spectra (f
g
/f
o
= 3)
0
10
20
30
40
50
0
0.2
0.4
0.6
0.8
1
Highpass filter and sawtooth signal – amplitude spectra
Highpass filter
Sawtooth signal
n
f
o
f
g
/f
o
= 3
„Signal Theory” Zdzisław Papir
Output signal y(t) (f
g
/f
o
= 3)
0
0.5
1
1.5
2
2.5
3
3.5
-6
-5
-4
-3
-2
-1
0
1
2
Highpass filter response
time t/T
f
g
/f
o
= 3
„Signal Theory” Zdzisław Papir
Amplitude spectra (f
g
/f
o
= 1)
0
10
20
30
40
50
0
0.2
0.4
0.6
0.8
1
Highpass filter and sawtooth signal – amplitude spectra
Highpass filter
Sawtooth signal
n
f
o
f
g
/f
o
= 1
„Signal Theory” Zdzisław Papir
Output signal y(t) (f
g
/f
o
= 1)
0
0.5
1
1.5
2
2.5
3
3.5
-0.8
-0.6
-0.4
-0.2
0
0.2
0.4
0.6
High pass filter
time t/T
f
g
/f
o
= 1
„Signal Theory” Zdzisław Papir
Amplitude spectra (f
g
/f
o
= 1/3)
0
10
20
30
40
50
0
0.2
0.4
0.6
0.8
1
Highpass filter and sawtooth signal – amplitude spectra
Highpass filter
Sawtooth signal
n
f
o
f
g
/f
o
= 0,3
„Signal Theory” Zdzisław Papir
Output signal y(t) (f
g
/f
o
= 1/3)
Highpass filter response
0
0.5
1
1.5
2
2.5
3
3.5
-0.06
-0.04
-0.02
0
0.02
0.04
time t/T
f
g
/f
o
= 0,3
„Signal Theory” Zdzisław Papir

„Teoria sygnałów” Zdzisław Papir
d
e
j
X
t
x
t
j
2
1
)
(
j
X
j
H
j
Y
d
e
j
X
j
H
t
y
t
j
2
1
)
(
Transformata Fouriera sygnału wyjściowego y(t)
)
(s
H
)
(t
x
t
j
e
j
X
j
H
2
1
t
j
e
j
X
2
1
t
y
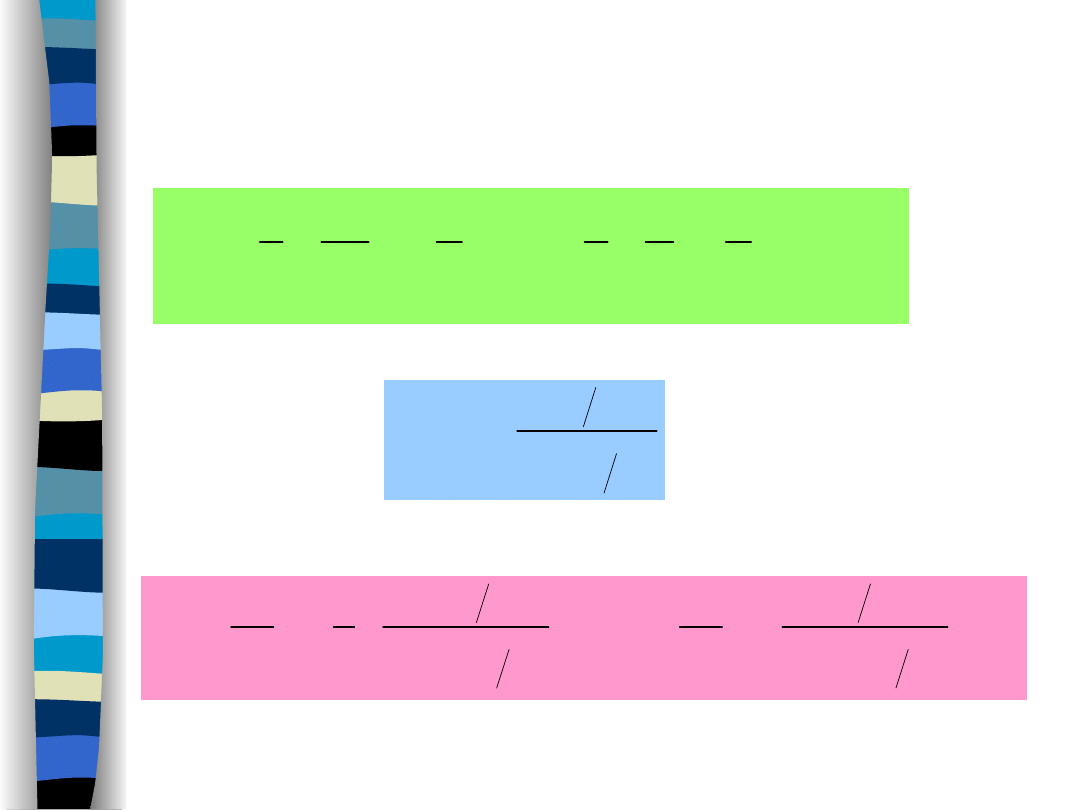
Signal filtering - Fourier transform

j
X
j
H
j
Y
j
Y
t
y
t
t
x
t
h
t
y
t
x
t
h
j
X
j
H
j
Y
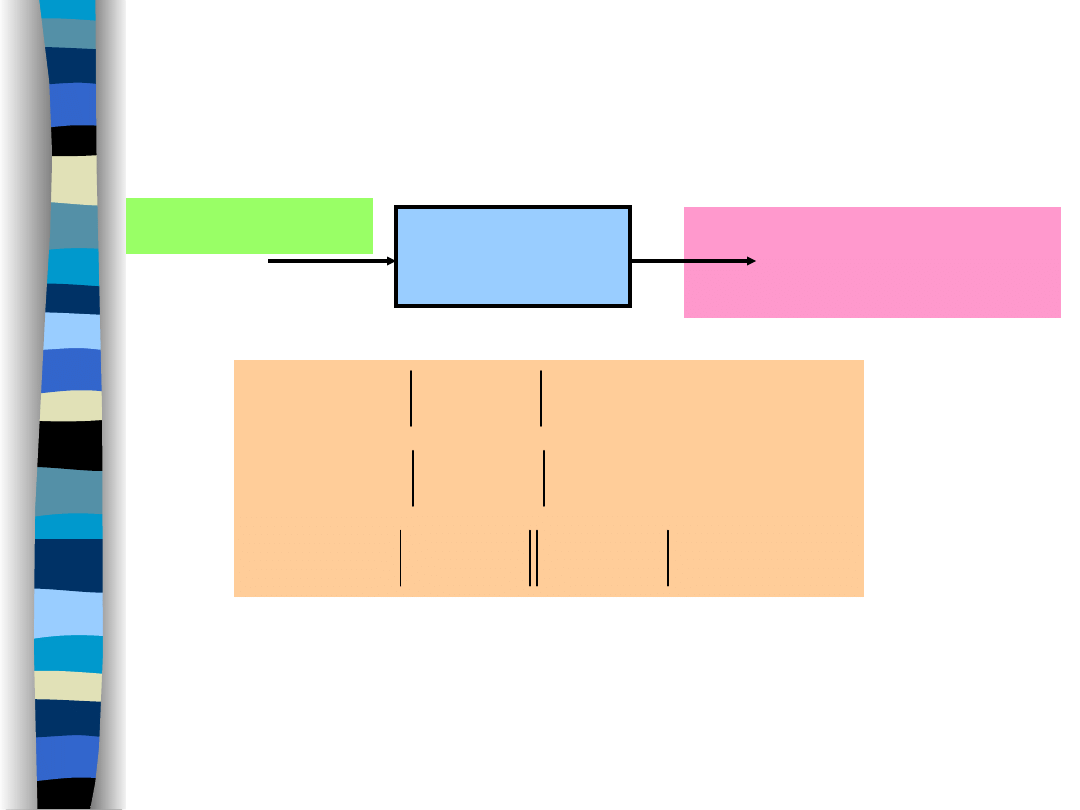
Impulse response of the filter
Signal filtering - Fourier transform
)
(s
H
j
X
t
x
)
(
)
(t
h
)
(t
h
t
y
t
t
x
)
(
Impulse response of a filter is its output signal when
input of a filter is excited by the Dirac delta impulse
(t).
„Signal Theory”
Zdzisław Papir
Frequency characteristics
of a signal after filtration
j
X
j
H
j
Y
j
Y
t
y
)
(s
H
j
X
t
x
)
(
j
j
j
e
j
H
j
X
j
Y
e
j
H
j
H
e
j
X
j
X
Filtration changes both:
• amplitude spectrum
• phase spectrum
of an input signal.
„Signal Theory” Zdzisław Papir

Signal filtering - example
W
j
H
j
t
t
x
2
1
1
Wt
d
d
t
d
t
j
t
j
d
e
j
d
e
j
t
y
Wt
W
W
W
W
W
t
j
t
j
W
W
Si
1
2
1
sin
1
2
1
sin
1
2
1
sin
cos
2
1
2
1
2
1
2
1
1
2
1
0
0
x
d
x
0
sin
Si
„Signal Theory”
Zdzisław Papir

Sinus integral
properties
x
d
x
0
sin
Si
„Signal Theory” Zdzisław Papir
1. Sinus integral is an odd function
x
du
u
u
du
d
u
d
x
x
x
Si
sin
sin
Si
0
0
2. Sinus integral in zero vicinity (x 0)
0
sin
0
Si
0
0
d
0
sin
,
0
Si
0
x
d
x
x

Sinus integral
properties
x
d
x
0
sin
Si
„Signal Theory”
Zdzisław Papir
3. Horizontal asymptote (x )
2
sin
Si
lim
0
x
d
x
0
0
sin
2
1
sin
2
1
sin
F
d
d
4. Local extrema
0
,
0
sin
Si
k
k
x
x
x
dx
x
d
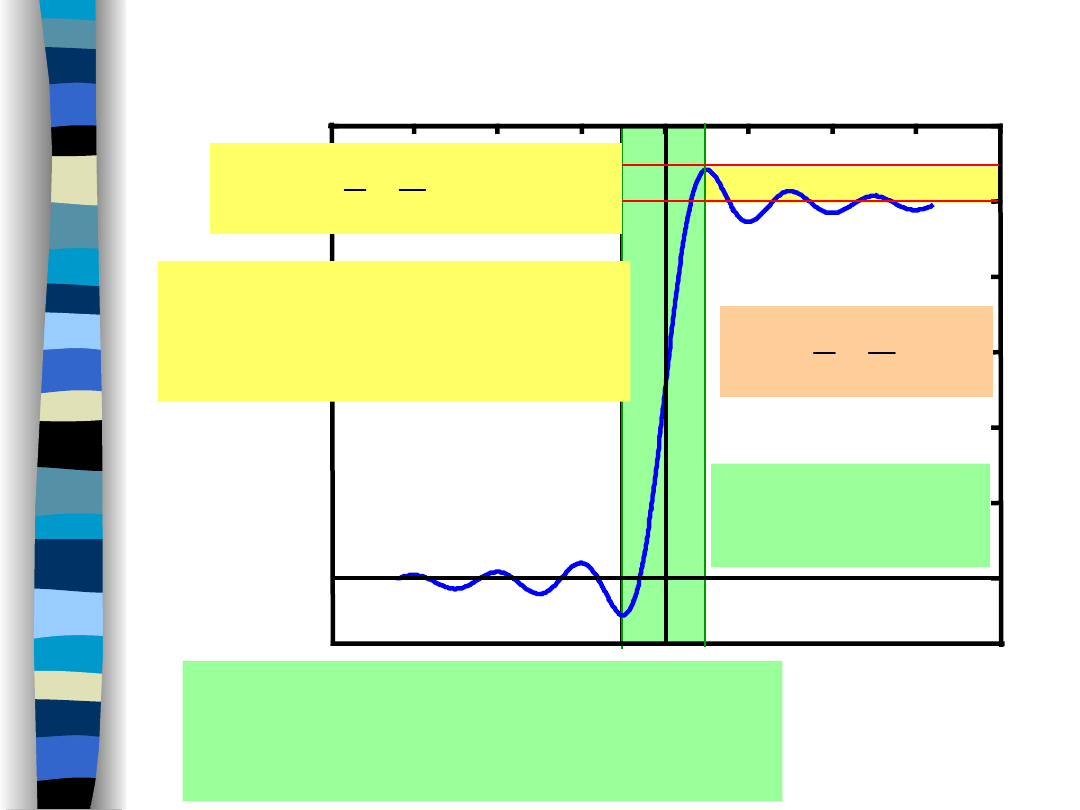
Rising time of a filter output
is inversely proportional
to its bandwidth.
Signal filtering - example
„Signal Theory” Zdzisław Papir
1
0
Wt
t
y
Si
1
2
1
+
/W
-
/W
t
r
= 2
/W =
1/B
W
f
W
y
Si
1
2
1
The peak output value
does not depend on
the filter bandwidth.

Summary
• The output signal of the filter excited by a periodic signal
is a periodic signal as well; in most cases its Fourier series
is not summable to a closed form expression.
•
The Fourier transform of the output signal is a product of the
filter transfer function and input signal Fourier transform.
• The impulse response of the filter is its output signal when
the filter is driven by the Dirac delta
(t).
•
The filter output signal is a convolution of the filter
impulse response and the input signal.
„Signal Theory”
Zdzisław Papir
Document Outline
- Slide 1
- Slide 2
- Slide 3
- Slide 4
- Slide 5
- Slide 6
- Slide 7
- Slide 8
- Slide 9
- Slide 10
- Slide 11
- Slide 12
- Slide 13
- Slide 14
- Slide 15
- Slide 16
- Slide 17
- Slide 18
- Slide 19
- Slide 20
- Slide 21
- Slide 22
- Slide 23
- Slide 24
- Slide 25
- Slide 26
- Slide 27
- Slide 28
- Slide 29
- Slide 30
- Slide 31
- Slide 32
- Slide 33
- Slide 34
Wyszukiwarka
Podobne podstrony:
ARRL QST Magazine Clean up Signals with Band Pass Filters (part 1) (1998) WW
Efficient VLSI architectures for the biorthogonal wavelet transform by filter bank and lifting sc
Applications of polyphase filters for bandpass sigma delta analog to digital conversion
Fine Filters CJC
Constant darkness is a circadian metabolic signal
Differential Signals, Rules to Live By
EMI Suppression Filters EMIFIL Nieznany
differential signals
(ebook pdf) Mathematics Statistical Signal Processing WLBIFTIJHHO6AMO5Z3SDWWHJDIBJQVMSGHGBTHI
FILTRY 3, //1) Simple comb filter
No Filter Trade as you see it
Pi filter id 356366 Nieznany
seamaster mpzzm signals
pisanie 16 Transition signals
doc0940 8 Point Moving Average Filter on tinyAVR and megaAVR devices
K filter
Fire Wall oparte na IP Filter
więcej podobnych podstron