©
2006
Nature Publishing Group
Constant darkness is a circadian metabolic signal
in mammals
Jianfa Zhang
1
*, Krista Kaasik
2
*, Michael R. Blackburn
1
& Cheng Chi Lee
1
Environmental light is the ‘zeitgeber’ (time-giver) of circadian
behaviour
1
. Constant darkness is considered a ‘free-running’
circadian state. Mammals encounter constant darkness during
hibernation
2
. Ablation of the master clock synchronizer, the
suprachiasmatic nucleus, abolishes torpor, a hibernation-like
state, implicating the circadian clock in this phenomenon
2,3
.
Here we report a mechanism by which constant darkness regulates
the gene expression of fat catabolic enzymes in mice. Genes for
murine procolipase (mClps) and pancreatic lipase-related protein
2 (mPlrp2) are activated in a circadian manner in peripheral
organs during 12 h dark:12 h dark (DD) but not light–dark (LD)
cycles. This mechanism is deregulated in circadian-deficient
mPer1
2
/2
/mPer2
m/m
mice. We identified circadian-regulated
5
0
-AMP, which is elevated in the blood of DD mice, as a key
mediator of this response. Synthetic 5
0
-AMP induced torpor and
mClps expression in LD animals. Torpor induced by metabolic
stress was associated with elevated 5
0
-AMP levels in DD mice.
Levels of glucose and non-esterified fatty acid in the blood are
reversed in DD and LD mice. Induction of mClps expression by
5
0
-AMP in LD mice was reciprocally linked to blood glucose levels.
Our findings uncover a circadian metabolic rhythm in mammals.
Hibernation is an energy conservation mechanism
4
. Unlike a true
hibernator, the laboratory mouse can only undergo torpor
5,6
. During
hibernation, an animal departs from LD and enters the DD environ-
ment of a den
2
. We proposed that this environmental change is a
signal for the initiation of torpor. Microarray studies were used to
identify genes that display differential expression in the liver of
DD and LD mice (Supplementary Fig. 1). This screen identified a
gene encoding CLPS, the enzymatic partner of PLRP2, required
for dietary fat degradation
7,8
. mClps expression is restricted to
pancreas and the gastrointestinal organs
7,8
, so its presence in DD
mice livers was unexpected. To clarify this observation, we analysed
mClps expression in liver messenger RNA (mRNA) of wild-type,
mPer1-null (mPer1
2
/2
), mPer2 mutant (mPer2
m/m
) and circadian-
deficient double mutant (mPer1
2
/2
/mPer2
m/m
) mice during zeitgeber
time (ZT)
9,10
. Except for three mPer1
2
/2
/mPer2
m/m
animals, northern
blot analysis showed no detectable mClps expression in livers of wild-
type, mPer1
2
/2
and mPer2
m/m
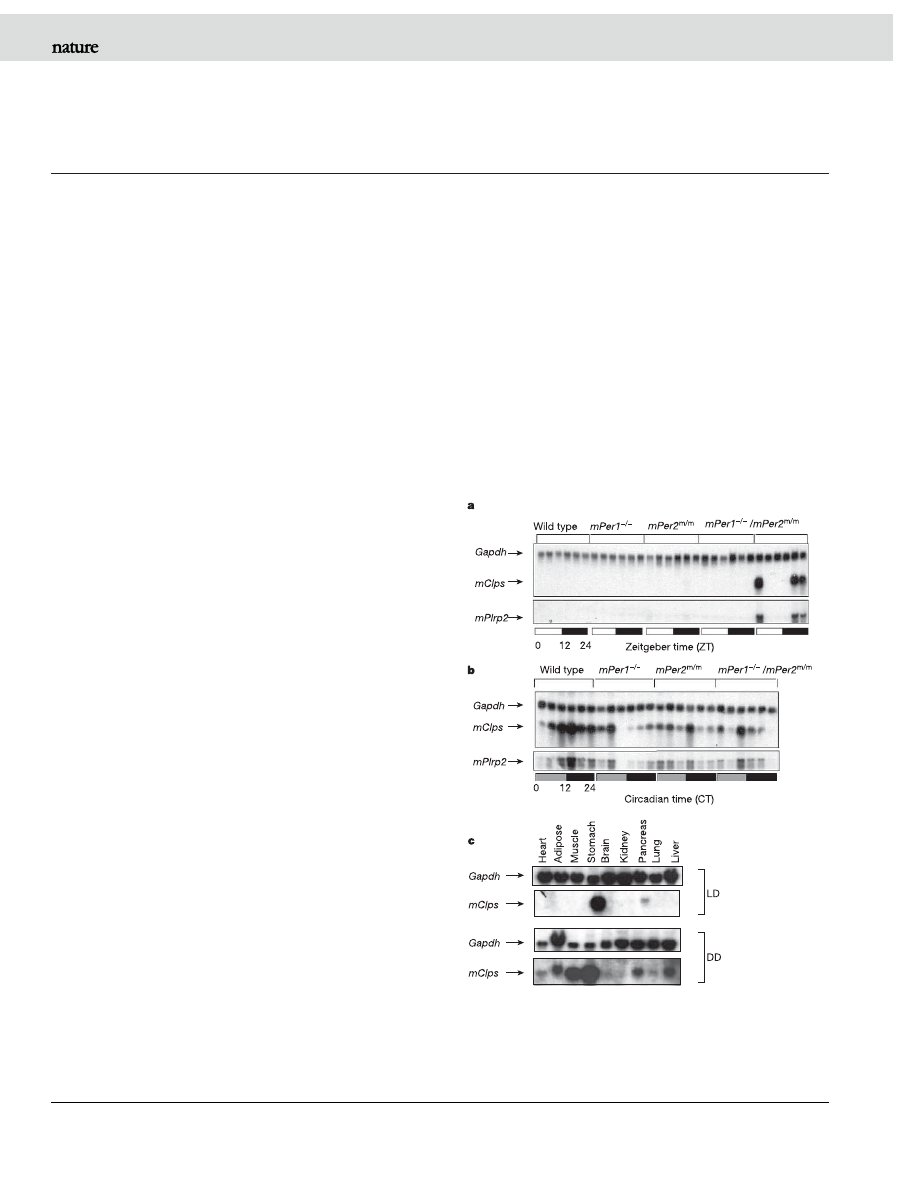
LD mice (Fig. 1a). By contrast, during
circadian time (CT), mClps expression was observed in livers from all
four genotypes of DD mice (Fig. 1b). Furthermore, mClps expression
displayed a robust circadian pattern in wild-type but not in mPer1
2
/2
,
mPer2
m/m
or mPer1
2
/2
/mPer2
m/m
DD mice. In addition, the
expression of mClps was coordinated with that of its enzymatic
partner mPlrp2 in DD mice (Fig. 1a, b). In LD mice, mClps
expression was found only in pancreas and stomach (Fig. 1c).
However, in DD mice, mClps expression was observed in all periph-
eral tissues sampled except brain and kidney (Fig. 1c). The phase of
mClps expression in peripheral organs of DD mice was similar
(Supplementary Fig. 2a). These observations raised the fundamental
question on the biological relevance of this constant-darkness-
regulated phenomenon in mammals.
To demonstrate functionality of mClps expression in liver, colipase
activity assayed with a triacylglycerol substrate ([
3
H]triolein)
11
was
observed in liver extracts from DD but not LD mice (Supplementary
Fig. 2b). Exposure to light for 5–7 h inhibited both mClps and mPlrp2
expression in liver of DD mice (Supplementary Fig. 2c). Taking these
LETTERS
Figure 1 | Northern blot analysis of mClps and mPlrp2 expression in
mice livers.
a, Expression of mClps and mPlrp2 in LD mice. Note: for
mPer1
2
/2
/mPer2
m/m
samples, the first six lanes from left to right are the
corresponding mRNAs from kidney tissues. b, Expression of mClps and
mPlrp2 in DD mice. c, Expression of mClps in various peripheral tissues
sampled at ZT12 or CT12. Gapdh mRNA, encoding glyceraldehyde-3-
phosphate dehydrogenase, was monitored as an internal control.
1
Department of Biochemistry and Molecular Biology, University of Texas Health Science Center, Houston, Texas 77030, USA.
2
Department of Biotechnology, Institute of
Molecular and Cell Biology, Tartu University, Tartu, 51010, Estonia.
*These authors contributed equally to this work.
Vol 439|19 January 2006|doi:10.1038/nature04368
340
©
2006
Nature Publishing Group
results together, we proposed that mClps expression in DD mice is
mediated by a circulatory factor that functions either as a repressor or
an activator during the LD or DD cycles, respectively. Such an
activator would induce mClps expression in LD mice but a repressor
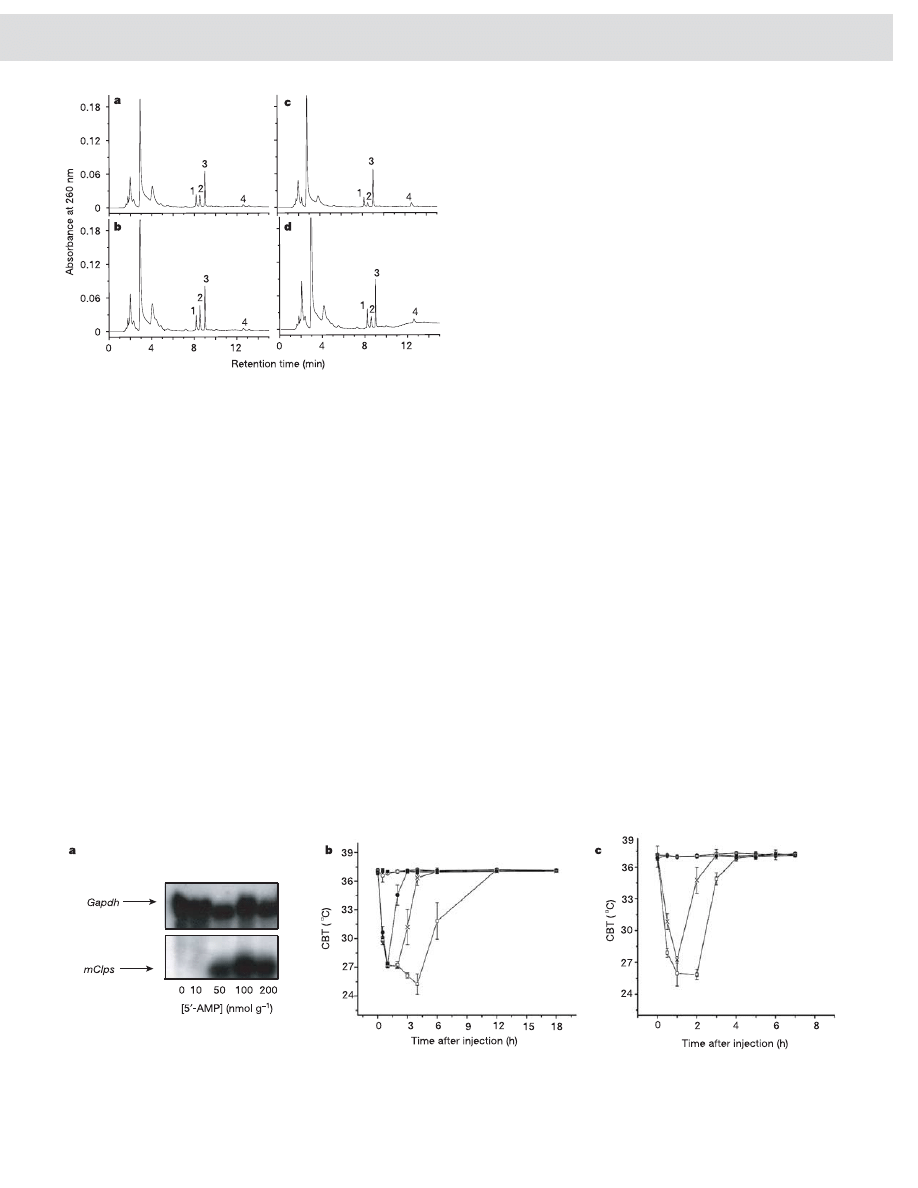
would inhibit its expression in DD animals. To identify the putative
circulatory mediator, blood extracts obtained from mice at various
ZTs and CTs were fractionated by HPLC. Excluding the unresolved
peaks in the void volume, there were four highly reproducible peaks
(labelled 1–4). One peak (no. 2) had a robust apparent diurnal and
circadian pattern in both ZT and CT samplings (Fig. 2). Our analysis
indicated that peaks 1 and 3 had no apparent diurnal pattern but that
peak 4 might have had a weak apparent circadian profile (Sup-
plementary Fig. 3a). A paired t-test analysis revealed that only peak 2
was substantially higher in DD mice than in LD mice (n ¼ 4,
P , 0.01; Supplementary Fig. 3b). Spectral scanning of peak 2
revealed a maximum absorbance at 260 nm, suggesting a nucleo-
tide-based molecule. The retention times of peaks 2 and 4 on HPLC
matched those of 5
0
-AMP and adenosine, respectively (Supplemen-
tary Fig. 4). The identity of peak 2 was confirmed with snake-venom
5
0
-nucleotidase, which degrades 5
0
-AMP (peak 2) to adenosine
(peak 4) (Supplementary Fig. 4).
To confirm 5
0
-AMP as the circulatory factor, we injected synthetic
5
0
-AMP into LD mice to test the induction of mClps expression.
Northern blot analysis showed that 5
0
-AMP induced mClps
expression in the livers of LD mice at 3.5–4 h after injection
(Fig. 3a, and Supplementary Fig. 8b). Using reverse transcriptase-
mediated polymerase chain reaction (RT–PCR), we could detect the
induction of mClps expression by 5
0
-AMP in all peripheral tissues
sampled except brain (Supplementary Fig. 5a). Ecto-5
0
-nucleotidase
anchored on the plasma membrane converts 5
0
-AMP to adenosine
extracellularly
12,13
. Adenosine receptors or nucleoside transporters
could therefore mediate the intracellular action of 5
0
-AMP. Adeno-
sine but not N-ethylcarboxamidoadenosine (NECA), an adenosine
receptor agonist, injected into LD mice induced mClps expression in
liver (Supplementary Fig. 5b, and data not shown). Dipyridamole, a
nucleoside transporter blocker
14
, prevented mClps induction by
adenosine and 5
0
-AMP (Supplementary Fig. 5c). Mice injected
with ATP, ADP or c-AMP at similar concentrations did not induce
mClps expression in liver (Supplementary Fig. 5d). Unexpectedly, LD
mice given a high dosage of 5
0
-AMP had a lower body temperature,
suggesting that the animals were in torpor. Mice are in torpor when
the core body temperature (CBT) decreases to 31 8C or below
5,6
. On
the basis of CBT measurement, torpor duration in LD mice was
dependent on the dosage of 5
0
-AMP injected (Fig. 3b). Torpor induced
by 5
0
-AMP was significantly longer in mPer1
2
/2
/mPer2
m/m
mice
than in wild-type animals (Fig. 3c). Together, these studies show that
5
0
-AMP is the circadian signal that mediates mClps expression in
peripheral organs and induces torpor in mice.
A question arising from these observations is the biological
purpose of this signalling mechanism. Perhaps this circadian signal-
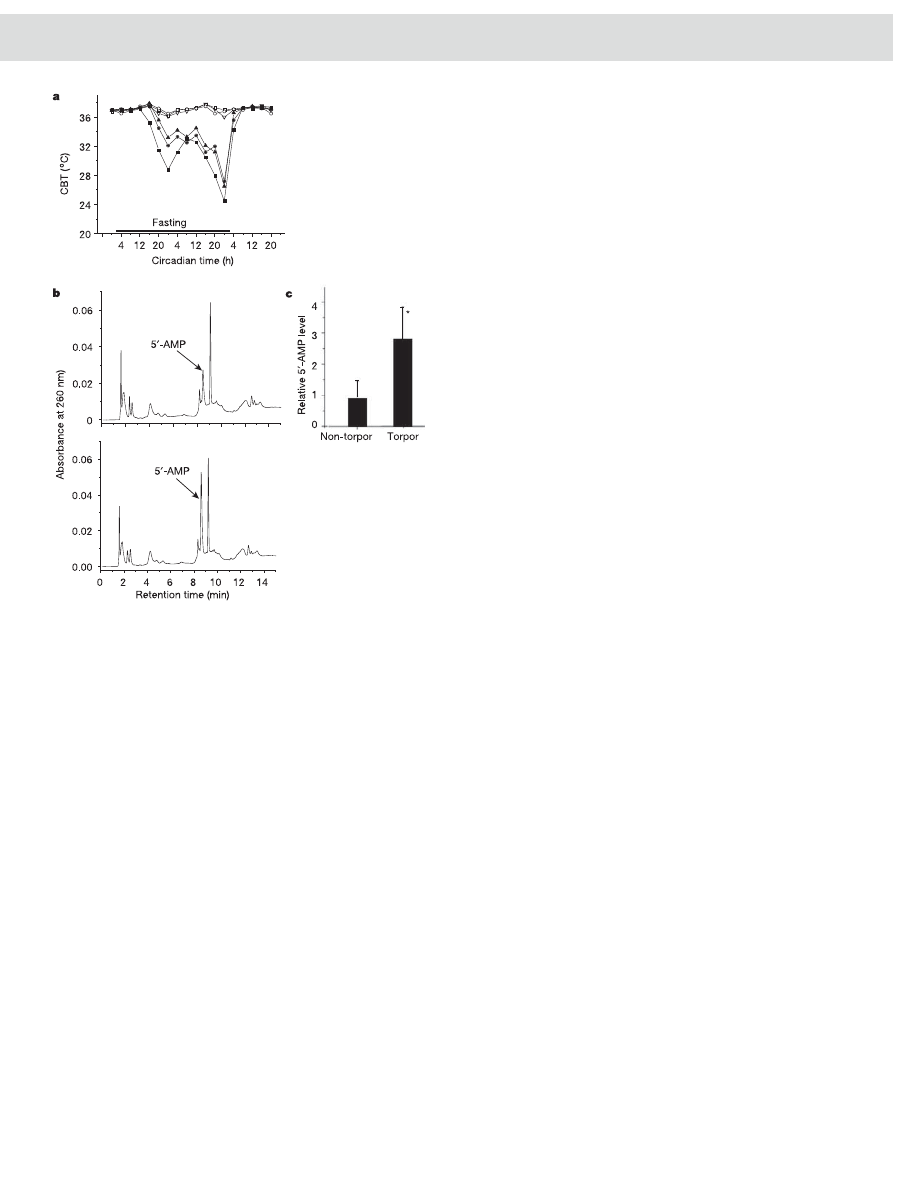
ling mechanism has a function in energy conservation. Therefore, we
compared the behaviour of DD mice fed ad libitum with that of mice
subjected to metabolic stress generated by food deprivation. CBT
sampled every 4 h revealed that all of the fasted mice displayed
spontaneous torpor by day 2, whereas the CBT of fed mice remained
at 37 8C (Fig. 4a). HPLC analysis revealed that 5
0
-AMP levels in the
blood of torpid mice were elevated compared with those of non-
torpid DD animals (t-test P , 0.05; Fig. 4b, c). Thus, under meta-
bolic stress, physiological control of 5
0
-AMP levels induces torpor in
DD mice.
Cessation of food intake and the generation of energy from fat
catabolism are hallmarks of deep torpor. The activation of mClps
expression by constant darkness is probably physiological because
murine mClps mRNA encodes a pentapeptide (VPDPR) that is
cleaved post-translationally from the procolipase enzyme. This
pentapeptide is the satiety regulator, enterostatin
15
. The DD mice
Figure 2 | Elevated concentration of a circadian-regulated circulatory
molecule in DD mice.
Representative profiles of reverse-phase HPLC
analysis of blood extracts taken from LD and DD mice at ZT4 (a), CT4 (b),
ZT16 (c) and CT16 (d). Void volume peaks with a retention time of less than
5 min are poorly resolved.
Figure 3 | 5
0
-AMP-induced mClps expression and torpor in LD mice.
a, Northern blot analysis of mClps expression in liver of wild-type mice
injected with saline or 5
0
-AMP. Gapdh levels were monitored as an
internal control. b, CBT of wild-type mice injected with saline or 5
0
-AMP.
Filled squares, saline; open circles, 0.15 mmol AMP g
2
1
; filled circles,
1.5 mmol AMP g
2
1
; crosses, 5.0 mmol AMP g
2
1
; open squares, 10.0 mmol
AMP g
2
1
. Error bars indicate s.e.m. (n ¼ 3). c, CBT of wild-type and
mPer1
2
/2
/mPer2
m/m
mice injected with saline or 5
0
-AMP.
mPer1
2
/2
/mPer2
m/m
mice: open squares, 1.5 mmol AMP g
2
1
; filled circles,
saline. Wild-type mice: crosses, 1.5 mmol AMP g
2
1
; open circles, saline. Error
bars indicate s.e.m. (n ¼ 3). We observed no apparent adverse effects on the
torpid mice after their CBT had returned to 37 8C.
NATURE|Vol 439|19 January 2006
LETTERS
341
©
2006
Nature Publishing Group
consumed less food and water than the LD animals (Supplementary
Fig. 6a and 6b), which is consistent with previous studies on rats
16
.
Correspondingly, the body weight of DD mice declined during the
period studied (Supplementary Fig. 6c). Our studies showed that
blood levels of non-esterified fatty acids of DD mice were higher than
those in LD animals (Supplementary Fig. 6d), which is consistent
with previous observations of large mammals in DD or during
denning
17,18
. Together, these studies demonstrate that the induction
of mClps expression by constant darkness accomplishes both satiety
reduction and the activation of fat catabolism.
Membrane-anchored and circadian-regulated ecto-5
0
-nucleo-
tidase controls the extracellular level and mediates the intracellular
action of 5
0
-AMP
12,13,19,20
. Northern blot analysis confirmed that
expression of the ecto-5
0
-nucleotidase gene in LD mice is regulated in
a circadian manner and is dampened in DD animals (Supplementary
Fig. 7). Ecto-5
0
-nucleotidase dephosphorylates 5
0
-AMP to adeno-
sine, which is taken into the cell by nucleoside transporters. Intra-
cellular adenosine is primarily phosphorylated to 5
0
-AMP by
adenosine kinase because its K
m
for adenosine is one or two orders
of magnitude lower than that of adenosine deaminase
19
. Four key
metabolic enzymes are regulated allosterically by 5
0
-AMP. One of
these, AMP-dependent protein kinase (AMPK), is activated by
5
0
-AMP
21
. A 5
0
-AMP analogue, 5-aminoimidazole-4-carboxamide
ribonucleoside (AICAR), increases fatty acid oxidation in rat
muscle, presumably through AMPK
22
. Another enzyme, fructose-
1,6-diphosphatase (FDP), is negatively regulated by 5
0
-AMP
23
. FDP,
the rate-limiting enzyme in gluconeogenesis, converts fructose 1,6-
diphosphate to fructose 6-phosphate. A third allosteric enzyme,
phosphofructokinase (PFK), converts fructose 6-phosphate into
fructose 1,6-diphosphate and is positively regulated by 5
0
-AMP
23
.
PFK is a rate-limiting enzyme for glycolysis. Consistent with previous
studies in rats
24
was the observation that blood glucose was lower in
DD than in LD mice (Supplementary Fig. 6e). Furthermore, acti-
vation of mClps expression by 5
0
-AMP in LD mice is reciprocally
related to blood glucose levels (Supplementary Fig. 8a, b). We
propose that when 5
0
-AMP was injected into mice, the activity of
FDP was inhibited and that of PFK was enhanced. Consequently, the
rate of gluconeogenesis was reduced but that of glycolysis was
enhanced, leading to depletion of the blood glucose pool. The
transient rise in blood glucose concentration is a first-level metabolic
response to replenish this pool. The rate-limiting enzyme glyco-
gen phosphorylase, which converts stored glycogen into glucose
1-phosphate, is another 5
0
-AMP-activated allosteric enzyme
25
.
When depletion of stored glycogen reaches a critical stage, blood
glucose levels decline. To conserve glucose necessary for brain
function (see Fig. 1c and Supplementary Fig. 5a), the primary energy
source of peripheral organs was switched from glucose to fatty acids,
as reflected by induction of mClps expression (Supplementary
Fig. 8b). Hence, 5
0
-AMP is a pivotal metabolic signal whose circu-
latory level determines the balance of the peripheral organ energy
supply between glucose, glycogen and fat (Supplementary Fig. 8c).
Consistent with this proposition, 5
0
-AMP does not activate mClps
expression in cultured cells whose primary energy source is glucose.
If such a mechanism is conserved in humans, the action of 5
0
-AMP
and its analogues could form a new class of therapeutic agents for
human obesity and insulin-resistant type-2 diabetes. The ability of
5
0
-AMP to induce torpor could be a useful tool in CBT management
during major surgery or emergency trauma response.
Last, a quirky enigma of biochemistry is the ‘futile cycle’ burning
up ATP molecules between FDP and PFK activities
23
. Because the
endogenous clock controls 5
0
-AMP levels, the ‘futile cycle’ is a
circadian metabolic rhythm.
METHODS
Animals. We used female mice aged between 8 and 10 weeks. Wild-type
(C57/Bl6), mPer1
2
/2
, mPer2
m/m
and mPer1
2
/2
/mPer2
m/m
mice were housed
in a standard animal maintenance facility under a 12 h light:12 h dark cycle
9,10
.
For 12 h dark:12 h dark (DD) studies, mice were placed inside a circadian
chamber beginning at CT12 for 48 h under constant darkness before the mice
were used for the indicated experiments. All manipulations of DD mice were
performed under a 15-W red light
26
. These studies were conducted under
institutionally approved animal protocol HSC-AWC 04-022.
Northern blot and RT–PCR analysis. Tissues were collected and frozen in liquid
nitrogen and stored at 280 8C. Total RNA was isolated from mouse livers in
accordance with standard procedures
27
. Northern blot analysis was performed as
described previously
26
. The colipase probe was the complete complementary
DNA (GenBank accession no. BC042935); the Gapdh probe was the PstI
fragment of rat Gapdh cDNA
28
. The primer pair used to measure colipase
expression was 5
0
-TTGTTCTTCTGCTTGTGTCCCT-3
0
and 5
0
-AGTCGAGGC
AGATGCCATAGTT-3
0
. The primer pair used to measure Gapdh expression as
an internal control was 5
0
-AAGCCCATCACCATCTTCCA-3
0
and 5
0
-ATGGC
ATGGACTGTGGTCAT-3
0
. A 720-base-pair probe for mPlrp2 was generated by
RT–PCR with oligonucleotides LipaseF (5
0
-CGGTTGGACCCATCGGATGC
CATG-3
0
) and LipaseR (5
0
-GAACTCTTTCCCGTCTTTACCGCG-3
0
) from
liver mRNA.
Hepatic colipase activity assay. Livers were removed from mice under ambient
light (ZT0 and ZT12) or under a 15-W red light (CT0 and CT12) and protein
extracts were prepared as described previously
8
. The samples were heated for
15 min at 65 8C to inactivate endogenous lipases. The protein content of the
extracts was determined by the bicinchoninic acid method (Pierce). The heat-
inactivated samples were assayed for the presence of colipase with [
3
H]triolein as
substrate, as described previously
11
.
HPLC analysis of adenine nucleotides. Blood was rapidly removed from mice
and frozen in liquid nitrogen. Nucleotides were extracted from frozen samples
with 0.4 M perchloric acid as described previously
29
. Blood extracts and adenine
nucleotides ATP, ADP, AMP, c-AMP and adenosine (Sigma) were separated and
Figure 4 | Torpor and blood 5
0
-AMP levels in DD mice under metabolic
stress.
a, CBT of fed (open symbols) and fasted (filled symbols) DD mice at
ambient room temperature (23 8C). b, Representative HPLC analysis of
blood extracts from a non-torpid DD mouse (top) and a torpid DD mouse
(bottom). c, Relative levels of 5
0
-AMP in torpid and non-torpid DD mice.
The average value of 5
0
-AMP levels from non-torpid mice is arbitrarily set at
1. Error bars indicate s.e.m. (n ¼ 3). Asterisk, P , 0.05 (paired t-test).
LETTERS
NATURE|Vol 439|19 January 2006
342

©
2006
Nature Publishing Group
quantified by reverse-phase HPLC (Waters, Millipore Corp.) analysis on a
Partisphere-bonded phase C
18
(reverse-phase) cartridge column at a flow rate
of 1.5 ml min
2
1
(ref. 29). The mobile phase was 0.02 M NH
4
H
2
PO
4
pH 5.1 with
a superimposed methanol gradient with the following time course: 0% for
0–4 min, 0–8% for 4–6 min, 8–20% for 6–8 min and 20% for 8–18 min.
Injection of 5
0
-AMP, adenosine, NECA and dipyridamole. The indicated
dosages of 5
0
-AMP, adenosine, NECA and dipyridamole (Sigma) were adminis-
tered to LD mice by intraperitoneal injection. NECA was administered at
0.3 nmol g
2
1
body weight. All injections took place at ZT6. After injection,
mice were maintained for the desired duration (2.5–3.0 h for adenosine or
NECA, and 3.5 h for 5
0
-AMP) and then killed. Total RNA was isolated from
liver tissue for northern blot and RT–PCR analysis. Core body temperature
(CBT) was measured at ambient room temperature (23–24 8C) with a rectal
thermometer before and after each injection.
Metabolic stress studies. Core body temperature and 5
0
-AMP levels in blood
during the fasting were measured in fed or fasted DD mice. The fasted DD mice
had their chow removed starting at CT2. Torpor was detected by CBT
measurement, and animals in torpor were either killed for blood samples or
given food at the third CT2. Food and water intakes were determined by weight
differential of fresh chow and water after every 24 h at ZT2 or CT2. Body weight
was measured at every ZT2 or CT2. Glucose and non-esterified fatty acid levels
in serum were measured with a glucose assay kit from BioAssay Systems and a
non-esterified fatty acid assay kit from Roche Applied Science, respectively.
Received 1 July; accepted 26 October 2005.
1.
Aschoff, J. Exogenous and endogenous components in circadian rhythms. Cold
Spring Harb. Symp. Quant. Biol.
25, 11–-28 (1960).
2.
Ruby, N. F., Dark, J., Heller, H. C. & Zucker, I. Ablation of suprachiasmatic
nucleus alters timing of hibernation in ground squirrels. Proc. Natl Acad. Sci.
USA
93, 9864–-9868 (1996).
3.
Heller, H. C. & Ruby, N. F. Sleep and circadian rhythms in mammalian torpor.
Annu. Rev. Physiol.
66, 275–-289 (2004).
4.
Heldmaier, G., Ortmann, S. & Elvert, R. Natural hypometabolism during
hibernation and daily torpor in mammals. Respir. Physiol. Neurobiol.
141,
317–-329 (2004).
5.
Gavrilova, O. et al. Torpor in mice is induced by both leptin-dependent and -
independent mechanisms. Proc. Natl Acad. Sci. USA
96, 14623–-14628 (1999).
6.
Overton, J. M. & Williams, T. D. Behavioral and physiologic responses to
caloric restriction in mice. Physiol. Behav.
81, 749–-754 (2004).
7.
Lowe, M. E. Molecular mechanisms of rat and human pancreatic triglyceride
lipases. J. Nutr.
127, 549–-557 (1997).
8.
D’Agostino, D. et al. Decreased postnatal survival and altered body weight
regulation in procolipase deficient mice. J. Biol. Chem.
277, 7170–-7177 (2002).
9.
Zheng, B. et al. Nonredundant roles of the mPer1 and mPer2 genes in the
mammalian circadian clock. Cell
105, 683–-694 (2001).
10. Zheng, B. et al. The mPer2 gene encodes a functional component of the
mammalian circadian clock. Nature
400, 169–-173 (1999).
11.
Lowe, M. E. in Methods in Molecular Biology: Lipase and Phospholipase
Protocols (eds Doolittle, M. H. & Reue, K.) 59–-70 (Humana, Totowa, New
Jersey, 1998).
12. Thompson, L. F., Ruedi, J. M., Glass, A., Low, M. G. & Lucas, A. H. Antibodies
to 5
0
-nucleotidase (CD73), a glycosyl-phosphatidylinositol-anchored protein,
cause human peripheral blood T cells to proliferate. J. Immunol.
143, 1815–-1821
(1989).
13. Ogata, S., Hayashi, Y., Misumi, Y. & Ikehara, Y. Membrane-anchoring domain
of rat liver 5
0
-nucleotidase: identification of the COOH-terminal serine-523
covalently attached with a glycolipid. Biochemistry
29, 7923–-7927 (1990).
14. Thorn, J. A. & Jarvis, S. M. Adenosine transporters. Gen. Pharmacol.
27,
613–-620 (1996).
15. Erlanson-Albertsson, C. & Larsson, A. The activation peptide of pancreatic
procolipase decreases food intake in rats. Regul. Pept.
22, 325–-331 (1988).
16. Stoynev, A. G. & Ikonomov, O. C. Effect of constant light and darkness on the
circadian rhythms in rats: I. Food and water intake, urine output and electrolyte
excretion. Acta Physiol. Pharmacol. Bulg.
9, 58–-64 (1983).
17. Alila-Johansson, A., Eriksson, L., Soveri, T. & Laakso, M. L. Daily and annual
variations of free fatty acid, glycerol and leptin plasma concentrations in goats
(Capra hircus) under different photoperiods. Comp. Biochem. Physiol. A Mol.
Integr. Physiol.
138, 119–-131 (2004).
18. LeBlanc, P. J. et al. Correlations of plasma lipid metabolites with hibernation
and lactation in wild black bears Ursus americanus. J. Comp. Physiol. [B]
171,
327–-334 (2001).
19. Arch, J. R. & Newsholme, E. A. Activities and some properties of
5
0
-nucleotidase, adenosine kinase and adenosine deaminase in tissues from
vertebrates and invertebrates in relation to the control of the concentration
and the physiological role of adenosine. Biochem. J.
174, 965–-977 (1978).
20. von Mayersbach, H. & Klaushofer, K. Circadian variations of 5
0
-nucleotidase
activity in rat liver. Cell. Mol. Biol. Cyto-enzymol.
24, 73–-79 (1979).
21. Lindsley, J. E. & Rutter, J. Nutrient sensing and metabolic decisions. Comp.
Biochem. Physiol. B Biochem. Mol. Biol.
139, 543–-559 (2004).
22. Kaushik, V. K. et al. Regulation of fatty acid oxidation and glucose metabolism
in rat soleus muscle: effects of AICAR. Am. J. Physiol. Endocrinol. Metab.
281,
335–-340 (2001).
23. Lehninger, A. L. Biochemistry: The Molecular Basis of Cell Structure and Function
2nd edn 623–-657 (Worth, New York, 1977).
24. Ahlersova, E., Ahlers, I., Toropila, M. & Smajda, B. Influence of light regimens
on circadian changes in the blood glucose and tissue glycogen concentration in
the rat. Physiol. Bohemoslov.
31, 57–-64 (1982).
25. Garcia-Fuentes, L., Camara-Artigas, A., Lopez-Mayorga, O. & Baron, C.
Thermodynamic characterization of 5
0
-AMP binding to bovine liver glycogen
phosphorylase a. J. Biol. Chem.
271, 27569–-27574 (1996).
26. Kaasik, K. & Lee, C. C. Reciprocal regulation of haem biosynthesis and the
circadian clock in mammals. Nature
430, 467–-471 (2004).
27. Chirgwin, J. M., Przybyla, A. E., MacDonald, R. J. & Rutter, W. J. Isolation of
biologically active ribonucleic acid from sources enriched in ribonuclease.
Biochemistry
18, 5294–-5299 (1979).
28. Fort, P. et al. Various rat adult tissues express only one major mRNA species
from the glyceraldehyde-3-phosphate-dehydrogenase multigenic family.
Nucleic Acids Res.
13, 1431–-1442 (1985).
29. Knudsen, T. B. et al. Effects of (R)-deoxycoformycin (pentostatin) on
intrauterine nucleoside catabolism and embryo viability in the pregnant mouse.
Teratology
45, 91–-103 (1992).
Supplementary Information is linked to the online version of the paper at
www.nature.com/nature.
Acknowledgements We thank J. Lever for helpful comments, and J. Volmer for
affinity-purified 5
0
-nucleotidase and pSK-5
0
NT. This work was supported in part
by an NIH grant and the UTHSC Dean’s fund to C.C.L. M.R.B. is supported in
part by NIH funding.
Author Contributions J.Z. carried out the described metabolic experiments,
characterized peak 2 as 5
0
-AMP, and demonstrated that 5
0
-AMP induces torpor
and expression of mClps in peripheral organs that is blocked by dipyridamole.
K.K. screened and identified mClps/mPlrp2 expression in liver of DD mice. M.R.B.
contributed insight into adenosine chemistry. C.C.L. conceived and directed the
work and recognized the differential temporal profiles of peak 2 in DD and LD
mice.
Author Information Reprints and permissions information is available at
npg.nature.com/reprintsandpermissions. The authors declare no competing
financial interests. Correspondence and requests for materials should be
addressed to C.C.L. (cheng.c.lee@uth.tmc.edu).
NATURE|Vol 439|19 January 2006
LETTERS
343
Wyszukiwarka
Podobne podstrony:
I LOVE YOU BUT I’VE CHOSEN DARKNESS Fear is on Our Side CDLP (Secretly Canadian) SC123sc123
Metabolizm kkw tł stud
IS LM
IS Myślenie systemowe w praktyce
Metabolizm
(2,3) Działania nieporządane, toksytczne leków Metabolizm, czynniki wpływające na działanie substanc
metabolizm witaminy D3
interpretacja IS LM
Zespół metaboliczny tarczyca wykład8
wykład 5 2 IŚ 2011
Metabolizm AA 2003 2
Komponenty metaboliczne
IS LM pelny model
Metabolizm aminokwasów
więcej podobnych podstron