
European Journal of Social Psychology
Eur. J. Soc. Psychol. 36, 315–336 (2006)
Published online 30 March 2006 in Wiley InterScience
(www.interscience.wiley.com). DOI: 10.1002/ejsp.304
Illusory and spurious correlations: Distinct phenomena or joint
outcomes of exemplar-based category learning?
THORSTEN MEISER
1
* AND MILES HEWSTONE
2
1
University of Jena, Germany
2
University of Oxford, UK
Abstract
Stereotype formation about novel groups was analyzed with trivariate stimulus distributions that were
generated by group membership, valence of behavior, and a context variable. Within this stimulus
setting, we manipulated the confounding role of the context variable and the distinctiveness of events
in terms of their relative infrequency. The experimental procedure allowed us to analyze illusory and
spurious correlations in a joint framework, to conduct focused tests for memory effects of relative
infrequency and to investigate the detection of covariations with the context variable. The results
revealed that illusory and spurious correlations were formed without enhanced memory for infrequent
events and with existing covariations of the confounding context factor being well extracted. These
observations suggest that illusory and spurious correlations can be understood without assuming
specific cognitive processes that are tied to the particular characteristics of a given stimulus
distribution, such as enhanced memory in the case of relative infrequency and neglect of a context
variable in the case of a confounding factor. Instead, computer simulations with an exemplar-based
learning model demonstrated that exemplar-based category learning may provide a coherent and
integrative theoretical framework for illusory correlations, spurious correlations and true contingency
learning in social cognition. Copyright
# 2006 John Wiley & Sons, Ltd.
The cognitive processes that are involved in the abstraction of biased group stereotypes from
information about individual group members have largely been investigated in two experimental
paradigms: the paradigm of distinctiveness-based illusory correlations (Hamilton & Gifford, 1976)
and the paradigm of spurious correlations (Schaller & O’Brien, 1992). In both paradigms, biased
group impressions arise on the basis of a series of positive and negative events concerning exemplars
of two novel groups. In the case of illusory correlations, an actual zero correlation between group
membership and valence of behavior is misjudged because both variables are skewed. In the case of
Received 30 October 2004
Copyright
# 2006 John Wiley & Sons, Ltd.
Accepted 30 June 2005
*Correspondence to: Thorsten Meiser, Department of Psychology, University of Jena, Humboldtstr. 11, D-07743 Jena, Germany.
E-mail: thorsten.meiser@uni-jena.de.
Contract/grant sponsor: Alexander von Humboldt Foundation.

spurious correlations, a confounding context factor induces perception of a correlation that contradicts
the actual relation between group membership and valence within each context.
Despite their procedural similarities, the two paradigms have thus far been treated separately, and
distinct explanations have been proposed for the empirical phenomena of illusory and spurious
correlations. The goal of the present research, in contrast, is to investigate the two phenomena in a joint
approach. In a first step, we report an experiment that tested assumptions about the cognitive processes
in the formation of illusory and spurious correlations that are based on specific characteristics of the
stimulus distributions used in either paradigm. In a second step, we demonstrate that an exemplar-
based learning account may accommodate erroneous stereotype formation across the different
paradigms as a unifying theoretical framework.
ILLUSORY CORRELATIONS
In the paradigm of distinctiveness-based illusory correlations (Hamilton & Gifford, 1976), desirable
and undesirable behavior statements are presented which refer to members of two artificial groups
labeled ‘Group A’ and ‘Group B.’ The overall ratio of statements about the target groups A and B as
well as the overall ratio of desirable and undesirable behaviors is about 2:1. Importantly, the
proportions of desirable and undesirable behaviors are constant across the two groups, yielding
complete independence of group membership and desirability. Despite the independence in the
stimulus set, participants perceive an illusory correlation inasmuch as they judge Group A, to which
the majority of statements pertain, more favorably than Group B, to which the minority of statements
pertain (see Mullen & Johnson, 1990, for a meta-analytic review). The different judgments of the
Groups A and B are indicated by trait ratings, behavior assignments, and frequency estimates.
The original explanation of illusory correlations rests on the relative infrequency of Group B and of
undesirable behaviors. It was argued that relative infrequency increases the salience of events, and that
the co-occurrence of infrequent events attracts particular attention. Because statements that relate
members of Group B to undesirable behaviors are ‘paired infrequent’, or ‘paired distinctive’, they
should be more salient than other combinations of group membership and (un-)desirability (Hamilton
& Gifford, 1976). As a consequence, these paired distinctive events should come to mind more easily
than other events, resulting in an overestimation of the co-occurrence of Group B and undesirable
behaviors in frequency judgments and group evaluations (Hamilton, 1981; Jones, Scott, Solernou,
Noble, Fiala, & Miller, 1977). The distinctiveness account of illusory correlations gained support from
studies that revealed extended processing of paired infrequent information (Stroessner, Hamilton, &
Mackie, 1992), a recall advantage of infrequent events (Hamilton, Dugan, & Trolier, 1985;
McConnell, Sherman, & Hamilton, 1994), and faster assignments of undesirable behaviors to the
minority group (Johnson & Mullen, 1994; McConnell et al., 1994).
Although several studies corroborated the distinctiveness account of illusory correlations, some of
the results have since been challenged. In particular, model-based analyses of recognition memory that
separated memory accuracy and stereotypic guessing processes did not yield support for the presumed
memory advantage for statements about the infrequent Group B or for paired distinctive events
(Fiedler, Russer, & Gramm, 1993; Klauer & Meiser, 2000; Meiser & Hewstone, 2001). These analyses
could only replicate the memory advantage for infrequent undesirable behaviors. Because undesir-
ability and relative infrequency were confounded in these studies as in the previous experiments on
illusory correlations, however, one cannot decide whether the observed memory advantage for
undesirable behaviors was due to the distinctiveness of infrequent events or to negative valence.
This question was addressed in the present study.
316
Thorsten Meiser and Miles Hewstone
Copyright
# 2006 John Wiley & Sons, Ltd.
Eur. J. Soc. Psychol. 36, 315–336 (2006)

In addition to the empirical findings that challenged the original distinctiveness account, alternative
theoretical approaches were suggested to explain illusory correlations. One of these models interprets
illusory correlation as an effect of information loss and set size in category learning (Fiedler, 1991,
1996; Sanbonmatsu, Shavitt, & Gibson, 1994). Rather than relying on differential encoding or
availability of individual statements, this account assumes that illusory correlations are driven by the
more accurate extraction of the preponderance of desirable behaviors from the larger sample of Group
A than from the smaller sample of Group B. Another theoretical approach rests on social categoriza-
tion principles and assumes that people use the valence of behaviors to differentiate between the target
groups in a search for meaning of the group distinction (Berndsen & Spears, 1997; Haslam, McGarty,
& Brown, 1996; McGarty & de la Haye, 1997; McGarty, Haslam, Turner, & Oakes, 1993). In the
present study, we investigated whether such general principles of category acquisition can accom-
modate both illusory and spurious correlations.
SPURIOUS CORRELATIONS
In a demonstration of spurious correlations in stereotype formation, Schaller and O’Brien (1992)
presented a series of statements about anagram solutions by members of two groups labeled ‘Group A’
and ‘Group B’. Each statement contained group membership, the anagram problem, and the outcome
of the trial. The anagrams differed in difficulty, as was discernible from the number of letters: Some
anagrams consisted of five letters, whereas others consisted of seven letters. For both types of
anagrams, Group A showed a higher success rate (i.e., 100% and 25%) than Group B (i.e., 75% and
0%), indicating a higher level of ability for Group A. Reflecting task difficulty, the proportion of
successful trials was lower for seven-letter anagrams than for five-letter anagrams in both groups.
Moreover, members of Group A were more likely to work on seven-letter anagrams, whereas members
of Group B were more likely to work on five-letter anagrams. Although Group A showed a higher
success rate than Group B for both easy and difficult anagrams, aggregation across problem type led to
a reversed contingency, with a higher overall success rate for Group B (i.e., 60%) than Group A (i.e.,
40%). This reversed contingency was spurious in nature, caused by the moderating role of task
difficulty for both group membership and success. The stimulus design thus contained an instance of
‘Simpson’s Paradox’ (Simpson, 1951), that is, an incompatibility between the relations of group
membership and success at the level of task difficulty and at the aggregate level (i.e., collapsed across
task difficulty).
After stimulus presentation, participants judged Group B as superior to Group A in anagram
solving ability and general verbal intelligence. In other words, a stereotype emerged that paralleled
the spurious correlation between group membership and success rate collapsed across task
difficulty. The stereotype was interpreted in terms of an incomplete statistical reasoning process
that does not take into account the confounding variable of difficulty (Schaller, 1994; Schaller &
O’Brien, 1992). According to this account, the overall covariation between group membership and
success was detected, but the moderating role of task difficulty went unnoticed because of a failure
to engage in complex reasoning strategies. This explanation was corroborated by studies which
demonstrated that explicit instructions to take task difficulty into account (Schaller, 1992b;
Schaller & O’Brien, 1992) or training in statistical reasoning with confounding factors (Schaller,
Asp, Rosell, & Heim, 1996) prompted impression formation strategies that included task difficulty
and led to less biased group judgments. Likewise, motivational concerns to avoid a negative
impression of one’s own group were shown to increase the complexity of the inference process and
to affect the resulting judgments (Schaller, 1992a).
Illusory and spurious correlations
317
Copyright
# 2006 John Wiley & Sons, Ltd.
Eur. J. Soc. Psychol. 36, 315–336 (2006)

More recent research on stereotype formation in the case of Simpson’s Paradox has indicated,
however, that participants can extract pairwise contingencies with a confounding factor and none-
theless form erroneous stereotypes reflecting spurious correlations (Fiedler, Walther, Freytag, &
Nickel, 2003; Fiedler, Walther, Freytag, & Stryczek, 2002; Meiser, 2003; Meiser & Hewstone, 2004).
Hence, other cognitive processes than simplistic reasoning may contribute to the perception of
spurious correlations. The aim of our present approach therefore was to analyze the extraction of
contingencies with the context factor in more detail and to outline a theoretical account that may
jointly accommodate true contingency learning, spurious correlations, and illusory correlations.
AN EXEMPLAR-BASED LEARNING FRAMEWORK FOR ILLUSORY AND
SPURIOUS CORRELATIONS
The procedural and empirical similarities between the paradigms of illusory and spurious correlations
in stereotype formation call for an attempt to explain the two phenomena by a set of common
principles. Moreover, the original explanations of illusory and spurious correlations, which resulted
from an isolated investigation of each phenomenon, are limited in their ability to account for the recent
findings that challenged the role of distinctiveness and simplistic reasoning. An exemplar-based
learning approach that uses common principles of parallel distributed memory models may serve as a
theoretical framework that includes illusory and spurious correlations under a joint umbrella and that
avoids paradigm-specific explanations. In particular, exemplar-based learning models do not require
enhanced memory for individual events, as is assumed by the distinctiveness account of illusory
correlations, nor a specific neglect or loss of information concerning the context factor in judgment
formation, as is assumed by the account of spurious correlations in terms of simplistic reasoning.
Parallel distributed memory models rest on two main assumptions. First, it is assumed that category
information is not represented in terms of a singular memory trace, such as a unitary prototype or
schema, but that the characteristics of the category are derived from a set of category exemplars (e.g.,
Hintzman, 1986; McClelland & Rumelhart, 1985; Rumelhart, Smolensky, McClelland, & Hinton,
1986). Because each exemplar is a noisy realization of the category and thus shows the shared
characteristics of the category members with some degree of distortion, aggregation across a
reasonable number of exemplars yields the central features of the category as a whole. The second
core assumption of parallel distributed memory models is that the memory representation of individual
category exemplars is distributed over a number of information components, or units in a connectionist
network. As a consequence, the memory traces of individual category exemplars can be conceived of
as vectors. The vectorial exemplar representation contains components that denote category member-
ship and components that reflect the features of the exemplar, including those features that are shared
by other category members. Given the suppositions of exemplar-based processing and distributed
exemplar representation, the total category information in memory can be summarized in a matrix of
information components by exemplars (see Fiedler, 1996; Hintzman, 1986). Judgment formation can
then be simulated on the basis of the stored exemplar information by probing the memory matrix with
a category name. Thus, parallel distributed memory models reflect very general processes of category
learning and categorical judgment that are not confined to particular contents or features of the
stimulus distribution.
Previous studies have shown that the biased stereotype that is obtained with the usual two-
dimensional stimulus distribution of group membership and desirability in the illusory correlation
paradigm can be produced by simulations with exemplar-based learning models using parallel
distributed memory principles (Fiedler, 1996, 2000; Smith, 1991). Here we investigated whether
318
Thorsten Meiser and Miles Hewstone
Copyright
# 2006 John Wiley & Sons, Ltd.
Eur. J. Soc. Psychol. 36, 315–336 (2006)

such learning models may provide a coherent framework for the integration of illusory correlations,
spurious correlations and true contingency learning on the basis of the more complex stimulus
distributions used in our present experiment.
OVERVIEW OF THE PRESENT RESEARCH
To summarize, illusory correlations and spurious correlations are robust phenomena that have been
demonstrated in numerous studies on stereotype formation. It has also become clear that their original
explanations rely on rather specific characteristics of the stimulus designs used in either paradigm, that
is, on a memory effect of the relative infrequency of one group and one class of behaviors in the case of
illusory correlations and on the neglect of the confounding role of the context factor in the case of
spurious correlations. To advance a more integrative view of cognitive processes in stereotype
formation, we investigated illusory correlations and spurious correlations in a joint approach.
For this purpose, we first conducted an experiment to analyze stereotype formation on the basis of
different stimulus distributions. The stimulus distributions had the same trivariate structure and were
generated by the binary variables of group membership (Group A vs. B), valence of behavior
(desirable vs. undesirable), and the context variable of town of residence (Town X vs. Y). The stimulus
distributions differed, however, with respect to distinctiveness in terms of relative infrequency and
with respect to the confounding role of the context variable. The manipulation of relative infrequency
and of the confounding role of the context factor allowed us to explore illusory and spurious
correlations within the same experimental setting and to conduct focused tests concerning the
processes that may underlie stereotype formation. In particular, the different stimulus distributions
served mutually as control conditions to test for memory effects of relative infrequency and to test for
the detection or neglect of the moderating role of a confounding context variable.
In a second step, we sought to investigate a more comprehensive and unifying perspective on biased
stereotype formation that encompasses both illusory and spurious correlations. In a simulation study,
we therefore implemented an exemplar-based learning algorithm that extended previous computer
models for the simulation of illusory correlations in the classical two-way stimulus design (Fiedler,
1996, 2000; Smith, 2000). With this implementation, we examined whether exemplar-based category
learning provides an integrative framework for biased stereotype formation in trivariate stimulus
designs that give rise to illusory and spurious correlations.
EXPERIMENT
The experiment used the two stimulus distributions in Table 1, which shows the frequencies of
desirable and undesirable behaviors among members of the Groups A and B within each of the Towns
X and Y. The distributions differ with respect to relative infrequency and with respect to the
covariations induced by town of residence. First, Distribution (a) contains twice as many desirable
as undesirable behaviors and twice as many statements about Group A as Group B. In Distribution (b),
in contrast, there are equal numbers of desirable and undesirable behaviors and equal numbers of
statements about Group A and Group B. Hence, Group B and undesirable behaviors are relatively
infrequent in Distribution (a), but not in Distribution (b). Second, the variables of the stimulus design
are completely orthogonal in Distribution (a), whereas Distribution (b) entails a pattern of covariation
that constitutes an instance of Simpson’s paradox. In Distribution (b), Group A and desirable
Illusory and spurious correlations
319
Copyright
# 2006 John Wiley & Sons, Ltd.
Eur. J. Soc. Psychol. 36, 315–336 (2006)

behaviors are more likely in Town X than Town Y, and Group B and undesirable behaviors are more
likely in Town Y than Town X. Because of the covariations of town with both group membership and
desirability, the aggregate across the two towns shows a spurious correlation that associates Group A
with a higher degree of desirability than Group B.
The
P index (Allan, 1980) can be used to elucidate the correlation between group membership
and desirability on different levels of the trivariate stimulus distribution.
P is computed by
subtracting the probability of desirable behaviors in Group B from the probability of desirable
behaviors in Group A. As a consequence,
P ¼ 0 indicates independence of group membership and
desirability, whereas
P > 0 and P < 0 indicate a correlation with a higher or lower probability of
desirable behaviors in Group A than Group B, respectively. According to the orthogonal design of
stimulus Distribution (a),
P ¼ 0 holds within the subtables for Town X and Town Y as well as in the
aggregate table collapsed across the two towns. In Distribution (b), however, a spurious correlation of
P ¼ 0:11 emerges in the aggregate table, despite P ¼ 0 within each subtable (see Table 1).
Distribution (a) should give rise to an illusory correlation in favor of Group A because of the
relative infrequency of Group B and undesirable behaviors. Distribution (b) should produce a spurious
correlation in favor of Group A because of the confounding role of town of residence. Hence, a biased
stereotype should be observed with both distributions, although different cognitive processes have
traditionally been held responsible for biased judgments in the two stimulus conditions. The joint
analysis of illusory and spurious correlations in the present experiment allowed focused tests of the
underlying processes by means of comparisons between the stimulus conditions.
In accordance with the distinctiveness account of illusory correlations, a memory advantage for the
infrequent class of undesirable behaviors has repeatedly been observed and interpreted as evidence for
the distinctiveness of rare events (Hamilton et al., 1985; McConnell et al., 1994). However, relative
infrequency was confounded with negative valence in these experiments as well as in other
experiments on illusory correlations that revealed better memory for undesirable than desirable
behaviors (Klauer & Meiser, 2000; Meiser & Hewstone, 2001). A comparison between the two
stimulus conditions of the present experiment, with relative infrequency of undesirable behaviors in
Distribution (a) but not in Distribution (b), may reveal whether the memory advantage of undesirable
behaviors is due to infrequency or whether it reflects a general negativity effect (Pratto & John, 1991;
Skowronski & Carlston, 1989) that is independent of numerical infrequency.
Concerning spurious correlations, the two stimulus conditions allow one to test whether the
confounding role of town of residence in Distribution (b) is neglected or whether judgments
are sensitive to the covariations of town with desirability and group membership. Sensitivity to the
Table 1.
Trivariate stimulus distributions with relative infrequency and Simpson’s Paradox
Town X
Town Y
Aggregate
Behaviors
Group A
Group B
Group A
Group B
Group A
Group B
Distribution (a): Relative infrequency
Desirable
16
8
8
4
24
12
Undesirable
8
4
4
2
12
6
P ¼ 0
P ¼ 0
P ¼ 0
Distribution (b): Simpson’s Paradox
Desirable
12
6
3
6
15
12
Undesirable
6
3
6
12
12
15
P ¼ 0
P ¼ 0
P ¼ 0:11
Note:
P ¼ p(desirable behavior | Group A)—p(desirable behavior | Group B).
320
Thorsten Meiser and Miles Hewstone
Copyright
# 2006 John Wiley & Sons, Ltd.
Eur. J. Soc. Psychol. 36, 315–336 (2006)

covariations of the confounding factor would be reflected by a stronger evaluative differentiation
between Town X and Town Y on the basis of Distribution (b) than Distribution (a), and by
overproportional assignments of statements to the combinations of Group A with Town X and Group
B with Town Y on the basis of Distribution (b) relative to Distribution (a).
The present experiment thus extends earlier studies on memory effects of infrequency and on the
neglect of confounding factors by using different stimulus distributions that can mutually be taken as
control conditions for numerical infrequency and for the confounding role of the context variable,
respectively.
Method
Participants
Participants were 70 students from various departments of a British University who were paid £3 for
their participation. They were randomly assigned to one of two stimulus conditions: 35 participants
were presented with stimulus Distribution (a), and the remaining 35 participants with Distribution (b).
Procedure
For each participant, 54 target behaviors were randomly drawn from a pool of moderately desirable
and moderately undesirable behaviors (see Meiser & Hewstone, 2001, for details). During the
presentation phase, the behaviors were displayed as sentences that contained different male first
names, membership of Group A or B and residence in Town X or Y according to Table 1. The stimulus
sentences were presented in random order on a computer monitor. Each sentence appeared for 8.5
seconds, followed by a 1.5 second pause. The participants were informed that the experiment
concerned memory for information about individuals and their behaviors, and they were instructed
to read each of the sentences carefully.
After the presentation phase, different dependent measures were assessed. The first task consisted
of trait ratings, in which the four combinations of Group A and Group B with Town X and Town Y
were rated with respect to ten traits. The trait adjectives were selected on the basis of a scale analysis
by Rosenberg, Nelson, and Vivekananthan (1968) and included five positive traits (e.g., ‘sociable’) and
five negative traits (e.g., ‘unreliable’). For each combination of group and town, participants had to
chose a value on a 10-point rating scale ranging from 0 (i.e., the trait ‘does not apply at all’) to 9 (i.e.,
the trait ‘applies completely’).
The second task was an assignment task, in which the 54 target behaviors were presented in
random sequence with 54 new distractor behaviors. The distractor behaviors were drawn from the
same pool and included the same numbers of desirable and undesirable items as the target
behaviors. For each behavior, participants had to decide in a first step whether the behavior had
been displayed during the presentation phase (response ‘old’) or not (response ‘new’). If a behavior
was classified as ‘old,’ participants had to decide in a second step whether the behavior referred to
an individual in Town X or Town Y, and in a third step whether it referred to a member of Group A
or Group B.
The third task required estimations of the numbers of undesirable behaviors that had been presented
about the four combinations of the Groups A and B with the Towns X and Y. For this purpose, the total
number of statements about each combination was displayed, and participants had to estimate how
many of these statements contained undesirable behaviors.
Illusory and spurious correlations
321
Copyright
# 2006 John Wiley & Sons, Ltd.
Eur. J. Soc. Psychol. 36, 315–336 (2006)

Results
Trait Ratings
Rating scores were computed by reversing the ratings on negative traits and averaging across the ten
traits. Table 2 displays the mean rating scores for each combination of group membership and town of
residence. A 2 (stimulus condition: Distribution (a) vs. Distribution (b))
2 (group: Group A vs.
Group B)
2 (town: Town X vs. Town Y) mixed-model analysis of variance (ANOVA) with repeated
measures on the last two factors revealed significant main effects of stimulus condition,
F(1, 68)
¼ 4.23, p ¼ 0.044, group, F(1, 68) ¼ 7.17, p ¼ 0.009, and town, F(1, 68) ¼ 17.79, p < 0.001.
As can be seen in Table 2, Group A received more positive ratings than Group B, which reflects the
expected stereotype in favor of Group A. The effect of group was not moderated by an interaction with
stimulus condition, F
< 1, so that the strength of the resulting stereotype did not differ between the
stimulus Distributions (a) and (b). The interaction between town and stimulus condition, however,
approached significance, F(1, 68)
¼ 3.48, p ¼ 0.067. The interaction between group and town and the
higher order interaction were not significant, both F
< 1.
To explore the interaction between town and stimulus condition further, simple effects analyses
were conducted for each condition. The analyses revealed that Town X was rated much more
positively than Town Y on the basis of Distribution (b), F(1, 34)
¼ 15.47, p < 0.001, whereas the
difference between the two towns was only marginally significant for Distribution (a), F(1, 34)
¼ 3.44,
p
¼ 0.072. While the marginal effect of town within stimulus condition (a) may reflect an illusory
correlation between town and desirability, the significantly stronger evaluative differentiation between
Town X and Town Y after presentation of Distribution (b) than Distribution (a) indicates that the actual
contingency between town and desirability was extracted from stimulus Distribution (b).
1
Table 2.
Mean trait rating scores and estimated proportions of undesirable behaviors
Town X
Town Y
Group A
Group B
Group A
Group B
Stimulus condition
M
SD
M
SD
M
SD
M
SD
Trait rating scores
Distribution (a)
5.65
1.10
4.67
1.18
5.09
1.20
4.57
1.19
Distribution (b)
5.39
1.44
5.03
1.25
4.55
1.05
4.17
1.56
Estimated proportions of undesirable behaviors
Distribution (a)
0.37
0.19
0.57
0.21
0.40
0.21
0.55
0.24
Distribution (b)
0.39
0.20
0.42
0.20
0.53
0.24
0.58
0.19
Note: Higher trait rating scores indicate more positive evaluations. Higher proportions of undesirable behaviors indicate more
negative evaluations.
1
The interaction between town and stimulus condition also provides an interpretation for the main effect of stimulus condition.
As can be seen in Table 1, Town X is characterized by 67% desirable behaviors in both stimulus distributions, whereas Town Y is
characterized by 67% desirable behaviors in Distribution (a) but only 33% desirable behaviors in Distribution (b). Accordingly,
it may be expected that judgments of Town X are very similar for both stimulus conditions and that judgments of Town Y differ
across conditions. This expectation was confirmed by simple effects analyses of the ratings for each of the towns. While ratings
of Town X did not differ between stimulus conditions, F
< 1, ratings for Town Y were more positive on the basis of
Distribution (a) than Distribution (b), F(1, 68)
¼ 8.08, p ¼ 0.006. The effect of stimulus condition was thus limited to the
ratings of Town Y.
322
Thorsten Meiser and Miles Hewstone
Copyright
# 2006 John Wiley & Sons, Ltd.
Eur. J. Soc. Psychol. 36, 315–336 (2006)

Estimated Proportions of Undesirable Behaviors
Estimated proportions were computed by dividing the estimated numbers of undesirable behaviors by
the total number of statements presented about each combination of group membership and town of
residence. The mean estimated proportions are reported in Table 2. The ANOVA yielded significant
main effects of group, F(1, 68)
¼ 17.64, p < 0.001, and town, F(1, 68) ¼ 9.37, p ¼ 0.003. The effects
indicate that lower proportions of undesirable behaviors were estimated for Group A than Group B and
for Town X than Town Y. The main effect of stimulus condition did not attain significance, F
< 1, but
condition was involved in interactions with group, F(1, 68)
¼ 6.61, p ¼ 0.012, and town,
F(1, 68)
¼ 8.29, p ¼ 0.005. There was no interaction between group and town, nor a higher order
interaction, both F
< 1.
Simple effects analyses of the interaction between group and stimulus condition revealed that the
estimated proportion of undesirable behaviors was lower for Group A than Group B on the basis of
stimulus Distribution (a), F(1, 34)
¼ 32.28, p < 0.001, but not on the basis of Distribution (b),
F(1, 34)
¼ 1.03, p ¼ 0.317. Thus, the expected stereotype in favor of Group A was evident for
Distribution (a), but it failed to reach significance for Distribution (b). While the significant effect
of target group within stimulus condition (a) reflects the illusory correlation effect, the reasons for the
failure to obtain a significant spurious correlation effect in condition (b) of the present experiment are
not clear. Simple effects analyses of the interaction between town and stimulus condition yielded
significantly lower estimates of undesirable behaviors for Town X than Town Y on the basis of
Distribution (b), F(1, 34)
¼ 19.66, p < 0.001, but not on the basis of Distribution (a), F < 1. The
interaction thereby indicates a stronger evaluative differentiation between Town X and Town Y after
presentation of Distribution (b) than Distribution (a). This result suggests that the actual covariation
between town and desirability in Distribution (b) was perceived and used to differentiate between the
two towns.
Assignment Task
Assignment frequencies were computed from the responses to desirable and undesirable target and
distractor behaviors in the assignment task of the two stimulus conditions. There were target items
from the four combinations of Town X and Town Y with Group A and Group B, and there were new
distractor items. Likewise, there were five response alternatives for each test item, namely assignment
to one of the four combinations of town and group and the response ‘new.’ The cell frequencies in the
resulting 5 (item type)
5 (response category) tables for desirable and undesirable behaviors were
analyzed with a multinomial source monitoring model that provides measures of recognition memory,
source memory for two dimensions of context information, and guessing rates on various stages of the
assignment task (Meiser, 2005; Meiser & Bro¨der, 2002).
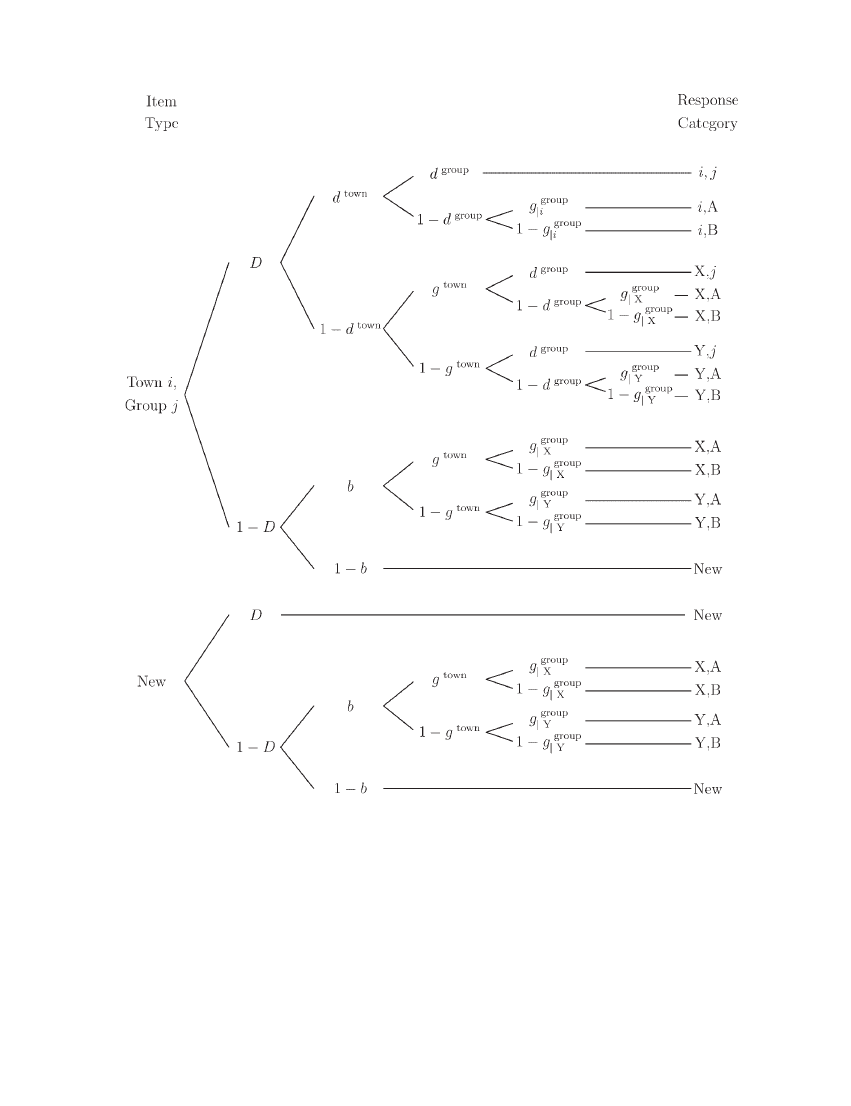
The multinomial source monitoring model is illustrated in Figure 1. Each branch in the figure
represents a combination of cognitive states which are evoked by a given test item and which jointly
lead to an observable response. The various cognitive states are specified by model parameters. The
parameter D denotes recognition memory for the behaviors, the parameters d
town
and d
group
denote
source memory for the town and group context of the behaviors, b reflects the guessing tendency to
classify items as old, and g
town
, g
group
jX
and g
group
jY
specify guessing rates in the assignment of behaviors
to the towns and groups. Table 3 provides the exact definitions of the model parameters.
The measurement model in Figure 1 allows an in-depth analysis of episodic memory and
reconstructive guessing processes in stereotype formation. For this purpose, separate sets of model
parameters were specified for the responses to desirable and undesirable behaviors in each stimulus
Illusory and spurious correlations
323
Copyright
# 2006 John Wiley & Sons, Ltd.
Eur. J. Soc. Psychol. 36, 315–336 (2006)
condition. To test the overall goodness of model fit, we used the likelihood ratio statistic G
2
which
asymptotically approaches a
2
distribution (Batchelder & Riefer, 1999). The model showed an
excellent fit to the empirical frequency data, G
2
ð52Þ ¼ 44:29, p ¼ 0.768, and could thus be maintained
as a valid model of the cognitive processes in the assignment task. Table 4 shows the estimates of the
Figure 1.
Processing tree diagram of the multinomial source monitoring model. Town i
2 fX; Yg, Group
j
2 fA; Bg. The model parameters are described in Table 3. Adapted from ‘Memory for Multidimensional Source
Information’ by T. Meiser and A. Bro¨der, 2002, Journal of Experimental Psychology: Learning, Memory, and
Cognition, 28, pp. 116–137
324
Thorsten Meiser and Miles Hewstone
Copyright
# 2006 John Wiley & Sons, Ltd.
Eur. J. Soc. Psychol. 36, 315–336 (2006)

model parameters. To compare the model parameters between the stimulus conditions and between the
assignment of desirable and undesirable behaviors, we used the conditional likelihood ratio statistic
G
2
, which follows a
2
distribution with one degree of freedom (Batchelder & Riefer, 1999).
The right-hand column of Table 4 shows the results of pairwise parameter comparisons between the
stimulus conditions. Parameter estimates that differ significantly between responses to desirable
versus undesirable behaviors are marked by an asterisk.
Concerning memory performance for the different kinds of stimuli, recognition memory D was
significantly better for undesirable than desirable behaviors. This memory advantage for undesirable
behaviors was found for both stimulus distributions, and there were no differences in recognition
memory between stimulus conditions either for desirable or undesirable items. The data thus revealed
a memory advantage for undesirable behaviors that was equal for Distribution (a), in which
undesirable behaviors were infrequent, and Distribution (b), in which no kind of information was
Table 3.
Model parameters in the multinomial source monitoring model
Parameter
Definition
D
Probability of recognizing target behaviors as old and distractor behaviors as new
d
town
Probability of remembering the town origin of a recognized target behavior
d
group
Probability of remembering the group origin of a recognized target behavior
b
Probability of guessing that a nonrecognized behavior is old
g
town
Probability of guessing that a behavior referred to Town X
g
group
jX
Probability of guessing that a behavior referred to Group A given assignment to Town X
g
group
jY
Probability of guessing that a behavior referred to Group A given assignment to Town Y
Table 4.
Parameter estimates, 95% confidence intervals (CI), and tests for equality of parameters in the source
monitoring model
Distribution (a)
Distribution (b)
Parameter
Estimate
CI
Estimate
CI
G
2
ð1Þ
p
Desirable behaviors
D
0.35*
(0.31, 0.38)
0.38*
(0.34, 0.42)
1.11
0.292
b
0.34*
(0.31, 0.37)
0.32
(0.29, 0.35)
0.53
0.468
d
town
0.00
(
0.12, 0.12)
0.06
(
0.07, 0.19)
0.59
0.442
d
group
0.10
(
0.03, 0.22)
0.00
(
0.13, 0.13)
1.35
0.245
g
town
0.48
(0.44, 0.51)
0.59*
(0.55, 0.63)
19.89
< 0.001
g
group
jX
0.55*
(0.50, 0.60)
0.62*
(0.57, 0.66)
3.69
0.055
g
group
jY
0.59*
(0.54, 0.63)
0.52*
(0.47, 0.58)
2.68
0.101
Undesirable behaviors
D
0.55*
(0.51, 0.60)
0.55*
(0.52, 0.59)
0.00
0.986
b
0.27*
(0.23, 0.32)
0.32
(0.28, 0.36)
2.37
0.123
d
town
0.00
(
0.12, 0.12)
0.00
(
0.10, 0.10)
0.00
0.999
d
group
0.01
(
0.11, 0.13)
0.08
(
0.01, 0.18)
0.83
0.361
g
town
0.50
(0.45, 0.55)
0.41*
(0.38, 0.45)
8.31
0.004
g
group
jX
0.38*
(0.32, 0.45)
0.45*
(0.40, 0.51)
2.63
0.105
g
group
jY
0.49*
(0.43, 0.56)
0.41*
(0.37, 0.46)
3.59
0.058
Note: The values of the conditional likelihood ratio statistic
G
2
ð1Þ refer to tests for equality of model parameters between
stimulus conditions. Model parameters that differ significantly between responses to desirable and undesirable behaviors are
marked with an asterisk, all
G
2
ð1Þ > 3:84, p < 0.05.
Illusory and spurious correlations
325
Copyright
# 2006 John Wiley & Sons, Ltd.
Eur. J. Soc. Psychol. 36, 315–336 (2006)

infrequent. The observed memory advantage for undesirable behaviors therefore cannot be caused by
the distinctiveness of infrequent events. Instead, it appears to reflect a general negativity effect, such as
enhanced processing and retention of negative information independent of infrequency (Pratto & John,
1991; Skowronski & Carlston, 1989).
2
Unlike recognition performance, source memory for the town and group origin of target behaviors,
d
town
and d
group
, was consistently low. In line with previous results (Meiser & Hewstone, 2001), all
source memory parameters were close to zero (see parameter estimates and confidence intervals in
Table 4). There were no differences in source memory performance for desirable and undesirable
behaviors or between stimulus conditions.
3
Turning to the guessing parameters, earlier research showed that guessing processes in source
attributions reflect perceived contingencies between behavioral characteristics and social categories
(Bayen, Nakamura, Dupuis, & Yang, 2000; Klauer & Meiser, 2000; Meiser, 2003; Meiser &
Hewstone, 2004; Wegener & Klauer, 2004). In line with this reasoning, the guessing parameter for
the attribution of behaviors to Town X versus Y, g
town
, showed a pattern that resembled the true
existence or nonexistence of a contingency between town and desirability. For Distribution (a), g
town
did not differ between desirable and undesirable behaviors. For Distribution (b), in contrast, g
town
was
significantly larger for desirable than undesirable behaviors, indicating that desirable behaviors were
more likely to be attributed to Town X than were undesirable behaviors. Moreover, comparisons
between stimulus conditions revealed that g
town
was smaller for Distribution (a) than Distribution (b)
in the case of desirable behaviors and that the opposite difference emerged in the case of undesirable
behaviors. Together, the effects indicate that desirability was effectively used as a cue for town
assignments on the basis of Distribution (b) but not Distribution (a), corresponding to the true relations
between town and desirability in the stimuli. These findings match the results of the trait ratings and
frequency estimates in revealing that the confounding role of town of residence in Distribution (b) was
perceived and taken into account.
The guessing parameters for the attribution of behaviors to Group A versus B, g
group
jX
and g
group
jY
,
indicated the expected group stereotype in favor of Group A. The parameters g
group
jX
and g
group
jY
were
significantly larger for desirable than undesirable behaviors in both stimulus conditions. These results
show that desirable behaviors were consistently more likely to be attributed to Group A than were
undesirable behaviors, irrespective of their prior assignment to Town X or Town Y and irrespective of
2
Additional tests of recognition performance D were carried out to analyze whether recognition memory varied as a function of
the town or group origin of target behaviors. The tests showed no differences in D between the four combinations of town and
group for desirable or undesirable items in the two stimulus conditions, all
G
2
ð3Þ < 4:45, p > 0.217. These results also imply
that the relative infrequency of Group B and Town Y in Distribution (a) had no effects on recognition performance. The
findings of the multinomial model were confirmed by a conventional signal detection analysis of recognition performance
(see Snodgrass & Corwin, 1988). The index of memory accuracy d
0
was derived from the hit and false alarm rates in the
assignment task. A 2 (stimulus condition)
2 (town) 2 (group) 2 (desirability) ANOVA with repeated measures on
the last three factors revealed significantly higher values of d
0
for undesirable than desirable behaviors, F(1, 68)
¼ 78.19,
p
< 0.001. Importantly, this memory advantage for undesirable behaviors was not qualified by an interaction with
stimulus condition, F
< 1, indicating that memory accuracy was not affected by the relative infrequency of undesirable
behaviors in Distribution (a). The only further effect that attained significance was the three-factor interaction of
desirability with town and stimulus condition, F(1, 68)
¼ 5.98, p ¼ 0.017. The interaction is due to the fact that the
memory advantage for undesirable items was somewhat stronger for behaviors from Town X in Distribution (a), whereas
it was somewhat stronger for behaviors from Town Y in Distribution (b). However, simple effects analyses ensured that
there was no difference in d
0
between stimulus conditions for undesirable behaviors from Town X, F(1, 68)
¼ 1.17,
p
¼ 0.283, nor for undesirable behaviors from Town Y, F < 1. Likewise, there was no difference in d
0
between stimulus
conditions for desirable behaviors from Town X or Town Y, both F
< 1.
3
Additional tests were performed to analyze whether source memory for town and group, d
town
and d
group
, varied as a
function of the actual town and group origin of target behaviors. The tests revealed no differences in source memory for
town, all
G
2
ð3Þ < 6:35; p > 0:096, or in source memory for group, all G
2
ð3Þ < 2:51; p > :474, for desirable and
undesirable items in both stimulus conditions.
326
Thorsten Meiser and Miles Hewstone
Copyright
# 2006 John Wiley & Sons, Ltd.
Eur. J. Soc. Psychol. 36, 315–336 (2006)

stimulus condition.
4
This overproportional assignment of desirable behaviors to Group A relative to
undesirable behaviors, which contradicts the actual independence of group membership and desir-
ability in each town context of the stimulus distribution (see Table 1), mirrors the erroneous preference
for Group A that was also observed in the trait ratings and frequency estimates.
Finally, the guessing parameters g
group
jX
and g
group
jY
allowed us to test for a perceived contingency
between town of residence and group membership. In particular, we expected an overproportional
assignment of behaviors to the combinations of Group A with Town X and Group B with Town Y after
presentation of stimulus Distribution (b), indicating sensitivity to the actual covariation of the towns
and groups. The comparisons of the parameter g
group
jX
between the two stimulus conditions showed that
behaviors assigned to Town X were more likely to be attributed to Group A on the basis of Distribution
(b) than Distribution (a) (see Table 4). Analogously, the comparisons of g
group
jY
showed that behaviors
assigned to Town Y were less likely to be attributed to Group A (i.e., more likely to be attributed to
Group B) on the basis of Distribution (b) than Distribution (a). Although these parameter comparisons
reached only marginal levels of significance, the parameter estimates suggest stronger associations of
Town X with Group A and Town Y with Group B after presentation of Distribution (b), reflecting the
actual degree of correlation in the stimuli.
Discussion
To summarize, a stereotype in favor of Group A was revealed by the trait ratings, the estimated
proportions of undesirable behaviors, and the guessing processes in behavior assignments. The
stereotype corresponds to an illusory correlation for stimulus Distribution (a), with relative infre-
quency of Group B and undesirable behaviors, and to a spurious correlation for Distribution (b), with a
misleading contingency between group membership and desirability in the aggregate table.
Despite the evidence of an illusory correlation on the basis of Distribution (a), there was no
indication of a memory effect of relative infrequency, which replicates and extends previous results
(Fiedler et al., 1993; Klauer & Meiser, 2000; Meiser & Hewstone, 2001). In particular, the present
experiment yielded original evidence that the memory advantage for undesirable behaviors, which
had been interpreted as support for the distinctiveness account of illusory correlations (e.g., Hamilton
et al., 1985; McConnell et al., 1994), can be traced back to a general negativity effect independent of
numerical infrequency. Because the memory advantage for undesirable behaviors was not influenced
by the infrequency manipulation, and because the infrequency of Group B in Distribution (a) did not
affect any of the memory measures, the present results add further evidence that enhanced memory for
individual items, such as negative and/or relatively infrequent events, is neither specific nor causal to
the formation of illusory correlations.
Concerning the spurious correlation on the basis of Distribution (b), the comparisons within and
across stimulus conditions showed that participants were quite sensitive to the covariations with town
4
The results and interpretations of the guessing parameters g
town
, g
group
jX
and g
group
jY
were corroborated in a traditional loglinear
analysis of source attributions for distractor items that were mistakenly judged ‘‘old’’ (i.e., false alarms). A hierarchical loglinear
analysis of the 2 (town)
2 (group) 2 (desirability) 2 (stimulus condition) table of false alarms exhibited a significant three
factor interaction of town attributions and desirability with stimulus condition, G
2
ð1Þ ¼ 5:26; p ¼ 0:022. In line with
the guessing parameter g
town
in Table 4, the loglinear three factor interaction showed that town attributions of false alarms
were stochastically dependent on desirability for Distribution (b), G
2
ð1Þ ¼ 13:97; p < 0:001, whereas town attributions were
independent of desirability for Distribution (a), G
2
ð1Þ ¼ 0:05; p ¼ 0:821. The loglinear analysis further showed that there was
no three factor interaction of group attributions and desirability with stimulus condition, G
2
ð1Þ ¼ 0:39; p ¼ 0:534. The absence
of this interaction confirms that the overproportional assignment of desirable behaviors to Group A was identical for the two
stimulus distributions, which supports the conclusions that were drawn from the results of the guessing parameters g
group
jX
and
g
group
jY
.
Illusory and spurious correlations
327
Copyright
# 2006 John Wiley & Sons, Ltd.
Eur. J. Soc. Psychol. 36, 315–336 (2006)

of residence, rather than ignoring the context factor. The pronounced evaluative differentiation
between Town X and Town Y that was obtained in all dependent measures after presentation of
Distribution (b) reflected the actual covariation between town and desirability in the stimuli.
Moreover, the guessing processes in group assignments indicated that the covariation between the
towns and groups was also discerned. Thereby, the results of the guessing parameters revealed that
participants did not give independent judgments about the two groups on the one hand and the two
towns on the other, but that they simultaneously used the covariations of the context factor with both
group membership and desirability for their responses.
The present findings question the necessity of rather specific assumptions about stereotype
formation in the case of relative infrequency and in the case of a confounding context factor,
respectively. Instead, the results encourage one to search for a common theoretical framework for
illusory and spurious correlations that does not rest on enhanced memory for rare events nor on the
neglect of a confounding context factor. As mentioned in the Introduction, general principles of
information loss (Fiedler, 1991, 1996; Sanbonmatsu et al., 1994) and social categorization (Berndsen
& Spears, 1997; McGarty & de la Haye, 1997) may provide overarching perspectives that
parsimoniously accommodate biased stereotype formation in both paradigms, and such general
principles can be captured in exemplar-based models of category learning. In the following study,
we therefore derived the implications of an exemplar-based learning algorithm concerning illusory
and spurious correlation by means of computer simulation.
SIMULATION STUDY
The results of the experiment suggest some features that a model should have if it is to explain
erroneous stereotype formation in the present experimental setting. A successful model should
account not only for biased stereotypes but also for the extraction of existing covariations with the
confounding factor. Given the extremely poor source memory for the town and group origin of all
types of behaviors and the lack of any infrequency-based memory effect, the model should not rely on
enhanced episodic memory for individual events that link a certain group to a certain kind of behavior.
Finally, an ideal model should account for erroneous stereotype formation on the basis of both
stimulus Distributions (a) and (b) in Table 1. By accommodating stereotypes that correspond to
illusory correlations and spurious correlations alike, such a model can help to overcome paradigm-
specific explanations that have largely dominated the literature so far. Here we will demonstrate that an
exemplar-based learning algorithm that adopts parallel distributed memory principles of category
acquisition can meet these criteria.
Implementation of a Modified BIAS Model
To simulate stereotype formation, we implemented a modified version of the BIAS (Brunswikian
Induction Algorithm for Social Cognition; Fiedler, 1996) algorithm.
5
Figure 2 illustrates the matrix
representation of the 54 exemplars in the stimulus distributions of Table 1. Each column of the matrix
represents the memory trace for an individual statement referring to a member of Group A or B who is
5
BIAS is an exemplar-based learning model that simulates impression formation by information aggregation. In contrast to
connectionist network models, BIAS simulates learning by adding vectors to the information matrix, rather than recalculating
connection strengths between processing nodes.
328
Thorsten Meiser and Miles Hewstone
Copyright
# 2006 John Wiley & Sons, Ltd.
Eur. J. Soc. Psychol. 36, 315–336 (2006)
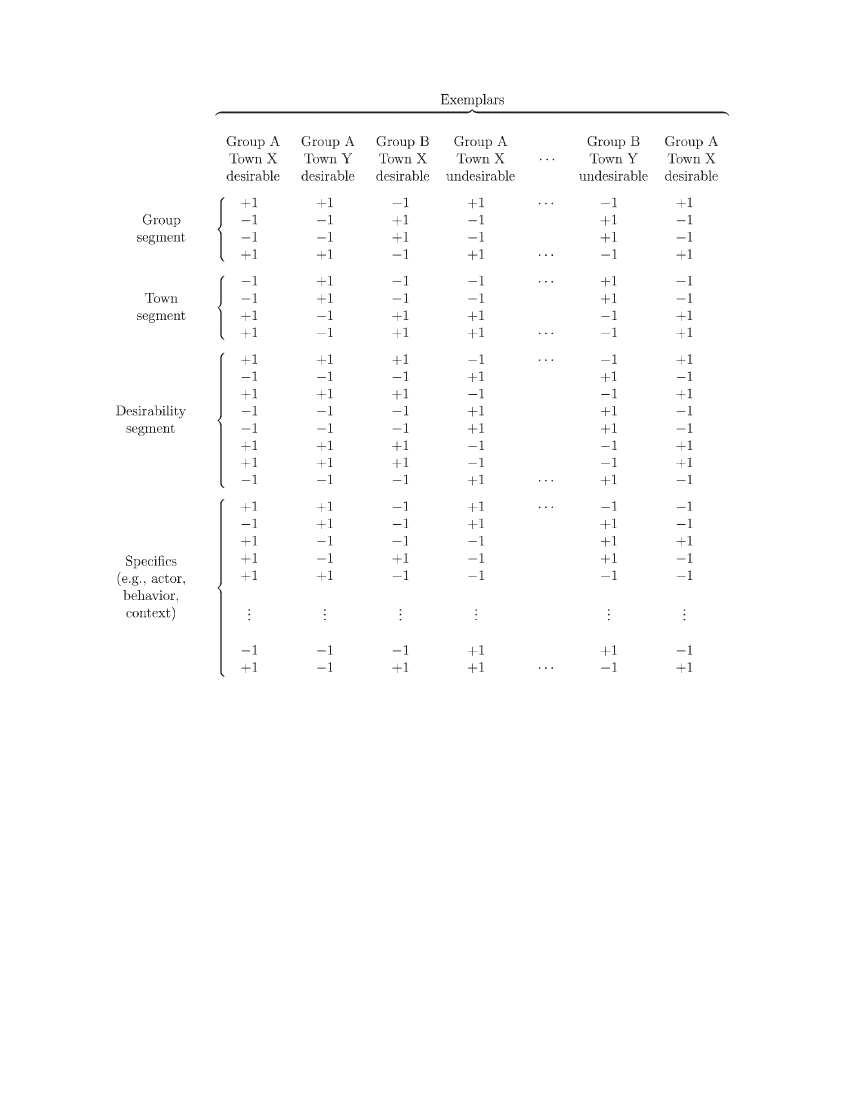
living in Town X or Y and behaves in a desirable or undesirable way. For convenience, each memory
trace consists of 30 components. Eight components denote the combination of group membership and
town of residence, another eight components indicate the desirability of the behavior, and the
remaining components represent specifics of the individual statement, such as the actor’s name,
particulars of the behavior, or any information concerning the situational context of stimulus
presentation.
The matrix in Figure 2 contains the true vectors of the 54 stimuli, that is, stimulus information
without distortion. For the following simulations, varying degrees of distortion were specified in the
memory representations of the simulated ‘participants.’ The distortion process captures various kinds
of noise and information loss, such as interpretive uncertainty regarding the stimuli, attention deficits
during encoding, memory decay, or retrieval difficulties at the time of judgment. Three distortion
Figure 2.
Matrix representation of the stimulus exemplars in the simulation model
Illusory and spurious correlations
329
Copyright
# 2006 John Wiley & Sons, Ltd.
Eur. J. Soc. Psychol. 36, 315–336 (2006)

parameters were implemented in the simulation model. The first distortion parameter concerned the
vector components of group membership, the second parameter concerned the components of town of
residence, and the third parameter concerned the components referring to the behavior information,
including desirability. The specification of different distortion processes was motivated by prevailing
evidence that memory for events can be dissociated from source memory for context information
(Bayen, Murnane, & Erdfelder, 1996; Jurica & Shimamura, 1999) and that source memory for
different context dimensions can be dissociated from each other (Meiser & Bro¨der, 2002; Meiser &
Hewstone, 2004).
The distortion parameters introduced a probabilistic and componentwise error process in the
stimulus matrix. Each component of a given vector segment was independently replaced by a random
value of
1 or þ1 with a certain probability. The three distortion parameters were varied orthogonally
in three steps. Low distortion was defined as a 25% probability that a component is replaced by a
random value. Medium distortion was defined as a 50% probability, and high distortion as a 75%
probability of replacement by a random value. Because the distortion processes affected all stimulus
vectors of the memory matrix in the same way, the simulation model did not specify enhanced memory
(i.e., reduced distortion) for any class of stimuli, such as infrequent or paired-infrequent events. By the
orthogonal variation of the degrees of distortion concerning group membership, town of residence, and
desirability, the model included information loss for all aspects of the trivariate stimuli, rather than
selective forgetting or neglect of the confounding context factor. The simulation model therefore
contained general processes of information loss and avoided specific assumptions akin to distinctive-
ness or simplistic reasoning.
Impression formation was simulated by prompting the distorted stimulus matrix with the four
composite vector segments that represented the combinations of a particular group with a particular
town. The prompting process results in an aggregate vector for a given category that reflects the central
tendency of the stored category exemplars. First, each column vector was weighted by its dot product
with the prompt vector. Since all matrix elements were either
þ1 or 1, the dot product is equal to the
number of matches minus the number of mismatches between the prompt vector and the distorted
group and town segments of the memory trace. Second, if the weight was positive, the weighted
memory trace was added to the aggregate vector of the particular combination of group and town.
Third, following aggregation across memory traces, correlations were computed between the
desirability segments of the four aggregate vectors and the ideal segment of desirable behaviors.
The correlations indicate the degree to which a given combination of group membership and town of
residence is associated with desirability in the case of a positive correlation, and with undesirability in
the case of a negative correlation.
Simulated Group Stereotypes
Simulations were run with 500 ‘participants’ for each constellation of distortion parameters. Figure 3
displays the resulting correlations with desirability for the four combinations of group membership
and town of residence on the basis of the stimulus Distributions (a) and (b).
As can be seen in Figure 3, Group A in Town X (black bars) shows higher correlations with
desirability than Group B in Town X (dark grey bars) across the two stimulus distributions and across a
wide range of distortion parameters. For Distribution (a), Group A in Town Y (light grey bars) also
shows stronger correlations with desirability than Group B in Town Y (white bars). For Distribution
(b), correlations involving Town Y are negative, which indicates associations with undesirability and
reflects the actual majority of undesirable behaviors in Town Y (see Table 1). Nonetheless, Group A in
Town Y shows less negative correlations with desirability than does Group B in Town Y. The
330
Thorsten Meiser and Miles Hewstone
Copyright
# 2006 John Wiley & Sons, Ltd.
Eur. J. Soc. Psychol. 36, 315–336 (2006)
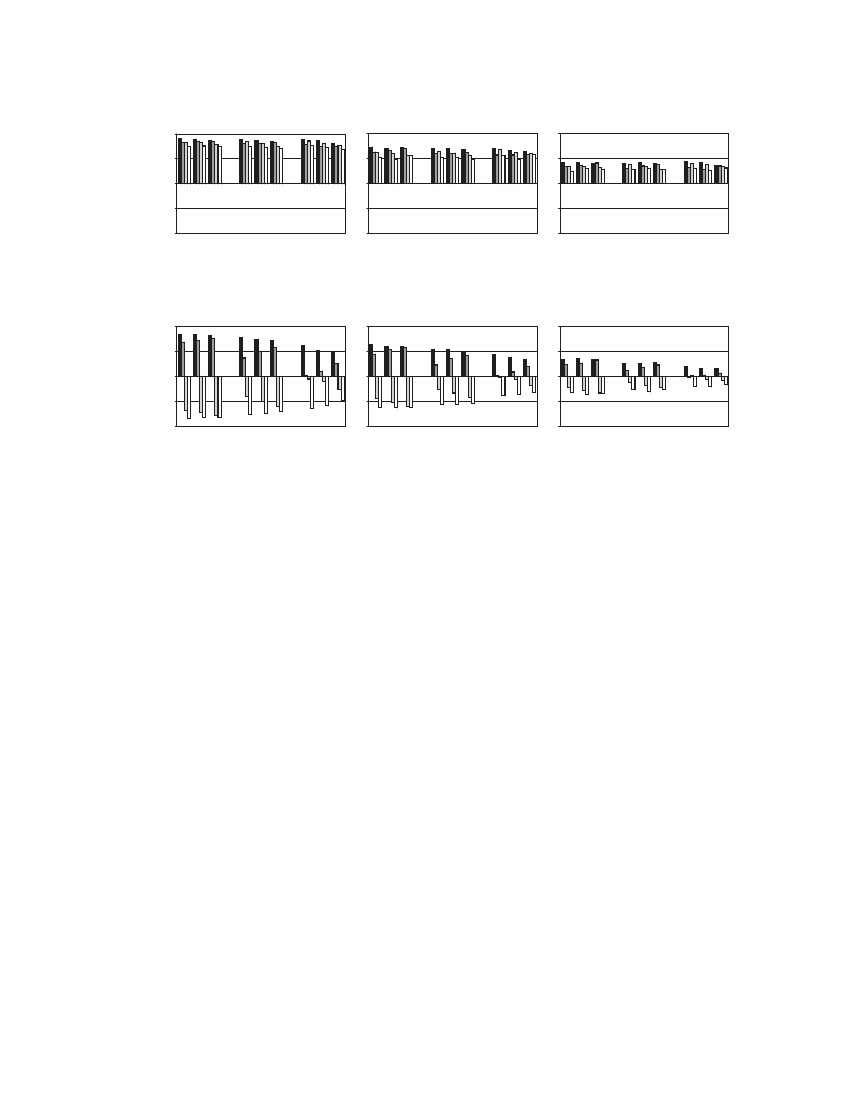
simulated judgments thereby reflect a group stereotype in favor of Group A in terms of stronger
associations with desirability and weaker associations with undesirability for Group A than Group B.
At the same time, the simulated judgments mirror the existing covariation between town and
desirability in stimulus Distribution (b) in terms of positive correlations for Town X as opposed to
negative correlations for Town Y.
Taken together, the BIAS algorithm produced stereotypes in favor of Group A corresponding to
illusory and spurious correlations, and it extracted the actual contingency between town of residence
and desirability in stimulus Distribution (b). The simulation results resemble the group stereotype and
the differential evaluations of the two towns that were observed in the previous experiment.
Importantly, biased stereotype formation was simulated on the basis of general principles of memory
storage, information loss, and aggregation over distorted category exemplars, without assuming
processes that were specifically tailored to the characteristics of either of the stimulus distributions.
Instead, the simulated group stereotypes merely reflect better extraction of the proportions of desirable
and undesirable behaviors from larger samples of distorted exemplars as compared with smaller
samples. Concerning Distribution (a), the predominance of desirable behaviors is reproduced
more accurately for Group A than Group B, because the sample of Group A members is larger
than the sample of Group B members within both towns. Concerning Distribution (b), the majority of
desirable behaviors in Town X is better extracted from the larger combination of Town X with Group
A, whereas the majority of undesirable behaviors in Town Y is better extracted from the larger
combination of Town Y with Group B. Thus, according to the exemplar-based category learning
account, the biased group stereotypes result as a natural consequence of aggregation over samples of
Stimulus Distribution (a)
-1
-0.5
0
0 .5
1
Distortion
Town:
Group:
l
m
h
l
m
h
l
m
h
l
m
h
Distortion of behavior information: low
Mea
n co
rr
el
ati
o
n
w
it
h
d
esi
ra
bi
li
ty
-1
-0.5
0
0 .5
1
l
m
h
l
m
h
l
m
h
l
m
h
Distortion of behavior information: medium
-1
-0.5
0
0 .5
1
l
m
h
l
m
h
l
m
h
l
m
h
Distortion of behavior information: high
Stimulus Distribution (b)
-1
-0.5
0
0 .5
1
Distortion
Town:
Group:
l
m
h
l
m
h
l
m
h
l
m
h
Distortion of behavior information: low
Mea
n co
rr
el
ati
o
n
w
it
h
d
esi
ra
bi
li
ty
-1
-0.5
0
0 .5
1
l
m
h
l
m
h
l
m
h
l
m
h
Distortion of behavior information: medium
-1
-0.5
0
0 .5
1
l
m
h
l
m
h
l
m
h
l
m
h
Distortion of behavior information: high
Figure 3.
Mean correlations with desirability in the computer simulations of stereotype formation for the
stimulus Distributions (a) and (b). Black bars represent Group A in Town X, dark grey bars represent Group B in
Town X, light grey bars represent Group A in Town Y, and white bars represent Group B in Town Y. ‘l’ indicates
low distortion (i.e., each component of a segment is replaced by a random value with a probability of 25%), ‘m’
indicates medium distortion (i.e., probability of 50%), and ‘h’ indicates high distortion (i.e., probability of 75%)
Illusory and spurious correlations
331
Copyright
# 2006 John Wiley & Sons, Ltd.
Eur. J. Soc. Psychol. 36, 315–336 (2006)

different size, regardless of whether the stimulus distribution contains paired infrequent stimuli or
Simpson’s Paradox.
GENERAL DISCUSSION
The present research pursued an integrative perspective on the cognitive processes underlying
erroneous stereotype formation in different experimental paradigms. Hitherto, the paradigms of
distinctiveness-based illusory correlations (Hamilton & Gifford, 1976) and spurious correlations
(Schaller & O’Brien, 1992) have been treated as distinct entities with respect to their empirical
findings and the theoretical explanations of biased stereotype formation. In a first step, we therefore
analyzed illusory and spurious correlations in a joint experimental setting by manipulating relative
infrequency and the moderating role of a context variable in a trivariate stimulus design. Although
the expected stereotype was found, there was no effect of relative infrequency on memory for the
behavioral statements or their social origin, nor did participants ignore existing covariations with a
confounding context factor. Instead, comparisons across the stimulus conditions revealed that
enhanced memory for undesirable behaviors was due to valence, rather than infrequency, and that
participants were quite accurate in extracting the moderating role of the context factor. These findings
question the necessity of cognitive processing assumptions that focus on specific features of the
stimulus distribution to explain biased stereotypes.
Concerning the original distinctiveness account of illusory correlations, the assumption of
enhanced memory for information linking members of the minority group to infrequent undesirable
behaviors was questioned by the observations that none of the memory parameters in the multinomial
model varied as a function of relative infrequency and that source memory for group membership was
consistently close to chance level (see also Klauer & Meiser, 2000; Meiser & Hewstone, 2001).
Especially, the present experiment showed that better recognition memory for undesirable than
desirable behaviors remains unchanged when undesirability is unraveled from relative infrequency.
The memory advantage of undesirable behaviors, which had previously been interpreted as evidence
for the distinctiveness of infrequent behaviors in the illusory correlation paradigm (Hamilton et al.,
1985; McConnell et al., 1994), therefore appears to reflect an effect of valence rather than infrequency.
Notwithstanding the lack of an infrequency effect on memory accuracy, however, the present results
do not rule out the possibility that distinctiveness operates via subjective memory experience, such as
perceived fluency of paired infrequent behaviors during retrieval (e.g., Stroessner & Plaks, 2001).
Future research should therefore go beyond measures of objective memory performance and include
assessments of subjective retrieval experience to investigate the role of distinctiveness.
Concerning the original account of spurious correlations in terms of incomplete statistical
reasoning, a biased stereotype was found in the present experiment, although participants proved to
be clearly sensitive to the confounding role of town of residence in stimulus Distribution (b). As shown
by the comparison between stimulus conditions, the evaluative differentiation between the two towns
reflected responsiveness to the actual covariation between town of residence and desirability, and the
behavior assignments also indicated awareness of the covariation between town of residence and
group membership. Thus, the stereotype that was observed in the stimulus condition with Simpson’s
Paradox seems not to result from an incomplete reasoning strategy of overlooking the role of the
context variable. Because the present experimental procedures differed from the procedures used in
earlier research on spurious correlations (e.g., Schaller, 1992a, 1992b; Schaller & O’Brien, 1992) in
various ways (see Meiser & Hewstone, 2004, for a detailed discussion), our conclusions are not
intended to criticize the tenability of the simplistic reasoning account for the earlier findings. Instead,
332
Thorsten Meiser and Miles Hewstone
Copyright
# 2006 John Wiley & Sons, Ltd.
Eur. J. Soc. Psychol. 36, 315–336 (2006)

our results imply that neglect of a confounding context variable is not a necessary prerequisite for
spurious correlations to be formed, although such neglect may cause spurious correlations under
different experimental conditions.
Given that the present findings did not match theoretical accounts that focus on specific
characteristics of the stimulus distributions used in the paradigms of illusory and spurious correlations,
respectively, we proposed an alternative account that accommodates stereotype formation for different
stimulus distributions on the basis of quite general processing assumptions. For this purpose, we
implemented an extension of the BIAS learning algorithm (Fiedler, 1996). The model specified an
exemplar-based and distributed representation of social information that is subject to information loss
of varying degrees. Judgments were modeled by aggregation over the stored exemplar information for
each category and by comparing the resulting aggregates with an ideal vector of desirability. Computer
simulations demonstrated that the model produces biased stereotypes corresponding to illusory and
spurious correlations together with true contingency learning with respect to the confounding context
factor. The simulation results thereby closely matched the empirical findings in our experiment on
illusory and spurious correlations. Moreover, the present simulation of a spurious correlation on the
basis of stimulus Distribution (b) generalizes a previous demonstration that a modified BIAS
algorithm can reproduce empirically observed biases in a different stimulus design with a confounding
context factor (Meiser & Hewstone, 2004). Although the BIAS model implemented here may not
account for all specific results obtained in the spurious correlation paradigm (see Meiser & Hewstone,
2004, Study 2), it accommodates the general outcomes of illusory and spurious correlation in an
integrated theoretical framework.
In the exemplar-based learning model, biased stereotypes occur as natural effects of aggregating
over different set sizes in a probabilistic, error-prone environment. Different set sizes can result from
skewed overall frequencies, as in the illusory correlation paradigm, from covariations that produce
more frequent and less frequent category combinations, as in the spurious correlation paradigm, from
biased sampling of social information, and so on. Moreover, given that most social information is not
perfectly reliable and that the capabilities of human learning and memory are limited, information loss
is an ubiquitous feature of social information processing. According to exemplar-based learning
models, the co-existence of different set sizes and information loss is sufficient to produce judgment
biases inasmuch as the true characteristics of a category are extracted more accurately from a larger
sample of noisy exemplars than from a smaller sample of noisy exemplars.
In the present modeling approach, this implication was confirmed for trivariate stimulus designs
containing an illusory correlation or a spurious correlation (see Figure 3). With respect to Distribution
(a) that produces an illusory correlation, the simulations showed better extraction of the predominance
of desirable behaviors for the larger categories involving Group A than for the smaller categories
involving Group B (see also Fiedler, 1996, 2000; Smith, 1991). With respect to Distribution (b) that
produces a spurious correlation, the simulations revealed better extraction of the true predominance of
either desirable or undesirable behaviors for the larger categories involving either Group A (i.e., in
Town X) or Group B (i.e., in Town Y). Thus, no matter whether different set sizes result from overall
infrequency or from covariations in the stimuli, the fact that categories differ in size, together with the
prevalence of information loss, proved sufficient to engender judgment biases which resembled the
illusory correlations and spurious correlations that are typically observed in human experiments.
The simulation results highlight that illusory correlations and spurious correlations may be
accounted for by common processes of exemplar-based category learning. In line with theoretical
approaches that are based on broader principles of social categorization (e.g., Berndsen & Spears,
1997; McGarty & de la Haye, 1997), behavioral valence is used to differentiate between the artificial
groups in the experimental setting, and the valence information is differentially extracted from
the categories because of their different size. The computer simulations thereby showed that the
Illusory and spurious correlations
333
Copyright
# 2006 John Wiley & Sons, Ltd.
Eur. J. Soc. Psychol. 36, 315–336 (2006)

exemplar-based learning account integrates the as yet separate phenomena of illusory and spurious
correlations. The integration of empirical phenomena into a coherent and parsimonious framework is
one of the major theoretical advantages of computer simulations in social-psychological theorizing
(Smith, 1996) that allows one to analyze basic cognitive processes which lead to seemingly different
effects in various experimental paradigms (Smith & DeCoster, 1998; van Rooy, van Overwalle,
Vanhoomissen, Labiouse, & French, 2003). In line with this notion, the empirical results of the present
experiment and the simulation results with the exemplar-based learning model suggest a joint
theoretical perspective on erroneous group stereotype formation and contingency learning in different
paradigms in terms of a common set of elementary cognitive processes that were implemented in the
exemplar-based learning algorithm.
ACKNOWLEDGMENTS
The experiment reported in this article was conducted while the first author was a Feodor Lynen
Research Fellow at Cardiff University/UK, sponsored by the Alexander von Humboldt Foundation.
The computer simulations and manuscript preparation were supported by a grant from the Deutsche
Forschungsgemeinschaft as part of a collaborative research group on ‘Discrimination and Tolerance in
Intergroup Relations’ (DFG, FOR 481/1-1,2).
REFERENCES
Allan, L. G. (1980). A note on measurement of contingency between two binary variables in judgment tasks.
Bulletin of the Psychonomic Society, 15, 147–149.
Batchelder, W. H., & Riefer, D. M. (1999). Theoretical and empirical review of multinomial process tree
modeling. Psychonomic Bulletin & Review, 6, 57–86.
Bayen, U. J., Murnane, K., & Erdfelder, E. (1996). Source discrimination, item detection, and multinomial models
of source monitoring. Journal of Experimental Psychology: Learning, Memory, and Cognition, 22, 197–215.
Bayen, U. J., Nakamura, G. V., Dupuis, S. E., & Yang, C.-L. (2000). The use of schematic knowledge about
sources in source monitoring. Memory & Cognition, 28, 480–500.
Berndsen, M., & Spears, R. (1997). Reinterpreting illusory correlation: From biased covariation to meaningful
categorisation. Swiss Journal of Psychology, 56, 127–138.
Fiedler, K. (1991). The tricky nature of skewed frequency tables: An information loss account of distinctiveness-
based illusory correlations. Journal of Personality and Social Psychology, 60, 24–36.
Fiedler, K. (1996). Explaining and simulating judgment biases as an aggregation phenomenon in probabilistic,
multiple-cue environments. Psychological Review, 103, 193–214.
Fiedler, K. (2000). Illusory correlations: A simple associative algorithm provides a convergent account of
seemingly divergent paradigms. Review of General Psychology, 4, 25–58.
Fiedler, K., Russer, S., & Gramm, K. (1993). Illusory correlations and memory performance. Journal of
Experimental Social Psychology, 29, 111–136.
Fiedler, K., Walther, E., Freytag, P., & Nickel, S. (2003). Inductive reasoning and judgment interference:
Experiments on Simpson’s paradox. Personality and Social Psychology Bulletin, 29, 14–27.
Fiedler, K., Walther, E., Freytag, P., & Stryczek, E. (2002). Playing mating games in foreign cultures: A
conceptual framework and an experimental paradigm for trivariate statistical inference. Journal of Experi-
mental Social Psychology, 38, 14–30.
Hamilton, D. L. (1981). Illusory correlation as a basis for stereotyping. In D. L. Hamilton (Ed.), Cognitive
processes in stereotyping and inter-group behavior (pp. 115–144). Hillsdale, NJ: Lawrence Erlbaum.
Hamilton, D. L., Dugan, P. M., & Trolier, T. K. (1985). The formation of stereotypic beliefs: Further evidence for
distinctiveness-based illusory correlations. Journal of Personality and Social Psychology, 48, 5–17.
334
Thorsten Meiser and Miles Hewstone
Copyright
# 2006 John Wiley & Sons, Ltd.
Eur. J. Soc. Psychol. 36, 315–336 (2006)

Hamilton, D. L., & Gifford, R. K. (1976). Illusory correlation in interpersonal perception: A cognitive basis of
stereotypic judgments. Journal of Experimental Social Psychology, 12, 392–407.
Haslam, S. A., McGarty, C., & Brown, P. M. (1996). The search for differentiated meaning is a precursor to
illusory correlation. Personality and Social Psychology Bulletin, 22, 611–619.
Hintzman, D. L. (1986). ‘Schema abstraction’ in a multiple-trace memory model. Psychological Review, 93, 411–
428.
Johnson, C., & Mullen, B. (1994). Evidence for the accessibility of paired distinctiveness in distinctiveness-based
illusory correlation in stereotyping. Personality and Social Psychology Bulletin, 20, 65–70.
Jones, R. A., Scott, J., Solernou, J., Noble, A., Fiala, J., & Miller, K. (1977). Availability and formation of
stereotypes. Perceptual and Motor Skills, 44, 631–638.
Jurica, P. J., & Shimamura, A. P. (1999). Monitoring item and source information: Evidence for a negative
generation effect in source memory. Memory & Cognition, 27, 648–656.
Klauer, K. C., & Meiser, T. (2000). A source-monitoring analysis of illusory correlations. Personality and Social
Psychology Bulletin, 26, 1074–1093.
McClelland, J. L., & Rumelhart, D. E. (1985). Distributed memory and the representation of general and specific
information. Journal of Experimental Psychology: General, 114, 159–188.
McConnell, A. R., Sherman, S. J., & Hamilton, D. L. (1994). Illusory correlation in the perception of groups: An
extension of the distinctiveness-based account. Journal of Personality and Social Psychology, 67, 414–429.
McGarty, C., & de la Haye, A.-M. (1997). Stereotype formation: Beyond illusory correlation. In R. Spears, P. J.
Oakes, N. Ellemers, & S. A. Haslam (Eds.), The social psychology of stereotyping and group life (pp. 144–170).
Oxford: Blackwell.
McGarty, C., Haslam, S. A., Turner, J. C., & Oakes, P. J. (1993). Illusory correlation as accentuation of actual
intercategory difference: Evidence for the effect with minimal stimulus information. European Journal of
Social Psychology, 23, 391–410.
Meiser, T. (2003). Effects of processing strategy on episodic memory and contingency learning in group
stereotype formation. Social Cognition, 21, 121–156.
Meiser, T. (2005). A hierarchy of multinomial models for multidimensional source monitoring. Methodology, 1,
2–17.
Meiser, T., & Bro¨der, A. (2002). Memory for multidimensional source information. Journal of Experimental
Psychology: Learning, Memory, and Cognition, 28, 116–137.
Meiser, T., & Hewstone, M. (2001). Crossed categorization effects on the formation of illusory correlations.
European Journal of Social Psychology, 31, 443–466.
Meiser, T., & Hewstone, M. (2004). Cognitive processes in stereotype formation: The role of correct contingency
learning for biased group judgments. Journal of Personality and Social Psychology, 87, 599–614.
Mullen, B., & Johnson, C. (1990). Distinctiveness-based illusory correlations and stereotyping: A meta-analytic
integration. Bristish Journal of Social Psychology, 29, 11–28.
Pratto, F., & John, O. P. (1991). Automatic vigilance: The attention-grabbing power of negative social
information. Journal of Personality and Social Psychology, 61, 380–391.
Rosenberg, S., Nelson, C., & Vivekananthan, P. S. (1968). A multidimensional approach to the structure of
personality impressions. Journal of Personality and Social Psychology, 9, 283–294.
Rumelhart, D. E., Smolensky, P., McClelland, J. L., & Hinton, G. E. (1986). Schemata and sequential thought
processes in PDP Models. In J. L. McClelland, D. E. Rumelhart, and the PDP Research Group (Eds.), Parallel
distributed processing. Explorations in the microstructure of cognition: Psychological and biological models
(Vol. 2, pp. 8–57). Cambridge, MA: MIT Press.
Sanbonmatsu, D. M., Shavitt, S., & Gibson, B. D. (1994). Salience, set size, and illusory correlation:
Making moderate assumptions about extreme targets. Journal of Personality and Social Psychology, 66,
1020–1033.
Schaller, M. (1992a). In-group favoritism and statistical reasoning in social inference: Implications for formation
and maintenance of group stereotypes. Journal of Personality and Social Psychology, 63, 61–74.
Schaller, M. (1992b). Sample size, aggregation, and statistical reasoning in social inference. Journal of
Experimental Social Psychology, 28, 65–85.
Schaller, M. (1994). The role of statistical reasoning in the formation, preservation and prevention of group
stereotypes. British Journal of Social Psychology, 33, 47–61.
Schaller, M., Asp, C. H., Rosell, M. C., & Heim, S. J. (1996). Training in statistical reasoning inhibits the
formation of erroneous group stereotypes. Personality and Social Psychology Bulletin, 22, 829–844.
Schaller, M., & O’Brien, M. (1992). ‘Intuitive analysis of covariance’ and group stereotype formation. Personality
and Social Psychology Bulletin, 18, 776–785.
Illusory and spurious correlations
335
Copyright
# 2006 John Wiley & Sons, Ltd.
Eur. J. Soc. Psychol. 36, 315–336 (2006)

Simpson, E. H. (1951). The interpretation of interaction in contingency tables. Journal of the Royal Statistical
Society, Series B, 13, 238–241.
Skowronski, J. J., & Carlston, D. E. (1989). Negativity and extremity biases in impression formation: A review of
explanations. Psychological Bulletin, 105, 131–142.
Smith, E. R. (1991). Illusory correlation in a simulated exemplar-based memory. Journal of Experimental Social
Psychology, 27, 107–123.
Smith, E. R. (1996). What do connectionism and social psychology offer each other? Journal of Personality and
Social Psychology, 70, 893–912.
Smith, E. R., & DeCoster, J. (1998). Knowledge acquisition, accessibility, and use in person perception and
stereotyping: Simulation with a recurrent connectionist network. Journal of Personality and Social Psychology,
74, 21–35.
Snodgrass, J. G., & Corwin, J. (1988). Pragmatics of measuring recognition memory: Applications to dementia
and amnesia. Journal of Experimental Psychology: General, 117, 34–50.
Stroessner, S. J., Hamilton, D. L., & Mackie, D. M. (1992). Affect and stereotyping: The effect of induced mood
on distinctiveness-based illusory correlations. Journal of Personality and Social Psychology, 62, 564–576.
Stroessner, S. J., & Plaks, J. E. (2001). Illusory correlation and stereotype formation: Tracing the arc of research
over a quarter century. In G. B. Moskowitz (Ed.), Cognitive social psychology: The Princeton symposium on the
legacy and future of social cognition (pp. 247–259). Mahwah, NJ: Lawrence Erlbaum.
van Rooy, D., van Overwalle, F., Vanhoomissen, T., Labiouse, C., & French, R. (2003). A recurrent connectionist
model of group biases. Psychological Review, 110, 536–563.
Wegener, I., & Klauer, K. C. (2004). Inter-category versus intra-category fit: When social categories match social
context. European Journal of Social Psychology, 34, 567–593.
336
Thorsten Meiser and Miles Hewstone
Copyright
# 2006 John Wiley & Sons, Ltd.
Eur. J. Soc. Psychol. 36, 315–336 (2006)

Wyszukiwarka
Podobne podstrony:
Clinical and neuropsychological correlates of proton magnetic resonance spectroscopy detected metabo
Aquino Gravitation and Electromagnetism Correlation and Grand Unification (1999)
There are many languages and cultures which are disappearing or have already disappeared from the wo
87 1237 1248 Machinability and Tool Wear During the High Speed Milling of Some Hardened
Kwiek, Marek The University and the State in Europe The Uncertain Future of the Traditional Social
Human teeth as historical biomonitors of environmental and dietary lead some lessons from isotopic s
Komissarov „Language and Culture in Translation Competitors or Collaborators”
Borderline Pathology and the Personality Assessment Inventory (PAI) An Evaluation of Criterion and
Highlights of Moshiach Based upon Talmudic, Midrashic and classical Rabbinic sources
the effect of sowing date and growth stage on the essential oil composition of three types of parsle
Baker; Tha redempttion of our Bodies The Theology of the Body and Its Consequences for Ministry in t
Bob Proctor and Joe Vitale Personal Development Abraham Hicks Law Of Attraction 7 Day Ecourse Day 2
The Application of Domestication and Foreignization Translation Strategies in English Persian Transl
Use of exponential, Page’s and diffusional models to simulate the drying kinetics of kiwi fruit
Contrasting Clients in Dialectical Behavior Therapy for BPD Marie and Dean , Two Caseswith Diffe
A Methodology to Detect and Characterize Kernel Level Rootkit Exploits Involving Redirection of the
Proposition 209 and the Affirmative Action Debate on the University of California Campuses
Ebsco Garnefdki Negative life events and depressive symptoms in late life Buffering effects of par
więcej podobnych podstron