
Use of exponential, Page’s and diffusional models to
simulate the drying kinetics of kiwi fruit
S. Simal
*
, A. Femenia, M.C. Garau, C. Rossell
o
Department of Chemistry, University of Illes Balears, Ctra. Valldemossa km. 7.5, 07071 Palma de Mallorca, Spain
Received 4 January 2004; accepted 18 March 2004
Abstract
The usefulness of three different mathematical models to simulate the drying kinetics of kiwi fruits has been evaluated: two
empirical models, the exponential and the Page models, and a diffusional model solved by the separation of variables method.
Drying characteristics of kiwi fruit were examined for average moisture contents from ca. 4.65 to 0.15 kg water/kg dm using heated
air for the temperature range of 30–90
C. Drying kinetics exhibited only one falling rate period. Air temperature affected the drying
curves decreasing the drying time of samples. The Page model provided the best simulation of the drying curves of kiwi (average
%var
¼ 99.6 ± 0.2%) whereas the exponential model provided the less satisfactory simulation (average %var ¼ 98.0 ± 1.4%).
However, only the diffusional model allowed an adequate simulation of the experiments carried out under different conditions of
temperature and sample geometry to those used in the identification of the models parameters.
2004 Elsevier Ltd. All rights reserved.
Keywords: Drying; Modelling; Simulation; Diffusional model; Empirical model; Kiwi fruit
1. Introduction
Drying is an industrial preservation method widely
used in which water activity of food is decreased to
minimise biochemical reactions of degradation (Doymaz
& Pala, 2003). In order to improve the control of this
unit operation, is important to dispose of accurate
models to simulate the drying curves under different
conditions. Depending on the applied equations, models
can be classified as theoretical, semi-empirical and
empirical models. From a strict sense, there are four
prevailing transport phenomena involved in drying
(internal and external heat transfer, and internal and
external mass transfer) which may describe the drying
process. Nevertheless, the corresponding four classical
partial differential
equations demand considerable
computing time for their numerical solution (Karath-
anos & Belessiotis, 1999).
Frequently, authors propose quite simple models to
simulate the drying curves of food that can provide
adequate representation of experimental results al-
though the parameters of these models lack of physical
sense. The most simplified model is known as the
exponential model (Eq. (1)) (Senadeera, Bhandari,
Young, & Wijesinghe, 2003)
W
W
e
W
0
W
e
¼ expðktÞ
ð1Þ
where W is the average moisture content (dry basis) at
any time, W
0
is the initial moisture content (dry basis),
W
e
is the equilibrium moisture content (dry basis), k is
the drying rate constant (s
1
) and t, the drying time (s).
Usually, this model do not provide an accurate simu-
lation of drying curves of many food products, under-
estimating the beginning of the drying curve and
overestimating the later stages (Sogi, Shivhare, Garg, &
Bawa, 2003).
To overcome the shortcomings of the exponential
model, the Page model (Eq. (2)) is applied with an
empirical modification to the time term by introducing an
exponent ‘‘n’’ (Akpinar, Midilli, & Bicer, 2003; Iguaz, San
Martın, Mat
e, Fernandez, & Vırseda, 2003). This model
has been used to accurately simulate the drying curves of
potato slices (Akpinar et al., 2003), rough rice (Iguaz
et al., 2003), green bean, potato and pea (Senadeera et al.,
2003), carrot (Doymaz, 2004), among others.
Journal of Food Engineering 66 (2005) 323–328
www.elsevier.com/locate/jfoodeng
*
Corresponding author. Tel.: +34-971-172-757; fax: +34-971-173-
426.
E-mail address:
(S. Simal).
0260-8774/$ - see front matter
2004 Elsevier Ltd. All rights reserved.
doi:10.1016/j.jfoodeng.2004.03.025

W
W
e
W
0
W
e
¼ expðkt
n
Þ
ð2Þ
Both parameters, k and n, have been correlated to
different process variables (air drying temperature and
velocity, initial moisture content, etc.) (Azzouz, Guizani,
Jomaa, & Belghith, 2002; Panchariya, Popovic, &
Sharma, 2002).
These empirical models derive a direct relationship
between average moisture content and drying time. They
neglect the fundamentals of the drying process and their
parameters have no physical meaning. Therefore, they
cannot give a clear accurate view of the important
processes occurring during drying although they may
describe the drying curve for the conditions of the
experiment process.
The mechanisms of mass transfer in foods are com-
plex. Frequently, the modelling of the drying curves
during the falling rate period is carried out by assuming
that the main mechanism is of diffusional nature.
Therefore, the diffusion coefficient estimated from
experimental results is an effective parameter that in-
cludes the effects of the known hypotheses together with
the unknown phenomena (Simal, Rossell
o, Berna, &
Mulet, 1998).
Assuming isotropic behaviour of the solid with regard
to the water diffusivity, the mass transfer process can be
defined as a function of the Fick’s law combined with
the microscopic mass transfer balance (Eq. (3)).
oW
l
ot
¼ rðD
e
rðW
l
ÞÞ
ð3Þ
When the sample volume and the diffusion coefficient
are considered constants through the drying process
(Senadeera et al., 2003), the solution of Eq. (3) can be
carried out by using the separation of variables method.
In this case, the solution in series is obtained assuming
the boundary conditions related to the thermodynamic
equilibrium and the symmetry of the solid and the initial
condition of moisture initially uniformly distributed
throughout the solid. This solution in series can be
written for an infinite slab as follows (Eq. (4)), being L
the half-thickness of the slab
W
W
e
W
0
W
e
¼ 2
X
1
v
¼1
1
ðv 1=2Þ
2
p
2
exp
ðv 1=2Þ
2
p
2
D
e
L
2
t
ð4Þ
The three-dimensional solution for a parallelepipedic
solid can be obtained as the product of three one-
dimensional expressions. It should be pointed out that
the simplicity of this diffusional model (Eq. (4)) is similar
to that of the empirical proposed models.
In order to evaluate the quality of the fit obtained by
using the mathematical models to simulate the experi-
mental results, different criterion are used in the litera-
ture,
the
coefficient
of
determination
of
linear
regressions (Karathanos & Belessiotis, 1999), the mean
relative deviation modulus (Park, Vohnikova, & Reis
Brod, 2002), the reduced v-square (Akpinar et al., 2003),
the mean square error (Iguaz et al., 2003), among others.
In this study, the percentage of explained variance was
used, being calculated by using Eq. (5) where S
y
is the
standard deviation of the experimental data and S
yx
, the
corresponding to the estimation (Rossell
o, Simal, San
Juan, & Mulet, 1997).
%var
¼ 1
"
S
2
yx
S
2
x
#
100
ð5Þ
The main objective of this study was to evaluate
alternate empirical or simple phenomenological models
reported in literature to simulate the drying curves of
kiwi fruits, and propose a simple model to accurately
simulate the drying kinetics of kiwis with different
geometries and at different drying air temperatures.
2. Materials and methods
Fresh kiwi fruits (Actinidia deliciosa cv. Hayward)
from New Zealand were purchased at a local market.
Nomenclature
D
e
effective diffusivity coefficient, m
2
/s
D
0
Arrhenius factor, m
2
/s
E
a
energy of activation, kJ/mol
k
empirical constant, s
n
L
half-thickness of the solid, m
n
empirical constant (Page model)
R
ideal gas constant, kJ/mol K
S
y
standard
deviation,
(sample)
kg/kg
dry
matter
S
yx
standard deviation, (estimation) kg/kg dry
matter
t
time, s
T
temperature,
C
W
average moisture content, kg water/kg dry
matter
W
e
equilibrium moisture content, kg water/kg
dry matter
W
i
local moisture content, kg water/kg dry
matter
W
0
initial moisture content, kg water/kg dry
matter
%var
percentage of explained variance
324
S. Simal et al. / Journal of Food Engineering 66 (2005) 323–328
Two sets of drying experiments were performed, the first
one, with kiwi fruit washed, hand peeled, cut into
10
2
m edge cubes and dehydrated with hot air at 30, 40,
50, 60, 70, 80 and 90
C, and, the second set, with kiwi
fruits washed, cut into slabs of 6
· 10
3
m of thickness
without peeling and dehydrated with hot air at 35 and
65
C.
Drying experiments with hot air were carried out in a
laboratory scale drier, operating at an air mass flux of 3
kg/m
2
s, a figure high enough to ensure that mass
transfer was controlled by the internal resistance, and
temperatures from 30 to 90
C. The drier used for
sample dehydration, described in a previous work (Si-
mal, Mulet, Tarraz
o, & Rossell
o, 1996), was equipped
with an automatic temperature controller (±0.1
C). The
air flowed perpendicular to the bed. A monolayer
loading was used (approximately, 65 g of kiwi). Water
losses were measured by weighing the basket and its
content automatically. The average ambient air char-
acteristics during hot air dehydration were: 29 ± 2
C
temperature and 36 ± 6% humidity. The samples were
dried until moisture content reached approximately 15%
dry basis. The moisture content of the dried product was
obtained by the AOAC method No. 934.06 (1990).
Experiments were carried out in triplicate.
3. Results and discussion
Samples of kiwi fruit cubes (10
2
m edge) were
dehydrated with hot air at different drying air temper-
atures (from 30 to 90
C). Drying kinetics were studied
for average moisture contents from ca. 4.65 to 0.15 kg
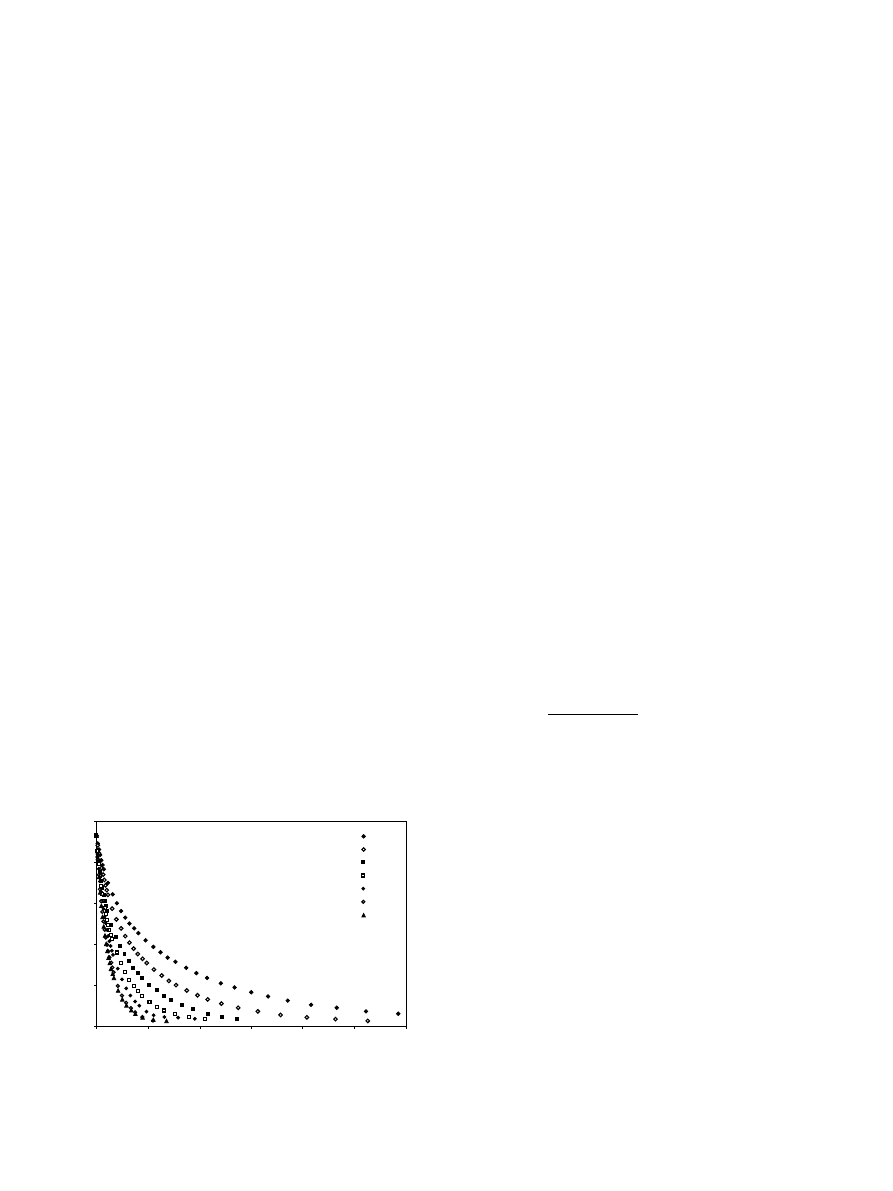
water/kg dm. Fig. 1 shows the drying curves of kiwis at
different drying air temperatures, from 30 to 90
C. As it
was expected, air temperature affected the drying curves
decreasing the drying time of samples.
A drying constant rate period was not detected in the
drying curves (Fig. 1). In fact, drying only occurred in
the falling rate period for all the temperatures investi-
gated in this study. In order to establish the proposed
models, the equilibrium moisture content was estimated
from the sorption isotherm of kiwi fruit proposed by
Simal, Femenia, C
arcel, and Rossell
o (submitted for
publication).
Experimental results of moisture variation with dry-
ing time were fitted to the proposed models, the expo-
nential model (Eq. (1)), the Page model (Eq. (2)) and the
diffusional model (Eq. (4)). By using SOLVER, an
optimization tool (GRG2 method) included in the
Microsoft Excel 2002
TM
spreadsheet, the parameters of
the different models, which provided the lowest sum of
the square differences between the experimental and the
estimated moisture values, were identified. Table 1
shows the identified figures for the parameters of Eqs.
(1), (2) and (4).
As it is shown in Table 1, in the case of the expo-
nential model, the drying rate constant k increased lin-
early with the drying air temperature (r
2
¼ 0:993). This
temperature dependence could be represented through
Eq. (6).
k
¼ 1:254 10
5
T
ðCÞ 2:452 10
4
ð6Þ
In the simulation of the black tea drying curves be-
tween 80 and 120
C by using the exponential model,
Panchariya et al. (2002) observed a temperature depen-
dence of the k parameter according to the Arrhenius
equation (Eq. (7)). However, in this study the correla-
tion coefficient decreased until 0.978 when the Arrhenius
equation was considered.
D
e
¼ D
0
exp
E
a
R
ðT þ 273:16Þ
ð7Þ
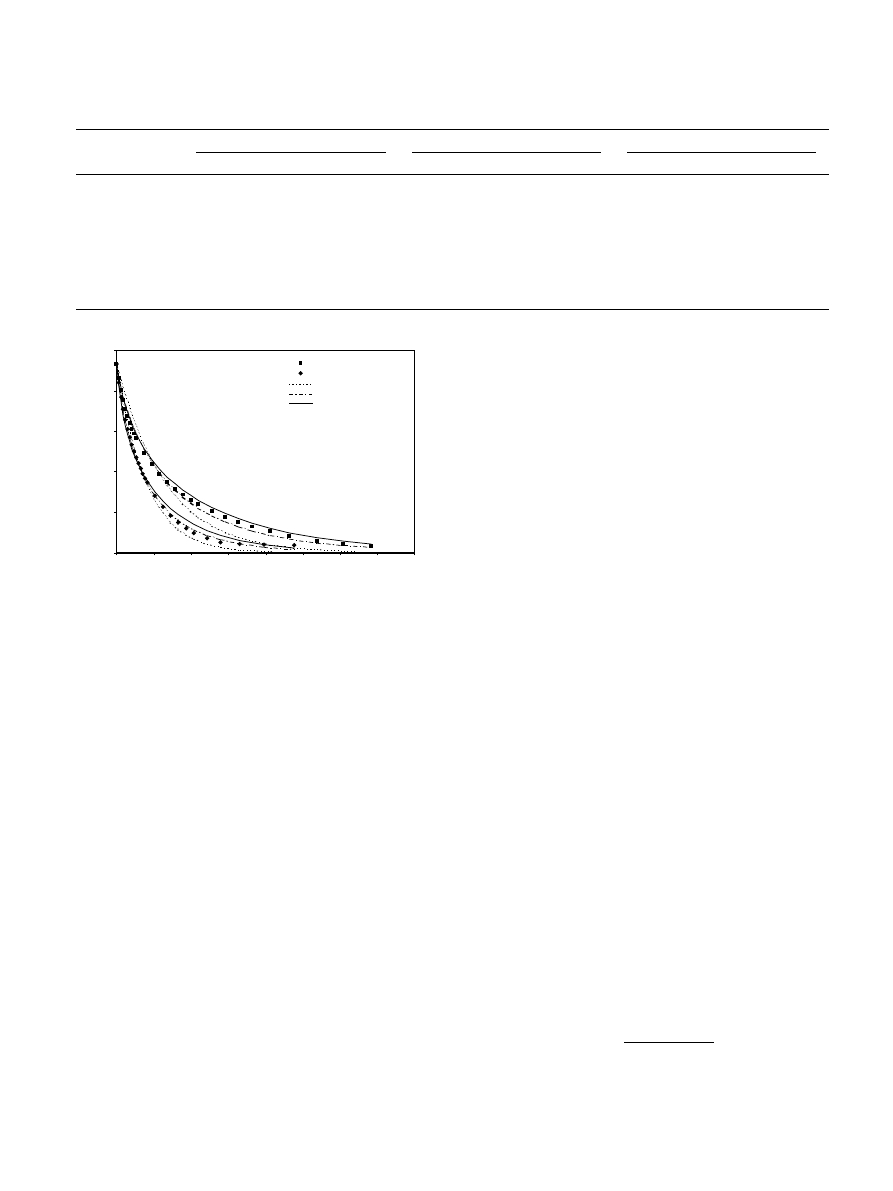
By using Eqs. (1) and (6), the drying curves of kiwi
cubes at different temperatures were simulated. As an
example, the experimental drying curves and the simu-
lation provided by the exponential model have been
represented vs. drying time in Fig. 2 for the experiments
carried out at 50 and 70
C. As can be observed in this
Figure (Fig. 2), this model allows a simple but limited
estimation of the moisture content variation of kiwi
samples during drying.
The percentage of variance explained by the model in
the simulation of the drying curves at different temper-
atures is shown in Table 1. As it can be observed, an
accurate simulation of the drying curves at higher drying
air temperatures was obtained using the exponential
model. The %var was higher than 99% in the simulation
of experiments at 70, 80 and 90
C. Nevertheless, at
lower temperatures (between 30 and 60
C), simulation
was worse, being the %var between 95 and 98%. Thus,
the average %var obtained by using the exponential
model was 98.0%.
0
1
2
3
4
5
0
5000
10000
15000
20000
25000
30000
drying time (s)
moisture content (kg/kg dm)
30ºC
40ºC
50ºC
60ºC
70ºC
80ºC
90ºC
Fig. 1. Drying kinetics of kiwi cubes at different drying air tempera-
tures, from 30 to 90
C.
S. Simal et al. / Journal of Food Engineering 66 (2005) 323–328
325
The identified parameters k and n of the Page model
are also shown in Table 1. The estimated figure for the n
parameter of the Page model did not exhibited temper-
ature dependence being considered as a constant
parameter (n
¼ 0:796). Senadeera et al. (2003) also
concluded that n was constant with the drying air tem-
perature when the drying curves of bean, potato and pea
were simulated through the Page model, although in
these cases, n figure was higher than the value obtained
in this study, between 1.06 and 2.05.
Also Karathanos and Belessiotis (1999) proposed
higher figures for n parameters, between 1.02 and 1.79
depending on the type of product. According to this
authors, n values increase with the existence of an outer
skin of the dried product being n higher as the thickness
of the skin increases. As it was mentioned above, in this
study, kiwis were peeled before drying.
However, the k parameter of the Page model in-
creased with the increase of the drying air temperature
of kiwis for the whole range of temperatures studied.
Similar results were found by Azzouz et al. (2002) for
the drying of grapes. These authors concluded that n
was function of air velocity and initial moisture content
meanwhile k was function of air drying temperature and
of the initial moisture content of the grapes.
Similarly to the exponential model case, the variation
of k with the temperature exhibited a linear trend
(r
2
¼ 0:995). The fitting of the constant velocity k to the
drying air temperature is shown in Eq. (8).
k
¼ 4:756 10
5
T
ðCÞ 5:548 10
4
ð8Þ
Eqs. (2) and (8) and the proposed figure for the n
parameter were used to simulate the drying curves of
kiwi cubes. The results can be observed in Fig. 2 for the
experiments carried out at 50 and 70
C. As it can be
observed, the Page model clearly improve the simula-
tion, in comparison with the results obtained by using
the exponential model. The rest of experiments were also
correctly simulated. The percentages of explained vari-
ance estimated by the comparison of experimental and
estimated moisture content through the Page model
were higher than 99% in all temperatures (Table 1) being
the average %var 99.6 ± 0.2%.
Finally, in order to establish the diffusional model,
the effective diffusivity coefficient was identified by using
Eq. (4) and the experimental drying curves of kiwi cubes
obtained at different drying air temperatures, between 30
and 90
C. Results obtained in the identification are
shown in Table 1. The effective diffusivity was deter-
mined to vary from 3.0
· 10
10
m
2
/s at 30
C to 17.2 ·
10
10
m
2
/s at 90
C. The figures for the diffusivity
coefficient proposed by different authors and reported
by Pav
on-Melendez, Hern
andez, Salgado, and Garcıa
(2002) varied from 2.2
· 10
10
to 9.4
· 10
10
m
2
/s at 60
C
for different fruits and vegetables; grapes, potatoes, ap-
ples and carrots.
According to numerous authors, the temperature
dependence of the diffusivity coefficient follows the Ar-
rhenius equation (Eq. (7)) (Doymaz & Pala, 2003; Iguaz
et al., 2003; Park et al., 2002). Eq. (9) was obtained by
fitting the effective diffusivity figures identified at the
different drying air temperatures to the Arrhenius
equation (r
2
¼ 0:982).
D
e
¼ 1:476 10
5
exp
26950:22
R
ðT þ 273:16Þ
ð9Þ
The activation energy for diffusion, calculated from
Eq. (9), was 27.0 kJ/mol, similar value to those proposed
Table 1
Identified figures for the three models parameters together with the percentages of explained variance
T
(
C)
Exponential model
Page model (n
¼ 0:796)
Diffusional model
k
(10
4
) (s
1
)
%var
k
(10
4
) (s
n
)
%var
D
e
(10
10
) (m
2
/s)
%var
30
1.55
95.2
9.12
99.2
3.00
99.4
40
2.42
97.5
12.99
99.7
4.67
100.0
50
3.67
97.0
18.15
99.7
7.13
99.5
60
4.99
98.5
22.88
100.0
9.46
99.2
70
6.19
99.2
27.34
99.8
11.88
99.0
80
8.00
99.2
33.97
99.3
15.72
98.3
90
8.70
99.4
36.45
99.6
17.21
97.6
Average
98.0 ± 1.4%
99.6 ± 0.2%
99.0 ± 0.7%
0
1
2
3
4
5
0
2000
4000
6000
8000
10000
12000
14000
16000
drying time (s)
moisture content (kg/kg dm)
50ºC, experimental
70ºC, experimental
Exponential model
Page model
Diffusional model
Fig. 2. Experimental and predicted drying curves of kiwis at 50 and
70
C. Simulation obtained by using the three proposed models.
326
S. Simal et al. / Journal of Food Engineering 66 (2005) 323–328
in the literature for the drying of different foods: 26.2 kJ/
mol for broccoli drying (Simal et al., 1998); between 49
and 54 kJ/mol in drying of grapes (Azzouz et al., 2002);
12.3 and 39.5 kJ/mol for potato and bean drying,
respectively (Senadeera et al., 2003).
By using Eqs. (4) and (9), the moisture content vari-
ation of kiwi cubes was calculated for the experiments
carried out at different drying air temperatures. The
simulation obtained at 50 and 70
C is shown in Fig. 2,
together with the simulations provided by the expo-
nential and the Page models at the same temperatures.
As can be seen in Fig. 2, the prediction of moisture
variation obtained by using the diffusional model was
better than that of the exponential model but worse than
that of the Page model.
The simulation provided by the diffusional model was
mathematically evaluated through the calculation of the
percentage of explained variance (Table 1). In the case
of the diffusional model it was possible to simulate with
high precision (%var higher than 99%) the drying curves
at the lowest temperatures (between 30 and 70
C)
whereas at highest temperatures (80–90
C), the simu-
lation was worse (%var between 98% and 97%). This
behaviour was the inverse one to that of the exponential
model.
Once compared the three proposed models, it could
be concluded that the Page model provided the best
simulation of the drying curves of kiwi cubes (average
%var
¼ 99.6 ± 0.2%) whereas the exponential model
provided
the
least
exact
simulation
(average
%var
¼ 98.0 ± 1.4%). The quality of the simulation
provided by the exponential model increased with the
drying air temperature meanwhile in the case of the
diffusional model, the behaviour was the opposite,
improving the simulation when the temperature was
lower.
Although the constants of the three proposed models
were correlated with the drying air temperature, only in
the case of the diffusional model, these constants can be
related to parameters with physical sense.
3.1. Validation of the proposed models
In order to validate the three proposed models, an-
other set of experiments were simulated. These drying
experiments were carried out by using samples with
different geometry (slabs) to that used in the identifica-
tion of the models parameters (cubes). In this case, kiwi
fruits were cut into slabs of 6
· 10
3
m thickness, without
previous peeling. The drying experiments were per-
formed at 35 and 65
C.
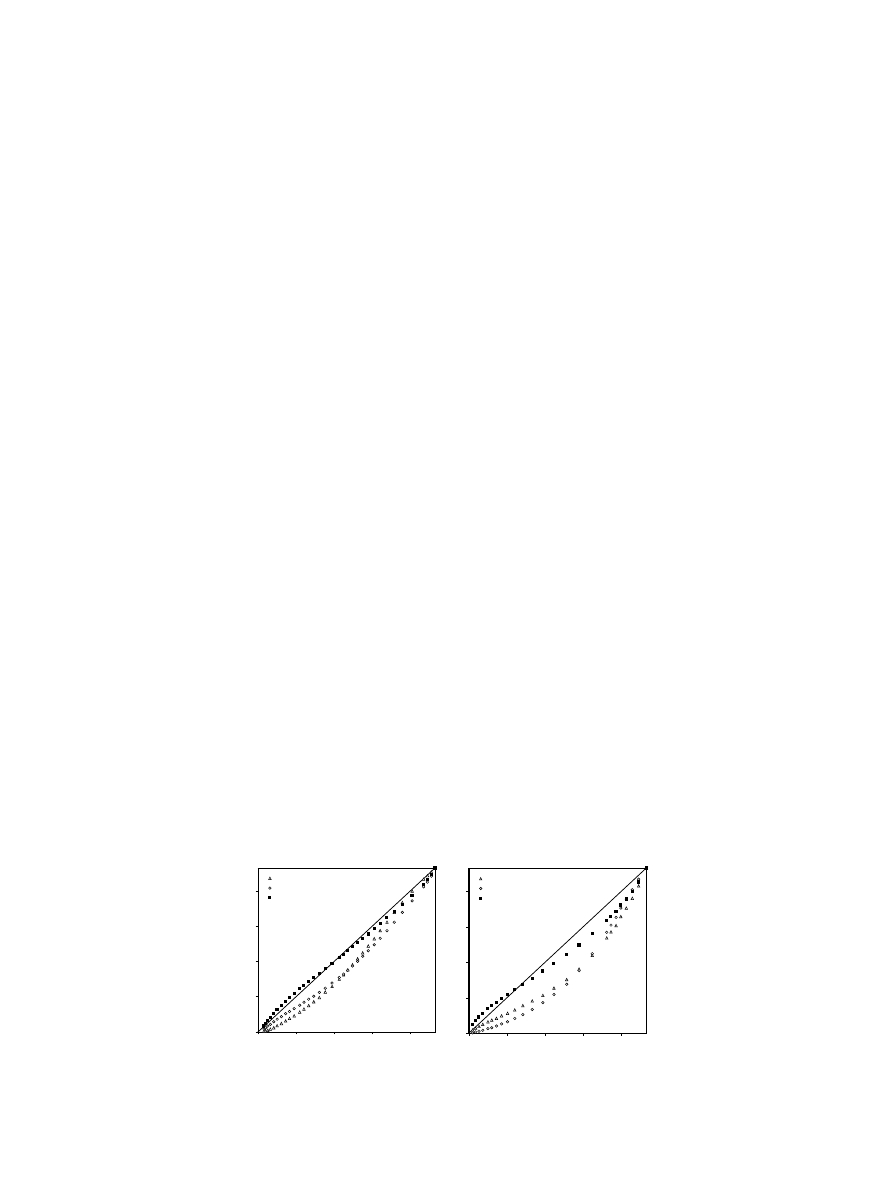
Fig. 3 shows the representation of the estimated
moisture content by using the three models vs. the
experimental moisture content, for the experiments
carried out at 35 and 65
C. As it can be observed, the
exponential and the Page model were not able to predict
accurately the experimental curves meanwhile, the dif-
fusional model, which takes into account the geometry
and size of the samples, provided a satisfactory estima-
tion of the moisture variation, mainly at lower temper-
atures. The average percentages of variance calculated
for the simulation of the drying curves at 35 and 65
C
with kiwi slabs through the exponential, Page and dif-
fusional model were 87.2 ± 4.9%, 86.1 ± 5.1% and
97.6 ± 1.6%, respectively.
As it was pointed out by many authors, although the
empirical models do not provide mechanistic informa-
tion and the estimated parameters have no physical
meaning, it is possible to accurately simulate the drying
curves which from a practical point of view could be
quite interesting. Nevertheless, it should be taken into
account that the empirical models frequently did not
allow the simulation of experiments carried out under
different conditions to those used to identify the model
parameters. In these cases, a mechanistic model could be
more appropriate.
In this study, by using a diffusional model which
simplicity is similar to that of the empirical models, the
simulation of drying experiments of kiwi samples at
different drying air temperatures and geometry to those
used in the parametric identification could be considered
0
1
2
3
4
0
1
2
3
4
experimental moisture content (kg/kg dm)
estimated moisture content (kg/kg dm)
Exponential model
Page model
Diffusional model
T=35ºC
0
1
2
3
4
0
1
2
3
4
experimental moisture content (kg/kg dm)
estimated moisture content (kg/kg dm)
Exponential model
Page model
Diffusional model
T=65ºC
Fig. 3. Estimated vs. experimental moisture content. Simulation of experiments carried out at 35 and 65
C with 6 · 10
3
m of thickness slabs by using
the three proposed models.
S. Simal et al. / Journal of Food Engineering 66 (2005) 323–328
327

satisfactory meanwhile the empirical models did not
provided a good simulation of this drying kinetics.
Acknowledgements
The authors would like to acknowledge the financial
support from the CAIB (Conselleria d’Agricultura i
Pesca del Govern Balear) and the MECI (project
AGL2003-03889).
References
Akpinar, E., Midilli, A., & Bicer, Y. (2003). Single layer drying behav-
iour of potato slices in a convective cyclone dryer and mathemat-
ical modelling. Energy Conversion Management, 44, 1689–1705.
AOAC (1990). Official method of analysis. No. 934.06. Association of
Official Analytical Chemist, Arlington, USA.
Azzouz, S., Guizani, A., Jomaa, W., & Belghith, A. (2002). Moisture
diffusivity and drying kinetic equation of convective drying of
grapes. Journal of Food Engineering, 55, 323–330.
Doymaz, I. (2004). Convective air drying characteristics of thin layer
carrots. Journal of Food Engineering, 61(3), 359–364.
Doymaz, I., & Pala, M. (2003). The thin-layer drying characteristics of
corn. Journal of Food Engineering, 60(2), 125–130.
Iguaz, A., San Martın, M. B., Mat
e, J. I., Fernandez, T., & Vırseda, P.
(2003). Modelling effective moisture diffusivity of rouge rice (Lido
cultivar) at low drying temperatures. Journal of Food Engineering,
59, 253–258.
Karathanos, V. T., & Belessiotis, V. G. (1999). Application of a thin-
layer equation to drying data of fresh and semi-dried fruits. Journal
of Agricultural Engineering Research, 74(4), 355–361.
Panchariya, P. C., Popovic, D., & Sharma, A. L. (2002). Thin-layer
modelling of black tea drying process. Journal of Food Engineering,
52(4), 349–357.
Park, K. J., Vohnikova, Z., & Reis Brod, F. R. (2002). Evaluation of
drying parameters and desorption isotherms of garden mint leaves
(Mentha crispa L.). Journal of Food Engineering, 51, 193–199.
Pav
on-Melendez, G., Hern
andez, J. A., Salgado, M. A., & Garcıa, M.
A. (2002). Dimensionless analysis of the simultaneous heat and
mass transfer in food drying. Journal of Food Engineering, 51, 347–
353.
Rossell
o, C., Simal, S., San Juan, N., & Mulet, A. (1997). Non-
isotropic mass transfer model for green bean drying. Journal of
Agricultural and Food Chemistry, 45, 337–342.
Senadeera, W., Bhandari, B. R., Young, G., & Wijesinghe, B. (2003).
Influence of shapes of selected vegetable materials on drying
kinetics during fluidized bed drying. Journal of Food Engineering,
58(3), 277–283.
Simal, S., Mulet, A., Tarraz
o, J., & Rossell
o, C. (1996). Drying model
for green peas. Food Chemistry, 55(2), 121–128.
Simal, S., Rossell
o, C., Berna, A., & Mulet, A. (1998). Drying of
shrinking cylinder-shaped bodies. Journal of Food Engineering, 37,
423–435.
Simal, S., Femenia, A., C
arcel, J. A., & Rossell
o, C. (submitted for
publication). Mathematical modelling of the drying curves of kiwi
fruits: influence of the ripening stage. Journal of the Science of Food
and Agriculture.
Sogi, D. S., Shivhare, U. S., Garg, S. K., & Bawa, A. S. (2003). Water
sorption isotherm and drying characteristics of tomato seeds.
Biosystems Engineering, 84(3), 297–301.
328
S. Simal et al. / Journal of Food Engineering 66 (2005) 323–328
Document Outline
Wyszukiwarka
Podobne podstrony:
Money and Happiness A Guide to Living the Good Life
Money and Happiness A Guide to Living the Good Life
An experimental study on the drying kinetics of quince
The drying kinetics of kale (Brassica oleracea) in a convective hot air dryer
Effect of a novel physical pretreatment process on the drying kinetics of seedless grapes
Guide to Selection and Use of D Nieznany
The use of additives and fuel blending to reduce
Use of clinical and impairment based tests to predict falls by community dwelling older adults
Use of transgenic animals to improve human health and animal production
Drying kinetics and drying shrinkage of garlic subjected to vacuum microwave dehydration (Figiel)
Magnetic Treatment of Water and its application to agriculture
Mock Exam? Use of English and Vocabulary
First 2015 Reading and Use of E Nieznany
AIDS Action Supports Research and Use of Medical Use AIDS Action
Practical Optical System Layout And Use of Stock Lenses
Guidance for ambulance personnel on decisions and situations related to out of hospital CPR
Guidance for ambulance personnel on decisions and situations related to out-of-hospital CPR, MEDYCYN
The use of 了 to imply completed?tionx
więcej podobnych podstron