
O R I G I N A L A R T I C L E
Impact of Chronic Lead Exposure on Selected Biological Markers
Ambica P. Jangid
•
P. J. John
•
D. Yadav
•
Sandhya Mishra
•
Praveen Sharma
Received: 26 August 2011 / Accepted: 3 September 2011 / Published online: 22 September 2011
Ó Association of Clinical Biochemists of India 2011
Abstract
Lead poisoning remains a major problem in
India due to the lack of awareness of its ill effects among
the clinical community. Blood lead, d-aminolevulinic acid
dehydratase (d-ALAD) and zinc protoporphyrin (ZPP)
concentrations are widely used as biomarkers for lead
toxicity The present study was designed to determine the
impact of chronic lead exposure on selected biological
markers. A total of 250 subjects, of both sexes, ranging in
age from 20 to 70 years, were recruited. On the basis of
BLLs, the subjects were categorized into four groups:
Group A (BLL: 0–10 lg/dl), Group B (BLL: 10–20 lg/dl).
Group C (BLL: 20–30 lg/dl) and Group D (BLL:
30–40 lg/dl) having BLLs of 3.60 ± 2.71 lg/dl, 15.21 ±
2.65 lg/dl, 26.82 ± 2.53 lg/dl and 36.38 ± 2.83 lg/dl,
respectively. Significant changes in biological markers due
to elevated BLLs were noted. The relation of BLL and
biological markers to demographic characteristics such as
sex, habits, diet and substances abuse (smoking effect)
were also studied in the present investigation. Males, urban
population, non-vegetarians, and smokers had higher blood
lead levels. d-ALAD activity was found to be significantly
lower with increased BLL (P \ 0.001), while the ZPP
level
was significantly higher with increased BLL
(P \ 0.001). Further, BLL showed a negative correlation
with d-ALAD (r = -0.425, P \ 0.001, N = 250) and a
positive correlations with ZPP (r = 0.669, P \ 0.001,
N = 250). Chronic lead exposure affects the prooxidant-
antioxidant equilibrium leading to cellular oxidative stress.
Keywords
Blood lead level
d-amino levulinic acid
dehydratase
Zinc protoporphyrin
Introduction
Lead (Pb) is a normal constituent of the earth’s crust, with
trace amounts found naturally in soils, plants and water. If
left undisturbed, lead (Pb) is practically immobile. How-
ever, once mined and transformed into man-made prod-
ucts, it is distributed throughout the environment, and
becomes highly toxic. Solely as a result of man’s action,
lead (Pb) has become the most widely scattered toxic
metal in the world. A growing body of evidence indicates
that transition metals act as a catalyst in the oxidative
deterioration of biological macromolecules. Therefore, the
toxicities associated with these metals may lead to oxi-
dative tissue damage. Several studies identified various
biomarkers of lead (Pb) toxicity. Lead is a divalent cation.
It has a strong binding capacity for sulfahydryl proteins
and creates an interference with enzymes and structural
proteins. Lead inhibits heme biosynthesis and causes
anemia, basophilic stippling, a decrease in erythrocyte
d-aminolevulinic acid dehydrogenase and increase in uri-
nary in d-aminolevulinic acid, urinary coproporphyrin,
erythrocyte zinc protoporphyrin (ZPP), and pyrimidine
5
0
-nucleotidase [
]. A marked increase in urinary excre-
tion of aminolevulinic acid (ALA), the substrate that
accumulates as a result of decreased ALAD, has been
A. P. Jangid
P. J. John (
&)
Environmental Toxicology Laboratory, Department of Zoology,
University of Rajasthan, Jaipur 302004, Rajasthan, India
e-mail: placheriljohn@yahoo.com
D. Yadav
S. Mishra
Department of Biochemistry, S.M.S. Medical College,
Jaipur 302004, India
P. Sharma
Department of Biochemistry, Government Medical College,
Kota 240009, Rajasthan, India
123
Ind J Clin Biochem (Jan-Mar 2012) 27(1):83–89
DOI 10.1007/s12291-011-0163-x

used in the past as a biomarker for lead (Pb) toxicity. This
can be detected only when BLLs exceed 35 lg/dl in
adults and 25–75 lg/dl in children [
]. The most well-
known distortions involved is the interference of lead
with the heme synthetic pathway, specifically the enzyme
d-aminolevulinic acid dehydratase. Interference with heme
production and subsequent reduction of the heme body
pool is one of the main causes of lead related pathology.
When whole blood lead levels (BLLs) exceed 20 lg/dl,
the activity of ALAD is inhibited by 50 percent [
ALAD can serve as a valuable biomarker of oxidative
stress in the lead exposed hematological system. It is also
a biochemical indicator of lead exposure [
Thus the present study was undertaken to examine the
blood lead levels and to assess the impact of chronic lead
exposure on d-ALAD and ZPP in the blood of normal
healthy subjects.
Materials and Methods
Selection of Subjects
The study sample consisted of 250 normal healthy subjects.
These subjects belonged to the age group of 20–70 years
and included both male and female individuals. They were
randomly selected from the urban and rural populations of
Jaipur.
A written consent was obtained from all 250 subjects.
Questionnaires for the subjects were completed during
face-to-face interviews. All subjects answered the same
questions regarding demographic data, socioeconomic
status, habits, perceived health, and health complaints. The
subjects suffering from any major disease (malignancy,
hypertension, diabetes mellitus, arthritis, tuberculosis, heart
disease, endocrine disorders etc.) that affects oxidative
stress were excluded from the study.
Collection of Blood Sample
Blood samples from each subject was collected from the
antecubital vein using aseptic techniques at Central Labo-
ratory, Department of Biochemistry, SMS, Medical Col-
lege, Jaipur. Each sample consisted of 5 ml of blood which
was collected in a dipotassium ethylenediaminetetraacetic
acid (EDTA) vial and the following investigations were
performed on this sample.
1.
Blood lead levels (BLLs)
2.
Delta-aminolevulinic acid dehydratase (d-ALAD)
3.
Zinc protoporphyrin (ZPP)
Biochemical Assay
Blood Lead (Pb)
The blood samples collected from the subjects were ana-
lyzed for lead (Pb) level by using Atomic absorption
spectrophotometer (AAS). Sample pre-treatment consisted
of a fivefold dilution with a dilute surfactant. The instru-
ment was directly calibrated with lead standards prepared
in dilute HNO
3
. To eliminate small, nonspecific absorption
signals from the blood matrix, simultaneous background
correction was used. The lead was accurately measured
from as little as 20 ll of blood at wavelength of 283.3 nm
[
Delta-Amino Levulinic Acid Dehydratase (d-Alad)
Delta-aminolevulinic acid (d-ALAD) was measured spec-
trophotometrically. The enzyme delta-amino levulinic acid
dehydratase converts two molecules of ALA to porphobi-
linogen. The porphobilinogen formed was mixed with
modified Ehrlich’s reagent and the color development was
measured at 555 nm [
Zinc Protoporphyrin (Zpp)
Zinc protoporphyrine (ZPP) was detected by a hematoflu-
orometer. A small (unmeasured) drop of blood was
obtained from a finger puncture. This was then placed on a
disposable cover slip and inserted into the sample holder of
the instrument. The zinc protoporphyrin concentration was
automatically and instantaneously computed and the value
was displayed on a digital readout as micrograms of zinc
protoporphyrin per liter of blood at 424 nm [
Statistical Analysis
An appropriate statistical analysis was done using statisti-
cal software SPSS 10. Tukey’s test was used for one way
analysis of variance (ANOVA) in the current investigation
to establish the significance in various groups. F-test was
done to establish that the differences in the results of the
present study were significant. Correlation was done by
Pearson’s correlation.
Results
All the 250 subjects selected in the present study were further
divided into four groups that is group-A, group-B, group-C
and group-D depending upon the blood lead (Pb) concentra-
tion. The subjects belonging to group-A (N = 103, 41.00%)
84
Ind J Clin Biochem (Jan-Mar 2012) 27(1):83–89
123

had BLLs between 0 and 10 lg/dl and this group was con-
sidered to be the safest as per CDC and WHO guidelines
[
,
]. In group-B (N = 67, 27.00%), the lead level was
10–20 lg/dl. In group-C (N = 53, 21.00%), the lead level
was 20–30 lg/dl and in group-D (N = 27, 11.00%), the lead
level was 30–40 lg/dl (Table
; Fig.
). The BLLs of group-
B, C and D were compared to the BLL of group-A.
Table
shows the alterations in BLLs and biological
markers in chronic lead exposure with reference to demo-
graphic characteristics such as sex, habitat, diet and sub-
stance abuse (smoking) of selected subjects. A significantly
lower BLL and a significantly higher d-ALAD and ZPP
were observed in females as compared to males. In urban
and non-vegetarian subjects, the BLL and ZPP were found
to be significantly increased and the d-ALAD was found to
be significantly decreased as compared to rural and vege-
tarian subjects. A significantly lower BLL and ZPP and
significantly higher d-ALAD were found in non-smokers as
compared to smokers.
Table
shows the alteration in d-ALAD and ZPP levels
in subjects of various BLL groups. The decrease in
d-ALAD level was statistically significant in group-C and
D but not significant in group-B as compared to the safest
group-A. However, the increase in levels of ZPP is statis-
tically significant in group-B, C and D when compared to
the safest group-A.
Table
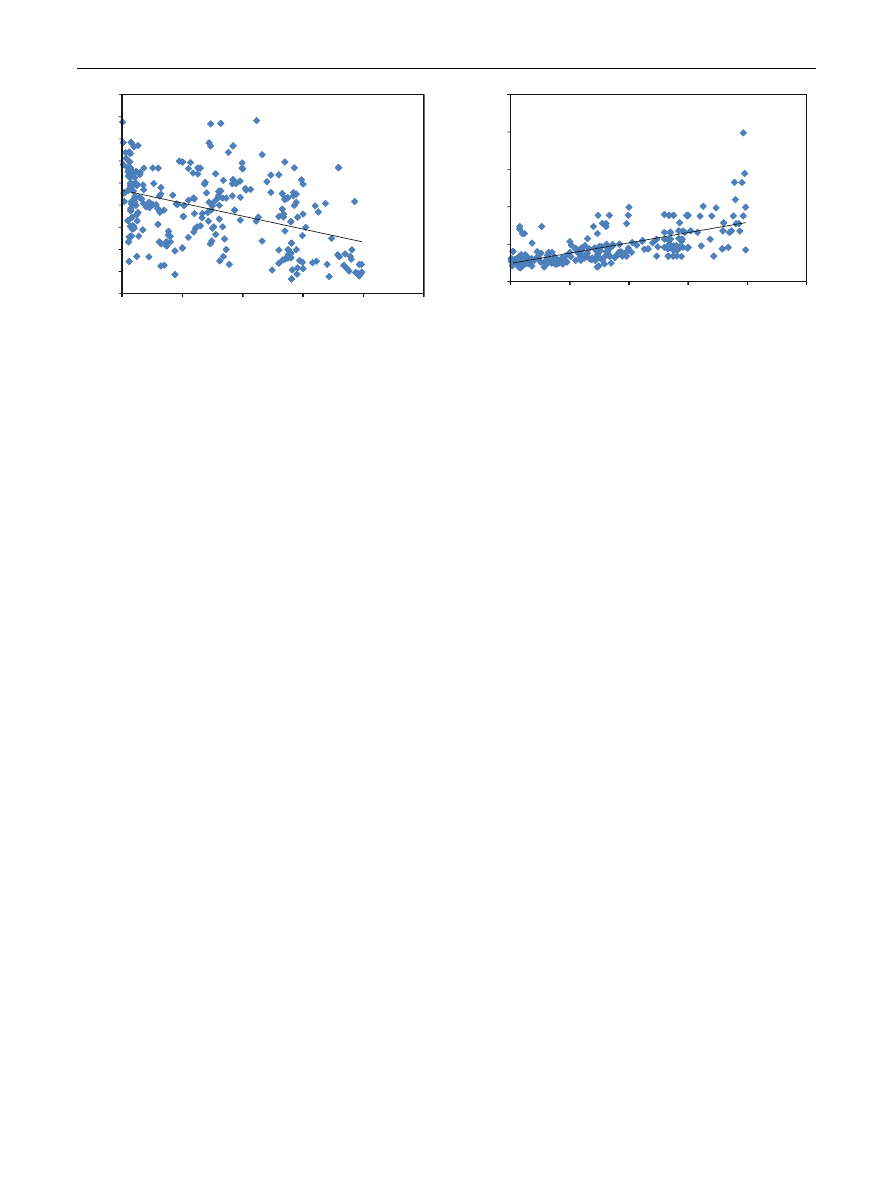
shows the correlation between blood lead levels
and the levels of the biomarkers of lead toxicity using
Pearson’s correlation. A significant negative correlation
of blood lead level was observed with the d-ALAD (r =
-0.425, Fig.
) and a positive correlation of blood lead
levels was found with ZPP (r = 0.669, Fig.
).
Discussion
Lead as such is a metal which has no known function in
body and any amount of it may be associated with adverse
effects. More recently WHO has reduced the cut off of
BLLs and said that the level should be less than 10 lg/dl
because any amount of lead in blood causes adverse effects
at the cellular level. There are certain studies which have
related blood lead concentration above 10 lg/dl in children
and adolescent with various neurological dysfunctions
[
]. In the present study out of 250 participants, only 40%
subjects had blood lead level below 10 lg/dl. The
remaining 60% subjects had blood lead concentration of
more than 10 lg/dl of these 11% had BLL above 30 lg/dl
(Table
; Fig.
). BLL has been considered as one of the
most reliable markers for lead toxicity [
Out of 250 participants, 217 subjects were males and 33
were females and 141 were from rural background and 109
were from urban background. 153 were vegetarians while
97 were non-vegetarians and 139 subjects were smokers
and 111 were non-smokers.
The BLLs were found to be significantly higher in males
as compared to females (P \ 0.05). This can be attributed
to the fact that males are relatively more exposed to pol-
lution in a variety of occupations as compared to females
[
]. When d-ALAD value in both the genders were
examined the level was lower in males as compared to
females and the difference was significant (P \ 0.05).
Variability of ZPP value in male and female subjects was
found to be significantly (P \ 0.05) higher in males as
compared to female subjects. This has been supported by
several other researchers [
,
In urban subjects the BLL was found to be significantly
higher as compared to subjects from the rural background.
The value being between 23.23 ± 9.80 and 8.93 ± 7.18
(Table
). Elevated lead (Pb) concentration in blood in
urban population can be ascribed to increased exposure to
various sources of lead (Pb) which includes pollution
through paints [
], lead recycling, presence of lead in
cosmetics [
] and in drinking public water supply in
lead pipes [
,
]. The mean d-ALAD value was found to
be 40.53 ± 15.10 and 34.47 ± 17.28 U/l in rural and
urban subjects, respectively. There was a significant
Table 1
Blood lead (Pb) level range groups according to concen-
tration of lead
Groups
Blood lead level range
Mean ± SD
Group-A (103)
0–10 lg/dl
3.60 ± 2.71
Group-B (67)
10–20 lg/dl
15.21 ± 2.65
Group-C (53)
20–30 lg/dl
26.82 ± 2.53
Group-D (27)
30–40 lg/dl
36.38 ± 2.83
21%
Group A (0-10 µg/dl)
Group C (
27%
(20-30 µg/d
11%
Group B (10-
l)
Gro
41%
2
up D (30-4
0 µg/dl)
0 µg/dl)
Fig. 1
Distribution of subjects according to blood lead concentration
Ind J Clin Biochem (Jan-Mar 2012) 27(1):83–89
85
123

decrease in the concentration of d-ALAD in urban popu-
lation as compared to rural population (P \ 0.05). In urban
subjects the ZPP level was relatively higher as compared to
rural subjects (P \ 0.05).
The BLL was found to be significantly increased in non-
vegetarians as compared to vegetarians. This may due to the
fact that the non-vegetarians are mostly found to be in the
urban setup and to have a greater chance to get exposed to
lead pollution as compared to vegetarians. Current investi-
gations reveal significant modulations in the level of
d-ALAD in vegetarian and non-vegetarian subjects
(P \ 0.05). The mean d-ALAD value was found to be
39.28 ± 15.99 and 35.70 ± 16.7 U/l in vegetarian and non-
vegetarian, respectively. Non-vegetarian and urban popula-
tions are associated with increased BLL. The decrease in
d-ALAD activity may be due to the binding of lead (Pb) with
–SH groups of ALAD leading to its depressed activity as
observed by various workers [
,
]. The level of
ZPP in non-vegetarian subjects was also recorded to
be higher as compared to the levels of this enzyme in
vegetarian.
The BLL of smokers were significantly higher than lead
levels in non-smokers (P \ 0.05). This may be attributed
to the fact that smokers are relatively more exposed to
pollution in a variety of occupations as compared to non-
smokers. When d-ALAD value in both the smokers-non
smokers were examined the level was lower in smokers as
compared to non smokers and the difference was signifi-
cant (P \ 0.05). Variability of ZPP value in smokers-non
smokers subjects were found to be significantly (P \ 0.05)
higher in smokers as compared to non-smokers subjects
[
].
Table
shows the alterations in d-ALAD and ZPP in
subjects of various BLL groups. Reduced d-ALAD con-
centration was found with elevation in BLLs in subjects
which is evident from the coefficient of correlation value of
r = -0.425 (Table
; Fig.
). The obtained results showed
a significant difference in d-ALAD of different groups
(P \ 0.001). Other studies have also shown similar results
[
]. Lead binds to the enzymes that have
functional sulfhydryl groups, rendering them nonfunctional
and further contributing to the impairment of oxidative
Table 2
Alterations in
biological markers in chronic
lead exposure with reference to
demographic characteristics
* Significant (P \ 0.05, F test)
Subjects
Selected biological markers
Lead (lg/dl)
Delta-ALAD(U/l)
ZPP (lg/l)
Male (N = 217)
15.55 ± 11.88
37.71 ± 16.31
39.05 ± 16.67
Female (N = 33)
11.56 ± 10.86*
39.05 ± 16.67*
42.57 ± 25.98*
Rural (N = 141)
8.93 ± 7.18
40.53 ± 15.10
37.46 ± 16.81
Urban (N = 109)
23.23 ± 9.80*
34.47 ± 17.28*
55.28 ± 28.31*
Vegetarian (N = 153)
12.65 ± 10.34
39.28 ± 15.99
40.79 ± 18.98
Non-vegetarian (N = 97)
19.13 ± 12.91*
35.70 ± 16.70*
52.30 ± 29.41*
Smokers (N = 139)
17.16 ± 12.92
35.88 ± 17.32
47.42 ± 26.17
Non-smokers (N = 111)
11.56 ± 10.86*
39.05 ± 16.67*
44.58 ± 25.98*
Table 3
Influence of selected biological markers in subjects of various BLL groups
Parameters
BLL groups
ANOVA
(single factor)
A(0–10 lg/dl)
(N = 103)
B(10–20 lg/dl)
(N = 67)
C(20–30 lg/dl)
(N = 53)
D(30–40 lg/dl)
(N = 27)
d-ALAD(U/l) 95% CI (mean)
41.81 ± 14.43
(38.99–44.63)
42.75 ± 14.16
NS
(39.29–46.20)
33.41 ± 16.68*
(28.81–38.01)
19.67 ± 12.84*
(14.59–24.75)
F = 20.31,
P
\ 0.001
ZPP (lg/l) 95% CI (mean)
30.83 ± 10.54
(10.74–152.33)
44.16 ± 17.60*
(39.87–48.46)
54.45 ± 15.61*
(50.14–58.75)
84.20 ± 36.27*
(69.85–98.54)
F = 70.21,
P
\ 0.001
Values represent mean ± standard deviation and 95% CI for mean
Mean values with ‘*’ are significantly different from safest group-A, whereas value with ‘NS’ are not significant according to Tukey’s test
Statistical analysis was done using ANOVA single factor
Table 4
Correlation between BLL and selected biological markers
(N = 250)
Correlation
d-ALAD (U/l)
ZPP (lg/l)
Lead (lg/dl)
r = -0.425, P \ 0.001
r = 0.669, P \ 0.001
r Correlation coefficient (Pearson’s correlation)
86
Ind J Clin Biochem (Jan-Mar 2012) 27(1):83–89
123
balance. Levels of two specific sulfhydryl containing
enzymes that are inhibited by lead d-ALAD and glutathi-
one reductase (GR) have been demonstrated to be depres-
sed in both animal and human lead exposure studies [
–
]. Delta-ALAD is one of the enzymes of heme biosyn-
thesis which converts ALA to porphobilinogen, the first
precursor of pyrrole. Inhibition of d-ALAD prevents ALA
from being converted to porphobilinogen, inhibiting
incorporation of iron into the protoporphyrin ring, resulted
in impaired heme synthesis for hemoglobin. Decreased
activity of d-ALAD results in impaired heme biosynthesis
[
]. It has also been reported that blood lead (Pb) con-
centration above 20 lg/dl inhibit activity of d-ALAD by
50% which could lead to lead (Pb) associated metabolic
abnormalities. Subjects with lead levels above the safe
limit were found to have reduced d-ALAD activity. The
correlation between blood lead concentration and d-ALAD
was found to be negative with the correlation coefficient
(r) = -0.425 but this is not linear (Fig.
). Though the d-
ALAD indicates lead (Pb) toxicity but it cannot be taken as
a biomarker for lead toxicity. Similar observations have
been put forward by Phillip and Gerson [
]. Austrin et al.
observed a 50% inhibition of d-ALAD activity at BLL of
15 lg/dl [
]. Sakai and Morita reported that the threshold
of extremely low blood lead for d-ALAD inhibition was
approximately 5 lg/dl [
].
ALAD is a crucial enzyme in lead toxicity. The inhi-
bition of ALAD lowers heme production and increases the
levels of the substrate delta-aminolevulinic acid (ALA).
Elevated levels of ALA, found both in the blood and urine
of subjects with lead exposure, are known to stimulate ROS
production [
]. However, the heme precursors accumulate
in erythroblasts and inhibit the ALAD [
]. ALAD was
suggested to be too sensitive to lead (Pb) inhibition which
makes it ineffective as an index of lead exposure [
]. The
literature indicates that blood ALAD levels correlates very
closely with blood lead levels, and serve as an early
biochemical index of exposure which can also detect the
lower levels of exposure [
Studies of lead workers have shown that d-ALAD
activity, correlates inversely with BLL [
]. General popu-
lation studies indicate that the activity of ALAD is inhib-
ited at very low BLLs, with no threshold yet apparent.
Studies of children from India and China have reported the
significant decreases in ALAD activity are associated with
BLLs C10 lg/dl. Further the inverse correlations between
BLL and ALAD activity were found in mothers (at deliv-
ery) and their newborns (cord blood) [
Blood lead levels and ZPP activity are used as clinical
indices of lead toxicity [
]. In the present study the ZPP level
was found to be significantly higher in subjects with elevated
BLL and has been found to have a positive association
(Table
; Fig.
, P \ 0.001). There was a positive correla-
tion between ZPP and BLLs which is evident from the
coefficient of correlation value of r = 0.669 (Table
;
Fig.
), which points to the inhibition of heme synthesis by
ZPP. An increase in ZPP activity is because lead is known to
inhibit the activity of ferrochetalase which catalyses the last
step of the heme synthesis. Here lead is incorporated into
protoporphyrin instead of iron, resulting in the production
and accumulation of zinc protoporphyrin [
]. Similar
findings were reported in other studies [
,
,
]. However,
in the abundance of haemoglobin, increased ZPP is rela-
tively harmless [
]. Elevated ZPP is more pronounced with
blood Lead concentration above 30 lg/dl. This is because
the threshold for ZPP in adult is 30 and 15 lg/dl in children.
The findings of the present study also confirm the above
phenomenon. Ferrochelatase enzyme that catalyzes the
insertion of iron into protoporphyrin IX is also impaired by
lead. Interruption of this enzyme results in an increase of the
substrate erythrocyte protoporphyrin (EP), when bound to
iron, zinc and zinc protoporphyrin (ZPP). These elevations
do not appear in the blood until lead levels reach 35 lg/dl
[
]. However, most protoporphyrin in erythrocytes (about
0
10
20
30
40
50
60
70
80
90
0
δ
-ALAD (U/L)
10
Le
20
ead(µg/dl)
y = -0.5
Correlatio
P<0.0
30
587x + 46.7
on (r) = -0.4
01, N= 250
40
79
425
0
50
Fig. 2
Correlation between lead and d-ALAD
0
50
100
150
200
250
0
ZPP (µg/L)
y =
Corr
P<
10
= 1.370x + 2
elation (r) =
<0.001, N=
24.36
= 0.669
250
20
Lead(µg
30
g/dl)
40
50
Fig. 3
Correlation between lead and ZPP
Ind J Clin Biochem (Jan-Mar 2012) 27(1):83–89
87
123

90%) exists as ZPP. Elevated erythrocyte protoporphyrin
can reflect iron deficiency, sickle cell anemia and jaundice
[
]. Other diseases such as porphyria, liver cirrhosis, iron
deficiency, age and alcoholism may also produce similar
effects on heme synthesis [
Conclusions
Lead poisoning is an old but persistent public health prob-
lem throughout world. Although guidelines for the man-
agement of lead poisoning were released by Centers for
Disease Control and World Health Organization, no suit-
able approach for the treatment of low level lead poisoning
appears to exist. Lead is an important environmental toxi-
cant in developed and developing nations. It may cause
serious health problems. When the antioxidant free radical
scavenging systems are overwhelmed, pathological condi-
tion may occur. The results of the present study will help to
establish the relationship between blood lead levels and the
biological markers at the cellular level. BLL determinations
remain the most suitable method for monitoring recent lead
toxicity, whereas increased ZPP concentrations, even with
concurrent nontoxic BLL, have a predictive value for
detecting incipient lead toxicity. However, ALAD was
found to be unsuitable as an index of lead exposure.
References
1. Sakai T. Reviews on biochemical markers of lead exposure with
special emphasis on heme and nucleotide metabolism. Sangyo
Eiseigaku Zasshi. 1995;40:314–7.
2. Somashekaraiah BV, Venkaiah B, Prasad AR. Biochemical
diagnosis of occupational exposure to lead toxicity. Bull Environ
Contam Toxicol. 1990;44:268–75.
3. Phillip AT, Gerson B. Lead poisoning-Part I. Incidence, etiology,
and toxicokinetics. Clin Lab Med. 1994;14:423–44.
4. Gurer-Orhan H, Sabir HU, Ozgunes H. Correlation between
clinical indicators of lead poisoning and oxidative stress param-
eters
in controls
and
lead-exposed
workers.
Toxicology.
2004;195:147–54.
5. Fernandez FJ. Micromethod for lead determination in whole
blood by atomic absorption, with use of the graphite furnace. Clin
Chem. 1975;21:558–61.
6. Wigfield DC, Farrant JP. Assay of delta-aminolaevulinate dehy-
dratase in 10 microlitre blood. Clin Chem. 1981;27(1):100–3.
7. Blumberg WE, Esinger J, Lamola AA, Zuckerman DM. The
haematofluorometer. Clin Chem. 1977;23:270–1.
8. CDC (Centers for Disease Control and Prevention). Preventing
lead poisoning in young children. Public Health Service, Centers
for Disease Control, US Department of Health and Human Ser-
vices, Atlanta, Georgia. 1991.
http://www.cdc.gov/nch/lead/publi
. Accessed 1 Jan 2008.
9. WHO (World Health Organization). International Programme on
Chemical Safety (IPCS). Inorganic lead. Environmental health
criteria 165. Geneva. 1995.
http://www.inchem.org/documents/
. Accessed 21 Apr 2008.
10. Baghurst PA, McMichael AJ, Wigg NR, Vimpani GV, Robertson
EF, Roberts RJ, Tong SL. Environmental exposure to lead and
children’s intelligence at the age of seven years. New Engl J Med.
1992;327:1279–84.
11. Muntner P, Menke A, DeSalvo KB, Rabito FA, Batuman V.
Continued decline in blood lead levels among adults in the United
States: the National Health and Nutrition Examination Surveys.
Arch Intern Med. 2005;165:2155–61.
12. Roels HA, Lauwerys RR, Buchet JP, Vrelust MT. Response of
free erythrocyte porphyrin and urinary-delta-aminolevulinic acid
in men and women moderately exposed to lead. Int Arch Arbe-
itsmed. 1975;34:97–108.
13. Grandjean P, Lintrup J. Erythrocyte–Zn–protoporphyrin as an
indicator of lead exposure. Scand J Clin Lab Invest. 1978;38:
669–75.
14. Mohammad IK, Mahdi AA, Raviraja A, Najmul I, Iqbal A,
Thuppil V. Oxidative stress in painters exposed to low lead
levels. Arh Hig Rada Toksikol. 2008;59:161–8.
15. Sprinkle RV. Leaded eye cosmetics: a cultural cause of elevated
lead levels in children. J Fam Pract. 1995;40(4):358–62.
16. Sharma DC, Seervi N, Rawtani J. Effect of environmental lead
pollution on hemoglobin and erythrocyte ALAD activity. Indian J
Physiol Pharmacol. 2000;44(1):117–8.
17. Quinn MJ, Sherlock JC. The correspondence between U.K.
‘action levels’ for lead in blood and in water. Food Addit Con-
tam. 1990;7:387–424.
18. WHO (World Health Organization). Lead in drinking water.
Background document of WHO guidelines for drinking water
quality, Geneva, WHO (WHO/SDE/WSH/03.04/09). 2003.
19. Ahamed M, Verma S, Kumar A, Siddiqui MK. Delta-aminolev-
ulinic acid dehydratase inhibition and oxidative stress in relation
to blood lead among urban adolescents. Hum Exp Toxicol.
2006;25(9):547–53.
20. Ahamed M, Singh S, Behari JR, Kumar A, Siddiqui MK. Inter-
action of lead with some essential trace metals in the blood of
anemic children from Lucknow. India Clin Chim Acta. 2007;
377(1–2):92–7.
21. Hulea SA, Olinescu R, Nita S, Crocnan D, Kummerow FA.
Cigarette smoking causes biochemical changes in blood that are
suggestive of oxidative stress: a case-control study. J Environ
Pathol Toxicol Oncol. 1995;14(3–4):173–80.
22. Flora SJS, Singh S, Tandon SK. Plumbism among Indian silver
jewellery industry workers. J Environ. Sci Health Part A 1990;
25A (2):105–113.
23. Farant JP, Wigfeld DC. Biomonitoring lead exposure with delta-
aminolevulinate dehydratase (ALA-D) activity ratios. Int Arch
Occup Environ Health. 1982;51:15–24.
24. Sandhir R, Julka D, Gill KD. Lipoperoxidative damage on lead
exposure in rat brain and its implications on membrane bound
enzymes. Pharmacol Toxicol. 1994;74:66–71.
25. Ahamed M, Verma S, Kumar A, Siddiqui MK. Environmental
exposure to lead and its correlation with biochemical indices in
children. Sci Total Environ. 2005;346(1–3):48–55.
26. Austrin KH, Bishap DF, Wetmur JG, Kaul BC, Davidow B,
Desnick RJ. Aminolevulinic acid dehydratase isozymes and lead
toxicity. Ann NY Acad Sci. 1987;514:23–9.
27. Sakai T, Morita Y. Delta-aminolevulinic acid in plasma or whole
blood as a sensitive indicator of lead effects, and its relation to the
other heme-related parameters. Int Arch Occup Environ Health.
1996;68:126–32.
28. Bechara EJ. Oxidative stress in acute intermittent porphyria and
lead poisoning may be triggered by 5-aminolevulinic acid. Braz J
Med Biol Res. 1996;29:841–51.
29. Sakai T. Biomarkers of lead exposers. Ind Health. 2000;38:
127–42.
88
Ind J Clin Biochem (Jan-Mar 2012) 27(1):83–89
123

30. Chiba M, Shinohara A, Matsushits K, Watanabe H, Inaba Y.
Indices of lead exposure in blood, urine of lead exposed workers,
concentrations of major, trace elements, activities of SOD, GsH-
Px and catalase in their blood. Tohoku J Exp Med. 1996;178:
49–62.
31. Goyer H, Clarkson TW. Toxic effects of metals. In: Klassen CD,
editor. Casarett and Doull’s toxicology. The basic science of
poisons. New York: McGraw-Hill; 2001. p. 830.
32. Jin Y, Liao Y, Lu C. Health effects in children aged 3–6 years
induced by environmental lead exposure. Ecotoxicol Environ Saf.
2006;63(2):313–7.
33. Marcus AH, Schwartz J. Dose-response curves for erythrocyte
porphyrin vs. blood lead, effects of iron status. Environ Res.
1987;44:221–7.
34. Onalaja VO, Claudio L. Genetic susceptibility to lead poisoning.
Environ Health Perspect. 2000;108:23–8.
35. ATSDR (Agency for Toxic Substances and Disease Registry).
Toxicological profile for lead. (Draft for Public Comment).
Atlanta, GA: U.S. Department of Health and Human Services,
Public Health Service. 2007;232.
. Accessed 1 Jan 2008.
Ind J Clin Biochem (Jan-Mar 2012) 27(1):83–89
89
123
Document Outline
Wyszukiwarka
Podobne podstrony:
Biochemical Effects of Lead Exposure on Systolic & Diastolic Blood Pressure, Heme Biosynthesis and H
THE IMPACT OF SOCIAL NETWORK SITES ON INTERCULTURAL COMMUNICATION
Impact of resuscitation system errors on survival from in hospital cardiac arrest
Impact of resuscitation system errors on survival from in-hospital cardiac arrest, MEDYCYNA, RATOWNI
Effect of vacuum microwave drying on selected mechanical and rheological properties of carrot
Impact of Artificial Gummy Fingers on Fingerprint Systems
Marina Post The impact of Jose Ortega y Gassets on European integration
The Impact of Mary Stewart s Execution on Anglo Scottish Relations
social networks and planned organizational change the impact of strong network ties on effective cha
Sources of Potential Lead Exposure Among Pregnant Women in New Mexico
Impact of opiate addiction on n Nieznany
possible impacts of climatic warming on polar bears
Glińska, Sława i inni The effect of EDTA and EDDS on lead uptake and localization in hydroponically
The impact of Microsoft Windows infection vectors on IP network traffic patterns
Implementation of a Mu;ti level Inverter Based on Selective Harmonic Elimination and Zig Zag Connect
Latour The Impact of Science Studies on Political Philosophy
L R Kominz The Impact of Tourism on Japanese Kyogen (Asian Ethnology Vol 47 2, 1988)
więcej podobnych podstron