
LC•GC Europe, 17(3), 144–151 (2004)
2
Belardi and Pawliszyn
1
first described the
concept of solid-phase microextraction
(SPME) based upon the principle of
partitioning of analytes between the
extracting phase and the matrix (air, water
and so forth). Many have developed
modifications of this extractive approach
and associated devices to improve the
availability and application of this sample
preparation technique.
2
Among those
approaches, SPME has been implemented
practically by placing the fibre in a
micro-syringe. This approach has been
commercialized by Supelco (Bellefonte,
Pennsylvania, USA).
To date, this manual SPME syringe device
is commonly used for off-line sample
preparation.
3–5
However, sample
preparation techniques that cannot be
automated are used less often for routine
analysis, even if they offer other attractive
features, such as high selectivity or
sensitivity. Thus, by modifying a commercial
gas chromatography (GC) autosampler,
R. Eisert and colleagues
6,7
realized the
interfacing of fibre SPME–GC in a quasi-
automated mode.
In-tube SPME has been used in HPLC as
an efficient and simple preparation
method, and it offers several advantages
over the fibre SPME syringe–LC approach.
8
In-tube SPME is similar to fibre SPME, but
the extraction device has a piece of fused-
silica GC capillary column in place of a
fibre. Conceptually, in-tube SPME should
preserve the advantages of SPME and
could offer improved enrichment efficiency,
quantification and automation through the
on-line coupling with a chromatograph. By
using a piece of bonded-phase capillary GC
column for sorption, a larger amount of
stationary phase and a more robust film are
obtained, relative to outside-coated films
of conventional SPME fibres. These
differences result in higher enrichment
factors and longer extractor life. Because
many capillary GC stationary phases are
commercially available, in-tube SPME
enables easy changing of the
extraction-phase polarity, which extends
the application range of the method.
The analysis of aqueous samples using
in-tube SPME–GC has been reported in the
literature.
9–11
For the extraction step, the
sample solution was pushed or pulled
through the capillary extractor at a
reasonable flow-rate. The adsorbed
analytes were then desorbed with a
minimum amount of stripping solvent for
off-line collection before chromatographic
analysis.
9
In addition, the capillary extractor
could be assembled manually in front of
the GC analytical column with a press-fit
connector and a piece of precolumn. A
temperature-programmed GC run
completed the procedure of both thermal
desorption and analysis.
10,11
Using those
approaches, researchers obtained
promising results and avoided the problems
that are observed with fibre SPME such as
the bleed from the ultra thick film and the
appearance of ghost peaks.
On-line extraction-capillary GC is an
attractive method for the analysis of
aqueous samples. Several methods for
on-line extraction GC have been reported
in the literature, including membrane
extraction,
12
liquid–liquid extraction
13
and
solid-phase extraction with small packed
cartridges.
14
In contrast to these
conventional methods, the complete
removal of water can be achieved easily by
using an open-tubular capillary. Mol and
co-workers
15
developed a method using
open-tubular trapping columns for on-line
extraction–capillary GC in the analysis of
aqueous samples. In that study, they used
two switching valves and organic solvent
for desorption.
In this instalment of “Sample Preparation
Perspectives,” we will present a novel
device for coupling on-line in-tube SPME
with capillary GC. We will demonstrate this
method’s application for the analysis of
contaminants in water.
Quantification
As shown in Equation 1, it is common for
analysts to calculate the theoretical
In-Tube Solid-Phase Microextraction
and On-Line Coupling with
High-Resolution GC
Hanwen Wang, Wenmin Liu and Yafeng Guan, Dalian Institute of Chemical Physics, Dalian, China.
The guest authors validated an in-tube solid-phase microextraction device, which was designed for on-line
coupling with a capillary gas chromatography system, for the trace analysis of organic contaminants in water.
They used a 5 m
0.53 mm, 1.2 µm
d
f
poly(dimethylsiloxane) phase capillary column as the in-tube
extractor. The dynamic extraction technique used a high sampling flow-rate, thermal desorption and valve
switching in a novel system design. Compared with classic SPME, the on-line in-tube SPME system
increased enrichment factors dramatically, and, because of on-line operation, improved the precision of
quantification. The cost per sample was the same as that of classic fibre SPME, and might even be lower in
long-term use because of the use of an ordinary switching valve and conventional GC column extractor.

3
www.lcgceurope.com
Sample Preparation Perspectives
Experimental
On-line in-tube SPME instrument
set-up and procedure: Figure 1 is a
schematic of the on-line in-tube SPME
device developed in our study. The system
consists of a six-port valve and three gas
flow controllers (both from Fuli Corp.,
Wenling, China), a homemade stainless
steel micro tee piece, a homemade 5 m
0.53 mm, 1.2 µm df conventional cross-
linked OV-1 (poly-[dimethylsiloxane])
capillary column used as extractor, and a
mini water-circulating pump (Tengda
Corp., Tianjing, China). A homemade oven
capable of heating at a rate of 290 °C/min
to temperatures greater than 320 °C
provided fast and uniform heating for the
capillary extractor. A deactivated 1 m
100 µm fused-silica capillary (Ruifeng,
Yongnian, China) in close contact with a
piece of heating resistor wire was used as
the analyte transfer line from the in-tube
SPME system to the GC system. An
adiabatic sleeve covered the transfer line
to maintain heat.
During the extraction period (the solid-
line position of the valve in Figure 1), the
sample solution was forced through the
capillary extractor by the push of auxiliary
Auxiliary
gas A
Auxiliary
gas B
Auxiliary
gas C
2
3
4
1
N
P
5
6
7
8
13
12
11
10
9
Oven
GC oven
Figure 1: Schematic diagram of the on-line in-tube SPME system coupled with the
high-resolution GC system. 1
six-port valve, 2 flow controller for
sampling, 3
flow controller for desorption gas, 4 flow controller for auxiliary
gas, 5
sample vial, 6 mini water-circulating pump, 7 micro tee piece,
8
capillary transfer, 9 capillary extractor, 10 precolumn, 11 press-fit or
micro union, 12
analytical column, 13 on-column injector.
In-tube SPME has been used in HPLC as an efficient and
simple preparation method, and it offers several
advantages over the fibre SPME syringe–LC approach…
Conceptually, it should preserve the advantages of SPME
and could offer improved enrichment efficiency,
quantification and automation through the on-line
coupling with a chromatograph.
recovery or to evaluate quantification
based upon equilibrium theory:
16
where n is the amount of extracted
analyte, C
0
the initial concentration of the
analyte in the matrix, K
D
the distribution
constant of the analyte, V
s
the volume of
the stationary phase and V
0
the volume of
sample.
A concept of negligible depletion
extraction was recently proposed for easier
quantification and higher enrichment
factors.
17
For in-tube SPME, the extraction
process will not influence the free
concentration of the analyte in the matrix
when a sufficient amount of sample
solution (quasi-infinite relative to extracting
phase volume) passes through the
extractor. In this instance, K
D
V
S
V
0
,
and the absolute amount of extracted
analyte can be easily obtained from
Equation 2:
n
K
D
VsC
0
[2]
n
C
0
[1]
K
D
V
s
K
D
V
s
V
o
(
(
1
gas and the suction force of the mini
water-circulating pump. A negative
pressure at the N point of the tee piece
was generated because of the suction of
the mini water-circulating pump. The head
pressure of the GC column forced the
carrier gas through the transfer line to the
tee piece (as shown on the Figure 1).
Because the pressure at point P is always
higher than that at point N, we avoided
the problem of direct influx of the aqueous
solution into the GC system during the
extraction process.
After the aqueous sample was drained
completely from the extractor, the six-port
valve was switched to the dotted-line
position for desorption. To achieve lower
detection limits in high-resolution GC and
to obtain a sharp desorption band, the
extractor should heat up as fast as possible
(at a rate as high as 290 °C/min). The
desorption of analytes from the capillary
extractor occurs very fast because they are
purged by the auxiliary gas through the
capillary. The thermal desorption time is
approximately 2–6 min for the 5 m
0.53 mm capillary column under a
6 mL/min purage-gas flow. Another path
of auxiliary gas at a flow-rate of
approximately 1–2 mL/min is used as
make-up gas through the tee piece to
prevent any back diffusion of analytes. It
must be noted that the desorbed
analytes are introduced directly to the
high-resolution GC system after the
switching valve, instead of through the
valve, to eliminate the possibility of any
carryover or dead volume along the sample
transfer line. However, using the high-
temperature switching valve is unnecessary
in this system design. The more expensive
valve is not required for this system design,
which makes the device less expensive.
Finally, the desorbed analytes were
transferred to the homemade cold
retention gap in the model 6890N gas
chromatograph (Agilent Technologies,
Beijing, China), with an initial oven
temperature of 30 °C, through the hot
capillary transfer line and were refocused
on the head of the analytical column by
the retention gap.
18
We used a sequential
temperature-programmed high-resolution
GC run to accomplish the separation and
detection of analytes of interest. Thus, the
total process of analysing organic
compounds in aqueous samples, including
the on-line extraction, thermal desorption
and sampling to high-resolution GC, was
automated using the above-mentioned
in-tube SPME device.
LC•GC Europe, 17(3), 144–151 (2004)
4
Sample Preparation Perspectives
Results and Discussions
Evaluation of on-line in-tube SPME
coupled with high-resolution GC: We
used aqueous samples containing a series
of alkanes (C
10
–C
19
) at the microgram-
per-litre level to evaluate the performance
of our apparatus. As Table 1 shows, the
in-tube SPME capillary extractor has an
increased amount of solid stationary phase
and a much larger exchanging surface,
when compared with the fibre SPME system,
which result in drastic increases of the
extraction efficiency and enrichment factor.
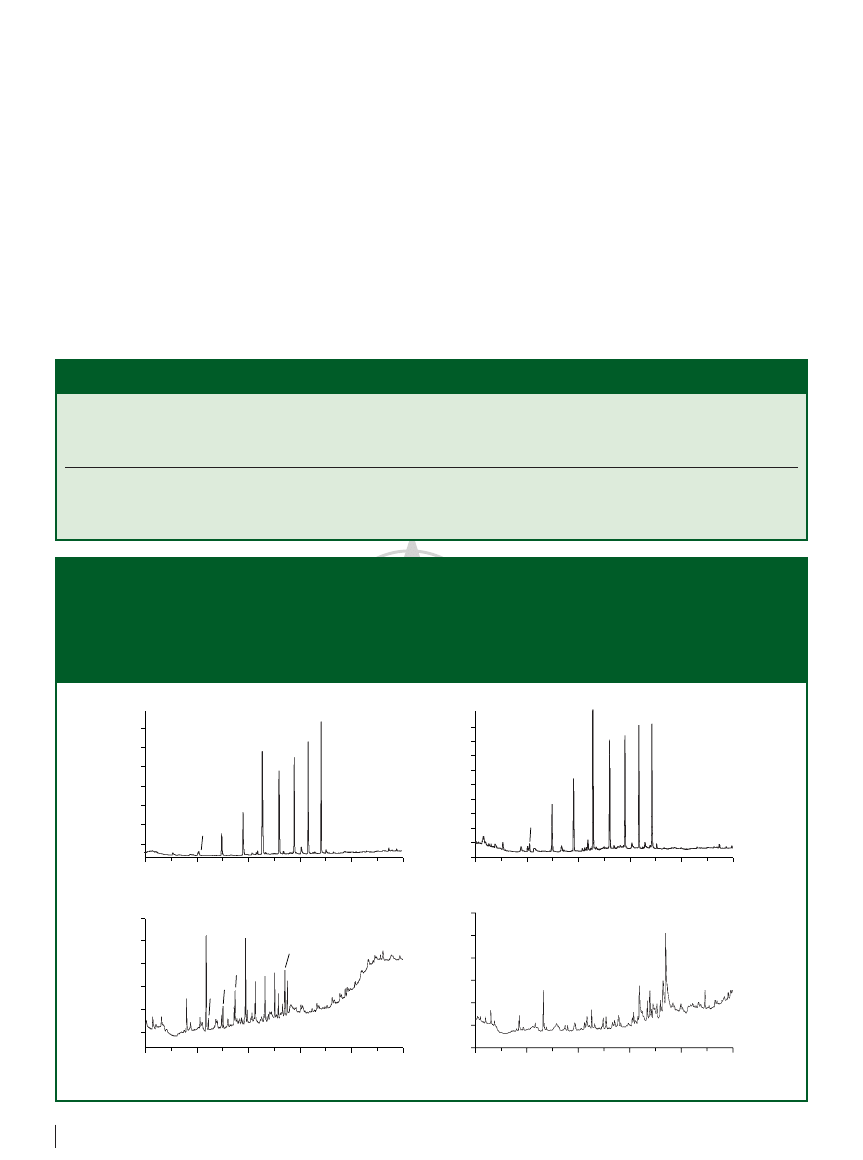
In the experiments, a 5 m
0.53 mm,
1.2 µm d
f
poly(dimethylsiloxane) phase
capillary extractor provides approximately
10 µL of solid phase for extraction, which is
roughly 10-fold more solid phase than that
of an SPME fibre (
1 µL). Figures 2(a) and
2(b) show that the extraction of the same
15 mL aqueous sample with a 10 µg/L
concentration of each alkane to obtain an
approximately 30-fold concentration of the
analytes of interest requires 2.5 min for
in-tube SPME versus 35 min for fibre SPME.
When the extraction time was limited to
5 min, we were able to extract only few
analytes of interest by fibre SPME [see Figure
2(d)]. However, with a 40-min extraction
time, the peaks obtained by in-tube SPME
are roughly 50-fold higher than that of fibre
SPME (extraction for 35 min), even for
components with concentrations as low as
2 µg/L [Figure 2(c)]. In addition, the baselines
of chromatograms from in-tube SPME are
very smooth because the capillary extractors
have thinner and stronger film of bonded
phase, and ghost peaks normally appear
with fibre SPME.
We performed six replicate experiments
of on-line extraction, desorption and
detection for each concentration of samples
to examine the method’s reproducibility.
The precision of quantification, obtained
using a 5 m
0.53 mm, 1.2 µm d
f
poly(dimethylsiloxane) capillary, varies from
5% to 15% relative standard deviation
(RSD) (for n
6), depending upon the
700
600
500
400
300
200
100
Response (pA)
1
2
3
4
5
6
7
8
(a)
2
4
6
8
10
12
90
80
70
60
50
40
Response (pA)
Time (min)
1
2
3
4
5
6 7
8
(b)
2
4
6
8
10
12
900
800
700
600
500
400
300
200
100
0
Response (pA)
1
2
3
4
5 6
7 8
(c)
2
4
6
8
10
12
90
80
70
60
50
40
30
Response (pA)
Time (min)
(d)
2
4
6
8
10
12
Figure 2: Comparison of chromatograms of spiked aqueous samples by in-tube SPME and fibre SPME: (a) extraction of 15 mL
samples within 2.5 min with alkanes of 10 µg/L level by on-line in-tube SPME; (b) extraction of 15 mL samples within 35 min with
alkanes of 10 µg/L level by fibre SPME; (c) extraction of 300 mL samples within 40 min with alkanes of 2 µg/L level by on-line
in-tube SPME; (d) extraction of 15 mL samples within 3 min with alkanes of 10 µg/L level by fibre SPME. Column: 30 m
0.53 mm,
0.6 µm d
f
MXT-1 (Restek Corp., Bellefonte, Pennsylvania, USA) with a 5 m retention gap; carrier gas: hydrogen at 8 mL/min; oven
programme: 30 °C for 0.5 min, 30–110 °C at 40 °C/min, 110 °C for 1 min, 110–250 °C at 10 °C/min, 250 °C for 10 min; fibre
desorption time in (b): 4 min. Peaks: 1
n-C
12
, 2
n-C
13
, 3
n-C
14
, 4
n-C
15
, 5
n-C
16
, 6
n-C
17
, 7
n-C
18
, 8
n-C
19
.
Extractor Type
Character of Extractants
Phase Volume
Exchanging Surface of
Type of Mixing
(µL)
Extraction (mm
2
)
During Extraction
Capillary extractor
Bonded on the inner wall
9.9852*
8321†
Turbulence of flow convection
100 µm apolar SPME fibre
Coated outside the fibre
0.9734‡
9.7§
Agitation by stirrer
* V
DidfL, where Di is the inner diameter of capillary tube, df is the film thickness of solid phase and L is the length of capillary column.
† A
DiL.
‡ V
DodfL, where Do is the outer diameter of fibre core ( 110 µm), d
f
is the coating film thickness of solid phase and L is the length of fibre (normally 10 mm).
§ A
DoL.
Table 1: Comparison of a typical apolar capillary extractor (5 m
0.53 mm, 1.2 µm df) and a 100 mm apolar SPME fibre.
5
www.lcgceurope.com
Sample Preparation Perspectives
alkanes and concentration of samples
studied. Table 2 shows the precision and
linearity for all compounds investigated
under different concentration conditions.
The average RSD was 8.0% for the 0.5 µg/L
concentration level and 5.3% for the 20
µg/L concentration level.
We determined linearity by extracting
spiked aqueous samples with
concentrations ranging from 0.1 µg/L to
100 µg/L. The method was linear
throughout at least three orders of
magnitude. The coefficient of correlation
achieved was better than 0.99 (Table 2). In
addition, we found no carryover or
memory effects with this on-line coupled
in-tube SPME–high-resolution GC system.
Applications of On-Line
In-Tube SPME Coupled with
High-Resolution GC
Determination of PAHs with on-line
in-tube SPME, high-resolution GC and
flame ionization detection: Polycyclic
aromatic hydrocarbons (PAHs) are an
important class of environmental pollutants
that represent a risk for living organisms
and human health. Among various
techniques of PAH determination, SPME
19
and stir-bar sorptive extraction
20
have
recently gained wide acceptance. For
sub-parts-per-billion level measurement,
the SPME device has a limited enrichment
factor; however, the stir-bar sorptive
extraction device, which has a two-orders-
higher enrichment factor than the SPME
system, needs several hours to reach
extraction equilibrium, especially for
four-ring and larger polynuclear compounds.
In addition, a number of manual steps are
necessary to successfully use the stir-bar
sorptive extraction technique.
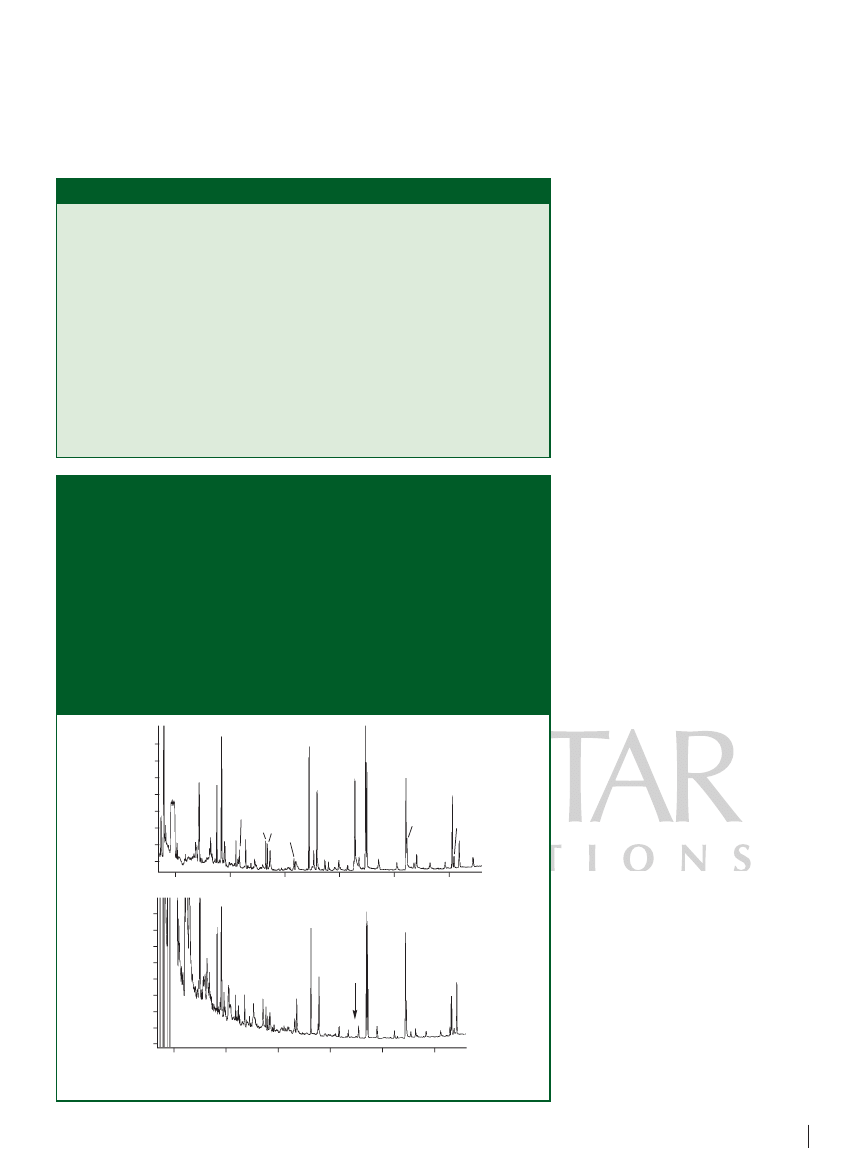
In our experiment, we examined 16 PAH
standards spiked in water at microgram-
per-litre or sub-microgram-per-litre
concentrations. We applied two types of
clean water as the sample matrices:
Wahaha purified drinking water (Wahaha
Corp., Hangzhou, China) [Figure 3(a)] and
tap water from the laboratory faucet
[Figure 3(b)]. The resulting chromatogram
[Figure (3)] shows that the 16 PAHs were
well separated without any tailing peaks.
The lowest detection limit for most PAHs
was estimated to be less than 0.01 mg/L,
much lower than that estimated by the
fibre SPME technique. In addition, the
overall extraction time was within 40 min
for sample volume of 400 mL, quite short
compared with stir-bar sorptive extraction
or fibre SPME. It was interesting to note
that trace amounts of plasticizers were
found in the purified water, but no peak of
butylbenzyl phthalate was found in the tap
water [Figure (3)]. However, many more
volatile compounds were in the tap water,
which we suspected were halogenated
hydrocarbons that resulted from the
chlorination process.
Determination of chlorinated
pesticides with on-line in-tube SPME,
high-resolution GC, and electron-
Alkanes Repeatability RSD* Repeatability RSD* Correlation
Detection
(%) for 0.5 µg/L
(%) for 20 µg/L
Coefficient† Limit‡
(S/N
3 µg/L)
n-C
12
14.8
11.3
0.996§
0.3
\
n-C
13
9.2
6.4
0.99
0.07
n-C
14
7.2
5.3
0.996
0.05
n-C
15
7.4
5.2
0.996
0.030
n-C
16
6.6
4.3
0.998
0.024
n-C
17
6.2
5.5
0.996
0.017
n-C
18
7.0
5.2
0.998
0.012/3#
n-C
19
5.8
4.7
0.993
0.01
*
n
6.
† Concentration range from 0.1 µg/L to 100 µg/L/L.
‡ Extraction flowrate: 10 mL/min for 300 mL samples of the lowest concentration of 0.1 µg/L.
§ Concentration range from 1 µg/L to 100 µg/L/L.
\
Detection with the lowest concentration of 1 µg/L/L.
# The lowest detection limit with the use of 100 µm poly(dimethylsiloxane) fibre.
225
200
175
150
125
100
75
50
Response (pA)
1
2
17
10
11
12
13
14
15
16
19
18
20
21
3
4
5 6
7
9
8
(a)
5 10 15 20 25 30
225
200
175
150
125
100
75
50
25
Response (pA)
No Peak
5
10
15
20
25
30
Time (min)
(b)
Figure 3: On-line in-tube SPME–GC–flame ionization detection chromatogram of
(a) Wahaha purified water and (b) tap water spiked with polyaromatic hydrocarbons.
Column: 30 m
0.53 mm, 0.6 µm d
f
DB-1 (Agilent Technologies, Wilmington,
Delaware, USA) with a 5 m retention gap; carrier gas: hydrogen at 8 mL/min; oven
programme: 30 °C for 0.5 min, 30–110 °C at 40 °C/min, 110 °C for 1 min, 110–300 °C
at 8 °C/min, 300 °C for 10 min. Peaks: 1
naphthalene (2 µg/L), 2 acenaphthylene
(2 µg/L), 3
acenaphthene (2 µg/L), 4 fluorine (0.2 µg/L), 5 phenathrene
(0.2 µg/L), 6
anthracene (0.2 µg/L), 7 fluoranthene (0.2 µg/L), 8 pyrene
(0.2 µg/L), 9
benzo[a]anthracene (0.2 µg/L), 10 chrysene (0.2 µg/L),
11
benzo[b]fluoranthene (0.2 µg/L), 12 benzo[k]fluoranthene (0.2 µg/L),
13
benzo[a]pyrene (0.2 µg/L), 14 indeno[1,2,3-cd]pyrene (0.2 µg/L),
15
dibenzo[a,h]anthracene (0.2 µg/L), 16 benzo[ghi]perylene (0.2 µg/L),
17
hexachlorocyclopentadiene, 18 diethyl phthalate,
19
N-nitrosodiphenylamine, 20 di-n-butylphthalate, 21 butylbenzyl phthalate.
Table 2: Precision, linearity and sensitivity of on-line in-tube SPME–high-resolution GC.
LC•GC Europe, 17(3), 144–151 (2004)
6
Sample Preparation Perspectives
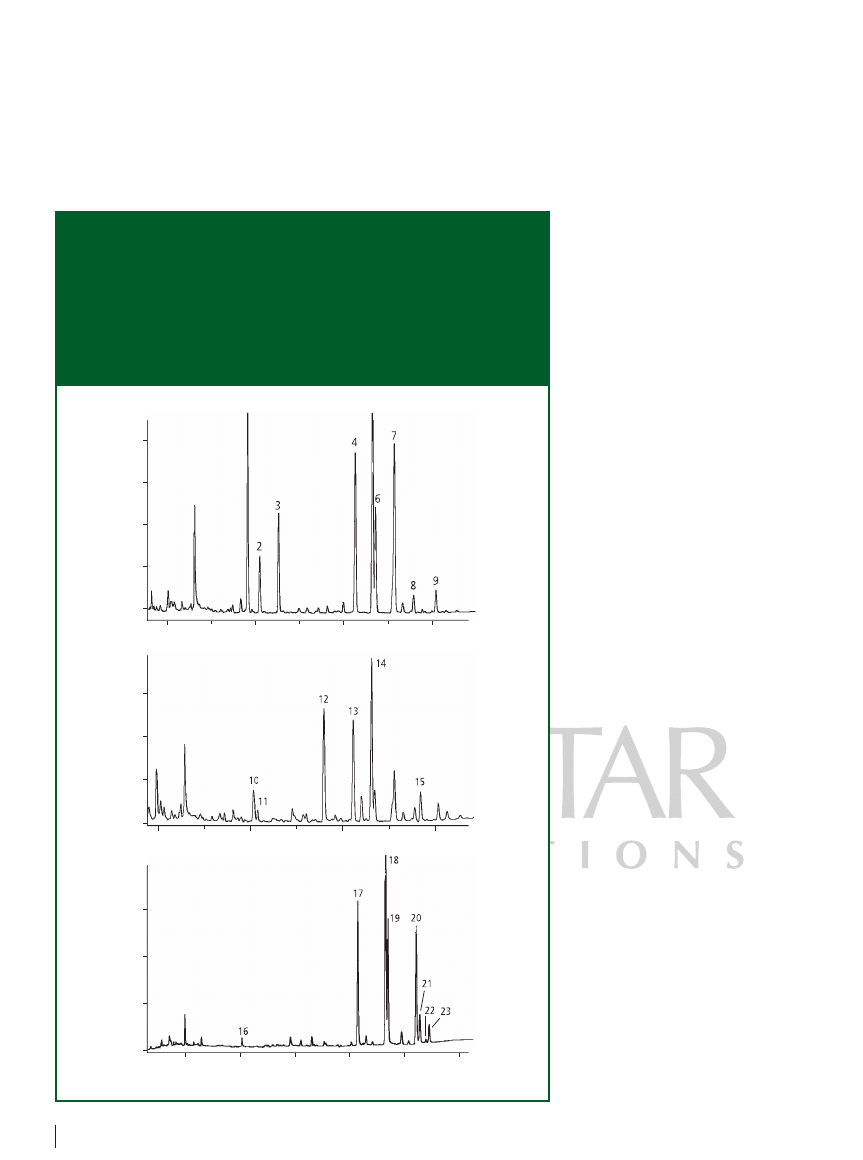
capture detection: To determine
chlorinated pesticides in aqueous samples,
we coupled our in-tube SPME device
on-line with a model 3800 capillary gas
chromatograph (Varian Inc., Palo Alto,
California, USA), which was equipped with
an electron-capture detector. We divided
standard mixtures of 26 total pesticides
into three groups, and each pesticide
compound was spiked directly into a silex
vial at the 0.25 µg/L level using a
microsyringe. Figure 4 depicts the resulting
chromatogram. It is noteworthy to point
out that the detectability of the peaks of
pp
-dichlorodiphenyltrichloro-ethane
(pp
-DDT) and iprodione, which are barely
detectable using GC systems that display
poor inertness, was rather good. The lowest
detection limits of some components such
as benzene hexachloride (BHC) were
estimated at the sub-nanogram-per-litre
level, which was obtained in only 5 min
with extraction of a 30 mL aqueous sample.
Actually, lower detection limits could be
reached by using a larger sample volume.
Determination of phosphorus-
containing pesticides with on-line
in-tube SPME, high-resolution GC, and
pulsed-flamephotometric detection:
We coupled the same apparatus on-line
with the capillary gas chromatograph, this
time equipped with a pulsed-flame
photometric detector (operated in the
phosphorus mode) to determine the
phosphorus-containing pesticides. We
spiked 16 standard pesticides at 0.5 µg/L
each in a 30 mL aqueous sample before
extraction, and the dilution of compounds
was performed in a silex vial using a
microsyringe. The chromatogram obtained
is illustrated in Figure 5. The lowest
detection limit observed was 0.05 µg/L for
most of the analytes with an extraction
time of only 5 min.
Conclusion
We performed in-tube SPME on-line
coupling with high-resolution GC by using
a simple device for the trace analysis of
organic compounds in aqueous samples.
The in-tube SPME–high-resolution GC
methods demonstrated in our study
successfully performed the on-line
extraction, desorption and sampling of
various contaminants in water, followed by
analysis of high-resolution GC with
different detectors. The novel in-tube
SPME–high-resolution GC device presents
the following advantages over manual fibre
SPME–high-resolution GC:
• It enables much higher enrichment
factors than those of fibre SPME because
of its 10-fold greater volume of
extracting phase compared with fibre
SPME. In our experiments, the
enrichment factors by means of in-tube
SPME were at least 50-fold that of fibre
SPME, if both experiments were
performed under optimum conditions,
even though the ratio of extracting
phase volume was approximately 10.
• It provides faster extractions than those
of fibre SPME because of the drastically
larger exchanging surface.
• It is performed as a fully on-line
operation; therefore, it provides high-
400
300
200
100
0
R
es
p
onse (mV)
1
5
5
10
15
20
150
100
50
0
R
es
p
onse (mV)
5
10
15
20
300
200
100
0
R
es
p
onse (mV)
5
10
15
20
25
30
Time (min)
Figure 4: On-line in-tube SPME–GC–ECD chromatograms of aqueous samples spiked
with chlorinated pesticides. Column: 30 m
0.53 mm, 0.6 µm d
f
DB-5 (Agilent
Technologies) with a 5 m retention gap; carrier gas: nitrogen at 8 mL/min; oven
programme: 30 °C for 0.5 min, 30–150 °C at 40 °C/min, 150 °C for 1 min, 150–280 °C at
7 °C/min, 280 °C for 10 min; detection: electron capture. Peaks: 1
-BHC, 2 -BHC,
3
-BHC, 4 op-DDE, 5 pp-DDE, 6 op-DDD, 7 pp-DDD, 8 pp-DDT,
9
iprodione, 10 lidane, 11 pentachloronitrobenzene, 12 vinclozolin,
13
keithane, 14 op-DDT, 15 cyhalothrin lambda, 16 dicloran,
17
fenpropathrin, 18 cis-permethrin, 19 trans-permethrin, 20 cis-fenvalerate,
21
trans-fenvalerate, 22 cis-deltamethrin, 23 trans-deltamethrin.

7
www.lcgceurope.com
Sample Preparation Perspectives
precision reproducibility.
• The technique’s cost is relatively low
because it uses conventional capillary
columns and an ordinary switching valve.
References
1.
C. Arthur and J. Pawliszyn, Anal. Chem., 62,
2145–2148 (1990).
2.
H. Lord and J. Pawliszyn, J. Chromatogr. A,
885, 153–193 (2000).
3.
D. Louch, S. Motlagh and J. Pawliszyn,
J. Anal. Chem., 64, 1187–1199 (1992).
4.
K.D. Buchlolz and J. Pawliszyn, J. Anal. Chem.,
66, 160–167 (1994).
5.
J. Chen and J. Pawliszyn, Anal. Chem., 67,
2520–2533 (1995).
6.
R. Eisert and K. Levsen, J. Chromatogr. A, 737,
59–65 (1996).
7.
R. Eisert and J. Pawliszyn, Crit. Rev. Anal.
Chem., 27, 103–135 (1997).
8.
R. Eisert and J. Pawliszyn, Anal. Chem., 69,
3140–3147 (1997).
9.
B.C. Dennis et al., Analyst, 124, 651–655 (1999).
10.
L. Nardi, “In-Tube SPME System for Trace
Determination of Organic Compounds in
Water by HRGC,” paper presented at the 23rd
International Symposium on Capillary
Chromatography, Riva del Garda, Italy, 5–10
June 2000.
11.
L. Nardi, Am. Lab., 34(1), 30–37 (2002).
12.
R.G. Melcher and P.L. Morabito, Anal. Chem.,
62, 2183–2188, (1990).
13.
E.C. Goosens et al., J. High Resolut.
Chromatogr., 13, 438–442 (1990).
14.
J.J. Vreuls, W.J.G.M. Cuppen and U.A.Th.
Brinkman, J. High Resolut. Chromatogr., 13,
157–161, (1990).
15.
H.G.J. Mol, H.-G. Janssen and C.A. Cramers,
J. High Resolut. Chromatogr., 16, 413–418
(1993).
16.
F. David, B. Tienpont and P. Sandra, LC•GC
Eur., 16(7), 410–417 (2003).
17.
L. Nardi, J. Chromatogr. A, 985, 85–91 (2003).
18.
E. Baltussen et al., J. Microcol. Sep., 11,
737–747 (1999).
19.
J.J. Langenfeld, S.B. Hawthorne and D.J.
Miller, Anal. Chem., 68, 144–148 (1996).
20.
E. Baltussen et al., J. Microcol. Sep., 11,
737–747 (1999)
Hanwen Wang
is an assistant professor at
the Dalian Institute of Chemical Physics,
Chinese Academy of Sciences, Dalian,
116012, China, and a technical support
engineer for Agilent Technologies (Shanghai),
e-mail han-wen_wang@agilent.com.
Wenmin Liu
is a PhD student at the Dalian
Institute of Chemical Physics, Chinese
Academy of Sciences.
Yafeng Guan
is a professor at the Dalian
Institute of Chemical Physics, Chinese
Academy of Science; the Director of the
Department of Analytical Chemistry and
Micro-instrumentation at the Dalian
Institute of Chemical Physics; a member of
the Scientific Committee on Chemistry of
the Chinese Academy of Sciences; Vice-
chairman of the Chinese Association of
Analytical Instrumentation; and a standing
member of the Chinese Society on
Chromatography.
25
20
15
10
8
Response (mV)
5
10
15
Time (min)
1
2
17
10
11, 12
13
14
15
16
3
4
5 6
7
9
8
Figure 5: On-line in-tube SPME–GC–pulsed-flame photometric detection
chromatogram of an aqueous sample spiked with phosphorus-containing chlorinated
pesticides. Column: 30 m
0.53 mm, 0.6 µm d
f
DB-5 (Agilent Technologies) with a
5 m retention gap; carrier gas: nitrogen at 8 mL/min; oven programme: 30 °C for
0.5 min, 30–150 °C at 40 °C/min, 150 °C for 5 min, 150–280 °C at 7 °C/min, 280 °C for
10 min. Peaks: 1
methamidaphos, 2 dichlorvos and trichlorfon(dylox), 3
unknown peak, 4
omethoate, 5 dimethoate, 6 propetamphos, 7 diazinon,
8
parathion methyl, 9 chlorpyrifos methyl and paraoxon, 10 pirimiphos methyl
and malathion, 11
parathion ethyl, 12 chlorpyrifos, 13 isofenphos and
quinalphos, 14
phoxim, 15 ethion, 16 imidan, 17 phosalone.
Wyszukiwarka
Podobne podstrony:
ESTRO BOOKLET 5 Practical guidelines for the impletation of in vivo dosimetry with diodes in extern
Design of an Artificial Immune System as a Novel Anomaly Detector for Combating Financial Fraud in t
Applications and opportunities for ultrasound assisted extraction in the food industry — A review
All That Glisters Investigating Collective Funding Mechanisms for Gold Open Access in Humanities Dis
Effect of?renaline on survival in out of hospital?rdiac arrest
Jak oglądać filmy on-line bez pobierania za DARMO, PROBLEMY
2001 12 Red Hat 7 2 on Test in the Linux Labs
Monocular SLAM–Based Navigation for Autonomous Micro Helicopters in GPS Denied Environments
A Review of The Outsiders Club Screened on?C 2 in October
Praca zaliczeniowa Dzieci on-line
Lekcja 5, ArchiCAD, praktyczny kurs on-line
Lekcja 10, ArchiCAD, praktyczny kurs on-line
Jak oglądać filmy on-line bez pobierania za DARMO, Instrukcja
Lekcja 15, ArchiCAD, praktyczny kurs on-line
Lekcja 3, ArchiCAD, praktyczny kurs on-line
Wprowadzenie i spis tresci, ArchiCAD, praktyczny kurs on-line
Lekcja 6, ArchiCAD, praktyczny kurs on-line
Call for Applications HIA Program in US 09
więcej podobnych podstron