
Sample Champion - Application note # 11
Room Acoustics - Acoustical Parameters Measurement
This application note describes how to use the Sample Champion Room Acoustics plugin for computing
RT20, RT30, RT custom, EDT, D50, C50, C custom and TS parameters (see the ISO 3382 normative).
Figure 1 - Room Acoustics plugin window
Room Response Measurement
First of all a Room Impulse Response has to be measured by using the main program, Sample
Champion. This kind of measurement is done by placing the sound source (fed by the MLS signal) and
the microphone (at listening position) inside the room under test. The sound field should be diffuse.
The ISO 3382 normative gives some guidelines for this kind of measurement (performed by using MLS
signals):
•
The sound source should be as close to omni-directional as possible
•
The sound pressure level might be low because the SNR can be increased by averaging several
measurement cycles
•
The microphone should be omni-directional
•
Microphone position should be far from the nearest reflecting surface at least 1/4 of wavelength,
i.e. normally about 1 m
•
The minimum microphone-source distance should be at least:
meters, where V is the room volume, c is the speed of sound and T is the expected reverberation time.
More information can be found in the ISO/DIS 3382 normative.
The room response can be measured by using Sample Champion simply by starting an average cycle of
measurements.
NOTE 1: The length of the MLS signal must be greater than the expected reverberation time, otherwise
the tail of the room impulse response will wrap at the beginning of the measurement (see
MLS theory
page
about this). For example, by using a sample rate of 48 kHz for a measurement in a large room with
reverberation time of about 2 s, a MLS length of 128K = 2719.7 ms must be used (or better 256K, to have
a larger margin).
NOTE 2: The measured Impulse Response gives information for the specific point of the room where the
microphone is placed.
RT20, RT30, RTcustom
The Room Impulse Response gives information about the reverberation time by mean of the Schroeder
Plot (a detailed explanation of this analysis technique is described in the
Application Note #12
)
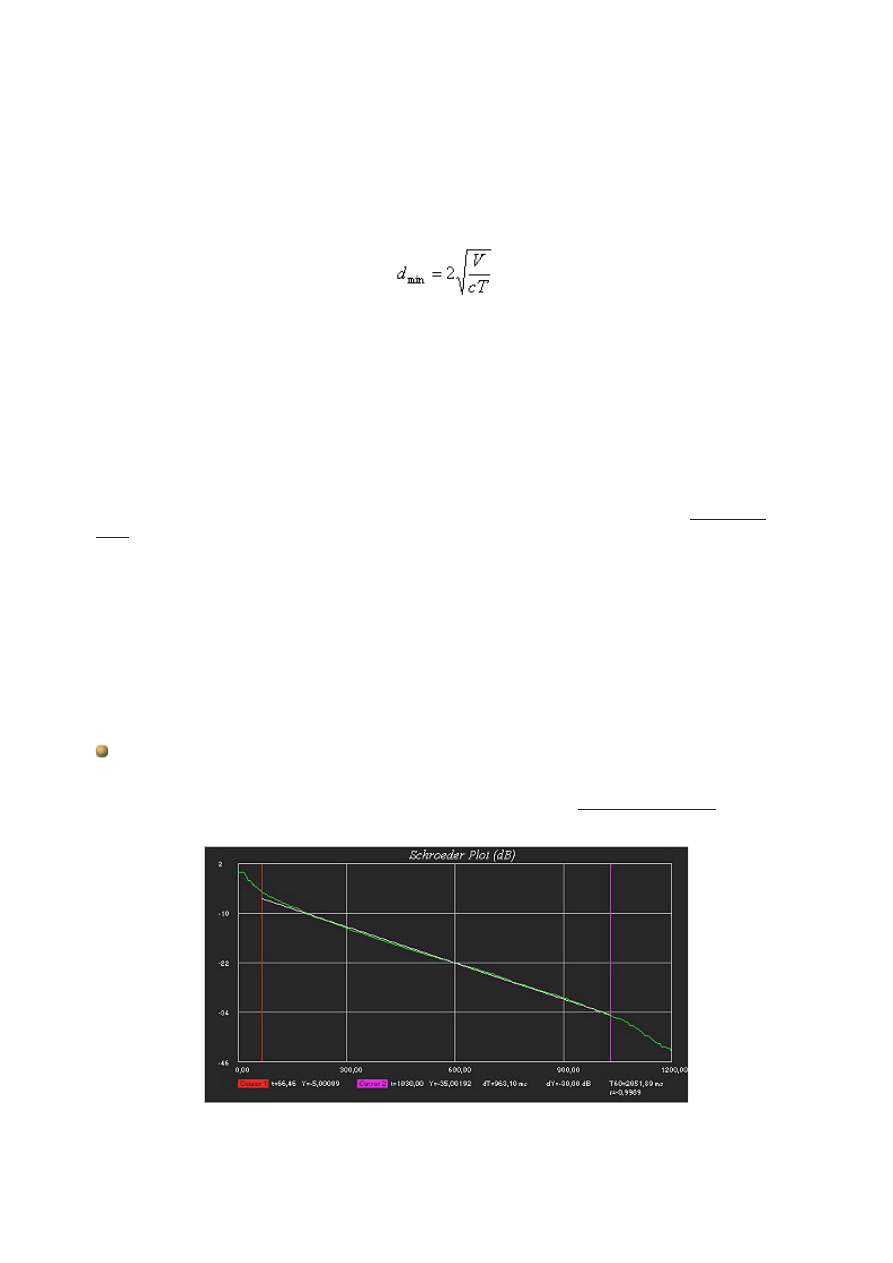
Figure 2 - RT30, obtained from the Schroeder Plot.
The white line is the regression line
RT20 is the reverberation time of the room (the time required for a sound decaying of 60 dB) evaluated
over a 20 dB decay range in the Schroeder Plot (from -5 to -25 dB), using linear regression techniques. It
is the time distance between the -5 dB and the -25 dB points of the Schroeder Plot, multiplied by 3
(actually the computation is more accurate because the plugin uses the values on the regression line).
RT30 is the reverberation time of the room evaluated over a 30 dB decay range (from -5 to -35 dB), using
linear regression techniques.
RTcustom is the reverberation time of the room evaluated over a decay range set by the user, using
linear regression techniques.
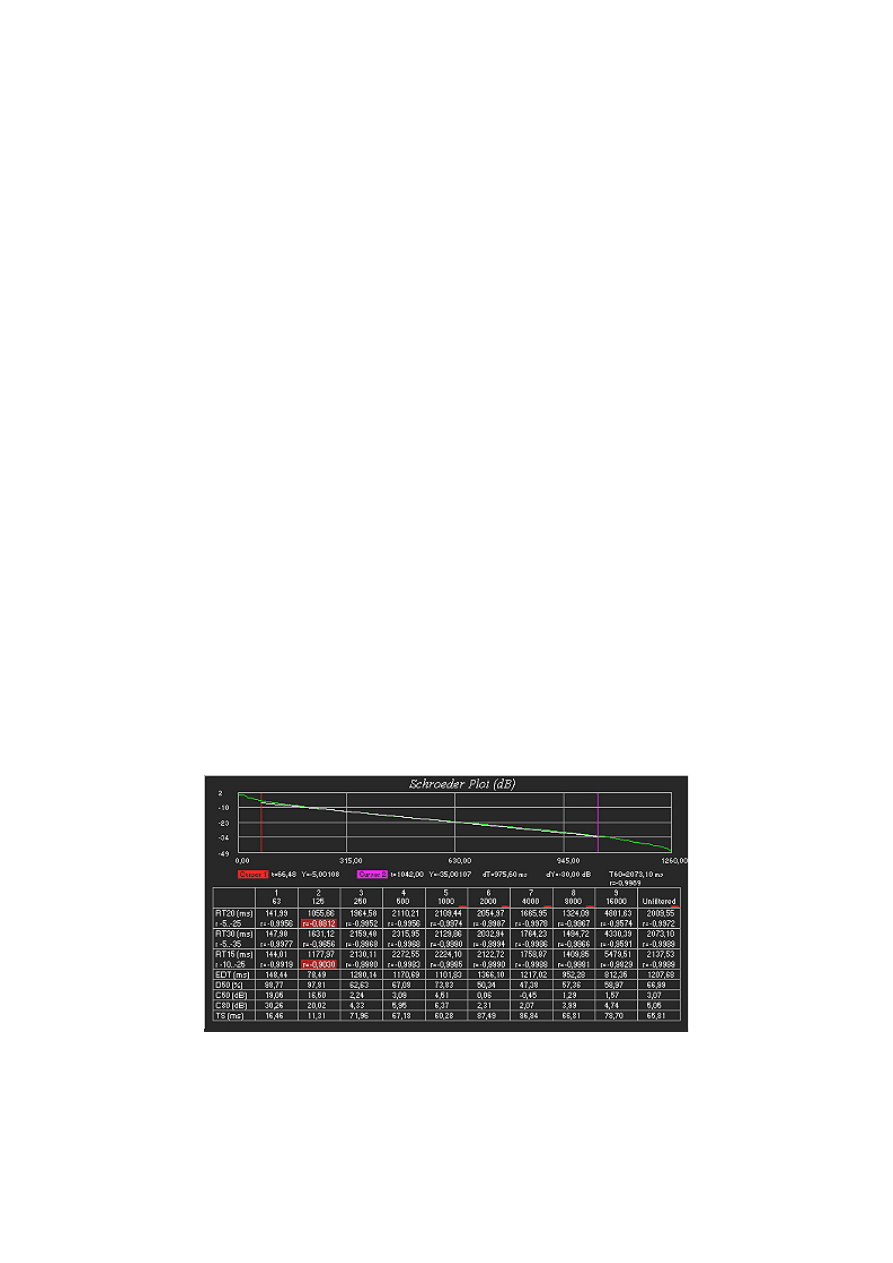
For every parameter, the correlation coefficient r is shown. A value close to -1 indicates a perfect fit of the
linear regression over the decay curve. When the value is greater than -0.95, a red alert is shown to
indicate a loss of accuracy.
The plugin allows computating these parameters manually on the unfiltered Schroeder Plot or on the
Schroeder Plot filtered in Octave or 1/3 Octave bands (standard IEC 1260). A noise compensation
algorithm is implemented and optionally used by the plugin, when possible. The user can choose whether
computing the noise floor power from the beginning (before the first peak) or at the end of the Impulse
Response (when the impulse has decayed under the noise level).
The values of these parameters are computed for all octave bands in a single step, by pressing the
"Show Parameters" button.
They can be viewed in tabular form or as a graph.
Figure 3 - RT30, computed for all octave bands
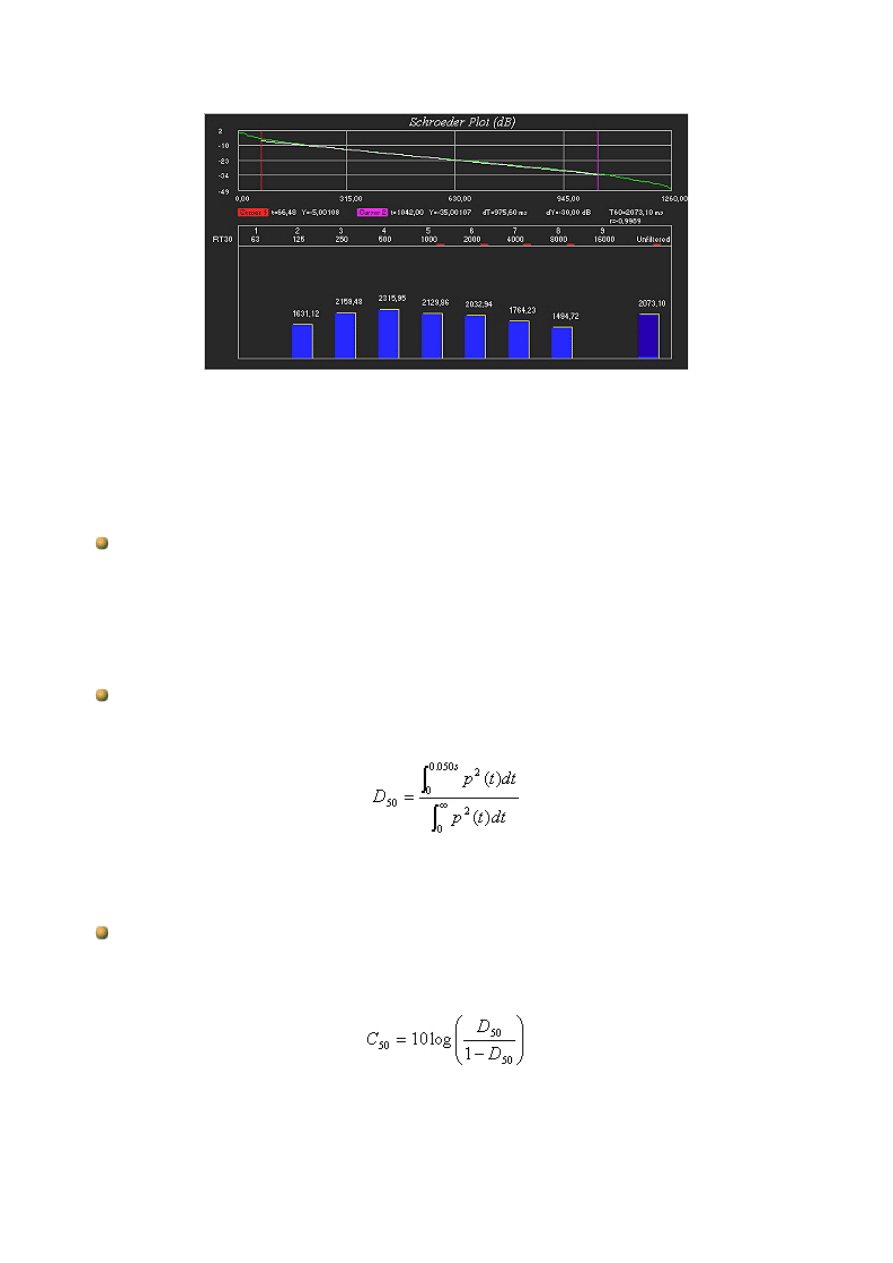
Figure 4 - RT30, graph for all octave bands
The noise compensation algorithm can be applied only when certain mathematical conditions are
satisfied. When this happens (and the noise compensation option is enabled), a small red rectangle is
shown near the octave band number.
EDT
The EDT parameter (Early Decay Time) is the reverberation time, measured over the first 10 dB of the
decay. This gives a more subjective evaluation of the reverberation time. The user can also change the
decay interval of this parameter. As RT parameters, the EDT is computed for every octave band. It is
expressed in ms.
D50
The D50 parameter (Definition or Deutlichkeit) is the early to total sound energy ratio. It is defined as:
and expressed in percentage.
C50, C custom
The C50 parameter (Clarity or Klarheitsmass) is the early to late arriving sound energy ratio. It is
defined as:
and expressed in dB. It is common practice to calculate this parameter also over 80 ms (C80). The user
can set this time interval (C custom).

TS
The TS parameter (Centre Time) is the time of the centre of gravity of the squared impulse
response. An high value is an indicator of poor clarity. It is defined as:
and expressed in ms.
Use of the Room Acoustics Plugin
A Room Impulse Response must be measured or loaded in the main program. If you load an I.R. file,
select in the Settings|General window a buffer and MLS lengths equal or greater than the I.R. length to be
loaded, otherwise the end of the impulse will be lost.
Open now the Room Acoustics plugin and press F5.
The impulse response can be shown in different ways (Data, Log Squared, Schroeder Integration, Step
Response and Cumulative Energy).
- Select "View Data as..." Schroeder Plot
- Press the "View ALL data" button (Unzoom)
- Uncheck Autoscale
- Enable the Filter and select the desired Octave or 1/3 Octave band
Now press the "RT20" button. The two cursors will be positioned at the -5 dB and -25 dB points of the plot
and the RT20 will be computed and shown in the right lower corner of the graphic screen. The position of
the cursors can be changed manually if desired.
NOTE: The noise compensation option leaves to the user the possibility to choose whether the noise
must be evaluated at the beginning or at the end of the I.R. file. The choice depends basically on the
considered Impulse Response. Probably when the initial silence gap before the first peak is short, it's
better to use the "End" option. This often occurs when measuring Room Impulse Responses in small
rooms and the source-microphone distance is low. When measuring an I.R. in large rooms or halls, it
could be useful to use the "Beginning" option. Anyway the number of points used for evaluating the
silence portion of the file is written by the plugin below the Noise Compensation Enable/Disable
checkbox. If the number of points is too low, try changing the option settings. Note that when the filter is
enabled the initial gap could become small or null; in these cases use the "End" option.
By pressing the "Show Parameters" button, all parameters will be computed and shown in a tabular form.
The values of the parameters can also be plotted as bar graphs, by selecting the "Ac. Par. Graph" in
"View" mode.
All computed parameters can be exported to Clipboard and the graphic plots can be saved to disk as
image files.
Copyright 2000 © Paolo Guidorzi & PureBits.com
All Rights Reserved.
http://www.purebits.com
Wyszukiwarka
Podobne podstrony:
Munster B , Prinssen W Acoustic Enhancement Systems – Design Approach And Evaluation Of Room Acoust
AJA Results of the NPL Study into Comparative Room Acoustic Measurement Techniques Part 1, Reverber
AES Information Document For Room Acoustics And Sound Reinforcement Systems Loudspeaker Modeling An
New possibilities in room acoustics measuring
Iannace, Ianniello, Romano Room Acoustic Conditions Of Performers In An Old Opera House
Nijs L , de Vries The young architect’s guide to room acoustics
IMPORTANCE OF EARLY ENERGY IN ROOM ACOUSTICS
Katz International Round Robin on Room Acoustical
Michael Vorlander Internationa Round Robin on Room Acoustical Computer Simulations
Modelling Room Acoustics
Martin Predicted and experimental results of acoustic parameters in the new Symphony Hall in Pamplo
ROOM ACOUSTIC SIMULATION AND AURALIZATION – WESPAC8
IEC 61400 11 (2002) [Wind turbine generator systems Acoustic noise measurement techniques] [WIND][5
Nijs L , de Vries The young architect’s guide to room acoustics
Claus Lynge Christensen Modelling Large Sound Sources in a Room Acoustical
Predicting Room Acoustical Behaviour with the ODEON
Gardner The Virtual Acoustic Room
Angelo Farina Acoustic Measurements In Opera Houses Comparsion
więcej podobnych podstron