
Modeling Virus Propagation in Peer-to-Peer
Networks
R.W. Thommes
Department of Electrical and Computer Engineering
McGill University
3480 University St, Montreal, QC, Canada H3A 2A7
Email: rthomm@tsp.ece.mcgill.ca
M.J. Coates
Department of Electrical and Computer Engineering
McGill University
3480 University St, Montreal, QC, Canada H3A 2A7
Email: coates@ece.mcgill.ca
Abstract— The popularity of peer-to-peer (P2P) net-
works makes them an attractive target to the creators
of viruses and other malicious code. Indeed, recently a
number of viruses designed specifically to spread via P2P
networks have emerged. In this paper we present a model
which predicts how a P2P-based virus propagates through
a network. This model is a modified version of the S-E-
I (Susceptible-Exposed-Infected) model from the field of
epidemiology. Our model classifies each peer as falling
into one of three categories based on the number of
infected files it is sharing. We derive differential equations
which comprise the deterministic model and examine the
expected behaviour of the P2P network as predicted by
these equations.
Keywords—peer-to-peer networks, viruses, epidemiology
I. I
NTRODUCTION
Several factors make peer-to-peer (P2P) networks par-
ticularly susceptible to the spreading of malicious code.
The early P2P networks such as Napster could only be
used to trade MP3 files, which essentially cannot contain
malicious code [1]. However, contemporary P2P net-
works such as Kazaa / Fastrack [2] and eDonkey2000 [3]
are able to disseminate executable files which may
contain viruses. As P2P has increasingly entered the
mainstream – the eDonkey2000 network alone typically
has over 2 million users connected at any given time [4]
– many users lack the technical knowledge to detect
suspicious files or scan for viruses. As a result, malicious
files may not be rapidly contained.
In this paper we examine how files infected with
viruses propagate through a P2P network. We begin by
presenting a relatively simple model in Section II and
describing its various parameters. Next, in Section III
we derive several differential equations that govern the
expected evolution of the network over time. In Sec-
tion IV we analyze the steady-state behaviour of our
model. Finally, in Section V we examine the effect that
varying a number of model parameters has on the steady-
state behaviour of the network.
A. P2P Network Overview
This section highlights the key features shared by
popular P2P Networks, including Kazaa, eDonkey2000,
and Gnutella [5]. Every peer connected to the network
has a shared folder containing all the files the user wishes
to make publicly available for download by others on the
network. When a user wants to download a file, he begins
by sending out a search request. Eventually he will
receive back a list of files matching the search criteria.
The specific manner in which this list is generated varies
among the various P2P networks, but in all cases the
query response is the result of the examination of the
shared folders of a subset of all peers connected to
the network. Once the user elects to download one of
the files from the list, his client attempts to set up a
connection to a peer sharing the file and begins receiving
the file. Depending on the specific network, the client
may attempt to simultaneously download different parts
of the file from a number of peers in order to expedite
the operation. P2P clients typically save new downloaded
files in the shared folder – making them immediately
available to other users.
A number of worms and viruses that exploit P2P
networks have already surfaced. The majority of these
behave in a similar fashion. Specifically, when a user
downloads a file containing the virus and executes it,
a number of new files containing the virus are created
and placed in the client’s shared directory. Some types
of viruses, including Achar [6] and Gotorm [7], generate
a fixed list of filenames when executed. More advanced
viruses, such as Bare [8] and Krepper [9], randomly pick
the list of filenames from a large pool of candidates.

B. Related Work
The advent of mathematical Epidemiology – the field
of biology which models how diseases spread in a
population – is generally credited to McKendrick and
his seminal 1926 paper [10]. Previous work in applying
epidemiology to modeling how computer viruses and
other malware spreads between machines dates back
to the early 1990s: Kephart and White published a
paper [11] on the topic in 1991. More recently, Zou et al.
utilized epidemiology to model the spread of the Code
Red across the Internet [12].
There have been a number of recent papers which
model file propagation in P2P networks. Two notable
examples include a 2005 paper by Dumitriu et al. [13]
which models the spread of polluted files in P2P net-
works, and a 2004 paper by Qiu and Srikant [14] which
models the performance of the BitTorrent P2P protocol.
II. M
ODEL
D
ESCRIPTION
The intent of our model is to predict the expected
behaviour of a virus which spreads through a P2P
network in the form of malicious code embedded in ex-
ecutable files shared by peers. We make the simplifying
assumption that all users download files to their shared
folder. We are not concerned with the transfer of media
files which cannot contain malicious code, and do not
model them. Note that we use the term user in this paper
to refer to a person using a P2P client program. The term
peer is used to collectively refer to a P2P client and the
user directing its behaviour.
This model classifies all peers as falling into one of
three classes: Susceptible, Exposed, or Infected:
Susceptible – Peers that are not sharing any infected
files, but are at risk of downloading infected files. The
number of peers in this category at time
t is denoted by
S(t).
Exposed – Peers that have downloaded one or more
infected files, but have not executed them. The number
of peers in this category at time
t is denoted by E(t).
Infected – Peers that have executed an infected file.
Upon execution, a total of of
c infected files reside in
the peer’s shared folder. The number of peers in this
category at time
t is denoted by I(t).
An Infected client may be detected by the user, who
will then proceed to remove all the infected files, thereby
returning the state of the peer to Susceptible. At all times,
every one of the
N peers making up the network falls
into one of the three categories. Thus, for all values of
t, N = S(t) + E(t) + I(t).
We assume that the total number of uninfected files
in the network is fixed at
M . The total number of
infected files at time
t is given by K(t). The expected
proportion of infected files in the network,
q(t), is
therefore
q(t) =
K(t)
K(t)+M
. When a user downloads a
file, we assume the probability of choosing an infected
file will be dependent on the prevalence of infected files
in the network. We model this dependence as being
time-invariant in the sense that it only depends on the
current value of
q(t), and denote the function mapping
q(t) to the probability of downloading an infected file
as
f {q(t)}. In Section IV we set f {q(t)} = αq(t) to
simplify our analysis. However, we concede that this may
not necessarily reflect the download behaviour in P2P
networks in an accurate manner.
There are three distinct events that may occur in the
network which affect one or more of the time-varying
variables described above. These events include a peer
downloading a file from another, a peer executing a
shared file, and an Infected peer recovering. The average
rates at which each of these events occurs are governed
by three parameters:
λ
S
: Average rate, in files per minute, at which
each peer downloads new files (this includes time spent
searching and setting up the connection to another peer).
λ
E
: Average rate, in files per minute, at which
each peer executes shared files. We assume that a peer
executes files in the order in which they are downloaded.
λ
R
: Average rate, in “recoveries per minute”, at
which Infected peers recover. A recovery occurs when
all infected files are removed, returning the peer state
to Susceptible.
III. M
ODEL
E
QUATIONS
Table I summarizes which time-varying variables are
affected by each of the three events that may occur in
the network:
The state progression for all peers in our model is
S → E → I → S.... We now derive the differential
equations that govern the evolution of our P2P model.
A. Rate at which number of Infected peers change
When an Infected peer recovers, the number of In-
fected peers decreases by one. Recoveries occur at rate

Event
Variables Affected
File downloaded
q(t), S(t), E(t)
File executed
q(t), E(t), I(t)
Peer recovers
q(t), I(t), R(t)
TABLE I.
Variables potentially affected by each possible event
λ
R
I(t). When an Exposed peer executes an infected file,
the number of Infected peers increases by one. Since files
are executed in order of download, the file executed by
an Exposed peer will always be the infected file which
it had downloaded to become Exposed . This occurs at
a rate of
λ
E
E(t). Therefore,
dI(t)
dt
= −λ
R
I(t) + λ
E
E(t)
(1)
B. Rate at which number of Exposed peers change
The rate at which the number of Exposed peers
decreases due to infection is given by the negative of
the second term in (1). The rate at which previously
Susceptible peers become Exposed is dependent on the
aggregate rate at which they download files:
λ
S
S(t),
multiplied by the probability that a downloaded file is
infected:
f {q(t)}. The overall rate is therefore:
dE(t)
dt
= −λ
E
E(t) + λ
S
S(t)f {q(t)}
(2)
C. Rate at which number of Susceptible peers change
This is governed by the negatives of the the first term
in (1) and the second term in (2):
dS(t)
dt
= −λ
S
S(t)f {q(t)} + λ
R
I(t)
(3)
D. Rate at which number of infected files in the network
changes
There are three events which result in a change in
the number of infected files in the network: a peer
downloads an infected file, an Exposed peer becomes
Infected, and an Infected peer recovers. We assume that
all downloaded files are executed, and that a peer does
not download any additional files prior to executing the
most recently downloaded file.
Peers cannot share more than one copy of a file with
the same name. If the number of unique filenames is lim-
ited to
c, only Susceptible peers can download infected
files. Exposed peers do not download any additional files
before becoming Infected, and Infected peers are sharing
all
c possible infected files. Thus, the rate of change due
to downloads is
S(t)λ
S
f {q(t)}.
An Exposed peer always has one infected file before
becoming Infected, meaning in all cases
c − 1 new
infected files are created when an Exposed peer becomes
Infected. The rate of change is thus
E(t)λ
S
(c − 1).
An Infected peer will always share
c files, so a
recovery results in a reduction of
c infected files. The
rate is therefore
−I(t)λ
R
c. The overall rate of change
of
K is therefore:
dK(t)
dt
= S(t)λ
S
f {q(t)}+E(t)λ
E
(c−1)−I(t)λ
R
c (4)
We note that if the names of generated files are chosen
from a pool of names
>> c, Infected peers can continue
to download infected files and the above equation does
not hold. However, we will not consider this case in any
additional detail in this paper.
IV. S
TEADY
-
STATE
B
EHAVIOUR
If the P2P network reaches a steady-state equilibrium
by some time
t = T , then
dE(T )
dt
=
dI(T )
dt
=
dS(T )
dt
= 0.
Defining ˜
E, ˜
I, ˜
S, as the steady-state values of, respec-
tively,
E(t), I(t), and S(t), Equation (1) implies that:
˜I = ˜E λ
E
λ
R
(5)
If we define
τ and µ as, respectively, the expected
number of infected files each Exposed and Infected
peer is sharing in steady-state, then
˜q, the proportion
of infected files in steady-state may be expressed as:
˜q =
˜
Eτ + ˜
Iµ
M + ˜
Eτ + ˜
Iµ
(6)
Substituting (5) into (6) provides:
˜q =
˜
E(τ λ
R
+ µλ
E
)
M λ
R
+ ˜
E(τ λ
R
+ µλ
E
)
(7)
If
f {˜
q} > 0, equation (2) implies that, in steady state:
˜
S = ˜
E
λ
E
λ
S
f {˜
q}
(8)
Since ˜
S = N − ˜
I − ˜
E, equation (5) can be utilized to
express
N as:
˜
S = N − ˜
E(1 +
λ
E
λ
R
)
(9)
If
f {q(t)} is proportional to q(t): f {q(t)} = αq(t),
we may obtain a closed-form expression for ˜
E by
substituting (7) into (8), equating with (9), and solving
for ˜
E:
˜
E =
λ
R
α(N λ
S
(µλ
E
+ τλ
R
) − Mλ
E
λ
R
)
(τλ
R
+ µλ
E
)(λ
S
α(λ
R
+ λ
E
) + λ
E
λ
R
)
; ˜q > 0
(10)
The expression for ˜
I follows trivially from (10)
and (5):
˜I = λ
E
α(N λ
S
(µλ
E
+ τλ
R
) − Mλ
E
λ
R
)
(τλ
R
+ µλ
E
)(λ
S
α(λ
R
+ λ
E
) + λ
E
λ
R
)
; ˜q > 0
(11)
If
˜q = 0, it follows from (6) that ˜
E = ˜
I = 0. It is of
interest to consider Equation (11) as it approaches 0. In
the limiting case, approached from above, we have the
equality
N λ
S
(µλ
E
+ τλ
R
) = Mλ
E
λ
R
(12)
Since we assume that all downloaded files are eventually
executed, it follows that
λ
E
= λ
S
if we consider these
rates to be averaged over a sufficiently long interval.
Under this assumption, (12) provides the following min-
imum average recover rate,
λ
min
R
in order for all infected
files to eventually be removed from a P2P network:
λ
min
R
=
N µλ
E
M − N τ
; M > Nτ
(13)
This equation indicates that, if
f {q(t)} = αq(t), then
λ
min
R
is a linearly increasing function of
λ
E
.
V. R
ESULTS
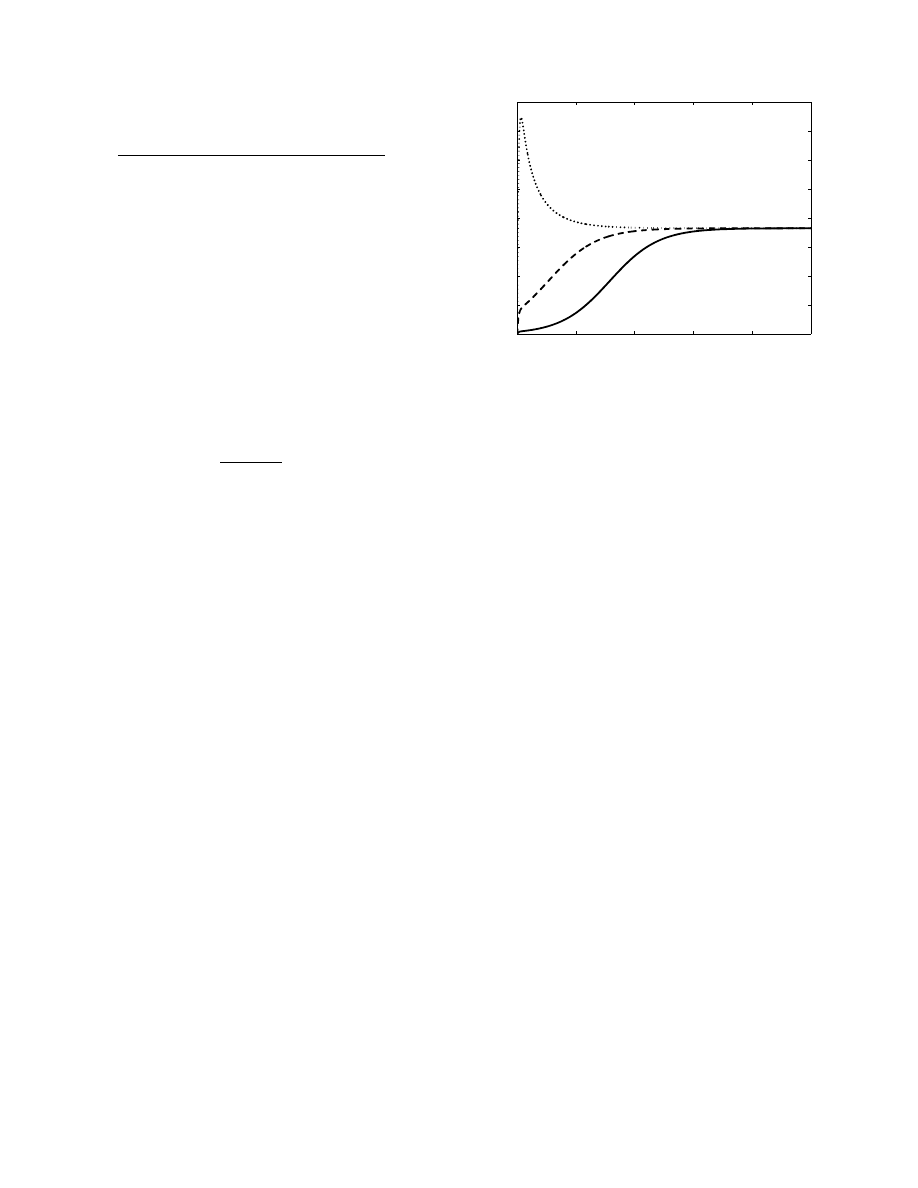
In this section we provide some examples of virus
behaviour in P2P network predicted by our model. The
value of
τ is 1 and µ = c, which follows from the
discussion in Section III-D. Figure 1 illustrates how the
number of peers falling into each of the three categories
evolve over time, and eventually reach a steady state.
In this case,
λ
E
= λ
S
= 3.47 × 10
−3
files per minute,
which corresponds to 5 downloads per day. The average
time for a peer to recover is 24 hours, meaning
λ
R
is
6.94 × 10
−4
. The number of peers,
N , is 2 million and
there are 60 million clean files
M . This example makes
use of the model in which the number of unique possible
files is limited to
c, and c is 10. Finally, f {q(t)} =
0.5q(t). Initially, there are 10 000 Exposed peers, each
sharing one infected file.
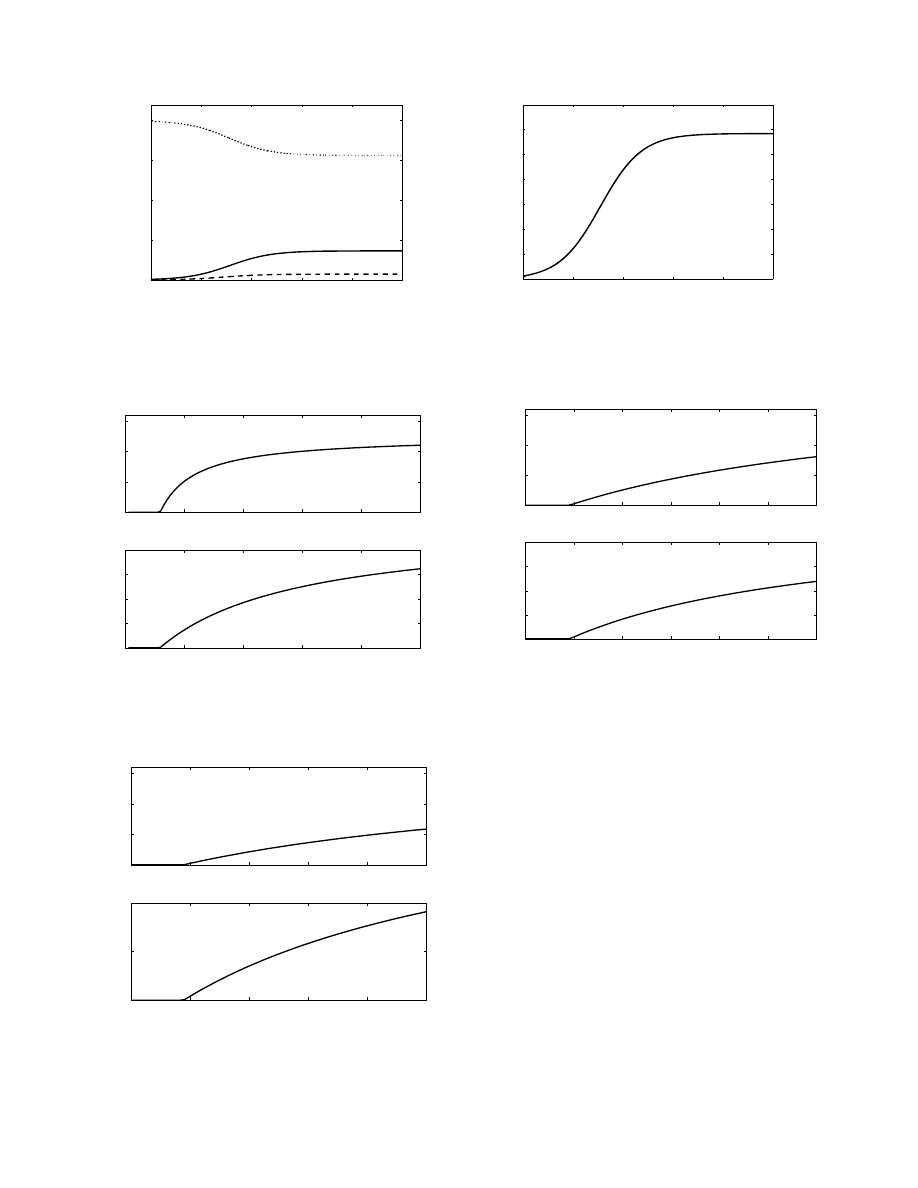
In Figure 2 we examine the number of infected
peers in the network when varying the initial number
of infected peers. After about 700 hours, the three
networks reach the same steady-state. This is also the
behaviour implicitly predicted by equation 11, since it is
independent of any initial condition (as long as at least
one infected file initially exists in the network).
Figures 3, 4, and 5 examine the effect that, respec-
tively,
c, α, and λ
E
have on the steady-state number of
infected peers and the proportion of infected files. The
relationship between the number of infected peers and
0
200
400
600
800
1000
0
1
2
3
4
5
6
7
8
x 10
5
Time (hours)
Number of Infected Peers
Fig. 2.
The number of infected peers vs. time for different initial
conditions. The solid line corresponds to 10 000 infected files initially
in the network, the dashed line: 100 000 initial infected files, the
dotted line: 1 000 000 initial infected files
files and both
α and λ
E
may be approximated as linear
over the ranges considered, whereas the dependence on
c suggests a log-function.
VI. C
ONCLUSION
We have presented a model of how infected files
spread in a P2P network, and derived expressions for the
steady-state behaviour in the case where the probability
of a peer downloading an infected file is proportional to
the prevalence of infected files in the network. In future
work we will derive a function mapping file popularity
to download rates in a manner that more closely mirrors
user behaviour in an actual P2P network and model the
dynamics of a virus that can choose file names from a
pool much larger than
c.
R
EFERENCES
[1] F-Secure,
“F-secure hoax information pages: Mp3 virus,”
http://www.f-secure.com/hoaxes/mp3.shtml, 1998.
[2] “Kazaa,” www.kazaa.com.
[3] “Edonkey2000,” www.edonkey2000.com.
[4] “eDonkey2000 server list,” http://ocbmaurice.no-ip.org/slist
/serverlist.html.
[5] “Gnutella protocol development,” http://rfc-gnutella.
sourceforge.net.
[6] Viruslist.com, “P2p-worm.win32.achar.a,” http://www.viruslist.
com/en/viruses/encyclopedia?virusid=23893, May 2003.
[7] Symantec, “W32.hllw.gotorm,” http://securityresponse.
symantec.com/avcenter/venc/data/w32.hllw.gotorm.html,
August 2003.
[8] Viruscan, “W32/bare.worm,” http://www.virus-scan-software
.com/latest-virus-software/latest-viruses/w32bare-worm.shtml,
2003.
[9] Sophos, “Sophos virus analysis: Troj/krepper-g,” http://www
.sophos.com/virusinfo/analyses/trojkrepperg.html, July 2004.
0
200
400
600
800
1000
0
0.5
1
1.5
2
x 10
6
Time (hours)
Number of Peers
Susceptible Peers
Exposed Peers
Infected Peers
(a) The number of peers in each group
0
200
400
600
800
1000
0
0.01
0.02
0.03
0.04
0.05
0.06
0.07
Time (hours)
Proportion of Infected Files
(b) The proportion of infected files
Fig. 1.
Example of the dynamic behaviour of a P2P network exposed to a virus. The network reaches steady-state after about 600 hours.
0
5
10
15
x 10
5
Number of Infected Peers
0
20
40
60
80
100
0
0.2
0.4
0.6
0.8
c
Proportion of Infected Peers
Fig. 3.
Examining the effect of
c on the steady-state number of
infected peers and infected files.
0
5
10
15
x 10
5
Number of Infected Peers
0.5
0.6
0.7
0.8
0.9
1
0
0.05
0.1
α
Proportion of Infected Files
Fig. 4.
Examining the effect of
α on the steady-state number of
infected peers and infected files.
0
5
10
15
x 10
5
Number of Infected Peers
0.2
0.25
0.3
0.35
0.4
0.45
0.5
0
0.05
0.1
0.15
0.2
Download Rate (Files per Hour)
Proportion of Infected Files
Fig. 5.
Examining the effect of
λ
E
on the steady-state number of
infected peers and infected files.
[10] A.G. McKendrick, “Applications of mathematics to medical
problems,” Proc. Edinb. Math. Soc., vol. 44, pp. 98–130, 1926.
[11] J.O. Kephart and S.R. White, “Directed-graph epidemiological
models of computer viruses,” in Proc. IEEE Symp. Security and
Privacy, Oakland, CA, May 1991.
[12] C.C. Zou, W. Gong, and D. Towsley, “Code red worm propa-
gation modeling and analysis,” in Proc. ACM Conf. Computer
and Comm. Soc., Washington DC, Nov 2002.
[13] D. Dumitriu, E. Knightly, A. Kuzmanovic, I. Stoica, and
W. Zwaenepoel, “Denial-of-service resilience in peer-to-peer
file-sharing systems,” in Proc. ACM Sigmetrics, Banff, Canada,
June 2005.
[14] D. Qiu and R. Srikant, “Modeling and performance analysis of
bittorrent-like peer-to-peer networks,” in Proc. ACM Sigcomm,
Portland, OR, Aug. 2004.
Wyszukiwarka
Podobne podstrony:
Biological Models of Security for Virus Propagation in Computer Networks
Implications of Peer to Peer Networks on Worm Attacks and Defenses
Mobile Multimedia In Context To Atm Transport And Gsm Gprs Mobile Access Networks
Network Virus Propagation Model Based on Effects of Removing Time and User Vigilance
Modeling the Effects of Timing Parameters on Virus Propagation
Virus Spread in Networks
A unified prediction of computer virus spread in connected networks
Email Virus Propagation Modeling and Analysis
11 3 4 6 Lab Using the CLI to Gather Network?vice Information
79 1111 1124 The Performance of Spray Formed Tool Steels in Comparison to Conventional
Kopelmann, Rosette Cultural variation in response to strategic emotions
Virus Propagated
11 3 4 6 Lab Using the CLI to Gather Network (2)
Gardner A Multiplicity of Intelligences In tribute to Professor Luigi Vignolo
Judaism's Transformation to Modernization in Relation to Ame
Not in a Humour to Wait
Computer Virus Propagation Model Based on Variable Propagation Rate
Internet Worm and Virus Protection in Dynamically Reconfigurable Hardware
The Effect of DNS Delays on Worm Propagation in an IPv6 Internet
więcej podobnych podstron