
ORIGINAL PAPER
Effects of serum proteins on corrosion behavior of ISO 5832
–9
alloy modified by titania coatings
Barbara Burnat
&
Tadeusz Blaszczyk
&
Andrzej Leniart
Received: 29 November 2013 / Revised: 28 July 2014 / Accepted: 15 September 2014 / Published online: 26 September 2014
# The Author(s) 2014. This article is published with open access at Springerlink.com
Abstract Stainless steel ISO 5832
–9 type is often used to
perform implants which operate in protein-containing physi-
ological environments. The interaction between proteins and
surface of the implant may affect its corrosive properties. The
aim of this work was to study the effect of selected serum
proteins (albumin and
γ-globulins) on the corrosion of ISO
5832
–9 alloy (trade name M30NW) which surface was mod-
ified by titania coatings. These coatings were obtained by sol
–
gel method and heated at temperatures of 400 and 800 °C. To
evaluate the effect of the proteins, the corrosion tests were
performed with and without the addition of proteins with
concentration of 1 g L
−1
to the physiological saline solution
(0.9 % NaCl, pH 7.4) at 37 °C. The tests were carried out
within 7 days. The following electrochemical methods were
used: open circuit potential, linear polarization resistance, and
electrochemical impedance spectroscopy. In addition, surface
analysis by optical microscopy and X-ray photoelectron spec-
troscopy (XPS) method was done at the end of weekly corro-
sion tests. The results of corrosion tests showed that M30NW
alloy both uncoated and modified with titania coatings ex-
hibits a very good corrosion resistance during weekly exposi-
tion to corrosion medium. The best corrosion resistance in
0.9 % NaCl solution is shown by alloy samples modified by
titania coating annealed at 400 °C. The serum proteins have no
significant effect onto corrosion of investigated biomedical
steel. The XPS results confirmed the presence of proteins on
the alloy surface after 7 days of immersion in protein-
containing solutions.
Keywords Corrosion . Corrosion rate . Biomedical steel .
Serum proteins . Sol
–gel coating . Titanium dioxide
Introduction
The term
“biomaterial” was defined by Williams (1987) as any
substance (other than a drug) or combination of substances,
synthetic or natural in origin, which can be used for any period
of time as a whole or as a part of a system which treats,
augments, or replaces any tissue, organ, or function of the body
[
]. Metals, polymers, ceramics, and composites may be used as
biomaterials. Each type of these materials has specific properties
which are needed in a specific application field. Metallic bio-
materials find an application as prostheses and implants in many
medical disciplines, e.g., in orthopedics, cardiology, and den-
tistry. All of the requirements set out for metallic biomaterials
are detailed in International Standard ISO 5832. This standard
contains several parts concerned with titanium-based materials,
cobalt-based materials, and stainless steels. Part 9 of the stan-
dard describes the chemical composition and physicochemical
properties of wrought high nitrogen stainless steel dedicated for
orthopedic implants [
]. The main alloying elements of this
group of steel are as follows (wt%): iron (base), chromium
(19.5
–22.0), nickel (9.0–11.0), manganese (2.0–4.45), molyb-
denum (2.0
–3.0), and nitrogen (0.25–0.5).
An ideal metallic biomaterial is expected to exhibit a very
high biocompatibility, good corrosion resistance, and good
mechanical properties. It is very difficult to combine all these
properties in only one material. Improvement of mechanical
properties, corrosion resistance, and biocompatibility of bio-
medical steels for implantology may be achieved through
surface modification, for example by surface coating. A very
popular material for biomedical coating is titanium dioxide
(titania, TiO
2
) due to its excellent corrosion, mechanical, and
biological properties [
]. Many methods are used to prepare
biomedical coatings. One of them is sol
–gel method [
–
Orthopedic implants, made of stainless steel ISO 5832
–9
type, operate in protein-containing physiological environments.
Blood plasma contains three types of dissolved proteins
—
B. Burnat (
*)
:
T. Blaszczyk
:
A. Leniart
Faculty of Chemistry, Department of Inorganic and Analytical
Chemistry, University of Lodz, Tamka 12, 91-403 Lodz, Poland
e-mail: burnat@chemia.uni.lodz.pl
J Solid State Electrochem (2014) 18:3111
–3119
DOI 10.1007/s10008-014-2634-5

albumin, globulins, and fibrinogen. Following the implantation
of a biomaterial, the first event to occur at the tissue-material
interface is protein adsorption [
]. The layer of adsorbed
proteins is formed immediately after metal immersion in human
plasma [
]. The interaction between proteins and surface of
the implant may affect its corrosive properties. Conclusions
concerning the influence of proteins are not clear. Some authors
[
] report that bovine serum albumin (BSA) diminishes
the corrosion rate of stainless steels and titanium alloys, while
other authors [
] report that BSA promotes the dissolution
of these alloys by forming stable complexes with the metallic
components of the alloys. Literature data show that the effect
depends on the type of biomaterial [
] and its surface finish
], as well as on the concentration of protein [
] and pH of
the solution [
].
The aim of this work was to study the effect of selected
serum proteins (albumin and
γ-globulins) added to the phys-
iological saline solution (0.9 % NaCl, pH 7.4) on the corrosion
of ISO 5832
–9 alloy (trade name M30NW) which surface was
modified by titania coatings.
Experimental
Materials
The biomedical alloy M30NW (Aubert & Duval, France) was
used as a metallic substrate. Its chemical composition is as
follows (wt%): Cr (20.62), Ni (9.53), Mn (4.13), Mo (2.12),
N (0.40), Nb (0.31), C (0.032), and Fe (rest). M30NW alloy
samples were discs with a diameter of 22 mm and a thickness of
about 3 mm. Every sample was ground on SiC abrasive paper
(80
–1,500 grits), polished with Al
2
O
3
suspension (0.3
μm),
chemically etched in a mixture of 2 % HF, 10 % HNO
3
, and
88 % H
2
O, passivated in boiling water (10 min), rinsed with
ethanol, and dried with argon. Samples prepared in such a way
were ready for TiO
2
coating. The precursor for TiO
2
coating
was titanium (IV) isopropoxide (Ti[OCH(CH
3
)
2
]
4
, 97 %,
Aldrich) [
]. Titania coating (as a single layer) was applied
onto alloy surface by dip-coating technique using a dip-coater
DCMono 75 (NIMA Technology). The final annealing of ap-
plied coating was carried out in a muffle furnace at tempera-
tures of 400 and 800 °C for 1 h.
All the chemical reagents used in the experiment were of
analytical grade and were applied without further purification.
Corrosion medium
The corrosion medium was composed of sodium chloride
(NaCl, pure p.a., POCH S.A.), bovine serum albumin (BSA,
>96 %, Sigma),
γ-globulins from bovine blood (≥97 %,
Sigma), and distilled water. The starting composition in
1,000 mL of each solution and their codes are listed in
Table
. All solutions were buffered by phosphate buffer
(KH
2
PO
4
/Na
2
HPO
4
×12H
2
O) and adjusted to pH 7.4 using
hydrochloric acid (HCl, pure p.a., POCH S.A.).
Electrochemical measurement
During the weekly corrosion tests, all samples immersed in
corrosion medium were stored at constant temperature of
37 °C. On selected days (0, 1, 3, 7), non-destructive corrosion
tests were performed using potentiostat/galvanostat PGSTAT
128 with FRA2 module (EcoChemie Autolab). The corrosion
measurements were carried out in three-electrode electrolytic
cell with a sample as a working electrode, platinum foil with an
area of 60 cm
2
as a counter electrode, and saturated calomel
electrode (SCE,
E°=0.241 V vs SHE) as a reference electrode.
All potentials reported in this paper are given versus SHE
electrode. Exposed area of each sample was approximately
0.64 cm
2
.
Some basic corrosion parameters such as corrosion poten-
tial, polarization resistance, and electrochemical impedance,
were determined versus immersion time. The corrosion po-
tential (
E
cor
) as open circuit potential was measured for
2,000 s. The polarization resistance (
R
p
) of the specimen in
the test solution was measured using linear polarization meth-
od. The measurements were done in a scanning range of
±20 mV versus
E
cor
potential with a scan rate of 0.3 mV s
−1
.
Electrochemical impedance characteristics were registered at
E
cor
potential by applying a sinusoidal signal of ±10 mV
within the frequency range from 0.01 to 10 kHz. Each mea-
surement was maintained at 37 °C. Three specimens were
tested for each corrosion test and results presented in this
paper are averaged values.
Surface characterization
The specimens were removed from the solutions after immer-
sion for 7 days and rinsed with distilled water. Next, their
surfaces were examined by optical microscopy and X-ray
photoelectron spectroscopy (XPS). The optical images were
obtained using metallographic microscope MMT 800BT
(Mikrolab, Poland). All XPS spectra were recorded with a
PHI 5000 VersaProbe scanning spectrometer (ULVAC-PHI,
Japan/USA). The X-ray source used was monochromatic Al-
K
α radiation (1486.6 eV) with an input power of 25 W. X-ray
beam was focused to a diameter of 100
μm; measured area
was defined as 1,000
μm×1,000 μm. The electron energy
analyzer was operated at a pass energy of 117.4 eV (energy
step 0.4 eV) for fast survey scan, and 23.5 eV (energy step
0.1 eV) for all high-resolution spectra. All measurements were
conducted with the use of a charge neutralizer system. The
angle between sample surface and electron energy analyzer
was 45°. The binding energy scale was normalized to the C1s
peak (285.0 eV).
3112
J Solid State Electrochem (2014) 18:3111
–3119
Results
Electrochemical measurements
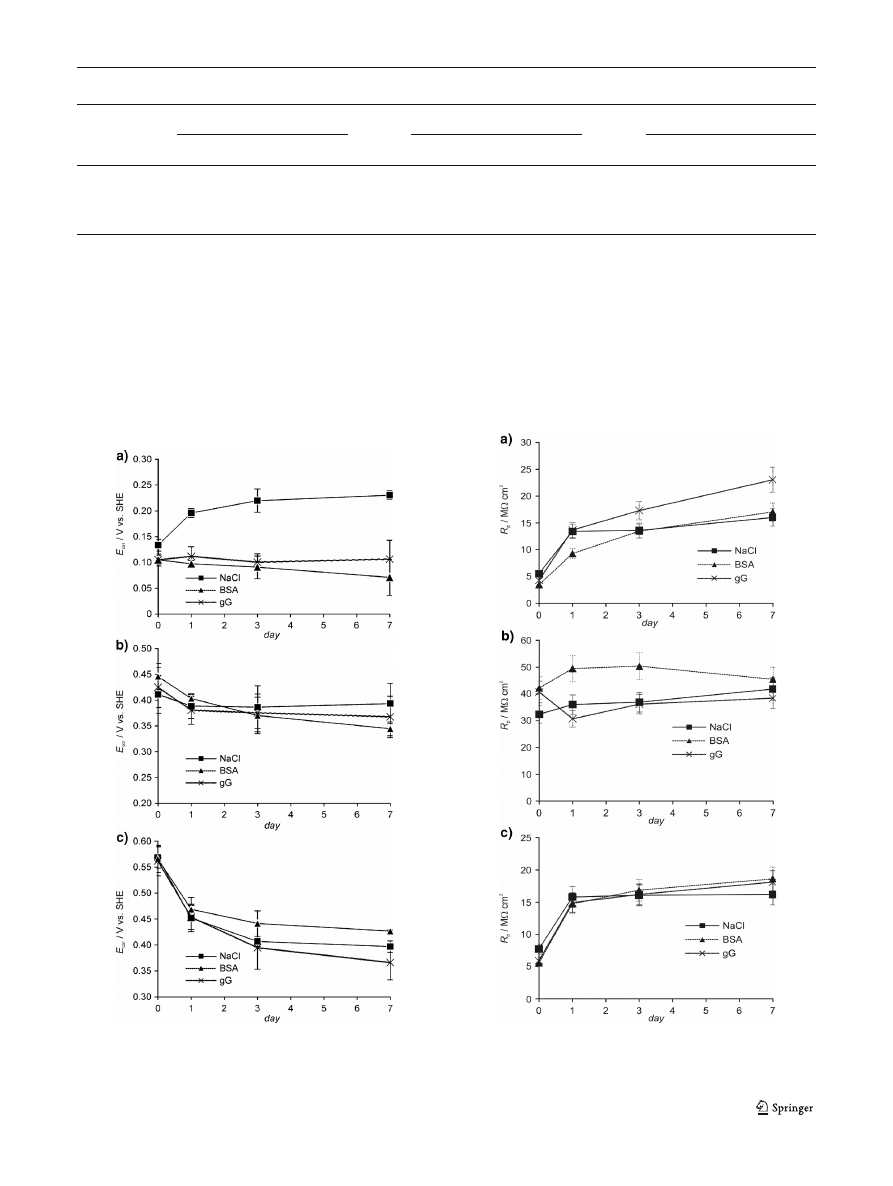
Figure
presents the results of corrosion potential
E
cor
versus
immersion time. For uncoated samples (Fig.
) in solution
without proteins, the
E
cor
value is rising close to 0.23 V
SHE
at
the 7th day. The positive potential evolution indicates the
formation of a protecting passivation layer on the M30NW
alloy. Such evolution of
E
cor
values is not observed in the
protein-containing solutions. In case of samples modified by
titania coatings (Fig.
) a regression with time of the
E
cor
is
observed. This regression is similar in solutions both with and
without proteins.
Table 1 Values of corrosion rate (mm year
−1
) at 0 and 7th day of immersion
Sample
Uncoated M30NW
M30NW+TiO
2
400
M30NW+TiO
2
800
Day
0
7
0
7
0
7
NaCl
3.97×10
−5
1.37×10
−5
6.40×10
−6
5.11×10
−6
2.80×10
−5
1.29×10
−5
BSA
6.00×10
−5
1.27×10
−5
4.94×10
−6
5.03×10
−6
3.72×10
−5
1.13×10
−5
gG
4.98×10
−5
9.16×10
−6
5.57×10
−6
5.83×10
−6
3.74×10
−5
1.78×10
−5
Standard deviation of
CR was less than 10 %
Fig. 1 Corrosion potential
E
cor
versus immersion time for uncoated alloy
(a), alloy with TiO
2
coating annealed at 400 °C (b), and alloy with TiO
2
coating annealed at 800 °C (c)
Fig. 2 Polarization resistance
R
p
versus immersion time for uncoated
alloy (a), alloy with TiO
2
coating annealed at 400 °C (b), and alloy with
TiO
2
coating annealed at 800 °C (c)
J Solid State Electrochem (2014) 18:3111
–3119
3113
The values of polarization resistance were determined
from the slope of the linear polarization characteristics
using CorrView software (Scribner Associates Inc.).
Figure
presents the polarization resistance-immersion
time dependence for all investigated samples. It can be
seen that the longer the immersion time, the higher the
value of
R
p
in case of both uncoated samples (Fig.
and samples coated with TiO
2
annealed at 800 °C
(Fig.
). In case of samples with titania coating annealed at
400 °C (Fig.
), the
R
p
values are relatively stable during the
immersion time.
Collected values of polarization resistance were used
for determination one of the most important corrosion
parameters
—corrosion rate. The values of corrosion rate
CR were calculated from the Eq. (
) according to pro-
cedure described by ASTM Standard G 102
–89 [
which assumes that at
E
cor
potential, only uniform type
of corrosion is occurring:
CR ¼ K
1
i
cor
ρ
EW
ð1Þ
where
CR is the corrosion rate (mm year
−1
),
K
1
=3.27
10
3
mm g (
μA cm year)
−1
,
i
cor
is the corrosion current density
(
μA cm
−2
) calculated on the basis of linear polarization char-
acteristics,
ρ is the density of investigated alloy which is
7.90 g cm
−3
, and
EW is the equivalent weight which for
M30NW alloy equals to 19.18 in the experimental set used
in this study.
To calculate the
CR value, it was assumed that at corrosion
potential, only the substrate, M30NW alloy, corrodes. No
other corrosion processes associated with the formed and
annealed TiO
2
coatings were taken into account in this calcu-
lation. According to the ASTM standard [
], only elements
above one mass percent in the alloy were included in
EW
calculation.
Table
presents the values of corrosion rate at 0 and
7th day of immersion. In case of uncoated samples and
samples coated with TiO
2
annealed at 800 °C, a de-
crease in corrosion rate can be observed in all solutions
while immersion time increases, but this behavior is
more pronounced in the protein-containing solutions.
The values of corrosion rate of samples coated with
TiO
2
annealed at 400 °C are very low and they are
independent on the presence of serum proteins.
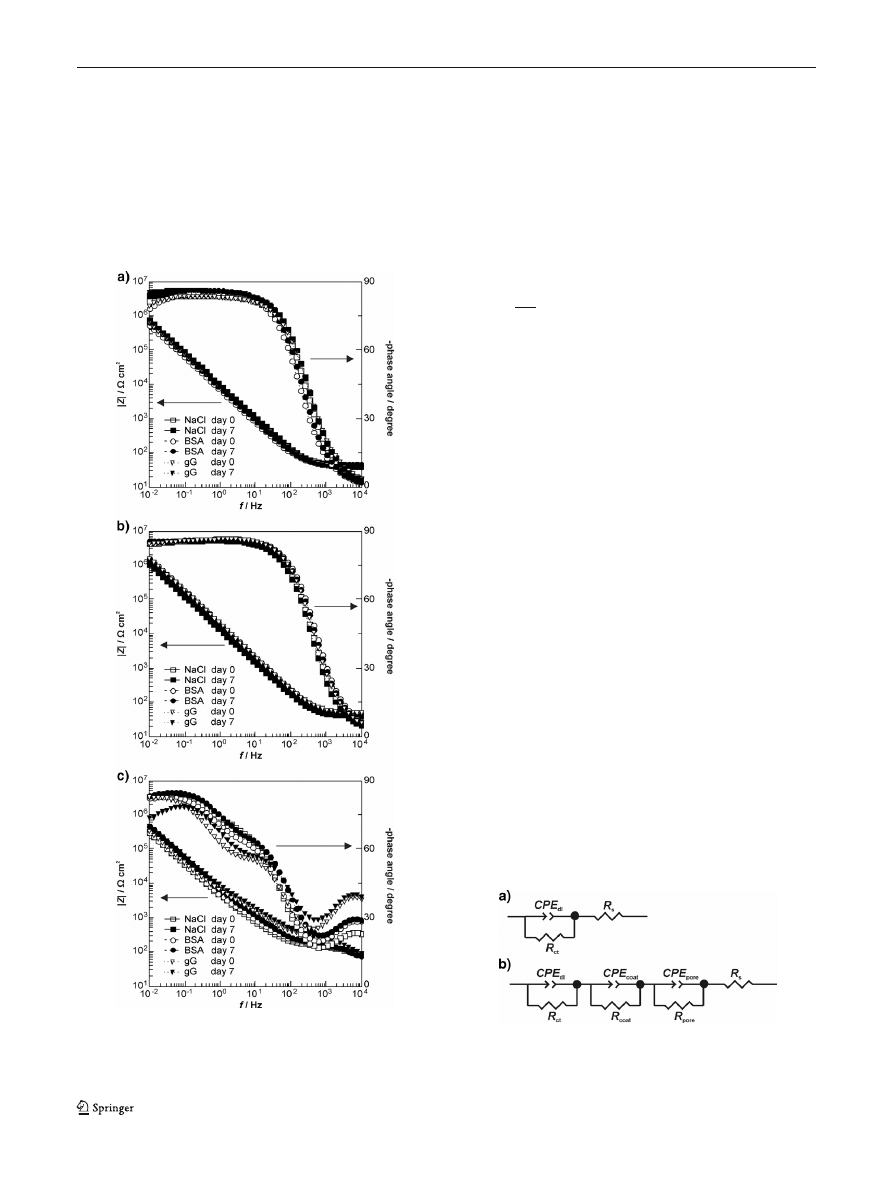
Impedance spectra for all investigated samples recorded at
the beginning and the end of immersion tests are presented in
Fig.
. Impedance spectra for uncoated alloy (Fig.
) show an
increase of impedance during 7 days of immersion. This
increase seems to be greater in case of protein-containing
Fig. 3 Impedance spectra (Bode plots) recorded on 0 and 7th day of
immersion of uncoated alloy (a), alloy with TiO
2
coating annealed at
400 °C (b), and alloy with TiO
2
coating annealed at 800 °C (c) in all
corrosion solutions
Fig. 4 The equivalent circuits used for quantitative evaluation of imped-
ance spectra for uncoated alloy and alloy with TiO
2
coating annealed at
400 °C (a), and samples with TiO
2
coating annealed at 800 °C (b)
3114
J Solid State Electrochem (2014) 18:3111
–3119

solutions. In case of alloy samples with TiO
2
coating annealed
at 400 °C (Fig.
), their impedance do not depend on im-
mersion time and solution chemistry
—the impedance
spectra are almost identical at day 0 and at day 7 for
all solutions. The samples with titania coating heat-
treated at 800 °C (Fig.
) have different impedance
characteristics
—the Bode plots show three time con-
stants in all corrosion solutions.
All obtained impedance data were fitted by the
equivalent electrical circuits using Zview2 software.
The quality of the fitting was judged by the
χ
2
value
that was lower than 4 × 10
−4
. Instead of pure capacitors,
constant phase elements (
CPE) were introduced in the
fitting procedure to obtain good agreement between the
experimental and simulated data. The impedance of
CPE is defined by the Eq. (
Z
CPE
¼
1
Q jω
ð Þ
n
ð2Þ
where
Q (Ω
−1
s
n
cm
−2
) is the combination of properties
related to both the surface and the electroactive species inde-
pendent on frequency,
n is related to a slope of the logZ versus
log
f (Bode plot), and ω is the angular frequency.
In the ideal case when the exponential factor
n=1, the CPE
acts as a pure capacitor. In practice,
n deviates from 1 so the
fitting results are given as both the parameter
Q and the
exponent
“n.” It should be noted that for simplicity, Q is often
considered as a capacitance [
].
For uncoated alloy and alloy with TiO
2
coating annealed at
400 °C, the best data-fitting equivalent circuit (Fig.
) is
characterized by parallel combination term (
R, CPE) in series
with the resistor
R
s
. The values of the parameters obtained
with the fitting procedure versus immersion time are reported
in Table
. Resistor
R
s
determines uncompensated electrolyte
resistance and it is about 40
Ω cm
2
for all types of corrosion
medium. Constant phase element
CPE
dl
is equivalent to dou-
ble layer capacity (since the factor
n has a value in the range of
0.92
–0.96, CPE can be said to behave similarly to a pure
Table 2 Values of the parameters obtained from the fitting procedure at 0 and 7th day of immersion
Sample
Day
R
s
/
Ω cm
2
CPE
dl
R
ct
/M
Ω cm
2
CPE
pore
R
pore
/
Ω cm
2
CPE
coat
R
coat
/
Ω cm
2
C
dl
/
μF cm
−2
n
C
pore
/
μF cm
−2
n
C
coat
/
μF cm
−2
n
Uncoated alloy
NaCl
0
42.7
21.4
0.93
19.5
–
–
–
–
–
–
7
40.9
18.6
0.94
58.6
–
–
–
–
–
–
BSA
0
46.3
25.9
0.95
4.2
–
–
–
–
–
–
7
45.6
21.5
0.95
54.2
–
–
–
–
–
–
gG
0
37.7
22.1
0.92
11.9
–
–
–
–
–
–
7
37.4
19.5
0.95
115.4
–
–
–
–
–
–
With TiO
2
400 °C
NaCl
0
44.3
11.4
0.95
59.1
–
–
–
–
–
–
7
41.5
13.5
0.95
80.8
–
–
–
–
–
–
BSA
0
43.8
8.9
0.96
58.2
–
–
–
–
–
–
7
41.5
10.2
0.95
221.1
–
–
–
–
–
–
gG
0
49.4
9.0
0.96
40.5
–
–
–
–
–
–
7
46.2
13.1
0.95
114.1
–
–
–
–
–
–
With TiO
2
800 °C
NaCl
0
47.7
44.8
0.94
11.4
4.9
0.76
104.1
172.9
0.71
1446
7
46.4
28.4
0.95
12.6
5.0
0.76
111.2
129.1
0.73
1206
BSA
0
39.3
45.4
0.94
10.0
4.4
0.76
128.5
108.7
0.74
1544
7
38.0
29.4
0.95
13.2
4.4
0.77
125.2
79.6
0.75
1442
gG
0
39.0
40.7
0.93
51.7
2.2
0.81
220.9
53.3
0.72
3270
7
36.0
25.3
0.90
3.3
2.5
0.80
222.1
38.8
0.75
2183
Fig. 5 Optical microscope images for M30NW alloy with TiO
2
coating
annealed at 400 °C obtained after 7 days of immersion in protein-
containing solutions: BSA (a) and gG (b)
J Solid State Electrochem (2014) 18:3111
–3119
3115
capacitor). Resistor
R
ct
reaches a value in the order of 10
7
Ω cm
2
and it is related to charge transfer resistance of corro-
sion processes. It is in agreement with
R
p
value obtained from
linear polarization characteristics.
In case of alloy samples coated by TiO
2
layer annealed at
800 °C, the simple equivalent circuit (Fig.
) was inadequate;
therefore, a more complex circuit (Fig.
) has been used. This
circuit contains three parallel combination terms (
R, CPE)
since three time constants are present on the Bode plots. The
differences result from entirely different surface properties of
TiO
2
coating depending on applied annealing temperature. In
previous paper [
], we have reported that TiO
2
sol
–gel coating
heat-treated at 800 °C is a porous, diffusive layer which
contains new TiO
2
-based phases instead of pure TiO
2
crystal
structures. Therefore, in addition to solution resistance
R
s
,
double layer capacitance
CPE
dl
, and charge transfer resistance
R
ct
, the electrical equivalent circuit contains elements associ-
ated with pores and coating properties. The values of the
parameters obtained with the fitting procedure versus immer-
sion time are reported in Table
. Constant phase element
CPE
pore
and resistor
R
pore
describe porosity of coating layer.
These elements are related with time constant visible in high
frequency range in Bode plots (Fig.
). Low
R
pore
values (in
the order of hundreds of
Ω cm
2
) are to be expected since they
correspond to the low electrolyte resistance inside the pores
[
]. Constant phase element
CPE
coat
and resistor
R
coat
char-
acterize surface properties of TiO
2
layer. These elements are
related with time constant visible in medium frequency range
in Bode plots (Fig.
). The low
n values obtained for CPE
elements are typical for rough surface of the coating [
]. The
rough surface is a result of dislocations, grain boundaries, and
precipitations.
CPE element is a practical way to describe the
above interfacial characteristics [
].
Surface analysis after 7 days of immersion
At the end of the corrosion tests, the alloy samples were
observed by optical microscope in order to analyze the chang-
es in surface morphology. Optical microscope results did not
reveal any local corrosion damage on the investigated sam-
ples. This fact indicate that during weekly corrosion tests, only
general corrosion occurred. Additionally, for all samples im-
mersed in solutions with proteins, some sediment on the
surface was observed. The representative microscope images
obtained for alloy samples with TiO
2
coating annealed at
400 °C are presented in Fig.
.
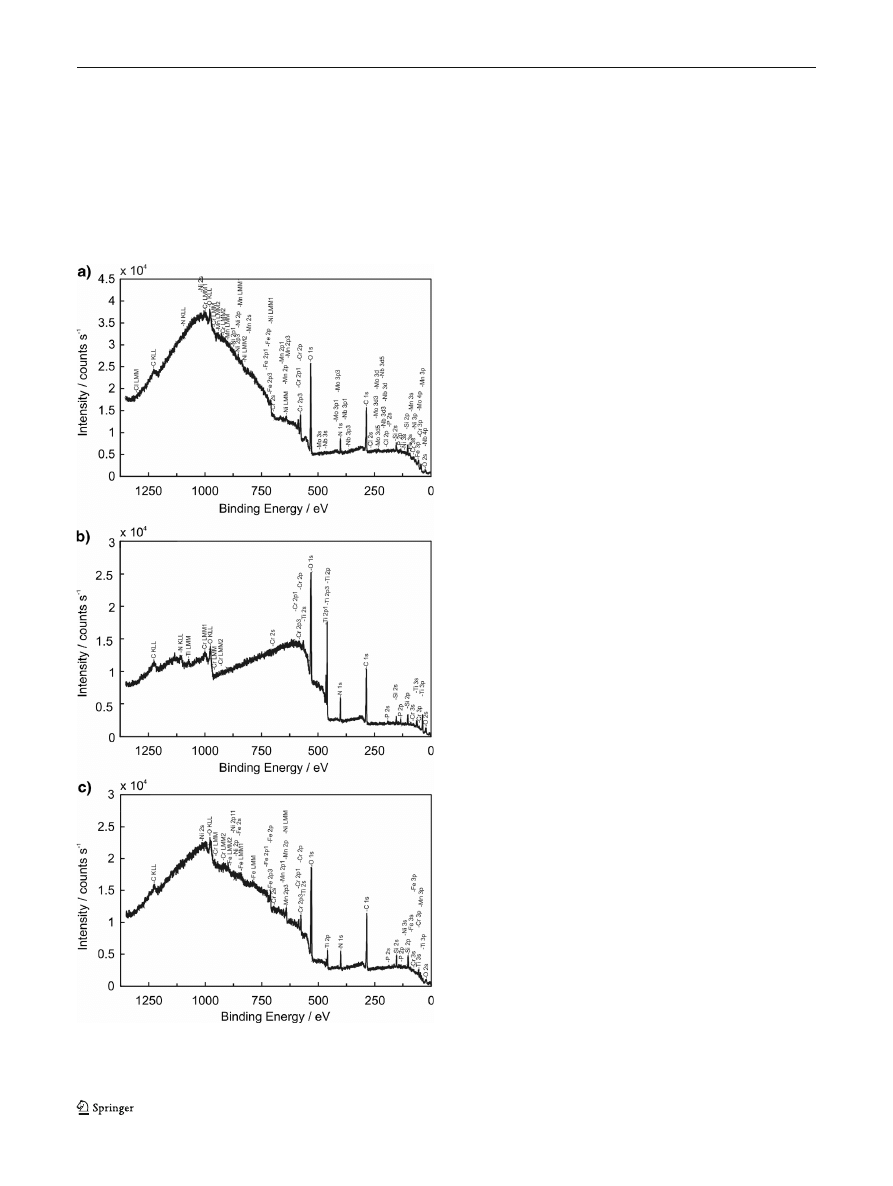
This sediment may be related to presence of proteins
adsorbed on the sample surfaces. In order to clarify its origin,
the surface analysis was performed using XPS method. X-ray
spectra in a wide range of binding energy were collected for
both uncoated samples and samples with titania coating after
7 days of immersion in corrosion medium. Figure
presents a
representative XPS survey spectra taking each type of samples
after immersion in BSA solution for example. Surface film
composition of all alloy samples after 7 days exposure to the
corrosion medium is presented in Table
. The general features
of the spectra are peaks of carbon (C1s) and oxygen (O1s)
which are observed on all the samples. Carbon concentration is
ranged from 16 to 57 at.%. The XPS results exhibit the pres-
ence of main alloying components (Fe, Cr, Ni, Mn, Mo) in case
Fig. 6 The representative survey spectra for samples immersed in BSA-
containing solution: uncoated sample (a), sample with TiO
2
annealed at
400 °C (b), and samples with TiO
2
annealed at 800 °C (c)
3116
J Solid State Electrochem (2014) 18:3111
–3119
of uncoated samples. Some of the alloying elements (Fe, Cr,
Mn) are also visible on the surface of alloy samples coated with
TiO
2
layer annealed at 800 °C. In case of samples modified
with TiO
2
coating annealed at 400 °C, only signals of Fe and Cr
coming from the substrate were stated. Additionally, signals of
Ti and O coming from the titania coating were stated for both
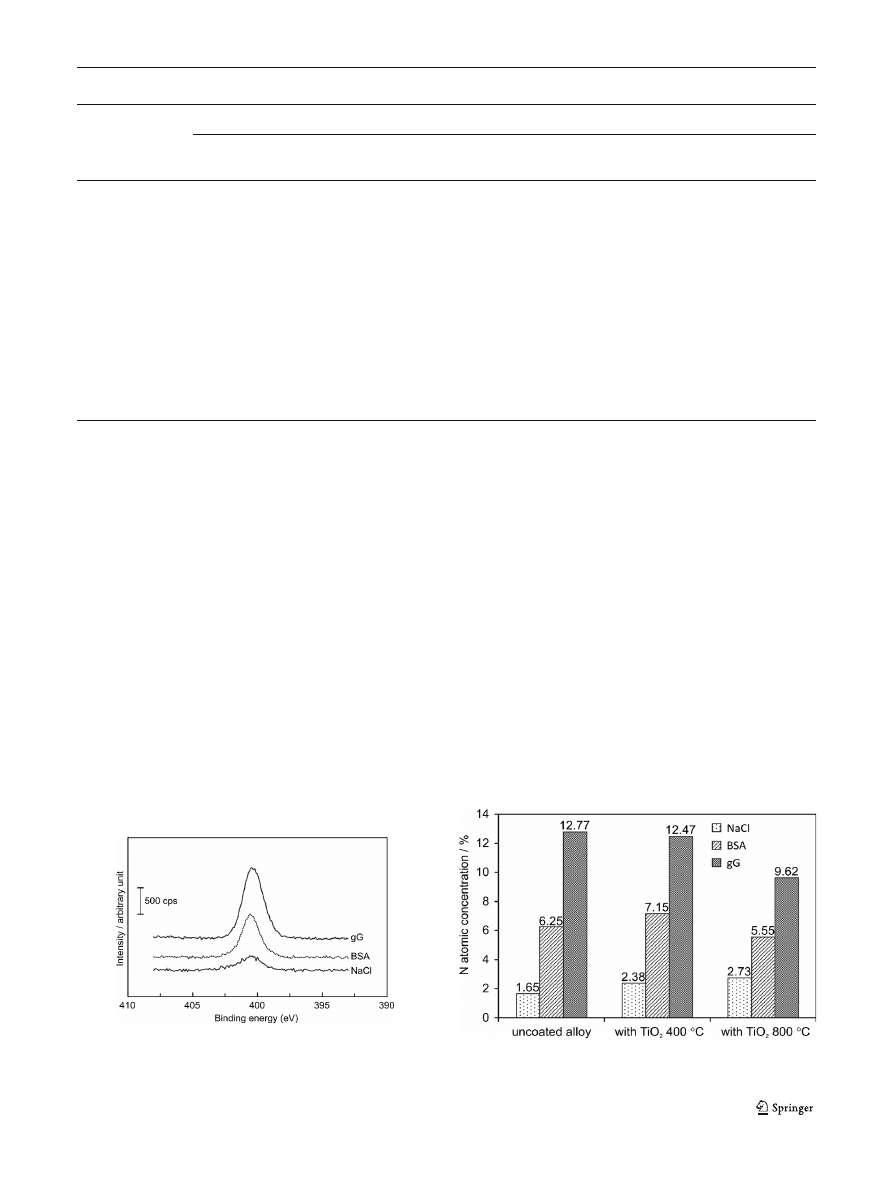
modified alloy samples. The XPS results show also that nitro-
gen (N1s) is present on all the samples. In case of samples
exposed to solution without addition of protein, the atomic
concentration of N is lower than 3 %. Much higher percentage
of nitrogen is observed for samples immersed in protein-
containing solutions. Approximately two times as much nitro-
gen was found on the surface of samples after contact with a
solution containing
γ-globulins than for samples immersed in
albumin-containing solution. It should be noticed that the
higher the amount of nitrogen, the less the amount of iron and
chromium found on the alloy
’s surface. An example of high-
resolution spectra for N1s region which were used for detection
of nitrogen percentages is presented in Fig.
. Percentages of N
atoms on surfaces after immersion in protein-containing solu-
tions obtained by XPS analysis are summarized in Fig.
.
Discussion
The results of corrosion tests presented in this study confirm
that titania sol
–gel coatings improve the corrosion resistance
of M30NW biomedical alloy in 0.9 % NaCl solution. This
improvement is dependent on the annealing temperature used.
In our previous paper [
], we characterized the structure and
character of interactions between substrate and deposited TiO
2
sol
–gel layers in relation to different annealing temperatures.
We have stated that the coating annealed at temperature of
400 °C has an adhesive character and it has an amorphous
structure with anatase crystallites. Whereas, TiO
2
coating
annealed at 800 °C has a diffuse character and contains new
phases (NiTiO
3
and Fe
2
TiO
4
) due to the interaction with steel
Table 3 Surface film composition of M30NW alloy after 7 days exposure to the corrosion medium
Sample/Solution
Atomic concentration (at.%)
Ni
2p
Fe
2p
Mn
2p
Cr
2p
O
1s
Ti
2p
N
1s
C
1s
Mo
3d
Nb
3d
P+Si
2p
Uncoated alloy
NaCl
0.50
0.27
0.12
6.05
34.01
–
1.65
50.76
0.23
0.00
6.40
BSA
0.50
0.63
0.00
5.78
37.51
–
6.25
41.17
0.22
0.06
7.89
gG
0.05
0.08
0.00
0.90
23.07
–
12.77
57.70
0.08
0.00
5.34
With TiO
2
400 °C
NaCl
–
0.64
–
2.19
53.97
18.54
2.38
20.16
–
–
2.14
BSA
–
0.51
–
1.21
43.02
12.07
7.15
36.03
–
–
0.00
gG
–
0.15
–
0.45
26.64
4.09
12.47
56.18
–
–
0.00
With TiO
2
800 °C
NaCl
–
2.66
4.19
5.03
46.34
3.64
2.73
28.41
–
–
7.00
BSA
–
1.87
2.28
2.65
37.12
2.58
5.55
40.12
–
–
7.87
gG
–
0.52
0.80
1.26
28.59
1.20
9.62
50.94
–
–
7.07
Fig. 7 The XPS high-resolution N1s spectra for M30NW alloy with TiO
2
coating annealed at 400 °C (the curves are shifted by 300 counts relative
to each other for better separation)
Fig. 8 Percentages of N atoms on surfaces after immersion in protein-
containing solutions obtained by XPS
J Solid State Electrochem (2014) 18:3111
–3119
3117

substrate. Such differences in crystalline structure and charac-
ter of substrate layer interaction imply differences in anticor-
rosion properties of titania coatings [
The results presented in this paper indicate that M30NW
alloy both uncoated and modified with titania coatings has a
very good corrosion resistance also during weekly exposition
to corrosion medium with and without addition of serum
proteins. The results of corrosion potential versus immersion
time show a very weak interaction of proteins with surfaces
modified by titania coatings, while in case of unmodified
alloy, it is significant. The polarization resistance of uncoated
samples and samples with titania coating obtained at 800 °C
increases, and corrosion rate decreases during exposure to all
corrosion solutions. The samples with titania coating obtained
at 400 °C show very good corrosion resistance in all solu-
tions
—polarization resistance is in the range of 30–50 M
Ω cm
2
not depending on the presence of proteins and immer-
sion time. Results of impedance measurements did not show
any significant effect of proteins onto weekly corrosion of
investigated biomedical steel. However, they indicate the dif-
ferences in phase boundary electrolyte solution/TiO
2
-coated
alloy depending on annealing temperature.
The XPS results allowed to determine the changes in
surface composition of analyzed samples after 7 days of
exposure to the protein-containing solutions. Proteins
(albumins and
γ-globulins) as chemical molecules have car-
boxyl (
−COOH), amino (−NH
2
), and amido (
−CONH-)
groups. Hence, the major elements of the proteins are oxygen,
carbon, and nitrogen. Carbon contamination is unavoidable in
XPS studies; therefore, carbon signal cannot acts as a protein
indicator. We assumed that the nitrogen signal is indicative of
the presence of a protein. This assumption is in accordance
with Dupont-Gillain et al., Feng et al., and Karimi et al. [
]. The results of surface analysis obtained by X-ray photo-
electron spectroscopy clearly showed that contact of samples
with protein-containing solutions per 7 days causes increase in
percentages of N atoms on their surfaces. This fact confirms
the presence of proteins on the alloy surface after 7 days of
immersion in protein-containing solutions.
Some researchers have suggested that the electrostatic at-
traction between proteins and biomaterials is important [
,
]. The isoelectric point of BSA is in the range of 4.2
–5.5
], and in case of
γ-globulins, it is in the range of
6.5
–7.0 [
] so both proteins are negatively charged in the
solution at pH 7.4. The pH zero point of charge for Fe-oxide/
hydroxide, which is the outer oxide layer on a stainless steel
surface, is 8.5 [
]. Hence, at pH 7.4, the stainless steel surface
at the
E
cor
potential (Fig.
) has a net positive charge. This
will facilitate the involvement of negatively charged carbox-
ylate groups of the proteins as anchoring sites in the contact
region between the proteins and the stainless steel surface
[
]. However, for the interaction between proteins used in
this study and TiO
2
coating, the electrostatic effects should not
be dominant factors since bovine serum albumin,
γ-globulins,
and TiO
2
(isoelectric point in the range of 4.7
–6.2 [
]) are
negatively charged in the solution at pH 7.4. Therefore, in our
experimental set, a chemical adsorption of both proteins onto
alloy surface modified with titania coatings is more probable
rather than a physisorption. The chemical adsorption of BSA
onto titanium surfaces through the interaction of C and O
groups with the surface hydroxyl groups was reported by
Feng et al. [
].
Conclusions
The corrosion of ISO 5832
–9 alloy (trade name M30NW)
which surface was modified by titania sol
–gel coatings was
investigated in this study using 0.9 % NaCl solutions with
addition of two serum proteins (albumin and
γ-globulins).
The experimental results have led us to the following
conclusions:
– M30NW alloy both uncoated and modified with titania
coatings has a very good corrosion resistance during
weekly exposition to corrosion medium. The best corro-
sion resistance in 0.9 % NaCl solution is shown by alloy
samples modified by titania coating annealed at 400 °C.
– The serum proteins used in this study have no significant
effect onto corrosion of investigated biomedical steel.
– The results of surface analysis by X-ray photoelectron
spectroscopy clearly showed that contact of samples with
protein-containing solutions per 7 days causes increase in
percentages of N atoms on their surfaces. This fact con-
firms the presence of proteins on the alloy surface after
7 days of immersion in protein-containing solutions.
– In case of uncoated alloy, a physisorption probably oc-
curs, while in case of alloy modified with titania coatings,
a chemical adsorption is more probable.
Acknowledgments
The authors gratefully acknowledge Dr. Janusz
Sobczak and Dr. hab. Wojciech Lisowski from Institute of Physical
Chemistry of PAS for XPS surface analyses. The investigations were
supported by the National Science Centre project No. N N507 501339.
Open Access This article is distributed under the terms of the Creative
Commons Attribution License which permits any use, distribution, and
reproduction in any medium, provided the original author(s) and the
source are credited.
References
1. Ramakrishna S, Ramalingam M, Kumar TSS, Soboyejo WO (2010)
Biomaterials: a nano approach. CRC Press
2. ISO 5832
–9 (2007) Implants for surgery—metallic materials—Part
9: Wrought high nitrogen stainless steel
3118
J Solid State Electrochem (2014) 18:3111
–3119

3. Jones FH (2001) Teeth and bones: applications of surface science to
dental materials and related biomaterials. Surf Sci Rep 42:75
–205
4. Velten D, Biehl V, Aubertin F, Valeske B, Possart W, Breme J (2002)
Preparation of TiO
2
layers on cp-Ti and Ti6Al4V by thermal and
anodic oxidation and by sol
–gel coating techniques and their charac-
terization. J Biomed Mater Res 59:18
–28
5. Galliano P, De Damborenea JJ, Pascual MJ, Duran A (1998) Sol
–gel
coatings on 316 L steel for clinical applications. J Sol
–gel. Sci
Technol 13:723
–727
6. Wang D, Bierwagen GP (2009) Sol
–gel coatings on metals for
corrosion protection. Prog Org Coat 64:327
–338
7. Burnat B, Dercz G, Blaszczyk T (2014) Structural analysis and
corrosion studies on an ISO 5832
–9 biomedical alloy with TiO
2
sol
–gel layers. J Mater Sci Mater Med 25:623–634
8. Collier TO, Jenney CR, DeFife KM, Anderson JM (1997) Protein
adsorption on chemically modified surfaces. Biomed Sci Instrum 33:
178
–183
9. Dupont-Gillain CC, Mc Evoy KM, Henry M, Bertrand P (2010)
Surface spectroscopy of adsorbed proteins: input of data treatment
by principal component analysis. J Mater Sci Mater Med 21:955
–961
10. Afonso MLCA, Villamil Jaimes RFV, Areas EPG, Capri MR,
Oliveira E, Agostinho SML (2008) The influence of albumin on
the anodic dissolution of chromium present in UNS S31254 stainless
steel in chloride environment. Colloids Surf A 317:760
–763
11. Merrit K, Brown S (1988) Effect of proteins and pH on fretting
corrosion and metal ion release. J Biomed Mater Res 22:111
–120
12. Huang H (2003) Effect of fluoride and albumin concentration on the
corrosion behavior of Ti
–6Al–4 V alloy. Biomaterials 24:275–282
13. Omanovic S, Roscoe S (1999) Electrochemical studies of the adsorp-
tion behavior of bovine serum albumin on stainless steel. Langmuir
15:8315
–8321
14. Williams RL, Brown SA, Merritt K (1988) Electrochemical studies
on the influence of proteins on the corrosion of implant alloys.
Biomaterials 9:181
–186
15. Karimi S, Nickchi T, Alfantazi A (2011) Effects of bovine serum
albumin on the corrosion behavior of AISI 316 L, Co-28Cr-6Mo, and
Ti-6Al-4 V alloys in phosphate buffered saline solutions. Corros Sci
53:3262
–3272
16. Hedberg YS, Killian MS, Blomberg E, Virtanen S, Schmuki P,
Odnevall Wallinder I (2012) Interaction of bovine serum albumin
and lysozyme with stainless steel studied by time-of-flight secondary
ion mass spectrometry and X ray photoelectron spectroscopy.
Langmuir 28:16306
–16317
17. Sun D, Wharton JA, Wood RJK (2008) Effects of proteins and pH on
tribocorrosion performance of cast CoCrMo
—a combined electro-
chemical and tribological study. Tribology 2:150
–160
18. ASTM G 102
–89 (2004) Standard practice for calculation of corro-
sion rates and related information from electrochemical
measurements
19. Rondelli G, Torricelli P, Fini M, Giardino R (2005) In vitro corrosion
study by EIS of a nickel free stainless steel for orthopaedic applica-
tions. Biomaterials 26:739
–744
20. Ahn SH, Choi YS, Kim JG, Han JG (2002) A study on corrosion
resistance characteristics of PVD Cr-N coated steels by electrochem-
ical method. Surf Coat Technol 150:319
–326
21. Liu C, Bi Q, Leyland A, Matthews A (2003) An electrochem-
ical impedance spectroscopy study of the corrosion behaviour
of PVD coated steels in 0.5 N NaCl aqueous solution: Part I.
Establishment of equivalent circuits for EIS data modelling. Corros
Sci 45:1243
–1256
22. Feng B, Weng J, Yang BC, Chen JY, Zhao JZ, He L, Qi SK, Zhang
XD (2003) Surface characterization of titanium and adsorption of
bovine serum albumin. Mater Charact 49:129
–137
23. Karimi S, Nickchi T, Alfantazi AM (2012) Long-term corro-
sion investigation of AISI 316 L, Co
–28Cr–6Mo, and Ti–6Al–
4 V alloys in simulated body solutions. Appl Surf Sci 258:
6087
–6096
24. Ellingsen JE (1991) A study on the mechanism of protein adsorption
to TiO
2
. Biomaterials 12:593
–596
25. Kopac T, Bozgeyik K (2010) Effect of surface area enhancement on
the adsorption of bovine serum albumin onto titanium dioxide.
Colloids Surf B 76:265
–271
26. Sakurai K, Nakajima K, Takahashi T (1993) Adsorption of bovine
serum albumin and
γ-globulin on chitosan membrane.
flib.ufukui.ac.jp/dspace/bitstream/10098/4195/1/AN00215401-041-
02-010.pdf
. Accessed 10 September 2013
J Solid State Electrochem (2014) 18:3111
–3119
3119
Document Outline
Wyszukiwarka
Podobne podstrony:
The course of PE extrusion process modified by Mg(OH)2
Effect of long chain branching Nieznany
Effect of Kinesio taping on muscle strength in athletes
53 755 765 Effect of Microstructural Homogenity on Mechanical and Thermal Fatique
Effect of File Sharing on Record Sales March2004
31 411 423 Effect of EAF and ESR Technologies on the Yield of Alloying Elements
21 269 287 Effect of Niobium and Vanadium as an Alloying Elements in Tool Steels
(10)Bactericidal Effect of Silver Nanoparticles
Effect of?renaline on survival in out of hospital?rdiac arrest
Effects of the Great?pression on the U S and the World
4 effects of honed cylinder art Nieznany
Effects of the Atomic Bombs Dropped on Japan
Effect of aqueous extract
Effect of Active Muscle Forces Nieznany
Effects of Kinesio Tape to Reduce Hand Edema in Acute Stroke
1 Effect of Self Weight on a Cantilever Beam
effect of varying doses of caffeine on life span D melanogaster
Possible Effects of Strategy Instruction on L1 and L2 Reading
Pleiotropic Effects of Phytochemicals in AD
więcej podobnych podstron