
Proc. Natl. Acad. Sci. USA
Vol. 95, pp. 3351–3355, March 1998
Astronomy
A gravitational diffusion model without dark matter
(galactic rotation curves
yclusters and superclustersyzero dark matteryinitial gravitational collapseygalaxy formation)
R
OY
J. B
RITTEN
Division of Biology, California Institute of Technology, 101 Dahlia Avenue, Corona del Mar, CA 92625
Contributed by Roy J. Britten, December 29, 1997
ABSTRACT
In this model, without dark matter, the flat
rotation curves of galaxies and the mass-to-light ratios of
clusters of galaxies are described quantitatively. The hypoth-
esis is that the agent of gravitational force is propagated as if
it were scattered with a mean free path of
'5 kiloparsecs. As
a result, the force between moderately distant masses, sepa-
rated by more than the mean free path, diminishes as the
inverse first power of the distance, following diffusion equa-
tions, and describes the flat rotation curves of galaxies. The
force between masses separated by <1 kiloparsec diminishes
as the inverse square of distance. The excess gravitational
force (ratio of 1
yr:1yr
2
) increases with the scale of structures
from galaxies to clusters of galaxies. However, there is reduced
force at great distances because of the
'12 billion years that
has been available for diffusion to occur. This model with a
mean free path of
'5 kiloparsecs predicts a maximum excess
force of a few hundredfold for objects the size of galactic
clusters a few megaparsecs in size. With only a single free
parameter, the predicted curve for excess gravitational force
vs. size of structures fits reasonably well with observations
from those for dwarf galaxies through galactic clusters. Under
the diffusion model, no matter is proposed in addition to the
observed baryons plus radiation and thus the proposed den-
sity of the universe is only a few percent of that required for
closure.
The concept of diffusion of gravity arose from recognition that
flat rotation curves of galaxies would result from the equations
of diffusion (1). The model that has developed includes: (i) an
unspecified agent responsible for the force of gravity, probably
traveling at the speed of light over small distances; (ii) for
distances more than a few kiloparsecs (kpc), the agent prop-
agates following the diffusion equations; (iii) the effective
mean free path is
'5 kpc, apparently independent of the local
matter density; and (iv) the process that causes the propagation
according to diffusion equations is probably not scattering of
the direction of travel of gravitational elements but something
more subtle, involving distortion of the metric. A process for
which the continued propagation is proportional to the con-
centration of elements in local regions follows the diffusion
equations. The phrases ‘‘gravitational elements’’ or the
‘‘agents of gravity’’ used in this article are shorthand for an
unknown underlying process that amounts to propagation of
the curvature of the metric.
In the diffusion model, the retardation of the agent of
gravity increases the gravitational force (compared with in-
verse square) at distances from a few kpc to many megaparsecs
(Mpc), owing to the effective higher concentration of the
agent. This increase is described as ‘‘excess gravitational
force.’’ It explains the observed differences in the mass-to-light
ratio for structures of various sizes. There is no known reason
to propose that the mean free path or diffusion constant varies
over space or time or that the propagation is affected by the
presence of matter or radiation. Questions about the nature of
gravitation and the mechanism of its propagation are by-
passed. A scattering process is not favored because of the
problem of preservation of the vector of attractive force
through scattering events. This article reports the agreement of
astronomical observations of excess gravitational force with
the quantitative predictions of the diffusion concept.
Quantitative Description of Diffusion
The standard solution for diffusion in three dimensions from
a point source can be transformed to amount per spherical
shell (Ps):
Ps
5 C r erfc@ry2 ~D t!
0.5
#,
[1]
where C is a constant; r is radius; t is time; and D is a diffusion
constant. This equation is accurate for distances much greater
than the mean free path but does not apply for small distances.
To obtain an equation suitable for small distances, Monte
Carlo calculations were made for elements traveling at con-
stant speed (c) that are scattered in a totally random direction
after traveling an average distance p. The following equation
matched the results quite well:
Ps
5 ~1 1 bryp!erfc@rya ~pct!
0.5
#,
[2]
where Ps again is the number per spherical shell. For the best
fit, b
5 3.1 and a 5 1.1. With this definition of the mean free
path, the diffusion coefficient is approximated by p c (over a
small factor) and thus the gravitational force (F) in this model
becomes
F
5 Gmm r
22
~1 1 bryp!erfc@rya ~pct!
0.5
#,
[3]
where r is distance; a and b are constants; p is mean free path;
c is speed of travel of a gravitational element; and t is the time
since the start. This equation is graphed in Fig. 1. The process
equivalent to scattering might be represented as many small
deflections instead of the large deflections used in this Monte
Carlo model, but tests show that this does not affect to a great
degree the approximation, although it could affect the con-
stant b, which is uncertain by perhaps 50%.
There are three important domains as follows. If r
,, p, the
inverse square term dominates and gravitational force is
inverse square. If r is greater than p but less than a few Mpc,
there is a 1
yr relationship, which applies for galaxies and for
small clusters. Finally, if r is many Mpc, then as a result of the
slowness of diffusion, the gravitational force only partially
reaches the distant regions and the decay of the erfc function
dominates. Thus, under the diffusion model, the present
gravitational force reaches a maximum ratio to inverse square
The publication costs of this article were defrayed in part by page charge
payment. This article must therefore be hereby marked ‘‘advertisement’’ in
accordance with 18 U.S.C. §1734 solely to indicate this fact.
© 1998 by The National Academy of Sciences 0027-8424
y98y953351-5$2.00y0
PNAS is available online at http:
yywww.pnas.org.
Abbreviations: kpc, kiloparsec; Mpc, megaparsec; MOND, modifica-
tion of Newtonian gravity.
*To whom reprint requests should be addressed. e-mail: rbritten@
etna.bio.uci.edu.
3351
for major clusters of galaxies and becomes very small at large
distances.
Eq. 3 is used in Fig. 2 to describe the excess force external
to galaxies and clusters. For large distances, it decays in a way
that does not represent what is expected for larger objects.
Because astronomical observations of excess force depend on
the velocities of objects in apparent orbit around clusters,
calculation was made for the excess force on a test mass
immediately external to a large distributed mass. For this
purpose, numerical integration was carried out over an ex-
tended object such as the Great Wall (2) with the contribution
of each point calculated according to Eq 3. The result is the
upper curve in Fig. 2. This curve closely approximates Eq. 3 up
to several Mpc and then remains high because major regions
of the distributed mass are not far from the adjacent test mass
and an excess attractive force is caused by this matter.
Comparison with Larger Scale Observations of Excess
Gravitational Force
Fig. 2 shows observations of excess gravitational force as a
function of the linear size of structures including galaxies and
clusters of galaxies. The curve rises slowly in the first decade
because there is little excess gravitational force at distances less
than the mean free path. Then it rises linearly at 45° for the next
two decades because the excess gravitational force is propor-
tional to the size of structures (ratio of 1
yr:1yr
2
). The principal
part of the data has been extracted from figure 2 of a study by
Bahcall et al. (3). The lower points are the median values for
Sa, Sb, and Sc galaxies from figure 5 of a study by Rubin (4).
Refer to the original papers for the identification of the
individual objects, which include spiral galaxies, elliptical
galaxies, clusters, and superclusters. The upper curve in Fig. 2,
described in the legend and in the previous paragraph, rep-
resents the force of attraction expected at the periphery of a
massive distributed structure assuming a mean free path of 5
kpc under the diffusion model. The curve is in broad agree-
ment with the excess gravitational forces observed. Thus, the
diffusion model gives the correct increase in gravitational
excess with size over a wide range of sizes and a lack of increase
with size for objects above a Mpc. In the diffusion model, the
reduced force at large distances is caused by the limited time
(
'12 billion years during which diffusion has been occurring)
as described by Eq. 3.
The implication is that very distant objects would at the
present time have negligible gravitational attraction for each
other. Thus, the major flows observed at present would have
been established at earlier times when the various structures
were under each other’s gravitation influence before the
expansion outran the diffusion process, which is slower on
these large scales. This phenomenon is expected for structures
whose current spacings are more than a few Mpc. Fig. 1 shows
that, for this model, the force of attraction falls below that for
inverse square where the spacing exceeds
'10 Mpc and
becomes very small for larger distances.
There is general agreement between the expectation from
the diffusion model and the observed mass-to-light ratio or
mass excess. However, the individual observations scatter
around the curve by a factor of two or more. The deviation of
the plotted values from the curve in Fig. 2 could be due to
uncertainties in the characteristics of galaxies and clusters,
specifically in the disk masses and the estimates of distances.
Some uncertainty also arises from unknown peculiar velocities.
Some of the variation in the excess gravitational force might be
interpreted under the diffusion model as resulting from inter-
action between galaxies. It is possible that the diffusing clouds
have not recovered fully from past tidal interactions and
collisions or mergers. Many estimates are based on the dy-
namics of the clusters, but virial calculations are uncertain and
require assumptions that are not independently verifiable. It
would be a better corroboration, of course, if the curve passed
through the points shown in Fig. 2, but the deviations shown
in Fig. 2 do not represent strong conflict with the predictions
of the diffusion model. In sum, there is general agreement
between the diffusion model predictions and the observed
excess gravitational forces, however, uncertainties are so great
that it remains possible that they agree in detail.
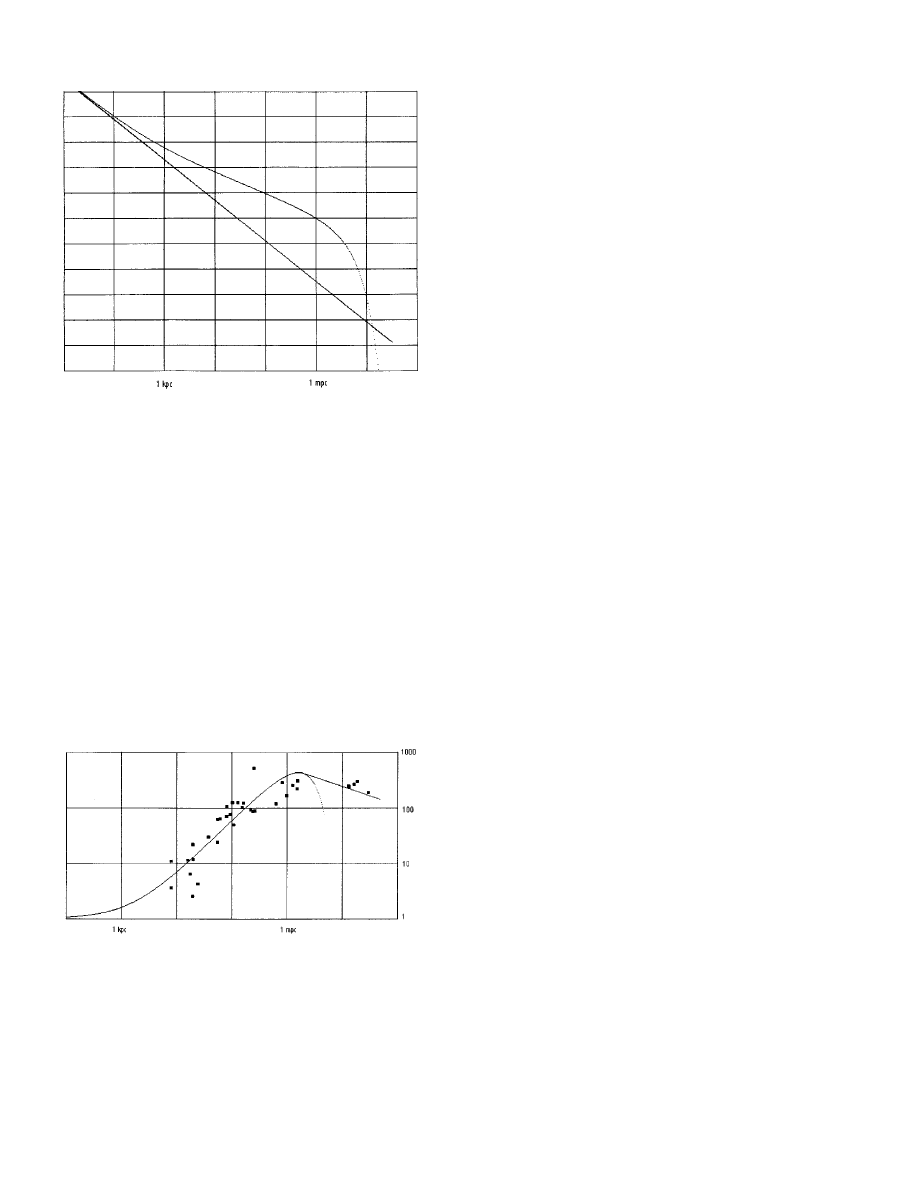
F
IG
. 1. Log–log graph of Eq. 3 showing the effect of diffusion on
the force of attraction compared with the inverse square law. Eq. 3: r
22
(1
1 bryp)erfc[rya(pct)
0.5
] is the upper curve using the values a
5 1.1,
b
5 3.1, p 5 5 kpc and r is shown in Mpc. Numerically, it becomes r
22
(1
1 600r)erfc(ry3) because (pct)
0.5
is 7.5 E24 cm at the present time,
assuming diffusion has been occurring for 1.2 E10 years. Below this
curve is a line for the inverse square law. The index lines are spaced
at factors of 10 with the vertical scale half of the horizontal to
accommodate the 1.0 E11 range. Note that, at the maximum, the
diffusion curve lies more than two orders of magnitude above the
inverse square line.
F
IG
. 2. Comparison of the observed excess gravitational force for
galaxies and clusters of galaxies with the prediction of the gravitational
diffusion model. The lower curve is Eq. 3, using the numerical values
described in the legend of Fig. 1, without the 1
yr
2
factor so that it
directly represents the excess gravitational force. The upper curve on
the right is based on calculations of the excess force on a test mass
immediately external to a large distributed mass for a diffusion case
with a mean free path of 5 kpc, as described in the text. The principal
part of the data has been extracted from figure 2 from the study by
Bahcall et al. (3). The lower points are the median values for Sa, Sb,
and Sc galaxies from figure 5 from the study of Rubin (4). Reference
is to the original papers for the identification of the individual objects,
which include spiral galaxies, elliptical galaxies, clusters, and super-
clusters.
3352
Astronomy: Britten
Proc. Natl. Acad. Sci. USA 95 (1998)
The Rotation Curve Expected for NGC 2403 Under the
Diffusion Model
Eq. 3 gives a nearly flat rotation curve at distances of 20 kpc
from the center of a galaxy owing to the 1
yr dependence of the
gravitational force. However, it is worthwhile to ask whether
the observed rotation curves are consistent with Eq. 3 at closer
distances. Fig. 3 shows the observed rotation curve for NGC
2403 compared with a calculation of the rotation curve under
the diffusion model based on estimates of the mass distribution
from Albada and Sancisi (Figure 4 in ref. 5). Because the
rotation curve of Albada and Sancisi (Figure 4 in ref. 5) does
not match the observed rotation curve at the inner radii, mass
was added near the center in a step that is essentially model-
independent. The match in the inner regions makes it possible
to compare the shape of the curve derived from the diffusion
model with the observations, and the agreement appears
excellent. The details of the calculation are mentioned in the
legend of Fig. 3. The apparent asymptotic value of the flat part
of the rotation curve is 132 km
ysec. The mass of the galaxy
directly calculated from this velocity under the diffusion
model, as described in the next section, is 6.5 E9 solar masses,
which agrees with a luminosity estimate of 7.9 E9 times the
solar luminosity (6). This close agreement is probably fortu-
itous because it is a single value in a set that follows the
Tully–Fisher relationship as described below.
The Tully–Fisher Relationship and Galaxy Masses
Under the diffusion model, the mass of a galaxy is proportional
to the square of the rotational velocity, assuming no major
events have affected the rotation curve. Taking V
c
rotation
velocity in centimeters per second and V
k
rotation velocity in
kilometers per second, Eq. 3 gives
V
c
2
r
21
5 Gmr
22
~1 1 3.1ryp!erfc~rya~pct!
0.5
!.
[4]
In the domain where r
. 10 kpc and r , 1 Mpc, typical of
galaxies, this equation reduces to
v
c
2
5 3.1Gmyp.
[5]
Converting from cgs units to practical astronomical units, the
mass in solar mass units (M) becomes
M
5 3.73 E5 V
k
2
.
[6]
Thus, for the reference galaxy in the Tully–Fisher relationship
from Peebles (7), p49, which has a flat rotation curve with 220
km
ysec velocity, the expected mass is 1.8 E10 solar masses,
which is an acceptable value for the baryonic mass of the
reference galaxy. The Tully–Fisher relationship is as follows:
V
k
5 220~LyLref!
0.22
,
[7]
where L is luminosity of the galaxy in the 2.2-
mm band and Lref
is the luminosity for the reference galaxy. When Eqs. 6 and 7
are combined, there is an implication that the brightness of
galaxies rises as the square root of their mass (actually the 0.44
power).
Flat Rotation Curves and the ‘‘Conspiracy’’
The flat rotation curves of spiral galaxies have been measured
by optical and HI methods (e.g., see refs. 8–11) and form a
remarkable body of evidence. In general, the Doppler shift is
measured for both the receding and approaching sides of a
galaxy, and the rotation velocity is known independently of the
distance to the galaxy or its recession velocity. Thus, the
effective gravitational field holding the peripheral stars or gas
in orbit is directly calculable. A few examples are known in
which the rotational velocity may drop 20 or 30% at the limit
of measurement (12), and irregular rotation curves have been
observed (see ref. 13). Nevertheless, many examples exhibit a
flat rotation curve right to the limit of observation either by HI
or optical means of detection, and it is this frequent regularity
that will be discussed in the next three paragraphs; the
irregular examples will be dealt with later.
There has been discussion of the ‘‘conspiracy’’ that permits
the visible and dark matter to just add up to give a flat rotation
curve (see refs. 14 and 15). The striking part of the so-called
conspiracy is the way the rising part of the rotation curves
typically blend smoothly with the flat region. A direct expla-
nation of this regularity is called for, and the diffusion model
offers a simple one. As shown in Fig. 3, a smooth rise and flat
rotation curve are direct predictions of the diffusion model
because they are the result of the gravitational attraction of the
baryonic matter that makes up the visible galaxies, following
Eq. 3. In the diffusion model, the flat part of the rotation curve
results from the expectation that the gravitational field falls as
1
yr in the size range of galaxies.
In contrast, for the usual dark matter model, there is no
known underlying reason that the distribution of the dark
matter is such as to yield a smooth rising rotation curve, which
levels to the flat part of the curve. There are grounds for
believing that the initial galaxy formation would lead to a 1
yr
2
distribution of matter, that is the isothermal pattern, but there
are problems. It is not possible for the dark matter to follow
the 1
yr
2
pattern in the interior region because that would yield
a flat rotation to the very center because of the dark matter
alone. To this result would be added the gravitational effect of
the stars and gas giving a hump in the intermediate inner
regions, a pattern that is observed rarely. In fact, in making
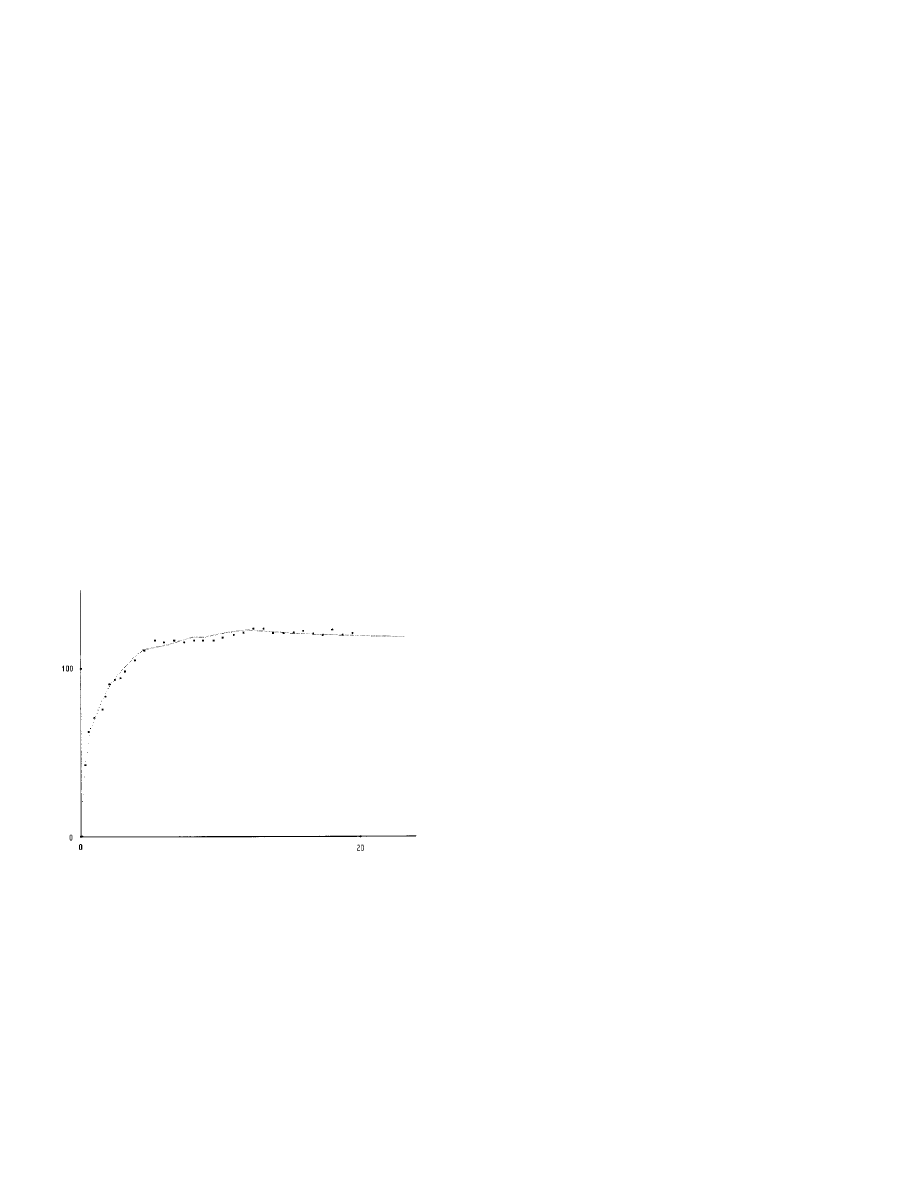
F
IG
. 3. The rotation curve of NGC 2403 derived from the diffusion
model, km
ysec vs. kpc. The squares are the observed velocities of
rotation taken from the study by Albada and Sancisi (5). The fine dots
are the calculation of the rotation curve expected from the diffusion
model. The mass distribution for stars and gas was derived from the
curve on figure 4 from the study of Albada and Sancisi (5). Mass was
added near the center for agreement with the inner part of the rotation
curve in a step that is essentially model independent. From this mass
distribution (136 values) the rotation curve was calculated step-by-
step: V(R)
5 sum (j 5 n to 136)[sqrt (m(j)yR 1 m(j)y2)], for 260
values of the radius R, the sum being taken from each mass element
or shell, outwards. This form is derived from Eq. 3 as V
2
yr 5 Gm r
22
(1
1 bryp)erfc[rya(pct)
0.5
] where the erfc term is unity at these
distances. The mean free path is taken to be 5 kpc and the constant
b
5 3.1. Figure 4 of Albada and Sancisi (5) shows a comparably good
fit to the rotation curve, which is achieved by adding in an arbitrary
curve for the mass of dark matter. Here, there is no such freedom and
the parameters are the mean free path (5 kpc) and the mass of the
galaxy NGC 2403, which, from the asymptotic value of V
5 132
km
ysec, is 6.5 E9 solar masses, which agrees with a brightness estimate
(6).
Astronomy: Britten
Proc. Natl. Acad. Sci. USA 95 (1998)
3353

models of individual galaxies, for example NGC 3198 (16) or
NGC 1560 (17), the disk and halo are adjusted in relation to
each other. There is a good deal of freedom in models ranging
from ‘‘maximum disk’’ in which there is a large empty hole in
the dark matter distribution to examples with more inner dark
matter. In all cases, there is a shortage of dark matter
corresponding to the baryonic matter. Some aspect of the
interaction between the dark matter and the baryonic matter,
during galaxy formation, leads to the smooth rise dominated
in the inner region by the baryonic matter. However, no
models of this process exist.
The process of galaxy formation is an unsolved problem, and
as yet, there are no detailed models. Thus, without clear initial
conditions, it is difficult to assess the dynamics of the galactic
dark matter. N-body calculations (see ref. 18) with an appro-
priate initial mix of baryonic matter and the unknown form of
dark matter were moderately successful, but the analysis was
considered incomplete. Blumenthal et al. (18) assumed circu-
lar orbits, and by adjusting parameters, they could achieve flat
rotation curves, although not tested over a range of radius as
broad as many galaxies show, including the HI data. However,
I am not aware of publications examining the long term
gravitational stability of the 1
yr
2
distribution of dark matter
under the Newtonian model, and there is as yet no way to deal
with the interaction of the baryonic matter (stars and gas) and
the unknown dark matter.
Deviation from Flat Rotation Curves
Quite a point has been made about deviations of some galaxies
from flat rotation curves, specifically the decreased velocity in
outer parts of the curves (12, 19). Such cases can be explained
under the diffusion model by considering collisions and tidal
interactions between galaxies. In this explanation, the excess
gravitational force is considered to be caused by a ‘‘cloud’’ of
the agent that carries gravitational force that always is diffusing
freely, although more concentrated in some regions than
others as a result of the time required for the diffusion process
and the size of the regions involved. When tidal interactions
have occurred between galaxies, some momentum could be
transferred between stars, gas, and dust that would not be
shared by the diffusing clouds, and therefore, asymmetries in
the gravitational forces would result. For example, the cloud
and galaxies could separate if the two galaxies merged because
the galaxies would share their momentum and the clouds
would remain independent and continue to diffuse. Then, new
gravitational clouds would be built slowly by diffusion from the
merged galaxy. The time required according to Eq. 3 is
'100
million years to come within 5% of the steady value for one of
the larger galaxies, at a distance of
'20 kpc. The time is greater
at a larger distance rising as the square of the distance,
following diffusion rules. The peripheral fall in some rotation
curves (12) could be due to incomplete recovery from past
collisions.
Many cases have shown lack of symmetry between the
measured rotation curves on the two sides of galaxies, and
these cases generally have been excluded from further detailed
examination. Opinions tend to favor the view that a significant
fraction of observed galaxies has undergone tidal interaction,
collisions, or mergers. In addition, very many galaxies are
members of pairs or clusters of galaxies that are held by
complex gravitational interactions. In the diffusion model, it is
assumed that the gravitational elements will diffuse freely
whereas the galaxies will follow other gravitationally deter-
mined paths. This process will result in various distortions of
the rotation curves.
Comparison with MOND
Milgrom (20) has explored a modification of Newtonian
gravity (MOND) that converts to a 1
yr law at low gravitational
fields. Although it is written in terms of acceleration, this
model uses distance, and presumably, constants could be
chosen so that the MOND formulation approximated Eq. 3 in
the region of distances
,,1 Mpc, for a particular galaxy. All
that is required to match is that the transition from 1
yr
2
to 1
yr
occurs at a similar distance. Thus, there is some similarity to
MOND even though the basis is very different from that of the
diffusion model. The constant required for matching this
model with Milgrom’s formulation would perhaps differ from
galaxy to galaxy. Some detailed comparisons could be made to
see which model gives the more acceptable fits to measure-
ments. However, there are two major differences in the
predictions of this model compared with MOND. First, there
are many galaxies in which the velocities fall at larger distances
or that show large asymmetries. As mentioned above, these
cases can be attributed to a history of collisions under the
diffusion model, and no explanation has been suggested for
MOND. Second, as the scale of clusters of galaxies exceeds
'1
Mpc, the observed mass excess does not continue to rise as
exhibited in Fig. 2. Under MOND, the excess acceleration
would continue to rise or the constant would have to be
changed in an ad hoc fashion for each of the larger clusters. Of
course, it is a major feature of this model that the limited time
in which diffusion has occurred explains the lack of continuous
increase in excess gravitational attraction for larger galactic
clusters.
Implications for Gravitational Collapse During Early
Expansion
Under the diffusion model, the excess gravitational force
initiates regional gravitational collapse at early times during
the expansion and the scale of the regions is established by the
maximum distance that gravitational diffusion reaches as the
collapse proceeds. Small scale N-body calculations have been
made, but this is an essentially unexplored area. One possible
assumption is that the mean free path early in the expansion
is the same as at present, that is
'5 kpc. If that is the case, early
expansion is accelerated, compared with inverse square, for
any degree of density variation, by the 1
yr gravitational
attraction in the appropriate range of distances. At much
larger spacings, collapse fails to occur because of limited
gravitational diffusion to such distances during the expansion.
This result suggests an explanation for the size of the largest
structures now observed (2).
General Implications
Because this model consists primarily of a proposal for a
reduced effective rate of travel of the gravitational force, due
to diffusion, it does not follow from present calculations based
on the general theory of relativity. It is not necessarily incon-
sistent with the general theory because the diffusing gravita-
tional elements might be interpreted as spatial curvature.
There are other mechanisms besides scattering that mimic
diffusion and lead to 1
yr decay with distance from a source.
This is the case for models in which local regions have to be
charged or influenced for propagation to continue. To dem-
onstrate this point, model calculations were done with
'10,000
capacitors arrayed in a cube with resistors connecting all
adjacent pairs and with peripheral elements grounded. Cur-
rent was introduced at the center, and after steady–state was
reached, the charge per capacitor fell with radius as 1
yr in the
inner half. Such a calculation carried out on a large scale with
the boundary conditions set only by dynamics likely would give
a result closely similar to the diffusion equations. A reasonable
3354
Astronomy: Britten
Proc. Natl. Acad. Sci. USA 95 (1998)

proposal is that the distortion of the metric induces distortion
in adjacent regions, and it is the continued induction of
distortion that is responsible for the propagation of the grav-
itational force. A deeper level of analysis would be required to
obtain a quantitative understanding of the effective diffusion
constant corresponding to a mean free path of
'5 kpc.
It is not possible to predict the characteristics of a gravita-
tional theory modified for propagation of gravity by diffusion
or its analog. There is much at stake because of the scale of the
intellectual investment and the subtle arguments in cosmology
making use of the general theory. Binney and Tremaine (21)
state in regard to the explanation of dark matter, ‘‘If a new
theory of gravity is required, it will ultimately be accepted
because of its beauty and unifying properties rather than
because it eliminates the need for dark matter.’’ That challenge
may not be met at this time because beauty is a subtle concept.
As for unification, it is a step to use a single, free parameter
to explain the rotation curves of galaxies, the dependence of
the gravitational excess of galaxies and galactic clusters on
their dimensions and a maximum excess attractive force. A
much bigger step toward unification would be made if it could
be shown that this model explains the control of formation of
large structures during the initial collapse and the main
features of galaxy formation. Within the large structures that
are expected to form under this model, there will exist
exaggerated density fluctuations that may contribute to galaxy
formation.
Under the diffusion model, the matter in the universe is best
estimated as the baryons that are observable directly with
methods from radio to x-rays. At present, that implies that the
amount of matter is only a few percent of what would be
required for closure under the general theory. The small
amount of matter is consistent with calculation of element
formation in the early period, and it is not likely that a change
in the propagation of gravity will affect severely that calcula-
tion.
1. Britten, R. J. (1992) Proc. Natl. Acad. Sci. USA 89, 4086–4090.
2. Geller, M. J. & Huchra, J. P. (1989) Science 246, 897–903.
3. Bahcall, N. A., Lubin, L. M. & Dorman, V. (1995) Astrophys. J.
447,
L81–L85.
4. Rubin, V. C. (1993) Proc. Natl. Acad. Sci. USA 90, 4814–4821.
5. van Albada, T. S. & Sancisi, R. (1986) Philos. Trans. R. Soc. Lond.
A 320, 447–464.
6. Begeman, K. G., Broeils, A. H. & Sanders, R. H. (1991) Mon. Not.
R. Astron. Soc. 249, 523–527.
7. Peebles, P. J. E. (1993) Principles of Physical Cosmology (Prince-
ton Univ. Press, Princeton).
8. Bosma, A. (1978) Ph.D. thesis, University of Groningen, The
Netherlands.
9. Rubin, V. C., Ford, Jr., W. K. & Thonnard, N. (1980) Astrophys.
J. 238, 471–487.
10. Rubin, V. C. (1983) Science 220, 1339–1344.
11. Kent, S. M. (1987) Astron. J. 93, 816–832.
12. Casertano, S. & van Gorkom, J. H. (1991) Astron. J. 101,
1231–1241.
13. Schommer, R. A., Bothun, G. D, Williams, T. B. & Mould, J. R.
(1993) Astron. J. 105, 97–120.
14. Sancisi, R. & van Albada, T. S. (1987) in Intl. Astron. Union Symp.
No. 117, Dark Matter in the Universe, eds., Kormendy, J. & Knapp,
G. R. (Reidel, Dordrecht, The Netherlands), pp. 67–81.
15. Ashman, K. M. (1992) Publ. Astron. Soc. Pac. 104, 1109–1138.
16. van Albada, T. S., Bahcall, J. N., Begeman, K. & Sancisi, R.
(1985) Astrophys. J. 295, 305–315.
17. Broeils, A. (1992) Astron. Astrophys. 256, 19–32.
18. Blumenthal, G. R., Faber, S. M., Flores, R. & Primack, J. R.
(1986) Astrophys. J. 301, 27–33.
19. Rubin, V. C., Burstein, D., Ford, Jr., W. K & Thonnard, N. (1985)
Astrophys. J. 289, 81–104.
20. Milgrom, M. (1983) Astrophys J. 270, 371–379.
21. Binney, J. J. & Tremaine, S. (1987) in Galactic Dynamics
(Princeton Univ. Press, Princeton).
Astronomy: Britten
Proc. Natl. Acad. Sci. USA 95 (1998)
3355
Wyszukiwarka
Podobne podstrony:
1998 Direct searches for dark matter Recent results Rosenberg
Alternity Dark Matter The Voice
2014 Cold dark matter Controversies on small scales Weinberg
White Energy from Electrons and Matter from Protons A Preliminary Model Based on Observer Physics
1965 Spherically symetric distributions of matter without pressure Omer
living without gravity
Black Holes & Gravitational Waves in String Cosmology(1998)
Martin, Woszczyk A Hybrid Model For Simulating Diffused First Reflections
A Matter of Gravity Randall Garrett
R 6 1 Obiektowy model zapytan
model relacyjny
model komunikacji dwustronnej
Wyklad V Model konkurencji niedoskonalej
Model Differences V9vsV9ElDi V975 L3 1[1] 0 050131100815
Wykład IV Model Portera
więcej podobnych podstron